Article

Diagnosing Vascular Aging Based on Macro and Micronutrients Using Ensemble Machine Learning

by
Carmen Patino-Alonso
1,2,*,
Marta Gómez-Sánchez
2,
Leticia Gómez-Sánchez
2,
Emiliano Rodríguez-Sánchez
2,3,4,5,
Cristina Agudo-Conde
2,3,5,
Luis García-Ortiz
2,3,5,6,† and
Manuel A Gómez-Marcos
2,3,4,5,†
1
Department of Statistics, University of Salamanca, Campus Miguel de Unamuno, C/Alfonso X el Sabio s/n, 37007 Salamanca, Spain
2
Primary Care Research Unit of Salamanca (APISAL), Biomedical Research Institute of Salamanca (IBSAL), Avenida de Portugal 83, 37005 Salamanca, Spain
3
Health Service of Castilla and Leon (SACyL), Avenida de Portugal 83, 37005 Salamanca, Spain
4
Department of Medicine, University of Salamanca, Calle Alfonso X el Sabio s/n, 37007 Salamanca, Spain
5
Red de Investigación en Cronicidad, Atención Primaria y Promoción de la Salud (RICAPPS) (RD21/0016), 08007 Barcelona, Spain
6
Department of Biomedical and Diagnostic Sciences, University of Salamanca, Calle Alfonso X el Sabio s/n, 37007 Salamanca, Spain
*
Author to whom correspondence should be addressed.
These authors contributed equally to this work.
Mathematics 2023, 11(7), 1645; https://doi.org/10.3390/math11071645
Submission received: 8 February 2023 / Revised: 23 March 2023 / Accepted: 27 March 2023 / Published: 29 March 2023
(This article belongs to the Special Issue Current Research in Biostatistics)

Abstract

:
The influence of dietary components on vascular dysfunction and aging is unclear. This study therefore aims to propose a model to predict the influence of macro and micronutrients on accelerated vascular aging in a Spanish population without previous cardiovascular disease. This cross-sectional study involved a total of 501 individuals aged between 35 and 75 years. Carotid-femoral pulse wave velocity (cfPWV) was measured using a Sphygmo Cor® device. Carotid intima-media thickness (IMTc) was measured using a Sonosite Micromax® ultrasound machine. The Vascular Aging Index (VAI) was estimated according to VAI = (LN (1.09) × 10 cIMT + LN (1.14) × cfPWV) 39.1 + 4.76. Vascular aging was defined considering the presence of a vascular lesion and the p75 by age and sex of VAI following two steps: Step 1: subjects were labelled as early vascular aging (EVA) if they had a peripheral arterial disease or carotid artery lesion. Step 2: they were classified as EVA if the VAI value was >p75 and as normal vascular aging (NVA) if it was ≤p75. To predict the model, we used machine learning algorithms to analyse the association between macro and micronutrients and vascular aging. In this article, we proposed the AdXGRA model, a stacked ensemble learning model for diagnosing vascular aging from macro and micronutrients. The proposed model uses four classifiers, AdaBoost (ADB), extreme gradient boosting (XGB), generalized linear model (GLM), and random forest (RF) at the first level, and then combines their predictions by using a second-level multilayer perceptron (MLP) classifier to achieve better performance. The model obtained an accuracy of 68.75% in prediction, with a sensitivity of 66.67% and a specificity of 68.79%. The seven main variables related to EVA in the proposed model were sodium, waist circumference, polyunsaturated fatty acids (PUFA), monounsaturated fatty acids (MUFA), total protein, calcium, and potassium. These results suggest that total protein, PUFA, and MUFA are the macronutrients, and calcium and potassium are the micronutrients related to EVA.

1. Introduction

The growth in life expectancy has led the WHO to promote a new concept of adding ‘life to years’ to promote better well-being and quality of life as we age [1]. In this regard, the WHO 2022 emphasized the importance of dietary patterns in healthy aging [2]. The study of foods and nutrients that contribute to improved health is thus of great importance [3,4], and an adequate diet is recognized as essential for healthy aging [5]. Macronutrients (carbohydrates, fats, proteins) are essential components in sustaining life [6], while micronutrients are essential elements in the coordination of physiological functions necessary for maintaining health [7]. Macronutrients and micronutrients play important roles in metabolism, energy production, haemoglobin synthesis, maintenance of bone mass, immunity, health, and protection against oxidative stress [8]. Thus, in recent years, several studies have highlighted the benefits that diet can have for healthy aging [3,4].
Cardiovascular diseases are among the main causes of morbidity and mortality worldwide. Arteriosclerosis is the main cause of structural changes in the arterial wall [9]. Atherosclerosis develops throughout life, starting at very early stages, and is influenced by genetic factors and external factors related to lifestyle and environment. Furthermore, the rate of development of vascular aging will depend on the exposure to different factors that damage the arterial wall and the time of exposure to these factors [10,11]. Arterial stiffness is a marker of atherosclerosis and can be considered a surrogate for cardiovascular disease [12]. Moreover, arterial stiffness is a marker conditioned by decreased elastin and increased collagen fibre content in the arterial wall [12,13]. Therefore, in contrast to classical cardiovascular risk factors that may vary throughout life, arterial stiffness integrates long-lasting effects and can be considered a biomarker [14]. Arterial stiffness, measured as carotid-femoral pulse wave velocity (cfPWV), is independent of cardiovascular events [15]. Health promotion agencies recommend diets low in saturated fat to reduce the risk of cardiovascular disease (CVD), but there is still much debate about what the most effective dietary approaches are for successful CVD prevention [16]. Although CVD events can be significantly reduced by weight loss alone, the proper proportion of macronutrients in the diet contributes to the beneficial effects of weight loss and promotes improved lipid profiles even without changing total caloric intake [17]. In recent years, several studies have suggested that diets restricting certain macronutrients may be better for controlling both weight and metabolic risk factors [18,19]. Moreover, low circulating levels of micronutrients such as magnesium and carotenoids [20], or high Na and low K [21], are known to potentially cause negative cardiovascular consequences in terms of atherosclerosis.
Arterial aging is a multifactorial process involving enzymatic, biochemical, and cellular processes in the arterial wall, which reflect biological aging [11,22,23]. Vascular aging is characterized by decreased elastin and increased collagen in large arteries [24]. This causes thickening of the arterial wall, altering the vascular structure and vascular function by increasing arterial stiffness, leading to decreased angiogenesis and decreased sensitivity to vasodilator factors, as well as increased sensitivity to vasoconstrictor factors [10,25,26] and decreased distensibility [14,23]. All this leads to a decrease in nitric oxide and endothelial dysfunction [22,24]. These changes are age-related and are accelerated in the presence of related cardiovascular diseases, cardiovascular risk factors, or unhealthy lifestyles [23,26].
Machine learning has recently grown in popularity as a research area in the field of artificial intelligence. The discipline itself, data structure of the computer, statistics, probability theory and other fields are all included in this multidisciplinary study [27]. Data mining or the Knowledge Discovery Process (KDP) and predictive analytics using machine learning methods are highly valued and practiced in real healthcare applications because they have several advantages over the traditional models, such as being non-parametric and nonlinear while being able to analyse noised and imperfect data [28]. For the study of medical data, machine learning (ML) technologies are particularly successful, and significant progress has been made in the area of diagnostic issues. ML techniques have been widely used to predict cardiovascular disease. The systematic review conducted by Li et al. [29] concluded that the convolutional neural networks were the most commonly applied model, reflecting the preference for advanced technology. Other studies have used ML algorithms to analyse cardiovascular risk factors [30,31]. However, few studies have used these techniques for the prediction or classification of vascular aging. Dall’Olio et al. [32] used ML approaches to predict healthy vascular aging using photoplethysmography measured by smartphone, which may be advantageous in finding biomarkers for healthy vascular aging prediction. In the research conducted by Hsin et al. [33], the MLP and RF algorithms were used to aid in the identification of vascular aging. However, much of the work has focused on the application of individual ML classifiers. To overcome the limitations of a single algorithm, ensemble machine learning (EML) combines several individual models to obtain better generalization performance. A specific type of EML algorithm is stacking, which can create a strong learner out of a weaker one [34].
The hypothesis of the study is that the influence of macro and micronutrients on early vascular aging (EVA) differs from one to the other. To our knowledge, we are not aware of any studies on prediction of vascular aging that employ stacked ensemble-based methods. Neither are we aware of any studies which analyse the association of vascular aging with macro and micronutrients. The aim of this study was to propose a stacking ensemble model to predict the influence of these nutrients on EVA in a Spanish population without previous cardiovascular disease.
This study is divided into four sections. Section 1 is this introductory part, Section 2 introduces the materials and methods of this study, Section 3 shows the results obtained and includes a detailed analysis using the output graphs. Finally, Section 4 shows discussions followed by a summary of the work.

2. Materials and Methods

2.1. Study Design

This cross-sectional descriptive study uses individuals recruited for the study entitled “Association between different risk factors and vascular accelerated aging (EVA study)” (NCT02623894) [35], the main objective of which was to analyse the biological and psychological factors that may influence vascular aging. This research was carried out in the field of Primary Health Care. The examinations carried out on the participants were performed at the Primary Care Research Unit of Salamanca (APISAL).

2.2. Study Population

We used random sampling with replacement stratified by age groups (35, 45, 55, 65, and 75 years) and sex, from an urban population of 43,946 people assigned to five health centres, to select 501 subjects, with 100 (50 men, 50 women) in each of the five age groups. Recruitment was carried out from June 2016 to November 2017. In this study, we analysed the data of 484 subjects who had collected the intake of macronutrients and micronutrients. All participants signed written informed consent documents prior to participation in the study.
The sample size was estimated on a 14-item Mediterranean diet adherence questionnaire between participants with and without EVA to a difference of 0.60 points. We assumed a 1:3 ratio between participants with and without EVA, accepting a risk α of 0.05 and a risk β of 0.20 in a two-sided test, with an estimated SD of 1.94 and assuming a loss rate of 10%, would require 122 in the first group and 366 in the second. Finally, 501 participants were selected.

2.3. Variables and Measuring Instruments

A detailed description of the variables collected and tests performed can be seen in the EVA study protocol [35]. The health professionals who collected the EVA study tests and questionnaires had been trained following a standardized protocol.

2.3.1. Assessment of Carotid Intima-Media Thickness

The measurement of the cIMT was performed by two researchers of proven reliability (intraclass correlation of 0.974). The device used was Sonosite Micromax® ultrasound device (Sonosite, Inc., Bothell, WA, USA), with a 5–10 MHz multi-frequency high-resolution linear transducer and with Sonocal software, (Washington, DC, USA) which automatically measures the cIMT. The cIMT measurements were performed following the protocol published by our research group [36].

2.3.2. Measurement of Arterial Stiffness

Arterial stiffness was measured by carotid femoral pulse wave velocity (cfPWV). Measurement took place in the supine position with the SphygmoCor® device (AtCor Medical Pty Ltd., Head Office, West Ryde, Australia) [37]. Carotid and femoral pulse waves were recorded by estimating the delay time compared to the ECG wave and calculating the pulse wave velocity. Distances were measured with a tape measure from the sternal notch to the point where the sensor was positioned in the carotid and femoral arteries [37].

2.3.3. Definition of Vascular Aging

Vascular aging was defined in two stages: First: Two steps were used to define EVA. Step 1: Subjects with peripheral artery disease or carotid artery injury using the criteria established in the 2018 clinical practice guidelines of the European Societies of Hypertension and Cardiology for the treatment of arterial hypertension [38] were classified as early vascular aging (EVA). Step 2: The VAI was calculated by using the formula VAI = (LN (1.09) × 10 cIMT + LN (1.14) × cfPWV) 39.1 + 4.76, as published in Nilsson et al. [39], where cfPWV is carotid-femoral pulse wave velocity and cIMT is carotid intima-media thickness. They constructed a balanced VAI from cIMT and aPWV, extracted from the hazard ratios found in meta-analyses [40,41]. Subsequently, the natural logarithms of these coefficients were used to create a linear function where the intercept of this model was of 4.76 and the coefficient was of 39. By age and sex, participants at the percentile of the combined Vascular Aging Index (VAI) were categorised; >p75 was considered early vascular aging (EVA), and <p75 was regarded as normal vascular aging (NVA).

2.3.4. Adherence to the Mediterranean Diet

The MEDAS questionnaire, validated in Spain and used in the PREDIMED study [42], was used to assess adherence to the Mediterranean diet (MD). It was administered by trained personnel and its 14 items measure the extent to which different aspects of the Mediterranean diet are followed. Scores ≥ 9 are considered good adherence.

2.3.5. Alcohol and Tobacco Use

Questionnaires were used to record smoking and drinking habits, including the type of consumption and the amounts of alcohol and tobacco used.

2.3.6. Macro and Micronutrient Intake

The EVIDENT app was developed and validated [43] by the computer company CGB and the Primary Care Research Unit of Salamanca (APISAL) (intellectual property registration number 00/2014/2207).
Participants recorded the intake of macronutrients and micronutrients using the EVIDENT app during a period of 3 days.
The macronutrients considered in the study were carbohydrates, proteins, fibre, fat, saturated fatty acids (SFA), monounsaturated fatty acids (MUFA), polyunsaturated fatty acids (PUFA).
The micronutrients analysed were calcium, potassium, magnesium, and sodium.

2.3.7. Cardiovascular Risk Factors

Anthropometric variables were collected by physical examination.
Weight: the average of two measurements made with an approved and calibrated Seca-770 scale (accuracy ± 0.1 kg), with the subject barefoot and wearing light clothing.
Height: the average of two measurements with the Seca-222 wall-mounted stadiometer, with the subject standing barefoot and with the sagittal midline coinciding with the midline of the stadiometer.
Body mass index (BMI): calculated as weight in kg/height in m2. Obesity was considered if BMI ≥ 30 [44].
Circumference waist (WC): measured at the upper edge of the iliac crest parallel to the ground, at the end of a normal expiration. Obesity was considered for values of ≥88 cm in women and ≥102 cm in men [44].

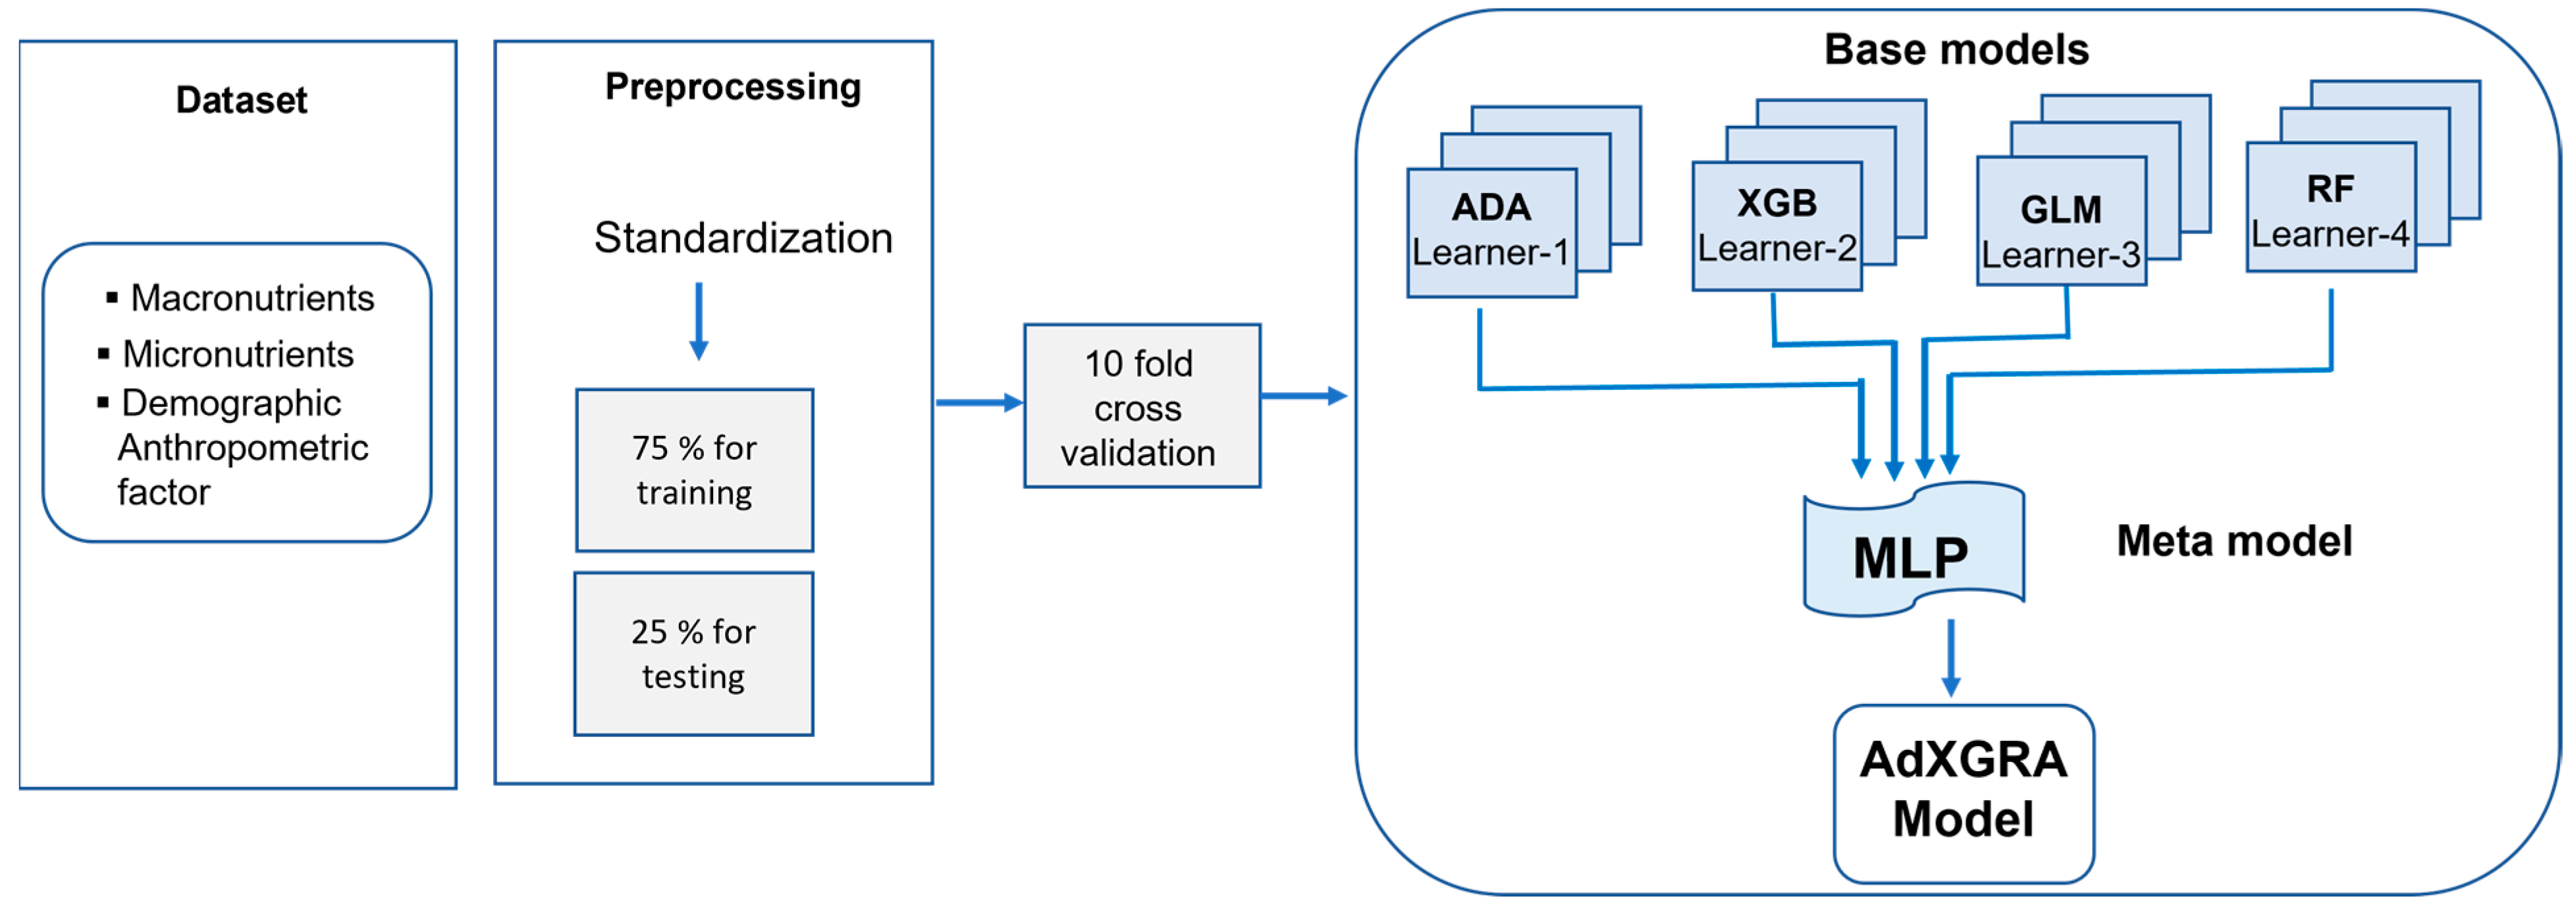
2.4. Proposed Stacked Ensemble Machine Learning Model

We propose a two-layer classification model using a stacking ensemble learning strategy. The model was adjusted by age and WC. Stacking is an ensemble machine learning paradigm that approaches several classification algorithms to produce a single model. The proposed model uses four well-known diverse classifiers, AdaBoost (ADA), extreme gradient boosting (XGB), generalized linear model (GLM), and random forest (RF), which have different architectures and learning characteristics at the first level, and this study used neuronal network (NNET) for the meta model to achieve a better performance. Stacking offers a fresh approach to ensemble learning in comparison to the two ensemble classification algorithms, bagging and boosting, by emphasizing the classifier’s deviations from the training set and subsequently learning these deviations to improve classification performance [39]. Stacking improves flexibility in combining learners that provide category output. In addition, this algorithm uses a higher-level model to combine lower-level models in order to improve performance, and it ultimately boosts the classifier’s predictive power. Additionally, this method seeks to minimize generalization errors by lowering bias and variance.

2.4.1. Feature Selection

The selection of characteristics was carried out taking into account that the factors with the greatest influence on vascular aging are age and sex. Cardiovascular risk factors affect vascular structure, assessed by the thickness of the intima-media, and vascular function, assessed by cfPWV. These criteria were used in the equation to estimate the VAI [39]. Abdominal obesity also plays an important role in aging [45,46]. Therefore, from a clinical point of view, age and waist circumference, which reflects visceral fat, where sex is already taken into account, are two clinical variables that should be considered in assessing vascular aging. In this study, we used the filtering method to find out if any of the variables had a variance of zero or close to zero. Table 1 shows the information regarding features.

2.4.2. Algorithm Flow and Data Pre-Processing

The general methodology of the study is shown in Figure 1 and includes two main steps. The first stage was data pre-processing. The dataset was further pre-processed and standardized by scaling. Data were split into training (75%) and test sets (25%) after data cleaning and feature selection parts were completed. In the second stage, after the data were pre-processed, 10-fold cross-validation of the training data was performed to avoid model overfitting. The total number of entries was divided into 10 sections, also known as folds, after reshuffling the data to avoid biased predictions [47]. Finally, the model was generated in the next step. In level-0, different base models (models 1 through model 4, called base-learners or base models) were trained using the initial training dataset, and the prediction of the response variable for the individual models was conducted in this level. In order to produce the output of the following stage (level 1) and train an ensemble function, level-0 results from many base models were integrated into a single score (meta-model).
Therefore, the procedure could be structured in the following way: 1. Using a combination of training and testing, a set of data that includes predictions of retention for a set of base learning indicators is created. 2. A meta-model exercise that makes use of the predictions made at the previous level is completed.

2.4.3. Employed Machine Learning Algorithms

In this section, the algorithms used in the study are presented.

AdaBoost

The ADB.M1 is one of the machine learning algorithms. It is an iterative algorithm which combines weak learners generated in each iteration to obtain a strong learner. Therefore, this algorithm focuses on the wrongly categorized samples, that is to say, those that have been misclassified, adjusting the distribution. The algorithm ends when it reaches the number of iterations. The ADB algorithm is described as follows:
Input. Training samples ( X 1 ,   Y 1 ) ,   ( X m ,   Y m ) , label y i   Y = 1 , 2 , , r , set the distribution on instance is S, number of iterations A, and the weak learning algorithm WeakLearn.
Initialization. For i = 1, …, A, set the weight vector W i 1 = S i , for m = 1, 2, …, A, execute the following:
Train weak learner using distribution S i .
The whole distribution H a = V a / i = 1 M V i a .
Call weak hypothesis h a and transmit the distribution H a to it.
Calculate the error rate e a = i = 1 M H i a b a x i y i
Choose a = ε a 1 ε a
Update: W i a + 1 = W i a   α a 1 b a   x i y i
Output the final hypothesis: b x = arg m a x log ( 1 / β a ) b a x = y
While it is not very susceptible to overfitting, it has the disadvantage of being sensitive to outliers, which decreases its efficiency and increases execution time.

Extreme Gradient Boosting

A more sophisticated version of the Gradient Boosting approach is the XGB algorithm. This is an ML tree boosting model proposed by Chen and Guestrin [48]. It integrates every forecast made by a group of weak learners in order to create a strong learner. The XGB is a learning framework based on Boosting Tree models. According to Pan et al. [49], the general function for the prediction is presented as follows:
f i a = m = 1 r f r a 1 + f a x i
where f a x i is the learner at step a , f i a and f i a 1 are the predictions at steps a and a 1 , and x i is the input variable.
To tackle the overfitting issue with constrained computation, the XGB model follows the expression:
O b j a = r = 1 m η ( y ¯ i ,   y i ) + m = 1 r Ω ( f i ) ,
where: η : function calculate the loss, n : total number of samples; Ω is for regularization, expressed as:
Ω   f = δ A + 1 2 λ ω 2 ,
where: λ is the regularization control parameter, ω : is the score-vectors in the leaf nodes, and Ω is the minimum loss required to further divide the leaf nodes.
XGBoost learns from RF. The main advantages are: (i) it reduces the weights of each new tree by a constant to avoid overfitting, (ii) it can be used for regression or classification, (iii) it is highly efficient, flexible and very fast, and (iv) it includes rules for handling missing values and cross-validation for optimal number of iterations. It has the disadvantage of only handling numeric features.

Generalized Linear Model

The GLM was first introduced by Nelder and Wedderbum [50]. It is an extension of regression models, called linear models, for a continuous response variable with categorical predictors and/or continuous data [51]. GLM can be defined as:
g μ = X β + e ;   e ~ N 0 , σ 2 I μ ~ N X β , σ 2 I
where X is an k × p matrix of exploratory variables or a design matrix, β is a p × 1 vector of coefficients, and g ( μ ) is the k × 1 data vector.
GLM consists of two parts: on the one hand, a link function that describes how the mean depends on the linear predictor, and on the other hand, a variance function that describes how the variance of dependent variable depends on the mean. Therefore, a GLM specifies a nonlinear link function and variance function while maintaining the simple interpretation of the linear model [52]. They have three components [53]:
  • Linear predictor. The systematic component refers the independent variables. For a parameter vector β = β 1 ,   β 2 , ,   β p and a k x p model matrix X that contains values of p independent variables for the k observations, the structure lineal is X β .
  • Random component. This specifies the response variable and its probability distribution.
  • Link function. This is a function g between random and the exploratory variables, and it is applied to each component of E μ in the following way: g E μ = X β .
It has the disadvantage that it is sensitive to outliers, and nonlinearity cannot be detected directly.

Random Forest

RF was introduced by Leo Breiman [54], inspired by the earlier work of Amit and Geman [55]. It is an extension of decision trees. Random data can be used for a categorical response called classification or a continuous response called regression. Likewise, predictor fields can be categorical or continuous. A random forest tree is a forest of trees in which many trees support decision-making in prediction h   x ,   B r , r = 1 ,   , where B s   are independent, identically distributed random vectors, and each decision tree emits a single vote for the most accepted class at input x. The working principle of the RF can be summarized as follows [56]:
  • Phase 1. r subsets of the training sample T 1 , T r 2 , …, T r , are drawn from the total training sample set T using the bootstrap sampling method. The sample size of subsets T r is the same as the total training sample set T .
  • Phase 2. r decision trees are built based on r subsets and r classification results obtained.
  • Phase 3. Each decision tree yields a single vote for the most accepted class, then optimal scores are determined.
RF builds trees independently of one another; these combine to make more accurate and robust predictions. It can be used for classification and regression models, it does not require feature normalization, and it provides methods for estimating missing values, but it is not easily interpretable.

Artificial Neural Networks

ANNs are nonlinear mathematical models inspired by natural neurons. They consist of three layers: the input, hidden, and the output layer. In many studies, this algorithm has been used due to several advantages such as adaptability and self-learning. Among the various types of ANNs that have been developed over the years, multilayer perceptrons (MLPs) are among the most commonly used. They are composed of neurons which are arranged in groups called layers and connected through weights. The input layer receives the input data from the outside, then passes it to the first hidden layer, which will forward it until it finally reaches the output layer. This process is commonly known as forward [57]. The MLP is formed by simple neurons called perceptrons. The perceptron creates a linear combination based on the weights of its inputs and then calculates a single output from those numerous inputs using a nonlinear transfer function. The input and output are directly accessible, but the hidden layer is not. Each layer consists of several neurons. Neurons are connected between the different layers by means of weights and biases. A neuron in a hidden or output layer is defined as:
n = f i = 1 t z t s t i + λ
where f is the transfer function, z t s is the weight vector, t i is the input vector, λ is the bias, and n is the output. It is assumed that the unknown function is represented by a multilayer network of sigmoidal units. The chosen logistic sigmoid transfer function may be defined as: f(x) = 1 1 + e x .
In the case of the operation of a three-layer neural network, this can be described mathematically as follows:
We are going to consider an ANN model with t input neurons x 1 , ,   x t ,   s hidden neurons w 1 , ,   w s and n output neurons y 1 , ,   y n , where t is the total number of neurons in the input layer, n is the total number of neurons in the output layer, and s is the number of neurons in the hidden layer. Thus, i, j, k are indicators representing input, hidden, and output layers. Let λ j be bias of neuron w j , and ρ k be bias for neuron y k . We consider z t s to represent the weight of the neuron link x t to neuron w s and α s n the weight of the neuron link w s to y n . The function that calculates the ANN is expressed as follows:
y n = g a j = 1 s w j α j k + ρ k
where:
w j = f a i = 1 t x i z i j + λ j
Therefore, the expression for an output value of a three-layer MLP is given by:
y s = g a α j k . f a i = 1 t x i z j i + λ j + ρ k
The learning process consists of adjusting parameters and weights through a supervised gradient descent back-propagation algorithm.
In the 1990s, Garson proposed an algorithm for calculating the relative importance of variables based on linkage weights [58]. He calculated the importance coefficient based on the product of the connection weights between the input layer neurons, the hidden layer neurons, and the output layer neurons of the neural network which is represented by the following formula:
Q i k = j = 1 s z i j α j k i = 1 t | z i j | i = 1 t j = 1 s z i j α j k i = 1 t | z i j |
where Q i k represents the relative importance of the t-th input variable with respect to the n-th output neuron.
MLPs have the advantage that they only have a few parameters so the algorithms can be easily applied, the learning process is adaptive so they can learn to find the solution directly from the modelled data, and they can represent both linear and nonlinear relationships. However, it has the drawback of the objectivity problem because the network is based on random effects and iterative calculations.

2.4.4. Scoring Metrics

The performance of each classification model is evaluated using six statistical measures: classification accuracy (A), precision (P), F1-score, recall (R), specificity (S), and Matthew’s correlation coefficient (MCC). These measurements are referred to as true positive (TP), true negative (TN), false positive (FP), and false negative (FN). These metrics are given by the equations given below.
A = T P + T N T N + T P + F P + F N
P = T P   T P + F P
R = T P   T P + F N
S = T N   T N + F P
F 1 S c o r e = 2 P R   P + R
MCC = TN . TP FN . FP TP + FP TP + FN TN + FP ( TN + FN )

2.5. Ethics Approval and Consent to Participate

The study was approved by the Drug Research Ethics Committee of the Health Area of Salamanca on 4 May 2015. All procedures performed in the study involving human participants were in accordance with the ethical standards of the institutional and/or national research committee and with the 2013 Declaration of Helsinki [59]. All participants signed written informed consent documents prior to participation in the study.

3. Results

3.1. Characteristics of the Study Population

Of the 501 subjects included in the EVA study, the 484 whose macro and micronutrients had been measured were analysed. The general characteristics of the subjects included are shown in Table 2, both globally and by degree of vascular aging. Mean age was 56 years. Of the 484 participants analysed in this study, 156 were classified as EVA, and 328 with NVA. The values for systolic blood pressure (SBP), diastolic blood pressure (DBP), high-density lipoprotein cholesterol (HDL-C), triglycerides, glycemia, HbA1c, BMI, and cardiovascular risk (CVR) score differed significantly between the two groups (p < 0.05 in all cases), with all variables presenting the highest values in subjects with EVA, except for HDL-C, which was higher in subjects with NVA. The prevalence of dyslipidemia in the NVA and EVA groups was 59.1% and 73.8%, respectively (p = 0.004). No differences were found between the two groups in lifestyles (Table 2).

3.2. Experimental Results

The proposed work mainly focuses on the ML method of stacking, which combines different machine learning classifiers in two classification steps, generating a higher predictive model performance. At base level, also called level 0, distinct base classifiers were trained with given input data set of extracted features.
Then, output predictions of base classifiers were used as the new feature representation for the meta-level classifier or level 1. Stacking helps to combine the best scenarios from the chosen classifiers. The main advantage of two-stage stacking algorithms is the use of the diverse feature of many classification algorithms.

3.2.1. Performances of the ML Models

At the base level, various classifiers fit the training data and provide predictions. For the base learners, these four classification algorithms were included in the study: ADB, RF, GLM, and RF. Because the number of base-level classifiers used affects overall performance, and by using the same dataset to train the base-level classifiers, we cross-validated the data from the training to avoid overfitting the model. The s-fold cross-validation method plays an important role in assessing the predictive ability of classifiers [60]. In s-fold cross-validation, the training data is divided into a set of s disjoint subsets of equal size. Among the s subsets, one of the subsets is used for testing and the other subsets (s-1/s) are used for training the classifiers. This process is repeated s-fold, and the s-fold results can be averaged to obtain a single estimate. This study considered a 10-fold cross-validation [61]. Due to the limited number of instances available in the dataset, cross-validation was performed to compare performance. This ensured that the algorithm overhead and variance were reduced to clearly show the performance of that particular algorithm with the extracted data set. The results are presented in Table 3. It can be seen that the RF algorithm performed best in terms of accuracy in the training phase compared to ADB, XGB and GLM. RF’s precision, specificity, recall or sensitivity, F1-score, and MCC were 17.39%, 69.60%, 42.11%, 24.62%, and 8.50%, respectively. XGB and GLM obtained the same accuracy (65.28%), but GLM obtained better specificity and recall metrics (69.70% and 50.00%, respectively).

3.2.2. Selection of Classifiers as Meta-Learners

The base classifier’s output predictions were then used as the new feature representation for the meta-level classifier. For the meta-learner level, various classifiers were tested, and their performance scores are provided in Table 4. They were ADB, RF, GLM, RF, and MLP. They were applied individually as the second level-classifiers to the base classifiers. In order to select the best model, the confusion matrices were used to measure accuracy, precision, specificity, and sensitivity. The MLP classifier was selected as the meta-model due to its adaptive learning feature which enables it to learn and be trained in real time and it is best suited for nonlinear data, making it a good fit for a classification problem with a predictor label.
In the metamodel (level 1), MLP was used as a meta classifier since it showed higher accuracy (68.80%) and specificity (68.79%). Its advantage is that the learning process is adaptive so it can learn to find the solution directly from the modelled data and can represent both linear and nonlinear relationships.

3.2.3. Comparative Analysis

Table 5 displays the performance comparison of all classifiers based on the five performance metrics, including accuracy, precision, sensitivity, specificity, F1-score, and MCC. In order to ensure a fair comparison, all the models were trained based on the same training set and tested on the same validating set. The performance of the stacking model was superior to other models in accuracy, sensitivity, and MCC. The stacked classifier model called AdXGRA outplayed the other ML classifiers with accuracy of 68.80% and sensitivity of 66.67%, and MCC of 10.86%.

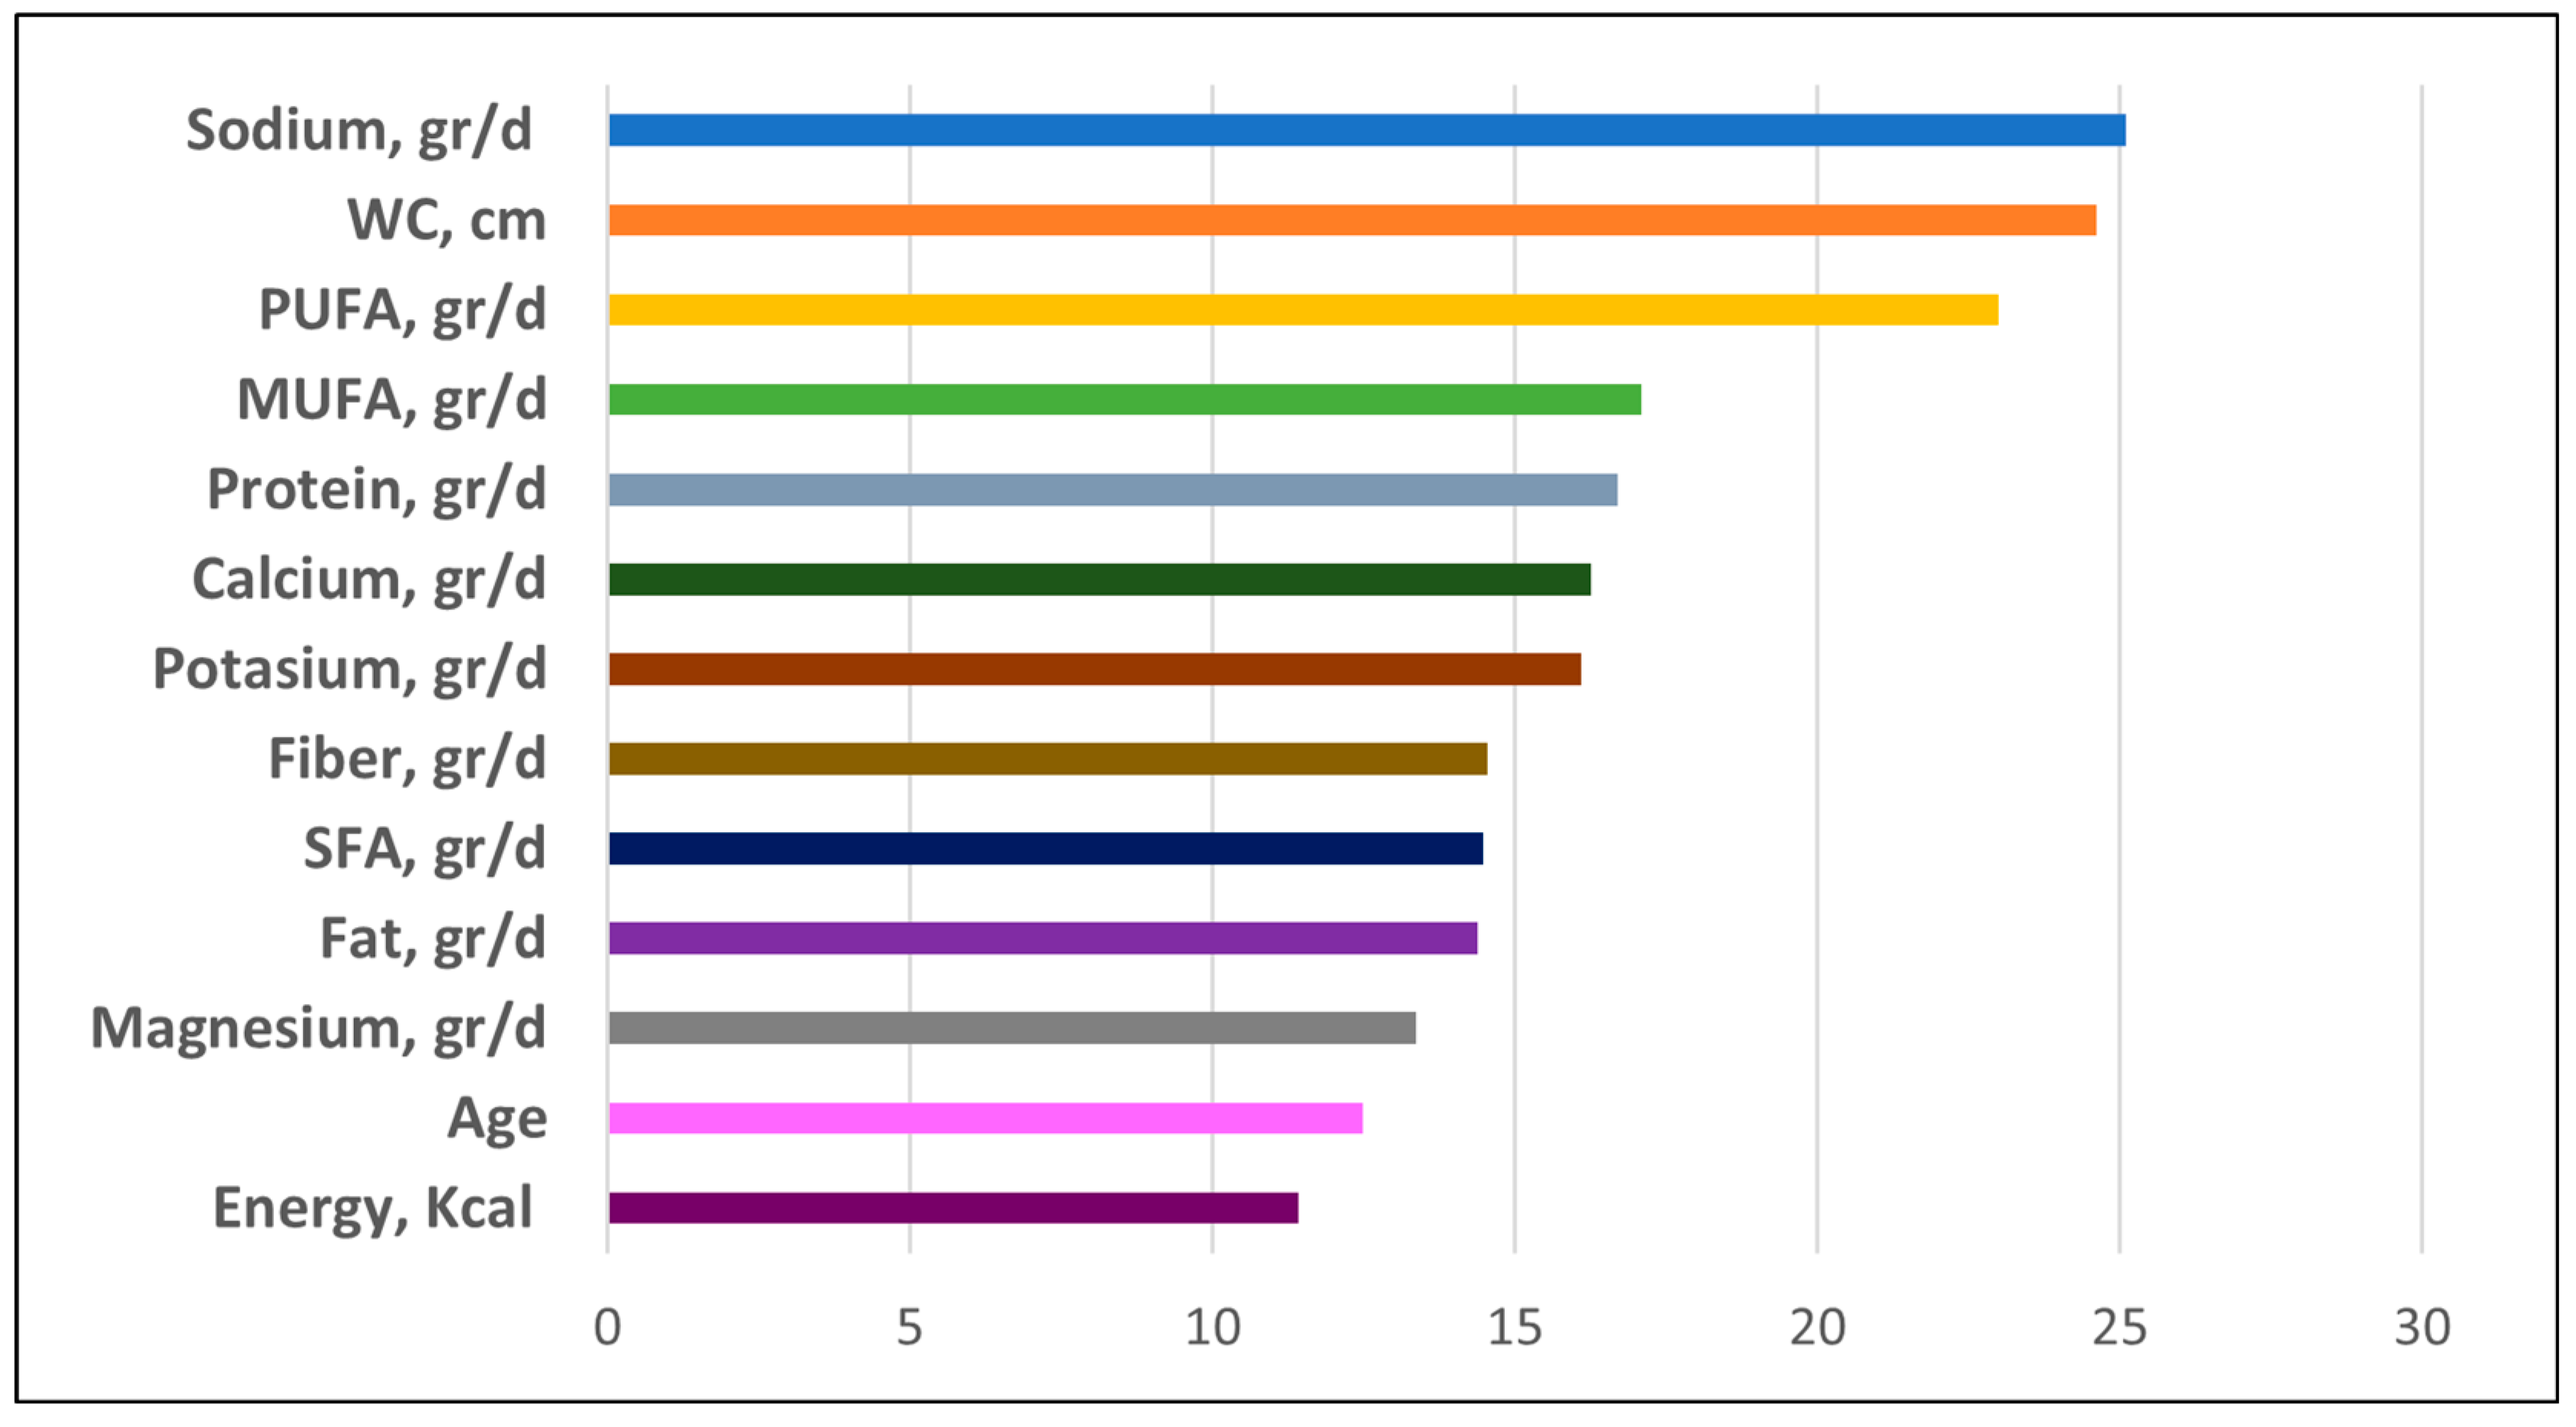
3.2.4. Importance of the Features

The clinical decisions made with the assistance of ML models in healthcare settings may affect the lives of patients. In the context of the medical field, the model’s interpretability refers to the ability of health professionals to comprehend how the model uses entry characteristics to make predictions. Feature importance estimates thus play a central role for interpretability. As specified in Section 2.4.1, 13 features were included in total. The importance for base models (ADBXGB, GLM, RF) was calculated using Garson’s weights. Figure 2 presents the feature importance of the final model. This study calculated the importance of a variable using the mean of the individual models. The model confirmed that sodium, WC, PUFA, MUFA, protein, calcium, and potassium were seven major variables related to the early vascular aging in a Caucasian population. Among them, sodium was the most important factor in the final model. Sodium increases blood pressure, which increases arterial stiffness and increases vascular aging [62].

4. Discussion

This study has identified macro and micronutrients related to EVA using a stacking ensemble machine and confirmed that sodium, WC, PUFA, MUFA, protein, calcium, and potassium were risk factors related to EVA. The proposed stacking model (AdXGRA) using MLP was compared with the single base learner such as ADB, XGB, GLM, and RF. Based on the data from Table 5, the proposed stacking was found to provide better results in terms of evaluation measures accuracy by reducing errors caused by the performance of individual learners and MCC. This finding suggests that combining different classifiers performs better than combining just one classifier. Even though random forests is one of the most effective machine learning techniques, its accuracy was optimized by having a small number of cases in our study. In addition, compared with the ADB, the proposed model reduces computational complexity. Therefore, the AdXGRA model incorporates the benefits of having a better generalization capability and improving overall prediction.
The proposed AdXGRA model achieved an average accuracy of 68.75%, obtaining a similar accuracy compared to the RF model in the study carried out by Princy et al. [63] to predict cardiac disease. However, this model offers lower results in sensitivity and specificity performance measures than the research carried out by Dall’Olio et al. [32], which investigated the possibility of using photoplethysmography measured by smartphone to predict healthy vascular aging through ML techniques, achieving a sensitivity and specificity of 87.3% and 86.3%. Along similar lines, Mohapatra et al. [47] designed a model that implemented a stacking model to predict cardiovascular disease which achieved an accuracy of 92%. As in our study, they also used the MLP classifier as a meta-learner. AIJame et al. [64] developed an algorithm called ERLX for COVID-19 diagnosis. They found accuracy of 99.88%, sensitivity of 98.72%, and specificity of 99.99%, metrics higher than those found in our investigation. We believe that by increasing the number of patients with EVA in our study, better performance could be achieved with the proposed model.
Although the association of macronutrients has been widely studied in different populations, links to vascular aging are limited. Some studies have analysed the association between nutrients and arterial stiffness in diabetic and obese subjects [65,66,67]. Our results showed that EVA participants consumed less protein per day than NVA participants. The consumption of fats, saturated, monosaturated, and polyunsaturated fatty acids, was also higher in subjects with NVA than in those with EVA. However, we observed in the multivariate models that this difference could be explained by a lower overall energy intake of EVA participants and not by any particular macronutrient. Studies of diet and CVD risk have traditionally focused on individual foods and macronutrients. However, foods are consumed in combination, not in isolation, and it may be more rational to speak of eating patterns rather than isolated components [68].
In line with our results, Zhu et al. [69] found no association between the intake of total fats, monounsaturated fatty acids, saturated fatty acids and polyunsaturated fatty acids with the risk of cardiovascular diseases. However, in an investigation carried out on 17 population samples in four countries (China, Japan, United Kingdom, and USA), Shay et al. [70] concluded that lower energy intake and differential intake of multiple nutrients and specific foods is characteristic of individuals with a low risk of developing CVD. In their study, Ge et al. [19] found that macronutrient diets lead to modest weight loss and substantial improvements in cardiovascular risk factors over a six-month period. However, at 12 months, these effects largely disappear.
There are numerous studies analysing the relationship of macronutrients with various factors. Santiago et al. [71] evaluated the relationship between the quality of macronutrients and all-cause mortality in a Spanish sample of 22,894 participants in the SUN study (University of Navarra Follow-Up) without finding any statistical association between the two. Only higher carbohydrate quality was associated with lower mortality. In their study, Mizgier et al. [72] investigated whether certain macronutrient intakes in girls with polycystic ovary syndrome could be associated with the disorder. To this end, they recruited 59 girls aged 14 to 18 years using convenience sampling methods among patients of the Medical Clinic of Gynaecology and Perinatology of the Hospital of Gynaecology and Obstetrics of Poznan University. They divided the sample into two groups (an overweight group and a normal weight group), assessing nutrition using a three-day food record. Their findings showed inflammation and oxidative stress to be higher in obese girls with reduced intake of plant protein and low carbohydrates in the diet. Decreased fibre intake and total protein intake also increased inflammation. In our study, higher protein intake was associated with healthy vascular aging. These discrepancies may be due to the different health problems of the study participants and the origins of the study populations. These results are not in line with the results of Senior et al. [73], who concluded that macronutrient intakes are predictors of lifespan and age-adjusted mortality patterns.
A meta-analysis and systematic review carried out by Doggui et al. [74], involving a systematic search from January 2012 to September 2020, reported daily nutrient intake levels and their suitability compared to the daily reference intake of the Institute of Medicine in the Eastern Mediterranean Region. They found that intakes of vitamin D, calcium, potassium, zinc, and magnesium were below recommended levels, concluding that the region was undergoing a nutritional transition chaSracterized by the appearance of overnutrition and micronutrient deficiencies. These results are in line with our research, showing that recommended Dietary Reference Intake levels are not observed by the total population nor by patients with healthy or accelerated vascular aging [75].
This research has several limitations. First of all, the study is cross-sectional in nature, making it difficult to establish causal relationships between macro and micronutrient levels and vascular aging. Second, there may be confounding vSariables that were not taken into account in the study. Third, macro and micronutrient intakes were recorded for a short period only (three days) and it cannot be ruled out that these intakes are inadequate if considered in the long term. Furthermore, the number of subjects presenting EVA is small.
The main contributions of this study are: to our knowledge, it is the first study carried out in a sample of the Spanish adult population without previous cardiovascular disease that analyses the relationship between macronutrient and micronutrient intake and EVA. In addition, the definition of vascular aging uses a little-known criterion that combines structural parameters such as carotid artery cIMT and vascular function parameters such as cfPWV. In addition, it creates a new model which is an ensemble learning model that will need to be evaluated in future research to confirm its clinical utility, as well as the role that micronutrients and macronutrients play in EVA. Likewise, as new lines of future research, we propose to carry out the study in larger samples, taking into account different age groups.

5. Conclusions

In this study, we developed a stacking ensemble learning model called AdXGRA to predict the influence of macronutrients and micronutrients on accelerated vascular aging. This model employed two levels of classifiers. The prediction from the base level classifiers, which were ADB, XGB, GLM, and RF, was fed to the meta-model classifier (MLP) to increase the prediction of the influence of macronutrients and micronutrients on EVA. The stacking ensemble model achieved a performance with overall accuracy of 68.80%, sensitivity of 66.67%, specificity of 68.79%, and an F1 score of 68.80%. The results of this study imply that it would be necessary to continuously evaluate risk factors such as sodium, WC, PUFA, MUFA, protein, calcium, and potassium for detecting early vascular aging. It is difficult for patients to recognize the symptoms because these symptoms are mild. Therefore, the stack model developed in this study can be usefully applied to prevent early vascular aging.

Author Contributions

C.P.-A., M.A.G.-M. and L.G.-O. contributed substantially to the conception and design of the study; C.P.-A. contributed to the writing of the article M.G.-S., L.G.-S., C.A.-C. and E.R.-S. were responsible for the collection and assembly of the data; C.P.-A., M.A.G.-M. and L.G.-O. contributed to the analysis and interpretation of the data; and M.A.G.-M. was responsible for the acquisition of funds. All authors have read and agreed to the published version of the manuscript.

Funding

This study has been funded by the Spanish Ministry of Science and Innovation, Instituto de Salud Carlos III (ISCIII). RD21/0016/0010 (Network for Research on Chronicity, Primary Care, and Health Promotion (RICAPPS) is funded by the European Union-Next Generation EU, Facility for Recovery and Resilience (MRR) and PI21/00454 is co funded by the European Union. Government of Castilla y León also collaborated with the funding of this study through the research projects (GRS 1193/B/15, GRS 1821/B/18, GRS 1943/B/19). They played no role in the study design, data analysis, reporting results, nor the decision to submit the manuscript for publication.

Institutional Review Board Statement

The Drug Research Ethics Committee of Salamanca approved this study on 4 May 2015. All procedures were performed according to the ethical standards of the mentioned committee and in compliance with the 2013 Declaration of Helsinki. The participants signed a written informed consent document before they were included. The study was registered in ClinicalTrials.gov (number: NCT02623894).

Informed Consent Statement

The Drug Research Ethics Committee of Salamanca approved this study on 4 May 2015. All procedures were conducted according to the ethical standards of the mentioned committee and in compliance with the 2013 Declaration of Helsinki. The participants signed a written informed consent document before being included in the study.

Data Availability Statement

The datasets used and/or analysed during the present study are available upon reasonable request to the corresponding author.

Conflicts of Interest

The authors declare that they have no known competing financial interests or personal relationships that could have influenced the work reported in this paper.

References

  1. Rudnicka, E.; Napierała, P.; Podfigurna, A.; Męczekalski, B.; Smolarczyk, R.; Grymowicz, M. The World Health Organization (WHO) approach to healthy ageing. Maturitas 2020, 139, 6–11. [Google Scholar] [CrossRef]
  2. Amuthavalli Thiyagarajan, J.; Mikton, C.; Harwood, R.H.; Gichu, M.; Gaigbe-Togbe, V.; Jhamba, T.; Pokorna, D.; Stoevska, V.; Hada, R.; Steffan, G.S.; et al. The UN Decade of healthy ageing: Strengthening measurement for monitoring health and wellbeing of older people. Age Ageing 2022, 51, afac147. [Google Scholar] [CrossRef]
  3. Kehoe, L.; Walton, J.; Flynn, A. Nutritional challenges for older adults in Europe: Current status and future directions. Proc. Nutr. Soc. 2019, 78, 221–233. [Google Scholar] [CrossRef]
  4. Clegg, M.E.; Methven, L.; Lanham-New, S.A.; Green, M.A.; Duggal, N.A.; Hetherington, M.M. The Food4Years Ageing Network: Improving foods and diets as a strategy for supporting quality of life, independence and healthspan in older adults. Nutr. Bull. 2023, 48, 124–133. [Google Scholar] [CrossRef] [PubMed]
  5. Dorrington, N.; Fallaize, R.; Hobbs, D.A.; Weech, M.; Lovegrove, J.A. A Review of Nutritional Requirements of Adults Aged ≥65 Years in the UK. J. Nutr. 2020, 150, 2245–2256. [Google Scholar] [CrossRef] [PubMed]
  6. Venn, B.J. Macronutrients and human health for the 21st century. Nutrients 2020, 12, 2363. [Google Scholar] [CrossRef]
  7. Godswill, A.G.; Somtochukwu, I.V.; Ikechukwu, A.O.; Kate, E.C. Health Benefits of Micronutrients (Vitamins and Minerals) and their Associated Deficiency Diseases: A Systematic Review. Int. J. Food Sci. 2020, 3, 1–32. [Google Scholar] [CrossRef]
  8. Papadopoulou, S.K. Rehabilitation nutrition for injury recovery of athletes: The role of macronutrient intake. Nutrients 2020, 12, 2449. [Google Scholar] [CrossRef] [PubMed]
  9. Groenewegen, K.; den Ruijter, H.; Pasterkamp, G.; Polak, J.; Bots, M.; Peters, S.A. Vascular age to determine cardiovascular disease risk: A systematic review of its concepts, definitions, and clinical applications. Eur. J. Prev. Cardiol. 2016, 23, 264–274. [Google Scholar] [CrossRef]
  10. Nowak, K.L.; Rossman, M.J.; Chonchol, M.; Seals, D.R. Strategies for achieving healthy vascular aging. Hypertension 2018, 71, 389–402. [Google Scholar] [CrossRef] [Green Version]
  11. Laurent, S.; Boutouyrie, P.; Cunha, P.G.; Lacolley, P.; Nilsson, P.M. Concept of extremes in vascular aging: From early vascular aging to supernormal vascular aging. Am. Heart Assoc. 2019, 74, 218–228. [Google Scholar] [CrossRef] [PubMed]
  12. Elosua-Bayés, M.; Martí-Lluch, R.; García-Gil, M.d.M.; Camós, L.; Comas-Cufí, M.; Blanch, J.; Ponjoan, A.; Alves-Cabratosa, L.; Elosua, R.; Grau, M.; et al. Association of Classic Cardiovascular Risk Factors and Lifestyles With the Cardio-ankle Vascular Index in a General Mediterranean Population. Rev. Española De Cardiol. 2018, 71, 458–465. [Google Scholar] [CrossRef]
  13. Laurent, S.; Marais, L.; Boutouyrie, P. The Noninvasive Assessment of Vascular Aging. Can. J. Cardiol. 2016, 32, 669–679. [Google Scholar] [CrossRef] [PubMed]
  14. Laurent, S. Defining vascular aging and cardiovascular risk. J. Hypertens. 2012, 30, S3–S8. [Google Scholar] [CrossRef]
  15. Ben-Shlomo, Y.; Spear, M.; Boustred, C.; May, M.; Anderson, S.G.; Benjamin, E.J.; Boutouyrie, P.; Cameron, J.; Chen, C.-H.; Cruickshank, J.K.; et al. Aortic pulse wave velocity improves cardiovascular event prediction: An indi-vidual participant meta-analysis of prospective observational data from 17,635 subjects. J. Am. Coll. Cardiol. 2014, 63, 636–646. [Google Scholar] [CrossRef]
  16. Nestel, P.J.; Beilin, L.J.; Mori, T.A. Changing dietary approaches to prevent cardiovascular disease. Curr. Opin. Lipidol. 2020, 31, 313–323. [Google Scholar] [CrossRef] [PubMed]
  17. Daoud, E.; Scheede-Bergdahl, C.; Bergdahl, A. Effects of dietary macronutrients on plasma lipid levels and the consequence for cardiovascular disease. J. Cardiovasc. Dev. Dis. 2014, 1, 201–213. [Google Scholar] [CrossRef] [Green Version]
  18. Ho, F.K.; Gray, S.R.; Welsh, P.; Petermann-Rocha, F.; Foster, H.; Waddell, H.; Anderson, J.; Lyall, D.; Sattar, N.; Gill, J.M.R.; et al. Associations of fat and carbohydrate intake with cardiovascular disease and mortality: Prospective cohort study of UK Biobank participants. BMJ 2020, 368, m688. [Google Scholar] [CrossRef] [Green Version]
  19. Ge, L.; Sadeghirad, B.; Ball, G.D.C.; Da Costa, B.R.; Hitchcock, C.L.; Svendrovski, A.; Kiflen, R.; Quadri, K.; Kwon, H.Y.; Karamouzian, M.; et al. Comparison of dietary macronutrient patterns of 14 popular named dietary programmes for weight and cardiovascular risk factor reduction in adults: Systematic review and network meta-analysis of randomised trials. BMJ 2020, 369, m696. [Google Scholar] [CrossRef] [Green Version]
  20. Hosseini, B.; Saedisomeolia, A.; Skilton, M.R. Association between Micronutrients Intake/Status and Carotid Intima Media Thickness: A Systematic Review. J. Acad. Nutr. Diet. 2017, 117, 69–82. [Google Scholar] [CrossRef]
  21. Mazza, E.; Ferro, Y.; Lamprinoudi, T.; Gazzaruso, C.; Doldo, P. Relationship between high sodium and low PUFA intake and carotid atherosclerosis in elderly women. Exp. Gerontol. 2018, 108, 256–261. [Google Scholar] [CrossRef] [PubMed]
  22. Maloberti, A.; Vallerio, P.; Triglione, N.; Occhi, L.; Panzeri, F.; Bassi, I.; Pansera, F.; Piccinelli, E.; Peretti, A.; Garatti, L.; et al. Vascular Aging and Disease of the Large Vessels: Role of Inflammation. High Blood Press. Cardiovasc. Prev. 2019, 26, 175–182. [Google Scholar] [CrossRef]
  23. Cunha, P.G.; Boutouyrie, P.; Nilsson, P.M.; Laurent, S. Early Vascular Ageing (EVA): Definitions and Clinical Applicability. Curr. Hypertens. Rev. 2017, 13, 8–15. [Google Scholar] [CrossRef] [PubMed]
  24. Laurent, S.; Briet, M.; Boutouyrie, P. Arterial Stiffness as Surrogate End Point. Hypertension 2012, 60, 518–522. [Google Scholar] [CrossRef] [PubMed]
  25. Laurent, S.; Boutouyrie, P.; Cunha, P.G.; Lacolley, P.; Nilsson, P.M. Concept of Extremes in Vascular Aging. Hypertension 2019, 74, 218–228. [Google Scholar] [CrossRef] [PubMed]
  26. Zhang, C.; Tao, J. Expert consensus on clinical assessment and intervention of vascular aging in China (2018). Aging Med. 2018, 1, 228–237. [Google Scholar] [CrossRef] [PubMed] [Green Version]
  27. Xu, P. Review on Studies of Machine Learning Algorithms. J. Phys. Conf. Ser. 2019, 1187, 052103. [Google Scholar] [CrossRef]
  28. Mitchell, T.M. Machine Learning, 1st ed.; McGraw-Hill, Inc.: New York, NY, USA, 1997. [Google Scholar]
  29. Li, B.; Feridooni, T.; Cuen-Ojeda, C.; Kishibe, T.; de Mestral, C.; Mamdani, M.; Al-Omran, M. Machine learning in vascular surgery: A systematic review and critical appraisal. Npj Digit. Med. 2022, 5, 7. [Google Scholar] [CrossRef]
  30. Alqahtani, A.; Alsubai, S.; Sha, M.; Vilcekova, L.; Javed, T. Cardiovascular Disease Detection using Ensemble Learning. Comput. Intell. Neurosci. 2022, 2022, 5267498. [Google Scholar] [CrossRef] [PubMed]
  31. Poplin, R.; Varadarajan, A.V.; Blumer, K.; Liu, Y.; McConnell, M.V.; Corrado, G.S.; Peng, L.; Webster, D.R. Prediction of cardiovascular risk factors from retinal fundus photographs via deep learning. Nat. Biomed. Eng. 2018, 2, 158–164. [Google Scholar] [CrossRef] [Green Version]
  32. Dall’Olio, L.; Curti, N.; Remondini, D.; Safi Harb, Y.; Asselbergs, F.W.; Castellani, G.; Uh, H.-W. Prediction of vascular aging based on smartphone acquired PPG signals. Sci. Rep. 2020, 10, 19756. [Google Scholar] [CrossRef]
  33. Hsiu, H.; Liu, J.-C.; Yang, C.-J.; Chen, H.-S.; Wu, M.-S.; Hao, W.-R.; Lee, K.-Y.; Hu, C.-J.; Wang, Y.-H.; Fang, Y.-A. Discrimination of vascular aging using the arterial pulse spectrum and machine-learning analysis. Microvasc. Res. 2022, 139, 104240. [Google Scholar] [CrossRef]
  34. Wolpert, D.H. Stacked generalization. Neural Netw. 1992, 5, 241–259. [Google Scholar] [CrossRef]
  35. Gomez-Marcos, M.A.; Martinez-Salgado, C.; Gonzalez-Sarmiento, R.; Hernandez-Rivas, J.M.; Sanchez-Fernandez, P.L.; Recio-Rodriguez, J.I.; Rodriguez-Sanchez, E.; García-Ortiz, L. Association between different risk factors and vascular accelerated ageing (EVA study): Study protocol for a cross-sectional, descriptive observational study. BMJ Open 2016, 6, e011031. [Google Scholar] [CrossRef] [PubMed]
  36. Gómez-Marcos, M.A.; Recio-Rodríguez, J.I.; Patino-Alonso, M.C.; Agudo-Conde, C.; Gómez-Sanchez, L.; Gómez-Sanchez, M.; Rodríguez-Sánchez, E.; García-Ortiz, L. Protocol for measuring carotid intima-media thickness that best correlates with cardiovascular risk and target organ damage. Am. J. Hypertens. 2012, 25, 955–961. [Google Scholar] [CrossRef] [Green Version]
  37. Van Bortel, L.M.; Laurent, S.; Boutouyrie, P.; Chowienczyk, P.; Cruickshank, J.K.; De Backer, T.; Filipovsky, J.; Huybrechts, S.; Mattace-Raso, F.U.S.; Protogerou, A.D.; et al. Expert consensus document on the measurement of aortic stiffness in daily practice using carotid-femoral pulse wave velocity. J. Hypertens. 2012, 30, 445–448. [Google Scholar] [CrossRef] [Green Version]
  38. Brya, W.; Giuseppe, M.; Wilko, S.; Enrico, A.R.; Michel, A.; Michel, B.; Denis, L.C.; Antonio, C.; de Giovanni, S.; Anna, D.; et al. 2018 ESC/ESH Guidelines for the management of arterial hypertension. Eur. Heart J. 2018, 39, 3021–3104. [Google Scholar]
  39. Nilsson Wadström, B.; Fatehali, A.H.; Engström, G.; Nilsson, P.M. A Vascular Aging Index as Independent Predictor of Cardiovascular Events and Total Mortality in an Elderly Urban Population. Angiology 2019, 70, 929–937. [Google Scholar] [CrossRef]
  40. Den Ruijter, H.M.; Peters, S.A.E.; Anderson, T.J.; Britton, A.R.; Dekker, J.M.; Eijkemans, M.J.; Engström, G.; Evans, G.W.; de Graaf, J.; Grobbee, D.E.; et al. Common Carotid Intima-Media Thickness Measurements in Cardiovascular Risk Prediction. JAMA 2012, 308, 796. [Google Scholar] [CrossRef] [PubMed] [Green Version]
  41. Zhong, Q.; Hu, M.-J.; Cui, Y.-J.; Liang, L.; Zhou, M.-M.; Yang, Y.-W.; Huang, F. Carotid–Femoral Pulse Wave Velocity in the Prediction of Cardiovascular Events and Mortality: An Updated Systematic Review and Meta-Analysis. Angiology 2018, 69, 617–629. [Google Scholar] [CrossRef]
  42. Schröder, H.; Fitó, M.; Estruch, R.; Martínez-González, M.A.; Corella, D.; Salas-Salvadó, J.; Lamuela-Raventós, R.; Ros, E.; Salaverría, I.; Fiol, M.; et al. A Short Screener Is Valid for Assessing Mediterranean Diet Adherence among Older Spanish Men and Women. J. Nutr. 2011, 141, 1140–1145. [Google Scholar] [CrossRef] [Green Version]
  43. Recio-Rodriguez, J.I.; Rodriguez-Martin, C.; Gonzalez-Sanchez, J.; Rodriguez-Sanchez, E.; Martin-Borras, C.; Martínez-Vizcaino, V.; Maria Soledad, A.; Olga, M.G.; Carmen, F.A.; Maderuelo-Fernandez, J.A.; et al. EVIDENT smartphone app, a new method for the dietary record: Comparison with a food frequency questionnaire. JMIR Mhealth Uhealth 2019, 7, e11463. [Google Scholar] [CrossRef]
  44. Salas-Salvadó, J.; Rubio Hererra, M.A.; Barbany, M.; Moreno, B. Consensus for the evaluation of overweight and obesity and the establishment of therapeutic intervention criteria. Med. Clínica 2007, 128, 184–196. [Google Scholar] [CrossRef] [PubMed]
  45. Moreau, K.L.; Babcock, M.C.; Hildreth, K.L. Sex differences in vascular aging in response to testosterone. Biol. Sex Differ. 2020, 11, 18. [Google Scholar] [CrossRef] [PubMed] [Green Version]
  46. Benjamin, E.J.; Muntner, P.; Alonso, A.; Bittencourt, M.S.; Callaway, C.W.; Carson, A.P.; Chamberlain, A.M.; Chang, A.R.; Cheng, S.; Das, S.R.; et al. Heart Disease and Stroke Statistics—2019 Update: A Report From the American Heart Association. Circulation 2019, 139, e56–e528. [Google Scholar] [CrossRef]
  47. Mohapatra, S.; Maneesha, S.; Mohanty, S.; Patra, P.K.; Bhoi, S.K.; Sahoo, K.S.; Gandomi, A.H. A stacking classifiers model for detecting heart irregularities and predicting Cardiovascular Disease. Healthc. Anal. 2023, 3, 100133. [Google Scholar] [CrossRef]
  48. Chen, T.; Guestrin, C. XGBoost. In Proceedings of the 22nd ACM SIGKDD International Conference on Knowledge Discovery and Data Mining, San Francisco, CA, USA, 13–17 August 2016; ACM: New York, NY, USA, 2016; pp. 785–794. [Google Scholar]
  49. Pan, C.; Poddar, A.; Mukherjee, R.; Ray, A.K. Impact of categorical and numerical features in ensemble machine learning frameworks for heart disease prediction. Biomed. Signal Process. Control 2022, 76, 103666. [Google Scholar] [CrossRef]
  50. Nelder, J.; Wedderburn, R. Generalized linear models. J. R. Stat. Soc. 1972, 135, 370. [Google Scholar] [CrossRef]
  51. McCullagh, P. Generalized linear-models. Eur. J. Oper. Res. 1984, 16, 285–292. [Google Scholar] [CrossRef]
  52. Patino-Alonso, M.C.; Molina, J.L.; Zazo, S. Multivariate linear modeling for the application in the field of hydrological engineering. In Handbook of Hydroinformatics; Elsevier: Amsterdam, The Netherlands, 2023; pp. 277–289. [Google Scholar]
  53. Agresti, A. Foundations of Linear and Generalized Linear Models; John Wiley & Sons: Hoboken, NJ, USA, 2015; ISBN 978-1-118-73003-4. [Google Scholar]
  54. Breiman, L. Random forests. Mach. Learn. 2001, 45, 1545–1588. [Google Scholar]
  55. Amit, Y.; Geman, D. Shape quantization and recognition with randomized trees. Neural Comput. 1997, 9, 1545–1588. [Google Scholar] [CrossRef] [Green Version]
  56. Wang, Z.; Lai, C.; Chen, X.; Yang, B.; Zhao, S.; Bai, X. Flood hazard risk assessment model based on random forest. J. Hydrol. 2015, 527, 1130–1141. [Google Scholar] [CrossRef]
  57. Widiasari, I.R.; Nugroho, L.E. Widyawan Deep learning multilayer perceptron (MLP) for flood prediction model using wireless sensor network based hydrology time series data mining. In Proceedings of the 2017 International Conference on Innovative and Creative Information Technology (ICITech), Salatiga, Indonesia, 2–4 November 2017; pp. 1–5. [Google Scholar]
  58. Garson, G.D. Interpreting neural network connection weights. Artificial Intelligence Expert. Artif. Intell. Expert 1991, 6, 6–51. [Google Scholar]
  59. Association, W.M. World Medical Association Declaration of Helsinki: Ethical Principles for Medical Research Involving Human Subjects. JAMA 2013, 310, 2191–2194. [Google Scholar]
  60. Bishop, C.M. Pattern Recognition and Machine Learnin; Springer Science+Business Media: Berlin/Heidelberg, Germany, 2010. [Google Scholar]
  61. Radhakrishnan, P.; Ramaiyan, K.; Vinayagam, A.; Veerasamy, V. A stacking ensemble classification model for detection and classification of power quality disturbances in PV integrated power network. Measurement 2021, 175, 109025. [Google Scholar] [CrossRef]
  62. Juraschek, S.P.; Miller, E.R.; Weaver, C.M.; Appel, L.J. Effects of Sodium Reduction and the DASH Diet in Relation to Baseline Blood Pressure. J. Am. Coll. Cardiol. 2017, 70, 2841–2848. [Google Scholar] [CrossRef]
  63. Princy, R.J.P.; Parthasarathy, S.; Hency Jose, P.S.; Raj Lakshminarayanan, A.; Jeganathan, S. Prediction of Cardiac Disease using Supervised Machine Learning Algorithms. In Proceedings of the 2020 4th International Conference on Intelligent Computing and Control Systems (ICICCS), Madurai, India, 13–15 May 2020; pp. 570–575. [Google Scholar]
  64. AlJame, M.; Ahmad, I.; Imtiaz, A.; Mohammed, A. Ensemble learning model for diagnosing COVID-19 from routine blood tests. Inform. Med. 2020, 21, 100449. [Google Scholar] [CrossRef] [PubMed]
  65. Ahola, A.J.; Gordin, D.; Forsblom, C.; Groop, P.H.; FinnDiane Study Group. Association between diet and measures of arterial stiffness in type 1 diabetes–Focus on dietary patterns and macronutrient substitutions. Elsevier 2018, 28, 1166–1172. [Google Scholar] [CrossRef] [Green Version]
  66. Di Pino, A.; Currenti, W.; Urbano, F.; Scicali, R.; Piro, S.; Purrello, F.; Rabuazzo, A.M. High intake of dietary advanced glycation end-products is associated with increased arterial stiffness and inflammation in subjects with type 2 diabetes. Nutr. Metab. Cardiovasc. Dis. 2017, 27, 978–984. [Google Scholar] [CrossRef]
  67. Firouzi, S.; Rezvani, R.; Pahlavani, N.; Jarahi, L.; Navashenaq, J.G.; Ranjbar, G.; Malekahmadi, M.; Taherzadeh, Z.; Safarian, M. Postprandial effects of macronutrient composition meals on the metabolic responses and arterial stiffness indices of lean and obese male adults: A protocol of a pilot study. Pilot Feasibility Stud. 2021, 7, 41. [Google Scholar] [CrossRef]
  68. Brandhorst, S.; Longo, V.D. Dietary Restrictions and Nutrition in the Prevention and Treatment of Cardiovascular Disease. Circ. Res. 2019, 124, 952–965. [Google Scholar] [CrossRef]
  69. Zhu, Y.; Bo, Y.; Liu, Y. Dietary total fat, fatty acids intake, and risk of cardiovascular disease: A dose-response meta-analysis of cohort studies. Lipids Health Dis. 2019, 18, 91. [Google Scholar] [CrossRef] [PubMed] [Green Version]
  70. Shay, C.M.; Stamler, J.; Dyer, A.R.; Brown, I.J.; Chan, Q.; Elliott, P.; Zhao, L.; Okuda, N.; Miura, K.; Daviglus, M.L.; et al. Nutrient and food intakes of middle-aged adults at low risk of cardiovascular disease: The international study of macro-/micronutrients and blood pressure (INTERMAP). Eur. J. Nutr. 2012, 51, 917–926. [Google Scholar] [CrossRef] [PubMed] [Green Version]
  71. Santiago, S.; Zazpe, I.; Fernandez-lazaro, C.I.; De, V.O.; Bes-rastrollo, M.; Miguel, Á. Macronutrient Quality and All-Cause Mortality in the SUN Cohort. Nutrients 2021, 13, 972. [Google Scholar] [CrossRef]
  72. Mizgier, M.; Jarząbek-Bielecka, G.; Wendland, N.; Jodłowska-Siewert, E.; Nowicki, M.; Alicja, B.; Witold, K.; Dorota, F.; Opydo-Szymaczek, J. Relation between Inflammation, Oxidative Stress, and Macronutrient Intakes in Normal and Excessive Body Weight Adolescent Girls with Clinical Features of Polycystic Ovary Syndrome. Nutrients 2021, 13, 896. [Google Scholar] [CrossRef] [PubMed]
  73. Senior, A.M.; Nakagawa, S.; Raubenheimer, D.; Simpson, S.J. Global associations between macronutrient supply and age-specific mortality. Proc. Natl. Acad. Sci. USA 2020, 117, 30824–30835. [Google Scholar] [CrossRef] [PubMed]
  74. Doggui, R.; Al-jawaldeh, H.; El Ati, J.; Barham, R.; Nasreddine, L.; Alqaoud, N.; Aguenaou, H.; Ammari, L.E.; Jabbour, J.; Al-jawaldeh, A. Meta-Analysis and Systematic Review of Micro- and Macro-Nutrient Intakes and Trajectories of Macro-Nutrient Supply in the Eastern Mediterranean Region. Nutrients 2021, 13, 1515. [Google Scholar] [CrossRef] [PubMed]
  75. International Organization for Migration. Nutrient Recommendations: Dietary Reference Intakes. Available online: https://ods.od.nih.gov/Health_Information/Dietary_Reference_Intakes.aspx (accessed on 28 February 2022).
Figure 1. Flow diagram of the proposed AdXGRA model.
Mathematics 11 01645 g001
Figure 2. The feature importance of final model.
Mathematics 11 01645 g002
Table 1. Features considered.
Feature TypeFeature NameVariables
ContinuousAgeDemographic variable
ContinuousWaist CircumferenceAnthropometric factor
ContinuousCalcium, Potassium, Magnesium, SodiumMicronutrients
ContinuousCarbohydrates, Protein, Fibre, Fat, Fatty Saturated Acids (SFA), Fatty Monounsaturated Acids (MUFA), Polyunsaturated Fatty Acids (PUFA)Macronutrients
Table 2. Characteristics of participants with normal and early vascular aging using 75th percentile.
VariablesFull Population, n = 484NVA, n = 328EVA, n = 156p
Cardiovascular risk factors
Age, years55.86 ± 14.1755.11 ± 114.1457.43 ± 14.150.092
WC, (cm)93.13 ± 12.0091.83 ± 11.3595.86 ± 12.87<0.001
SBP, mmHg119.67 ± 17.71115.64 ± 15.08128.14 ± 19.77<0.001
DBP, mmHg75.54 ± 10.1873.33 ± 9.1280.18 ± 10.75<0.001
Total cholesterol, (mg/dL)194.50 ± 32.44193.60 ± 33.27196.40 ± 30.630.375
LDL-C, mg/dL115.45 ± 29.42114.53 ± 30.07117.40 ± 27.990.319
HDL-C, mg/dL58.51 ± 15.9159.78 ± 16.0955.82 ± 15.230.011
Triglycerides, mg/dL102.89 ± 53.2796.15 ± 48.68117.03 ± 59.52<0.001
Dyslipidemia, n (%)314 (64.9)199 (60.9)115 (74.2)0.004
Glycemia, mg/dL88.17 ± 17.3786.08 ± 13.3092.58 ± 23.20<0.001
HbA1c, (%)5.49 ± 0.565.41 ± 0.465.64 ± 0.70<0.001
BMI, (kg/m2)26.47 ± 4.1925.99 ± 3.8627.49 ± 4.660.001
CVR score, (%)1.15 ± 0.120.97 ± 0.101.53 ± 1.56<0.001
cfPWV8.14 ± 2.547.30 ± 1.809.95 ± 2.96<0.001
Lifestyles
Alcohol, (g/week)45.65 ± 78.6041.11 ± 73.1355.19 ± 88.500.065
Smoker12.93 ± 17.3512.13 ± 16.5014.59 ± 18.950.145
Mediterranean diet7.15 ± 2.077.19 ± 2.047.06 ± 2.150.546
Total physical activity, (METs/ min/week)2532.91 ± 3306.562477.69 ± 3166.411649.00 ± 3591.350.595
Sedentary time, (h/week)42.07 ± 17.7841.14 ± 18.1444.04 ± 16.880.093
Energy, Kcal2124.06 ± 555.382152.29 ± 559.962064.70 ± 542.610.105
Macronutrients
Carbohydrates gr/day200.500 ± 62.34202.28 ± 62.90196.75 ± 61.160.362
Protein gr/day96.96 ± 25.7598.53 ± 26.0193.67 ± 24.960.049
Fiber, gr/day25.82 ± 8.5126.07 ± 8.7125.30 ± 8.080.349
Fat, gr/day96.74 ± 30.2898.58 ± 31.0592.88 ± 28.290.050
SFA, gr/day31.31 ± 11.1132.27 ± 11.3629.29 ± 10.320.006
MUFA, gr/day45.30 ± 14.5145.86 ± 14.9244.12 ± 13.580.217
PUFA, gr/day12.43 ± 4.8012.63 ± 4.8811.99 ± 4.610.172
Micronutrients
Calcium, gr/day8.72 ± 2.928.81 ± 2.778.53 ± 3.220.330
Potassium, gr/day3.59 ± 0.923.60 ± 0.913.57 ± 0.940.739
Magnesium, gr/day3.24 ± 0.873.28 ± 0.863.16 ± 0.880.152
Sodium, gr/day3.60 ± 1.523.71 ± 1.603.38 ± 1.320.025
SBP, systolic blood pressure; DBP, diastolic blood pressure; LDL-C, low-density lipoprotein cholesterol; HDL-C, high-density lipoprotein cholesterol; HbA1c, glycohemoglobin; BMI, body mass index; CVR, cardiovascular risk, cfPWV, femoral pulse wave velocity, NVA, normal vascular aging; EVA, early vascular aging; SFA, fatty saturated acids; MUFA, fatty monounsaturated acids; PUFA, polyunsaturated fatty acids.
Table 3. Machine learning classifier performance (%) for vascular aging detection.
ModelAccuracyPrecisionSpecificityRecallF1-ScoreMCC
ADB0.63890.13040.68250.33330.18750.0113
XGB0.65280.15220.69050.38890.21880.0563
GLM0.65280.13040.69700.50000.20690.1168
RF0.65970.17390.69600.42110.24620.0850
ADB, adaBoost; XGB, extreme gradient boosting; GLM, generalized linear model; RF, random forest.
Table 4. Accuracy performance of various classifiers as meta-model.
ModelAccuracyPrecisionSpecificitySensitivity
ADB0.68060.04260.67860.6667
XGB0.67360.04350.68350.4000
MLP0.68800.04350.68790.6667
RF0.66670.02170.67860.2500
GLM0.67360.04350.68350.4000
ADB, adaBoost; XGB, extreme gradient boosting; GLM, generalized linear model; RF, random forest: MLP: Multi-Layer Perceptron.
Table 5. Comparative result of model with classifiers.
ModelAccuracyPrecisionSpecificitySensitivityF1-ScoreMCC
ADB0.64580.19570.69420.39130.26090.0672
XGB0.59030.28260.68570.33330.30590.0182
GLM0.63700.14890.68250.35000.20900.0239
RF0.60420.26090.68810.34290.29630.0285
Stacked classifier: AdXGRA0.68800.04350.68790.66670.08160.1086
ADB, adaBoost; XGB, extreme gradient boosting; GLM, generalized linear model; RF, random forest.
Disclaimer/Publisher’s Note: The statements, opinions and data contained in all publications are solely those of the individual author(s) and contributor(s) and not of MDPI and/or the editor(s). MDPI and/or the editor(s) disclaim responsibility for any injury to people or property resulting from any ideas, methods, instructions or products referred to in the content.

