Article

Applying Neural Networks on Biometric Datasets for Screening Speech and Language Deficiencies in Child Communication

by
Eugenia I. Toki
1,2,
Giorgos Tatsis
1,3,
Vasileios A. Tatsis
1,4,
Konstantinos Plachouras
1,
Jenny Pange
2 and
Ioannis G. Tsoulos
5,*
1
Department of Speech and Language Therapy, School of Health Sciences, University of Ioannina, Panepistimioupoli B’, 45500 Ioannina, Greece
2
Laboratory of New Technologies and Distance Learning, Department of Early Childhood Education, School of Education, University of Ioannina, 45110 Ioannina, Greece
3
Physics Department, University of Ioannina, 45110 Ioannina, Greece
4
Department of Computer Science & Engineering, University of Ioannina, 45110 Ioannina, Greece
5
Department of Informatics and Telecommunications, University of Ioannina, 47150 Kostaki Artas, Greece
*
Author to whom correspondence should be addressed.
Mathematics 2023, 11(7), 1643; https://doi.org/10.3390/math11071643
Submission received: 15 February 2023 / Revised: 20 March 2023 / Accepted: 27 March 2023 / Published: 29 March 2023
(This article belongs to the Special Issue Advances in Fuzzy Logic and Artificial Neural Networks)

Abstract

:
Screening and evaluation of developmental disorders include complex and challenging procedures, exhibit uncertainties in the diagnostic fit, and require high clinical expertise. Although typically, clinicians’ evaluations rely on diagnostic instrumentation, child observations, and parents’ reports, these may occasionally result in subjective evaluation outcomes. Current advances in artificial intelligence offer new opportunities for decision making, classification, and clinical assessment. This study explores the performance of different neural network optimizers in biometric datasets for screening typically and non-typically developed children for speech and language communication deficiencies. The primary motivation was to give clinicians a robust tool to help them identify speech disorders automatically using artificial intelligence methodologies. For this reason, in this study, we use a new dataset from an innovative, recently developed serious game collecting various data on children’s speech and language responses. Specifically, we employed different neural network approaches such as Artificial Neural Networks (ANNs), K-Nearest Neighbor (KNN), Support Vector Machines (SVM), along with state-of-the-art Optimizers, namely the Adam, the Broyden–Fletcher–Goldfarb–Shanno (BFGS), Genetic algorithm (GAs), and Particle Swarm Optimization algorithm (PSO). The results were promising, while Integer-bounded Neural Network proved to be the best competitor, opening new inquiries for future work towards automated classification supporting clinicians’ decisions on neurodevelopmental disorders.

1. Introduction

Neurodevelopmental disorders (NDs) are complex conditions affecting brain functions, altering neurological development, and causing difficulties in social, cognitive, learning, communication, behavior, and emotional functioning [1,2,3]. DSM-5 provides a framework for diagnosis and describes that Neurodevelopmental Disorders (NDs), among others, mainly include [1,2,3,4]:
  • Autism Spectrum Disorders (ASD): are characterized by deficits in (i) social communication and social interaction and (ii) restricted repetitive patterns of behavior, interests, and activities.
  • Attention Deficit Hyperactivity Disorder (ADHD): is characterized by inattention, impulsiveness, and hyperactivity, interfering with daily activities and functioning.
  • Intellectual Disability (ID): comprises impairments of general mental abilities that impact adaptive functioning (determine how well an individual copes with everyday tasks) in the conceptual, social, and practical domains. [4].
  • Specific Learning Disorder (SLD): is characterized by difficulties in learning and processing specific academic skills, such as reading, writing, or mathematics, despite normal intelligence and adequate educational opportunities. These symptoms can affect academic and daily functioning.
  • Communication Disorders (CD): involve language disorder, speech sound disorder, childhood-onset fluency disorder, and social (pragmatic) communication disorder (difficulties in the social uses of verbal and nonverbal communication).
NDs commonly onset throughout development stages from young infancy to adolescence and persist into adulthood or may go undiagnosed until one is an adult [1]. The deficits’ severity in NDs varies and may co-occur with other disorders. These deficits can affect the quality of life for individuals and their families, causing significant care needs and extensive community assets [5,6].
Speech and language deficiencies can be early indicators of many neurodevelopmental disorders. In addition, effective communication is critical to human development and social interaction, suggesting developmental continuity from early years to later life [1,7]. To screen and diagnose the NDs’ various features, clinicians commonly rely on diagnostic instrumentation, child observations, perceived behaviors, parent interviews, and testing, occasionally resulting in subjective evaluation [5]. However, since clinical evaluations include complex, challenging, non-standardized, multiparametric procedures, and uncertainties in the diagnostic fit, they require high-level clinical expertise and objective measurements [8]. Moreover, early identification and treatment of speech and language deficiencies can help diminish NDs’ impact on an individual’s overall development and functioning [9]. Thus, there is a highly demanding need to contribute to the need for additional support in eliminating the over- or under-diagnosed child [10].
Recent advancements and innovations in artificial intelligence (AI) spark great interest in their potential benefits in speech and language pathology and special education for individuals with developmental disabilities, learning disabilities, articulation disorders, voice disorders, and more [9,11,12,13,14,15,16]. Computer science, mathematical algorithms, AI, and other emerging technologies introduce new prospects to support clinical decision-making [10] primarily for an accurate diagnosis, even in rare medical conditions [17,18,19]. The current literature documents the growing attention in AI algorithms and automated measurement tools for decision-making, classification, and clinical assessment in communication deficiencies and NDs in research [8,9,10,20]. The results of a pilot study of an integrated technology solution, including a serious game using machine learning models and a mobile app for monitoring ADHD behaviors, indicate ML’s potential in ADHD prediction based on gameplay data [8]. The applicability of eye-tracking data to aid the early screening of autism in children reveals that using ML methods strongly suggests that eye-tracking data can help clinicians for a quick and reliable autism screening [10]. In addition, for the classification of developmental delay, the use of AI, serious games, and fine motor movements captured from touching a mobile display have been suggested [9]. Moreover, online gamified testing with a predictive machine learning model for individuals with dyslexia reports results that correctly detect over 80% of the participants with dyslexia, presenting the potential of using a ML approach for dyslexia screening [20].
Hence, this study aims to assist clinicians’ decision-making and support evaluation procedures. To screen typically and non-typically developed children for speech and language communication deficiencies, various neural networks adopting different optimizers have been implemented and tested in a new biometric dataset to automatically classify the individuals.
This study is organized into sections as follows: Section 1 explains the significance of clinical evaluation procedures for NDs and speech and language deficiencies in children, the importance of early and objective evaluation procedures, and includes a short description of the research’s motivation; Section 2 summarizes the required background knowledge on neural networks and the implemented optimizers; Section 3 presents the methods used in this paper, including the dataset and how the implemented neural networks have been formulated in this research work; followed by Section 4 that presents the experimental results, in which the provided results are discussed. Finally, the paper concludes with Section 5, presenting the conclusions, limitations, and suggestions for future research.

2. Background Information

This section briefly provides the required background information for this study and the corresponding algorithms. Specifically, it is devoted to Artificial Neural Networks (ANNs), K-Nearest Neighbor (KNN), Support Vector Machines (SVM), and the corresponding optimizers used in work, namely the Adam optimizer, the Broyden–Fletcher–Goldfarb–Shanno (BFGS), Genetic algorithm (GAs), and Particle Swarm Optimization algorithm (PSO).
ANNs are parametric machine learning tools [21,22] that utilize a series of parameters commonly called weights or processing units. These tools have found application in a variety of scientific areas, such as physics [23,24,25], the solution of differential equations [26,27], agriculture [28,29], chemistry [30,31,32], economics [33,34,35], and health [36,37]. In addition, recently, neural networks have been used in solar radiation prediction [38], 3D printing [39], and lung cancer research [40].
A neural network typically uses a special function, called the activation function, that decides whether a neuron should be activated or not. A commonly used activation function is the sigmoid function, defined as [21,22]:
σ x = 1 1 + e x
The neural network has hidden nodes and each one is expressed as,
o i x = σ w ι T x + θ i
where wi is the weight vector, and θi is the bias of the ith node. A neural network can be defined as in the following equation,
x = i = 1 H v i o i x
where H is the total number of processing units, and vi stands for the output weight of the ith node.
The training error of the neural network is defined as:
E N x , w = i = 1 M N x i , w y i 2
where the set ( x i , y i ) ,     i = 1 , ,   M is the training dataset for the neural network, x i stands for the input vector, and y i stands for the assigned class. Essentially, the training of the artificial neural network includes the determination of the optimal vector of w parameters through the minimization of Equation (4). During recent years, a variety of optimization methods have been proposed to minimize this equation such as the Back Propagation method [41,42], the RPROP method [43,44,45], Quasi Newton methods [46,47], Simulated Annealing [48,49], GAs [50,51], and PSO [52,53].
BFGS is a widely used iterative optimization in various fields [54], including machine learning algorithms [55]. Specifically, it approximates the inverse of the Hessian matrix (the matrix of second-order partial derivatives) to determine the search direction in which the objective function should be minimized. Furthermore, it updates the approximation in each iteration based on the gradient information. BFGS has good convergence properties, is well-suited for problems with high dimensionality, and is often used in machine learning to optimize the weights of neural networks. Despite its popularity, BFGS can be sensitive to the choice of initial guess and may converge to a suboptimal solution in the case of non-convex objective functions. However, convex optimization problems present fast and reliable results.
GAs are a class of heuristic search algorithms inspired by the mechanics of natural selection and genetics [56,57,58]. Precisely, GAs initialize a population of candidate solutions by forming the corresponding problem’s parameters into chromosomes. The population evolves through the application of genetic operators, such as selection, crossover, and mutation. First, a fitness function is used to evaluate their value, and the best-performing individuals are then selected to create a new population in the next generation. This process is repeated until a satisfactory solution or termination criteria are met. GAs have been applied to a wide range of optimization problems, including scheduling, resource allocation, and neural networks, and have shown to be effective and efficient in many cases.
PSO is a computational optimization method introduced by Eberhart and Kennedy in 1995 [59]. The main inspiration came from the social behavior of birds in a flock. PSO initiates a population of particles representing candidate solutions to probe the search space. Their positions are adjusted based on their own best solution and the overall best solution found by the swarm or a predefined neighborhood. The algorithm iterates continuously, and the best-found solution is reported. PSO proposed parameters such as population number, inertia weight, cognitive and social acceleration, and maximum velocity. The linear decrease in inertia weight determines how much the particles are influenced by their previous velocity over time. The self-adaptation of inertia weight allows the swarm to transition from exploring the solution space to exploiting the best-known solution, effectively guiding the search toward the global optimum [60,61,62].
The INN is an advanced method of training artificial neural networks which identifies the optimal interval for initializing and training artificial neural networks [63]. The location of the optimal interval is performed using rules evolving from a genetic algorithm. The method has two phases: (i) an attempt is made to locate the optimal interval, and (ii) the artificial neural network is initialized and trained in this interval using a global optimization method, such as a genetic algorithm. The method has been tested on various categorization and function learning data, and the experimental results were incredibly encouraging [63].
The Adam optimizer is an adaptive gradient-based optimization technique frequently used in machine learning algorithms [64]. The technique keeps a different learning rate for the supplied neural network weights and adapts the learning rate as needed throughout training. Adam is a standard optimization method that is well-known for being efficient and for being able to handle sparse gradients.
The K-Nearest Neighbor (KNN) algorithm is a straightforward but effective classification algorithm [65,66]. This algorithm differs as it does not use a training dataset to build a model. It operates by locating the k training samples closest to the new data point in the feature space and assigning it to the majority class or average value of these k neighbors. KNN’s simplicity puts it in the top selections, but its performance is sensitive to the choice of the number of nearest neighbors and the distance metric used.
Support Vector Machines (SVM) [67,68] is another popular and effective supervised classification algorithm. The method finds the best decision boundary that maximally separates the classes by maximizing the margin. The margin refers to the distance between the decision boundary and the closest data points from each class. SVMs are known to be effective in handling complex data distributions, and their performance is less sensitive to overfitting than other machine learning algorithms. However, SVMs can be computationally expensive and require careful kernel function and hyperparameter selection to achieve optimal performance.

3. Materials and Methods

We designed a serious game to collect and process players’ responses. This serious game contains numerous activities on screening/assessment procedures for NDs [69]. The game data are processed on a dedicated server back-end service to examine early clinical screening/diagnostic patterns on specified domains or skills towards automated indications.
This study is part of the “Smart Computing Models, Sensors, and Early diagnostic speech and language deficiencies indicators in Child Communication” research project with the acronym “SmartSpeech”. SmartSpeech is an ongoing research project funded by the Region of Epirus in Greece and the European Regional Development Fund (ERDF).

3.1. Data Description

The sample in our analysis consisted of children, with a total of 435 participants with an average age of 9 years, of which 224 were males and 211 were females. The 339 participants had typical development (TD) (with no NDs), whereas 96 had NDs. We categorized them according to DSM-5. More specifically, 17 had ASD, 18 had ADHD, 8 had ID, 19 had SLD, and 42 had CD. Some of the participants exhibited more than one disorder. The sample recruitment was conducted after various calls through health and educational sectors supporting TD and non-TD children. Parents were informed of the nature and scope of the project, the procedures, and the project approval by the Research Ethics Committee of the University of Ioannina, Greece (Reg. Num.: 18435/15.5.2020), which complies with the General Data Protection Regulation GDPR. Next, they signed the parent consent form.
The participation process included registration in the database and the completion of questionnaires about the child’s developmental profile. Then, guided by the clinician, the child played the interactive game explicitly designed for this purpose. Overall, at the end of the process, the variables we used in the analysis came from the game’s scores and the bio-signal measurements, i.e., heart rate and eye-tracking measurements.
The SmartSpeech game is designed in the Unity environment [70] and generates several variables regarding scores on the game’s activity performances and biometric data. The developed game activities represent the overall performance according to the known developmental skills that children typically acquire. Several activities correspond to these specific speech and language skills [69]. In addition to the scores based on direct responses of the child/player via the touchscreen with clicks and hand movements, other biometric data were also measured, namely voice, heart rate (HR), and gaze.
Voice was recorded in mp3 files when the child needed to answer verbally in a posing question. For this purpose, a speech-to-text program was used [71], for which a Greek model was trained [72] and used. The child was required to give about 40 verbal replies, including but not restricted to naming objects, fruits, vegetables, and characters’ names. The SmartSpeech game using this speech-to-text program transcribes the audio files into text and then matches the child’s response with the correct answer in a manner of the true–false outcome.
During the gameplay, the child wore a smartwatch with dedicated software developed, which continuously captured the heart rate values in bpm (beats per minute) units. For every game activity, we took the signal for the corresponding period and calculated three metrics: the mean, the standard deviation, and the range of HR. Ideally, we would like to have had the heart rate variability (HRV) in hand, but due to hardware limitations, this was not possible. Hence, we used the dispersion statistics above as an alternative to the mean baseline.
Furthermore, the game presented the child with several visual stimuli to detect the areas on the screen that attracted the player’s focus. We conducted this procedure by eye-tracking software [73] executed during the game by capturing the child’s gaze via the tablet’s camera. When the viewer focused on a specific area, this led to a particular metric called a fixation. The software gave these fixations, and we computed three standard variables in eye-tracking [74]. These were:
  • The number of fixations (fixation count—FC);
  • The time that passed until the first fixation (time to first fixation—TTFF);
  • The total duration of fixations (time spent—TS).

3.2. Data Formulation & Methods Description

As for the eye-tracking variables, the filtering process left only the fixations count and the time spent on areas of interest. The time to first fixation had many missing values and was removed from the dataset.
The dataset is divided into three subsets that correspond to the categories of (i) game scores, (ii) heart rate statistics, and (iii) eye-tracker metrics. Each of these subsets constitutes the set of input variables to the classification process. Several missing and non-valid data were filtered out. Thus, our dataset was forced to reduce the number of cases, although our initial dataset was larger. Ultimately, this also reduced instances of the pathological population. The following tables summarize the input variables. Table 1 shows the variables of the game scores. In total, 30 variables corresponded to the types described in Table 1, Table 2 and Table 3 that summarize the variables from the heart rate and eye tracking accordingly. A total of 15 HR variables used all statistical means, standard deviations, and range. As for the eye-tracking variables, the filtering process left only the fixations’ count and time spent on areas of interest, 16 variables in total. The time to first fixation had many missing values and was removed from the dataset.
Table 4 shows the target variables defining the classes that were used. These variables are binary, meaning either they had the condition or not. The Disorder variable denotes TD and non-TD children. ASD, ADHD, ID, SLD, and CD variables suggest more specifically the disorder as described above, according to DSM-5.
Descriptive statistics for the variables (means, St Ds) are summarized in Appendix A.

4. Application Details and Experimental Results

In this section, the application details of the applied classifiers and their corresponding parameterization are described in detail, followed by the experimental results.
Seven different classifiers were considered to assess their performance on the provided dataset. Specifically, each neural network employed one layer with ten neurons, and four different optimizers were adopted accordingly, namely BFGS [75], genetic algorithm [58,74,76], PSO [77], and Adam [64]. The same population and chromosome number for PSO and genetic algorithms was used, accordingly, N = 200. At the same time, the parameters of the rest of the optimizers remained the same as in the original papers. Furthermore, an INN rule construction method, a KNN method [65] with five neighborhoods, and an SVM method [68] (using the freely available library libsvm [78]) were also considered for the comparisons. Finally, the maximum number of iterations was set at 200 for fair comparisons.
The datasets were split into ten subsets using the 10-fold cross-validation technique to estimate their performance reasonably. Nine of the produced subsets were used for training, and the remaining one was used for the test. Thirty independent experiments were conducted for each instance, calculating each algorithm and the average classification error. For this purpose, different seed numbers were also used for each experiment using the drand48() random number generator of the C programming language. The experiments were performed using the freely available in-house software from https://github.com/itsoulos/IntervalGenetic (accessed on 15 February 2023). The cells in the experimental tables describe average results on the corresponding test set.
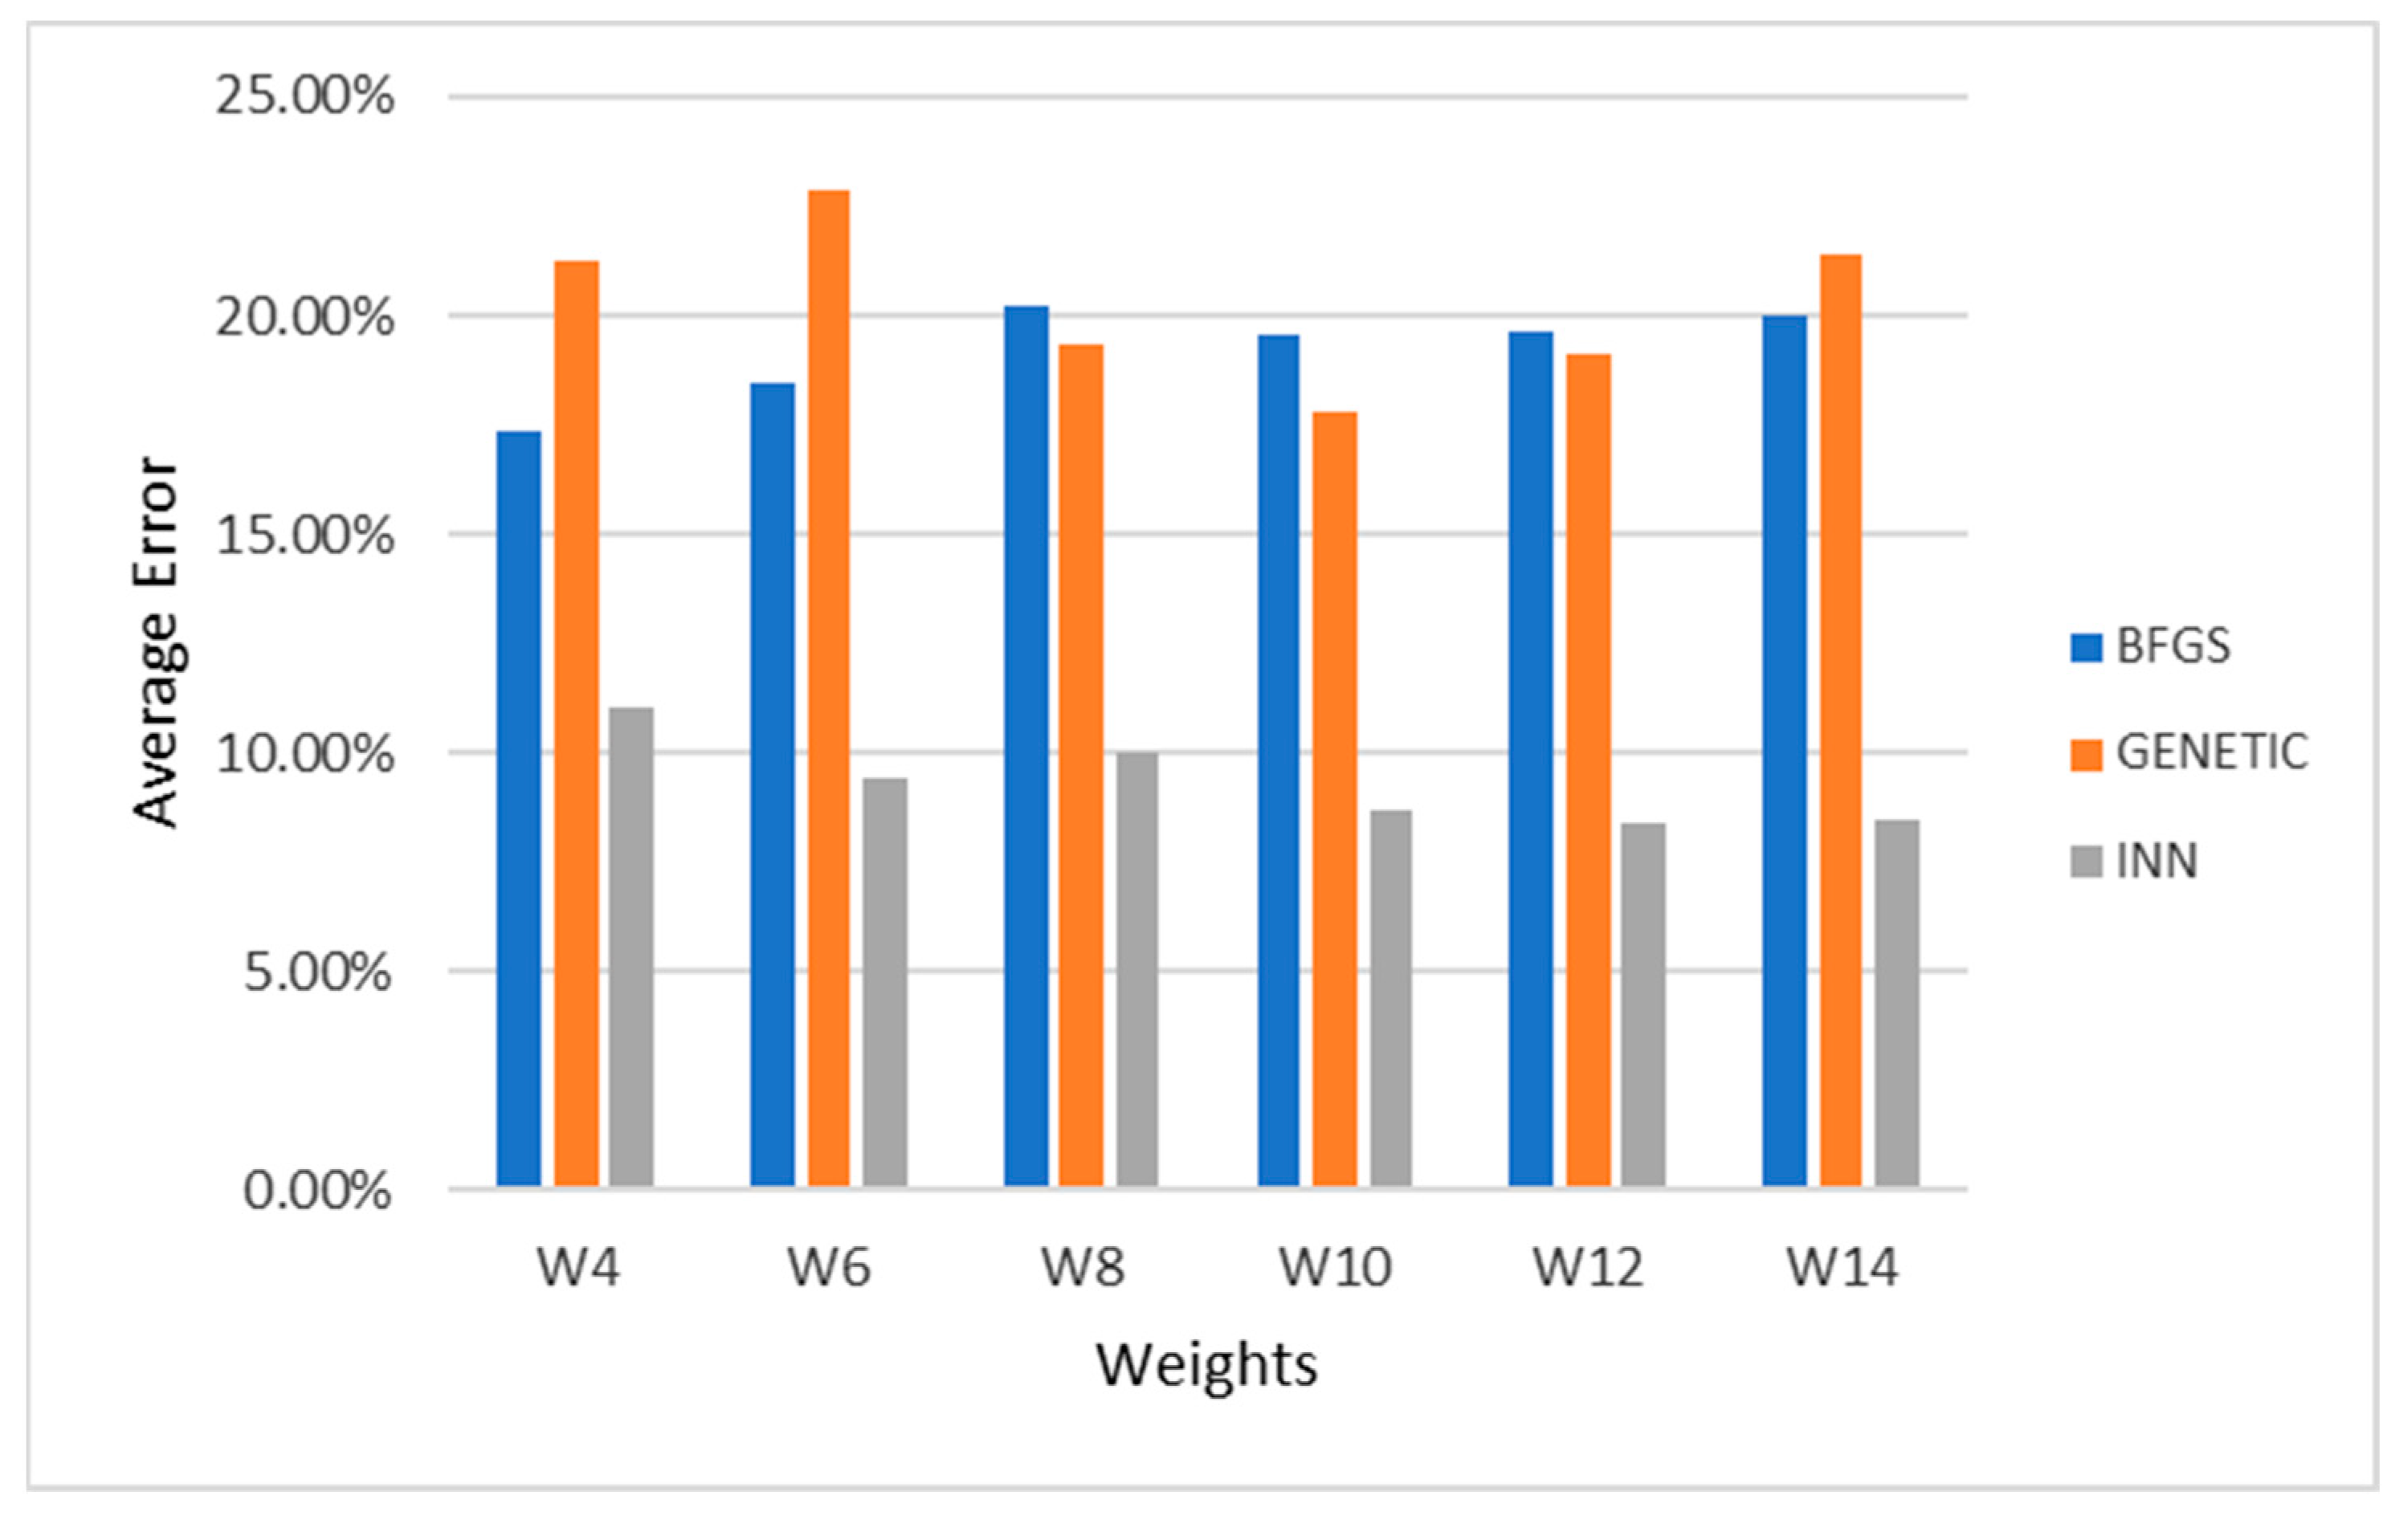
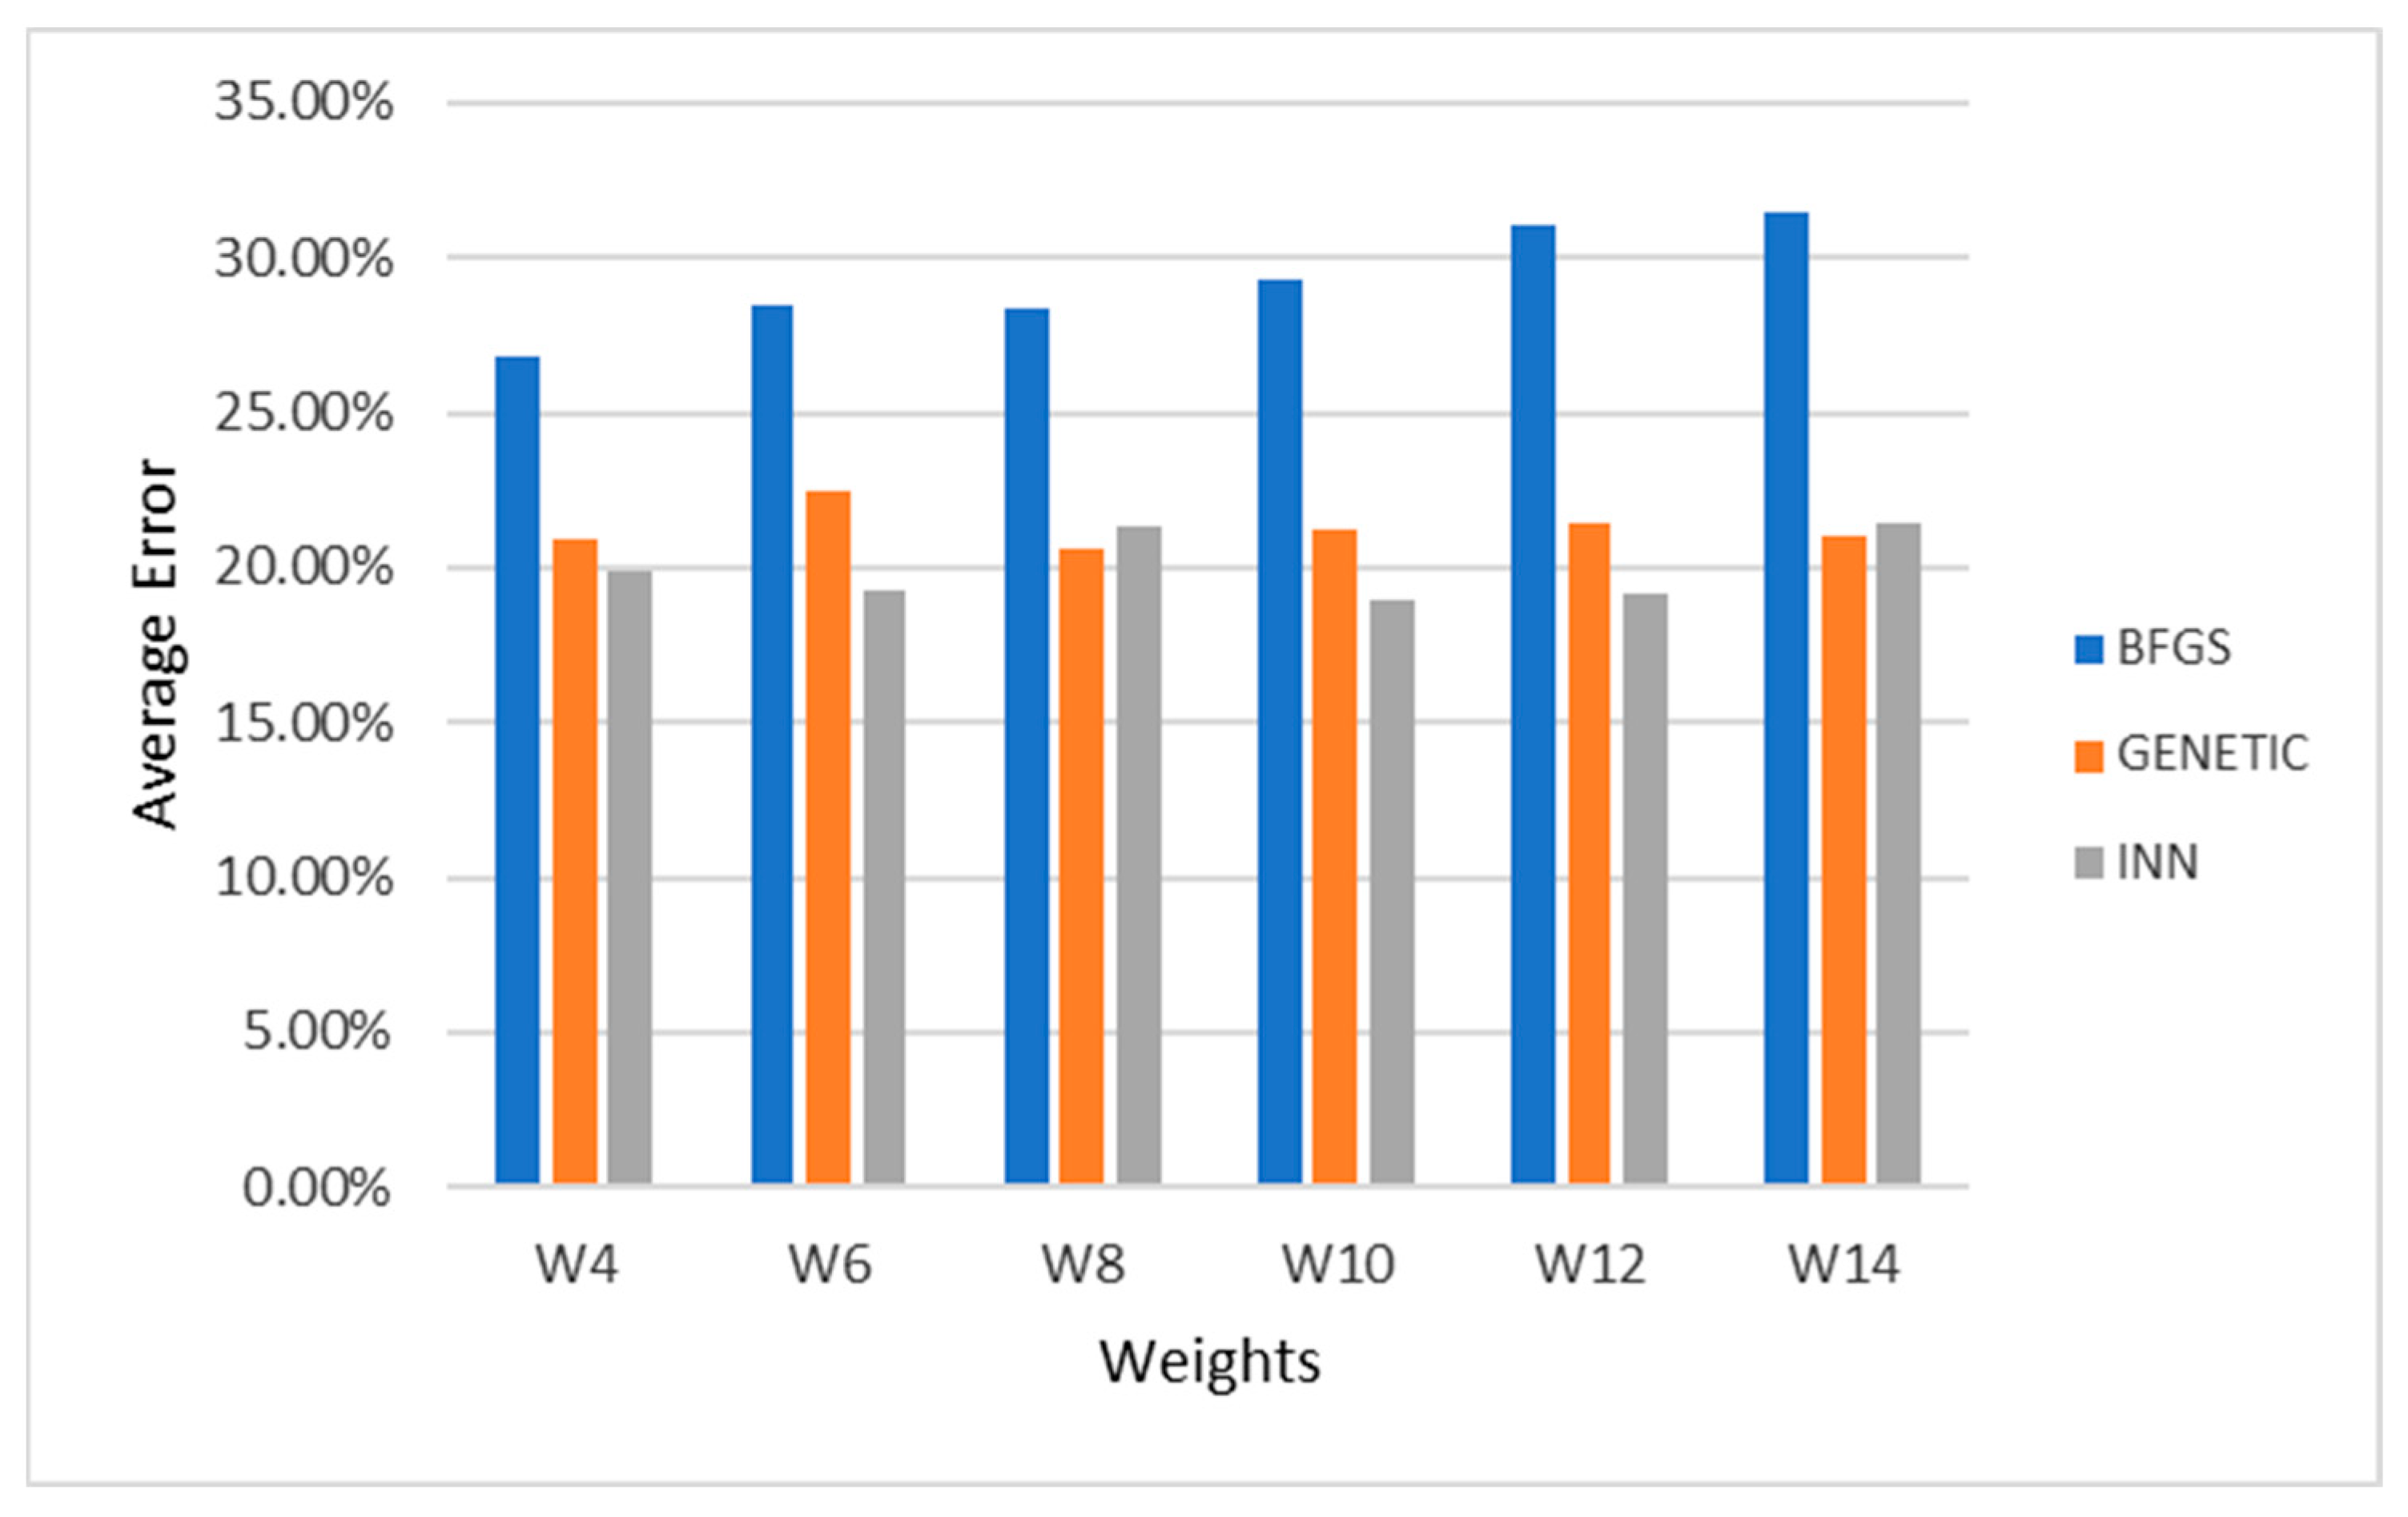
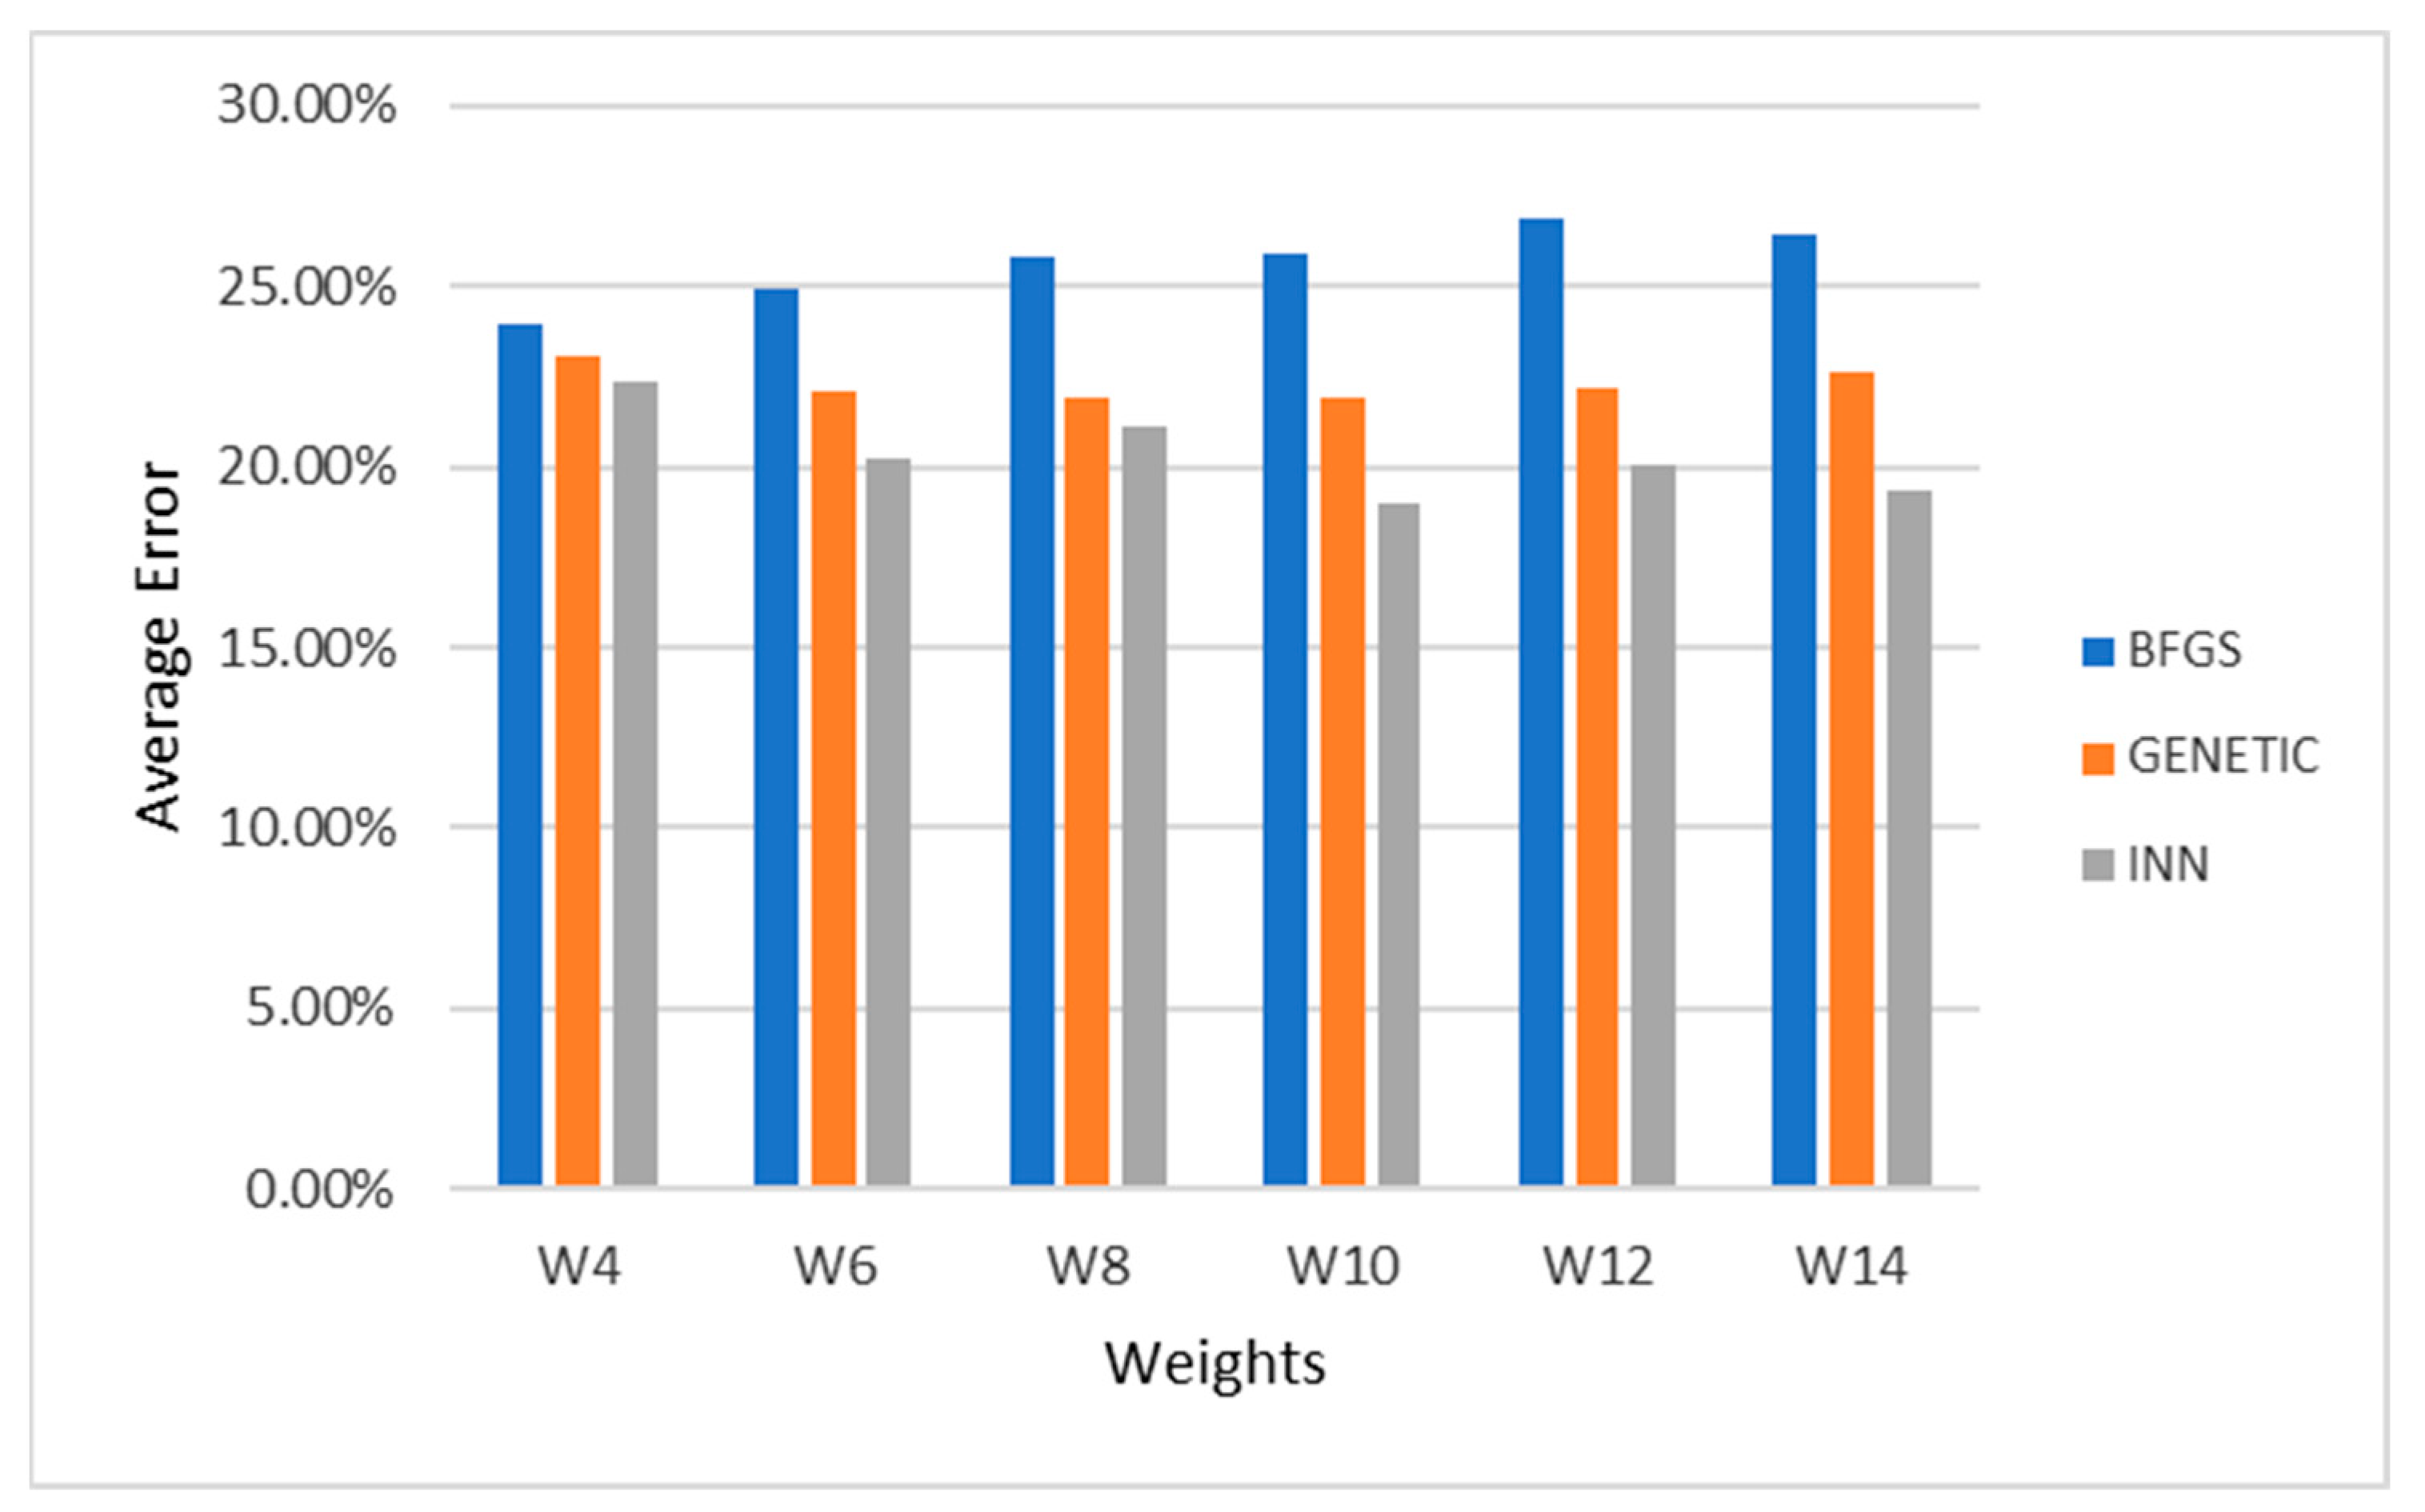
Additionally, neural network neurons were changed to examine the performance disturbances, and, specifically, they ranged from 4 to 14. This experiment was conducted for the three disorder datasets, and the results are graphically demonstrated in Figure 1, Figure 2 and Figure 3. Observing the related graphs shows that 8–10 processing nodes usually achieve the lowest values in the control dataset in almost all techniques.
Next, Table 5, Table 6 and Table 7 compare the utilized classification methods using error rate (%) for the eye-tracking, heart rate, and game responses datasets.
Table 8 shows the precision and recall metrics indicatively for Genetic and INN when applied to this study’s datasets.
As can be observed from the tables presenting the experimental results, BFGS achieved lower results for all instances and all datasets since it is a local optimization algorithm. Specifically, BFGS achieved an average error rate of 28.85% for the eye-tracking dataset, while the genetic and PSO have marginally better results. INN achieved the best average error rate, namely 20.02%, indicating that it can detect the best areas that the weights can range. INN is conducted in two phases. During the first phase, a branch and bound algorithm locates the most promising intervals for the neural network parameters. In the second phase, a genetic algorithm optimizes the neural network inside the interval located in the first phase. Additionally, the experimental results indicated that Adam slightly overcomes SVM and KNN in most cases.
Moreover, the average error rate concerning whether an individual has a disorder is more profitable since the corresponding data are more extensive than those from other instances, such as ID and ADHD. Furthermore, as mentioned in Section 3.2, gathering data on child populations is challenging, with missing data reported. For instance, regarding eye-track activities, there is in-line evidence of difficulty obtaining continuous and valid measurements due to the child’s spontaneous movements [79]. The same patterns were also applied in the heart rate and the game score datasets. INN proved better than the rest, achieving a classification error of around 20% aligning with the results of precision and recall rates. It is clear that the classification for “Disorder” for the eye-tracking dataset, thus screening between TD and non-TD children, reports the best results for all the optimizers. The highest performance is clearly achieved using the INN optimizer (8.67% error rate).
In the same way as this study, others have looked into the potential of drag-and-drop data as a digital biomarker and proposed a classification model to categorize kids with developmental disorders [9]. They created an algorithm for a deep-learning convolutional neural network model with promising findings suggesting diagnoses of developmental disorders. In a different study, the potential for the early detection of developmental impairments in children was explored, using diagnostic information from the International Classification of Diseases (ICD) and supplementary information, including prescription history, treatment duration, and frequency records [80]. By combining four algorithms, namely k-nearest neighbor, random forest, logistic regression, and gradient boosting, they created the best model for the early diagnosis of impairments. Their classification model for detecting disorders yielded high accuracy outcomes, just as in our study. It also specified delivering diagnoses around a year earlier than the usual diagnostic age.

5. Conclusions

Screening and evaluating speech and language deficiencies and NDs is a challenging, rigorous, and complex procedure that may occasionally result in misleading outcomes due to uncertainties in the diagnostic fit, subjective evaluation, and clinical expertise. Delayed or inaccurate evaluation eliminates chances for early identification and treatment, while if detected in time, it can help diminish NDs’ impact on an individual’s overall development and functioning. This highlights the significance of this study, using artificial intelligence for automatic classification.
For this reason, in this study, a first attempt to enhance the clinician’s decision-making assessment was conducted using machine learning methodologies. Specifically, the collected data provided by a novel, recently developed serious game were used as a test bed to estimate the classification performance of the proposed neural network algorithms. The provided dataset includes a variety of variables stemming from the game, along with biometrical data from a total of 435 participants. The experiments were conducted in a series of different neural networks adopting a variety of optimizers, and the average classification error was collected.
The results were promising, opening new inquiries for future research. INN proved to be the most competitive algorithm, achieving an average classification error of 20%. This performance may be further improved by using different optimization and machine learning methodologies, and/or by increasing the number of participants, which we will thoroughly examine in future work. The results of this study are expected to contribute towards developing an innovative digital approach to support health care. They may be valuable tools for the early identification of NDs, delivering objective metrics complementary to the clinician’s diagnosis, reducing screening and diagnostic costs, and enriching clinician efficiency.

Author Contributions

Conceptualization, E.I.T. and I.G.T.; methodology, E.I.T. and I.G.T.; software, I.G.T.; validation, K.P., J.P. and V.A.T.; formal analysis, E.I.T., G.T., V.A.T. and I.G.T.; investigation, V.A.T. and K.P.; resources, G.T. and K.P.; data curation, G.T., K.P. and J.P.; writing—original draft preparation, E.I.T., G.T, V.A.T. and I.G.T.; writing—review and editing, E.I.T., J.P. and I.G.T.; visualization, G.T. and I.G.T.; supervision, E.I.T. and I.G.T.; project administration, E.I.T.; funding acquisition, E.I.T. All authors have read and agreed to the published version of the manuscript.

Funding

This research was funded by the Region of Epirus, project titled “Smart Computing Models, Sensors, and Early diagnostic speech and language deficiencies indicators in Child Communication”, with code HP1AB-28185, supported from the European Regional Development Fund (ERDF).

Institutional Review Board Statement

The study was conducted in accordance with the Declaration of Helsinki, and approved by the Research Ethics Committee of the UNIVERSITY OF IOANNINA, Greece (protocol code 18435 and date of approval 15 May 2020).

Informed Consent Statement

Informed consent was obtained from all subjects involved in the study.

Data Availability Statement

The participants of this study did not give written consent for their data to be shared publicly, so due to privacy restrictions and the sensitive nature of this research data sharing is not applicable to this article.

Acknowledgments

We wish to thank all the participants for their valuable contribution in this study.

Conflicts of Interest

The authors declare no conflict of interest. The funders had no role in the design of the study; in the collection, analyses, or interpretation of data; in the writing of the manuscript; or in the decision to publish the results.

Appendix A

Table A1. Means and standard deviations of game score variables for all classes.
VariablesTDASDADHDIDSLDCD
Object recognitionVar188.44 ± 28.0790.00 ± 15.9788.89 ± 32.3479.00 ± 35.4291.16 ± 24.5391.19 ± 23.44
Var273.40 ± 31.6162.29 ± 26.0570.11 ± 32.2362.25 ± 37.5985.84 ± 28.0469.52 ± 30.27
Var390.67 ± 23.0388.00 ± 16.7590.67 ± 25.1479.00 ± 35.4291.21 ± 26.9087.19 ± 26.61
Var487.16 ± 22.3682.71 ± 18.1488.00 ± 22.9387.63 ± 16.0482.16 ± 18.6677.86 ± 22.81
Var576.40 ± 29.4555.18 ± 29.6475.72 ± 30.7162.25 ± 37.5978.16 ± 29.2170.07 ± 30.81
Var686.43 ± 26.2776.12 ± 28.6489.33 ± 20.5394.38 ± 15.9191.68 ± 18.6580.19 ± 29.02
Click on objectsVar16.20 ± 15.9412.41 ± 20.183.72 ± 4.739.50 ± 23.104.32 ± 10.985.90 ± 10.59
Var267.90 ± 22.2861.47 ± 18.2764.78 ± 22.9274.50 ± 19.6567.21 ± 16.0565.02 ± 22.09
Var34.94 ± 11.2313.53 ± 24.997.22 ± 16.166.13 ± 12.226.00 ± 11.216.21 ± 14.07
Var468.42 ± 37.3554.06 ± 40.2658.44 ± 38.8835.88 ± 35.4167.00 ± 34.5248.14 ± 34.59
Var579.35 ± 29.4175.29 ± 29.6187.78 ± 20.7442.50 ± 49.5086.32 ± 28.3374.76 ± 33.66
Var643.42 ± 39.1022.00 ± 30.4334.17 ± 32.3019.75 ± 38.2532.84 ± 34.7222.93 ± 27.20
Var790.86 ± 28.8788.24 ± 33.2194.44 ± 23.5775.00 ± 46.2994.74 ± 22.9488.10 ± 32.78
Vocal intensityVar137.73 ± 27.1151.18 ± 23.1247.67 ± 26.1437.13 ± 26.2556.21 ± 25.9945.05 ± 29.03
Verbal responseVar117.11 ± 37.725.88 ± 24.2511.11 ± 32.3412.50 ± 35.3621.05 ± 41.897.14 ± 26.07
Var218.08 ± 23.6826.06 ± 23.0420.17 ± 20.915.25 ± 5.0123.42 ± 25.6212.38 ± 13.06
Var321.32 ± 22.1018.47 ± 16.3018.44 ± 15.817.38 ± 9.0211.58 ± 13.0313.00 ± 14.18
Var411.49 ± 15.7419.41 ± 16.7418.33 ± 16.8712.38 ± 17.0819.11 ± 16.7410.21 ± 15.44
Var524.48 ± 43.0611.76 ± 33.2122.22 ± 42.780.00 ± 0.0010.53 ± 31.539.52 ± 29.71
Var69.94 ± 20.7811.65 ± 16.2611.00 ± 19.610.00 ± 0.006.95 ± 17.675.50 ± 14.42
Memory taskVar118.06 ± 28.6612.29 ± 20.1617.17 ± 28.4619.38 ± 37.8414.53 ± 26.1216.81 ± 28.71
Var244.18 ± 40.6616.24 ± 27.7248.50 ± 35.7617.88 ± 27.5456.53 ± 40.2333.12 ± 34.76
Emotion recognitionVar187.61 ± 33.0064.71 ± 49.2683.33 ± 38.3587.50 ± 35.3678.95 ± 41.8983.33 ± 37.72
Var282.89 ± 37.7276.47 ± 43.7277.78 ± 42.7875.00 ± 46.2978.95 ± 41.8985.71 ± 35.42
Var38.85 ± 28.445.88 ± 24.2511.11 ± 32.340.00 ± 0.0010.53 ± 31.534.76 ± 21.55
Hearing testVar127.08 ± 27.0828.24 ± 31.6732.22 ± 27.567.50 ± 14.8822.11 ± 20.9720.00 ± 20.24
Puzzle solvingVar1107.90 ± 63.30108.00 ± 58.62113.00 ± 43.5671.00 ± 46.62109.58 ± 54.94130.74 ± 61.90
Var268.84 ± 31.7470.12 ± 32.4274.78 ± 31.0468.25 ± 42.1374.37 ± 29.5370.12 ± 30.29
Moving objectsVar172.98 ± 23.1566.65 ± 28.1769.06 ± 22.2656.38 ± 33.4972.95 ± 23.5469.14 ± 19.48
Var229.37 ± 18.3929.71 ± 14.1934.67 ± 24.1827.88 ± 19.9333.47 ± 18.3331.90 ± 17.75
Table A2. Means and standard deviations of heart-rate variables for all classes.
VariablesTDASDADHDIDSLDCD
HR MeanVar184.22 ± 15.5384.20 ± 10.2085.54 ± 13.3284.80 ± 8.7280.59 ± 11.7485.25 ± 12.13
Var284.98 ± 15.9885.23 ± 13.2789.34 ± 15.4882.70 ± 6.0281.03 ± 10.0186.01 ± 15.07
Var384.88 ± 14.4485.80 ± 13.9986.34 ± 14.2084.53 ± 8.6580.54 ± 9.4584.22 ± 16.18
Var486.14 ± 16.6686.90 ± 16.0388.10 ± 12.8180.88 ± 7.5780.26 ± 14.6787.11 ± 14.89
Var585.57 ± 16.7686.53 ± 11.8085.37 ± 13.8183.15 ± 5.7480.04 ± 14.8284.16 ± 18.43
HR StdVar12.96 ± 2.784.60 ± 2.384.30 ± 3.363.03 ± 0.882.23 ± 1.334.43 ± 3.43
Var23.76 ± 2.643.08 ± 1.805.44 ± 4.642.88 ± 1.972.33 ± 0.594.00 ± 3.35
Var34.20 ± 2.493.23 ± 1.205.14 ± 2.024.05 ± 1.304.79 ± 2.935.69 ± 3.15
Var42.64 ± 2.141.48 ± 0.363.69 ± 3.124.05 ± 2.763.71 ± 2.103.39 ± 2.61
Var50.66 ± 0.861.38 ± 2.251.06 ± 1.381.85 ± 2.010.60 ± 0.481.14 ± 1.51
HR RangeVar110.62 ± 8.7218.40 ± 12.2714.27 ± 11.759.98 ± 2.947.43 ± 4.0415.78 ± 11.14
Var213.88 ± 8.1911.20 ± 4.9419.67 ± 14.2012.40 ± 8.7510.59 ± 3.8714.91 ± 10.87
Var317.67 ± 10.1314.33 ± 2.7221.47 ± 6.8216.28 ± 5.8217.77 ± 8.6922.83 ± 10.30
Var49.17 ± 6.905.30 ± 1.5512.40 ± 9.9613.38 ± 8.0013.99 ± 7.9211.61 ± 8.35
Var51.61 ± 2.164.08 ± 6.812.66 ± 3.155.08 ± 6.241.40 ± 1.163.18 ± 4.30
Table A3. Means and standard deviations of eye-tracking variables for all classes.
VariablesTDASDADHDIDSLDCD
Fixation countsVar18.32 ± 5.987.00 ± 8.047.27 ± 6.155.57 ± 5.265.12 ± 4.764.91 ± 5.43
Var211.38 ± 6.779.06 ± 7.3712.87 ± 8.4812.29 ± 5.1912.71 ± 6.7611.70 ± 7.39
Var33.36 ± 2.382.06 ± 1.914.07 ± 3.262.86 ± 2.273.29 ± 2.802.64 ± 2.04
Var43.36 ± 2.380.76 ± 1.021.58 ± 1.310.86 ± 0.791.60 ± 1.371.40 ± 1.19
Var52.10 ± 2.131.94 ± 2.442.40 ± 3.142.14 ± 3.982.53 ± 2.152.27 ± 2.83
Var62.10 ± 2.131.15 ± 1.541.29 ± 1.610.71 ± 1.001.48 ± 1.640.97 ± 0.90
Var71.47 ± 1.641.31 ± 1.351.20 ± 1.571.43 ± 0.981.18 ± 1.431.30 ± 1.19
Var81.99 ± 1.981.62 ± 1.782.27 ± 1.622.57 ± 1.992.00 ± 2.211.48 ± 1.96
Var91.28 ± 1.451.25 ± 1.441.80 ± 1.902.00 ± 2.001.59 ± 1.811.52 ± 1.64
Var102.32 ± 2.391.50 ± 1.592.13 ± 2.032.00 ± 1.291.82 ± 2.041.70 ± 1.93
Time spentVar14.83 ± 4.253.36 ± 3.912.72 ± 2.522.38 ± 2.642.10 ± 2.342.61 ± 3.43
Var25.55 ± 3.963.71 ± 3.676.02 ± 4.414.13 ± 2.096.13 ± 4.135.78 ± 3.86
Var30.58 ± 0.770.87 ± 1.350.27 ± 0.310.92 ± 0.870.36 ± 0.400.55 ± 0.73
Var40.66 ± 0.790.73 ± 0.930.97 ± 0.970.84 ± 0.740.58 ± 0.640.51 ± 0.79
Var50.57 ± 0.800.38 ± 0.590.76 ± 0.920.97 ± 0.950.69 ± 0.830.75 ± 0.95
Var60.68 ± 0.820.46 ± 0.640.57 ± 0.760.56 ± 0.350.53 ± 0.760.52 ± 0.71

References

  1. Thapar, A.; Cooper, M.; Rutter, M. Neurodevelopmental Disorders. Lancet Psychiatry 2017, 4, 339–346. [Google Scholar] [CrossRef] [Green Version]
  2. Harris, J.C. New Classification for Neurodevelopmental Disorders in DSM-5. Curr. Opin. Psychiatry 2014, 27, 95–97. [Google Scholar] [CrossRef]
  3. American Psychiatric Association (APA). Diagnostic and Statistical Manual of Mental Disorders: DSM-5, 5th ed.; American Psychiatric Association, Ed.; American Psychiatric Association: Washington, DC, USA, 2013; ISBN 978-0-89042-554-1. [Google Scholar]
  4. DSM-5 Intellectual Disability Fact Sheet. Available online: https://www.psychiatry.org/File%20Library/Psychiatrists/Practice/DSM/APA_DSM-5-Intellectual-Disability.pdf (accessed on 28 January 2023).
  5. Hyman, S.L.; Levy, S.E.; Myers, S.M.; Council on children with disabilities, Section on Developmental and Behavioral Pediatrics; Kuo, D.Z.; Apkon, S.; Davidson, L.F.; Ellerbeck, K.A.; Foster, J.E.A.; Noritz, G.H.; et al. Identification, Evaluation, and Management of Children With Autism Spectrum Disorder. Pediatrics 2020, 145, e20193447. [Google Scholar] [CrossRef] [PubMed] [Green Version]
  6. Bishop, D.V.M.; Snowling, M.J.; Thompson, P.A.; Greenhalgh, T. CATALISE consortium CATALISE: A Multinational and Multidisciplinary Delphi Consensus Study. Identifying Language Impairments in Children. PLoS ONE 2016, 11, e0158753. [Google Scholar] [CrossRef] [PubMed] [Green Version]
  7. Hobson, H.; Kalsi, M.; Cotton, L.; Forster, M.; Toseeb, U. Supporting the Mental Health of Children with Speech, Language and Communication Needs: The Views and Experiences of Parents. Autism Dev. Lang. Impair. 2022, 7, 239694152211011. [Google Scholar] [CrossRef]
  8. Pandria, N.; Petronikolou, V.; Lazaridis, A.; Karapiperis, C.; Kouloumpris, E.; Spachos, D.; Fachantidis, A.; Vasiliou, D.; Vlahavas, I.; Bamidis, P. Information System for Symptom Diagnosis and Improvement of Attention Deficit Hyperactivity Disorder: Protocol for a Nonrandomized Controlled Pilot Study. JMIR Res. Protoc. 2022, 11, e40189. [Google Scholar] [CrossRef]
  9. Kim, H.H.; An, J.I.; Park, Y.R. A Prediction Model for Detecting Developmental Disabilities in Preschool-Age Children Through Digital Biomarker-Driven Deep Learning in Serious Games: Development Study. JMIR Serious Games 2021, 9, e23130. [Google Scholar] [CrossRef] [PubMed]
  10. Kanhirakadavath, M.R.; Chandran, M.S.M. Investigation of Eye-Tracking Scan Path as a Biomarker for Autism Screening Using Machine Learning Algorithms. Diagnostics 2022, 12, 518. [Google Scholar] [CrossRef]
  11. Wang, X.; Yang, S.; Tang, M.; Yin, H.; Huang, H.; He, L. HypernasalityNet: Deep Recurrent Neural Network for Automatic Hypernasality Detection. Int. J. Med. Inf. 2019, 129, 1–12. [Google Scholar] [CrossRef]
  12. Muppidi, A.; Radfar, M. Speech Emotion Recognition Using Quaternion Convolutional Neural Networks. In Proceedings of the ICASSP 2021–2021 IEEE International Conference on Acoustics, Speech and Signal Processing (ICASSP), Toronto, ON, Canada, 6–11 June 2021; IEEE: Toronto, ON, Canada, 2021; pp. 6309–6313. [Google Scholar]
  13. Kadiri, S.R.; Javanmardi, F.; Alku, P. Convolutional Neural Networks for Classification of Voice Qualities from Speech and Neck Surface Accelerometer Signals. In Proceedings of the Interspeech 2022, Incheon, Republic of Korea, 18–22 September 2022; pp. 5253–5257. [Google Scholar]
  14. Georgoulas, G.; Georgopoulos, V.C.; Stylios, C.D. Speech Sound Classification and Detection of Articulation Disorders with Support Vector Machines and Wavelets. In Proceedings of the 2006 International Conference of the IEEE Engineering in Medicine and Biology Society, New York, NY, USA, 30 August 2006; pp. 2199–2202. [Google Scholar]
  15. Georgopoulos, V.C. Advanced Time-Frequency Analysis and Machine Learning for Pathological Voice Detection. In Proceedings of the 2020 12th International Symposium on Communication Systems, Networks and Digital Signal Processing (CSNDSP), Oline, 20–22 July 2020; pp. 1–5. [Google Scholar]
  16. Georgopoulos, V.C.; Chouliara, S.; Stylios, C.D. Fuzzy Cognitive Map Scenario-Based Medical Decision Support Systems for Education. In Proceedings of the 2014 36th Annual International Conference of the IEEE Engineering in Medicine and Biology Society, Chicago, IL, USA, 26–30 August 2014; IEEE: Chicago, IL, USA, 2014; pp. 1813–1816. [Google Scholar]
  17. Brasil, S.; Pascoal, C.; Francisco, R.; dos Reis Ferreira, V.; Videira, P.A.; Valadão, G. Artificial Intelligence (AI) in Rare Diseases: Is the Future Brighter? Genes 2019, 10, 978. [Google Scholar] [CrossRef] [Green Version]
  18. Hirsch, M.C.; Ronicke, S.; Krusche, M.; Wagner, A.D. Rare Diseases 2030: How Augmented AI Will Support Diagnosis and Treatment of Rare Diseases in the Future. Ann. Rheum. Dis. 2020, 79, 740–743. [Google Scholar] [CrossRef] [Green Version]
  19. Chen, Y.; Li, Y.; Wu, M.; Lu, F.; Hou, M.; Yin, Y. Differentiating Crohn’s Disease from Intestinal Tuberculosis Using a Fusion Correlation Neural Network. Knowl.-Based Syst. 2022, 244, 108570. [Google Scholar] [CrossRef]
  20. Rello, L.; Baeza-Yates, R.; Ali, A.; Bigham, J.P.; Serra, M. Predicting Risk of Dyslexia with an Online Gamified Test. PLoS ONE 2020, 15, e0241687. [Google Scholar] [CrossRef]
  21. Bishop, C. Neural Networks for Pattern Recognition; Oxford University Press: Oxford, UK, 1995. [Google Scholar]
  22. Cybenko, G. Approximation by Superpositions of a Sigmoidal Function. Math. Control. Signals Syst. 1989, 2, 303–314. [Google Scholar] [CrossRef]
  23. Baldi, P.; Cranmer, K.; Faucett, T.; Sadowski, P.; Whiteson, D. Parameterized Neural Networks for High-Energy Physics. Eur. Phys. J. C 2016, 76, 1–7. [Google Scholar] [CrossRef] [Green Version]
  24. Valdas, J.J.; Bonham-Carter, G. Time Dependent Neural Network Models for Detecting Changes of State in Complex Processes: Applications in Earth Sciences and Astronomy. Neural Netw. 2006, 19, 196–207. [Google Scholar] [CrossRef]
  25. Carleo, M.T.G. Solving the Quantum Many-Body Problem with Artificial Neural Networks. Science 2017, 355, 602–606. [Google Scholar] [CrossRef] [Green Version]
  26. Shirvany, Y.; Hayati, M.; Moradian, R. Multilayer Perceptron Neural Networks with Novel Unsupervised Training Method for Numerical Solution of the Partial Differential Equations. Appl. Soft Comput. 2009, 9, 20–29. [Google Scholar] [CrossRef]
  27. Malek, A.; Beidokhti, R.S. Numerical Solution for High Order Differential Equations Using a Hybrid Neural Network—Optimization Method. Appl. Math. Comput. 2006, 183, 260–271. [Google Scholar] [CrossRef]
  28. Topuz, A. Predicting Moisture Content of Agricultural Products Using Artificial Neural Networks. Adv. Eng. Softw. 2010, 41, 464–470. [Google Scholar] [CrossRef]
  29. Escamilla-García, A.; Soto-Zarazúa, G.M.; Toledano-Ayala, M.; Rivas-Araiza, E.; Gastélum-Barrios, A. Abraham, Applications of Artificial Neural Networks in Greenhouse Technology and Overview for Smart Agriculture Development. Appl. Sci. 2020, 10, 3835. [Google Scholar] [CrossRef]
  30. Shen, L.; Wu, J.; Yang, W. Multiscale Quantum Mechanics/Molecular Mechanics Simulations with Neural Networks. J. Chem. Theory Comput. 2016, 12, 4934–4946. [Google Scholar] [CrossRef] [PubMed]
  31. Manzhos, S.; Dawes, R.; Carrington, T. Neural Network-based Approaches for Building High Dimensional and Quantum Dynamics-friendly Potential Energy Surfaces, Int. J. Quantum Chem. 2015, 115, 1012–1020. [Google Scholar] [CrossRef] [Green Version]
  32. Wei, J.N.; Duvenaud, D.; Aspuru-Guzik, A. Neural Networks for the Prediction of Organic Chemistry Reactions. ACS Cent. Sci. 2016, 2, 2–725. [Google Scholar] [CrossRef] [PubMed]
  33. Falat, L.; Pancikova, L. Quantitative Modelling in Economics with Advanced Artificial Neural Networks. Procedia Econ. Financ. 2015, 34, 194–201. [Google Scholar] [CrossRef] [Green Version]
  34. Namazi, M.; Shokrolahi, A.; Maharluie, M.S. Detecting and Ranking Cash Flow Risk Factors via Artificial Neural Networks Technique. J. Bus. Res. 2016, 69, 1801–1806. [Google Scholar] [CrossRef]
  35. Tkacz, G. Neural Network Forecasting of Canadian GDP Growth. Int. J. Forecast. 2001, 17, 57–69. [Google Scholar] [CrossRef]
  36. Baskin, I.I.; Winkler, D.; Igor, V.; Tetko, A. Renaissance of Neural Networks in Drug Discovery. Expert Opin. Drug Discov. 2016, 11, 785–795. [Google Scholar] [CrossRef] [PubMed]
  37. Bartzatt, R. Prediction of Novel Anti-Ebola Virus Compounds Utilizing Artificial Neural Network (ANN). Chem. Fac. Publ. 2018, 49, 16–34. [Google Scholar]
  38. Yadav, A.K.; Chandel, S.S. Solar Radiation Prediction Using Artificial Neural Network Techniques: A Review. Renew. Sustain. Energy Rev. 2014, 33, 772–781. [Google Scholar] [CrossRef]
  39. Mahmood, M.A.; Visan, A.I.; Ristoscu, C.; Mihailescu, I.N. Artificial Neural Network Algorithms for 3D Printing. Materials 2021, 14, 163. [Google Scholar] [CrossRef] [PubMed]
  40. Prisciandaro, E.; Sedda, G.; Cara, A.; Diotti, C.; Spaggiari, L.; Bertolaccini, L. Artificial Neural Networks in Lung Cancer Research: A Narrative Review. J. Clin. Med. 2023, 12, 880. [Google Scholar] [CrossRef]
  41. Rumelhart, D.E.; Hinton, G.E.; Williams, R.J. Learning Representations by Back-Propagating Errors. Nature 1986, 323, 533–536. [Google Scholar] [CrossRef]
  42. Chen, T.; Zhong, S. Privacy-Preserving Backpropagation Neural Network Learning. IEEE Trans. Neural Netw. 2009, 20, 1554–1564. [Google Scholar] [CrossRef] [PubMed]
  43. Riedmiller, M.; Braun, A.H. Direct Adaptive Method for Faster Backpropagation Learning: The RPROP Algorithm. In Proceedings of the IEEE International Conference on Neural Networks, San Francisco, CA, USA, 28 March–1 April 1993; pp. 586–591. [Google Scholar]
  44. Pajchrowski, T.; Zawirski, K.; Nowopolski, K. Neural Speed Controller Trained Online by Means of Modified RPROP Algorithm. IEEE Trans. Ind. Inform. 2015, 11, 560–568. [Google Scholar] [CrossRef]
  45. Hermanto, R.P.S.; Suharjito, D.; Nugroho, A. Waiting-Time Estimation in Bank Customer Queues Using RPROP Neural Networks. Procedia Comput. Sci. 2018, 135, 35–42. [Google Scholar] [CrossRef]
  46. Robitaille, B.; Marcos, B.; Veillette, M.; Payre, G. Modified Quasi-Newton Methods for Training Neural Networks. Comput. Chem. Eng. 1996, 20, 1133–1140. [Google Scholar] [CrossRef]
  47. Liu, Q.; Liu, J.; Sang, R.; Li, J.; Zhang, T.; Zhang, Q. Fast Neural Network Training on FPGA Using Quasi-Newton Optimization Method. IEEE Trans. Very Large Scale Integr. (VLSI) Syst. 2018, 26, 1575–1579. [Google Scholar] [CrossRef]
  48. Yamazaki, A.; De Souto, M.C.P.; Ludermir, T.B. Optimization of neural network weights and architectures for odor recognition using simulated annealing. In Proceedings of the 2002 International Joint Conference on Neural Networks, Honolulu, HI, USA, 12–17 May 2002; pp. 527–533. [Google Scholar]
  49. Da, Y.; Xiurun, G. An Improved PSO-Based ANN with Simulated Annealing Technique. Neurocomputing 2005, 63, 527–533. [Google Scholar] [CrossRef]
  50. Leung, F.H.F.; Lam, H.K.; Ling, S.H.; Tam, P.K.S. Tuning of the Structure and Parameters of a Neural Network Using an Improved Genetic Algorithm. IEEE Trans. Neural Netw. 2003, 14, 79–88. [Google Scholar] [CrossRef] [Green Version]
  51. Yao, X. Evolving Artificial Neural Networks. Proc. IEEE 1999, 87, 1423–1447. [Google Scholar]
  52. Zhang, C.; Shao, H.; Li, Y. Particle Swarm Optimisation for Evolving Artificial Neural Network. In Proceedings of the Smc 2000 conference proceedings, Nashville, TN, USA, 8–11 October 2000; pp. 2487–2490. [Google Scholar]
  53. Yu, Q.; Liu, Z.-H.; Lei, T.; Tang, Z. Subjective Evaluation of the Frequency of Coffee Intake and Relationship to Osteoporosis in Chinese Men. J. Health Popul. Nutr. 2016, 35, 1–7. [Google Scholar] [CrossRef] [PubMed] [Green Version]
  54. Hery, M.A.; Ibrahim, M.; June, L.W. BFGS Method: A New Search Direction. Sains Malays. 2014, 43, 1591–1597. [Google Scholar]
  55. Christou, V.; Miltiadous, A.; Tsoulos, I.; Karvounis, E.; Tzimourta, K.D.; Tsipouras, M.G.; Anastasopoulos, N.; Tzallas, A.T.; Giannakeas, N. Evaluating the Window Size’s Role in Automatic EEG Epilepsy Detection. Sensors 2022, 22, 9233. [Google Scholar] [CrossRef] [PubMed]
  56. Holland, J.H. Adaptation in Natural and Artificial Systems: An Introductory Analysis with Applications to Biology, Control, and Artificial Intelligence; MIT Press: Cambridge, MA, USA, 1992. [Google Scholar]
  57. Goldberg, D.E. Genetic Algorithms; Pearson Education India: Noida, India, 2013. [Google Scholar]
  58. Michalewicz, Z. Genetic Algorithms+ Data Structures= Evolution Programs. Comput. Stat. 1996, 372–373. [Google Scholar]
  59. Kennedy, J.; Eberhart, R. Particle Swarm Optimization. In Proceedings of the ICNN’95—International Conference on Neural Networks, Perth, WA, Australia, 27 November–1 December 1995; IEEE: Perth, WA, Australia, 1995; Volume 4, pp. 1942–1948. [Google Scholar]
  60. Epitropakis, M.G.; Plagianakos, V.P.; Vrahatis, M.N. Evolving Cognitive and Social Experience in Particle Swarm Optimization through Differential Evolution: A Hybrid Approach. Inf. Sci. 2012, 216, 50–92. [Google Scholar] [CrossRef] [Green Version]
  61. Wang, W.; Wu, J.-M.; Liu, J.-H. A Particle Swarm Optimization Based on Chaotic Neighborhood Search to Avoid Premature Convergence. In Proceedings of the 2009 Third International Conference on Genetic and Evolutionary Computing, Guilin, China, 14–17 October 2009; IEEE: Guilin, China, 2009; pp. 633–636. [Google Scholar]
  62. Eberhart, R.C.; Shi, Y. Tracking and Optimizing Dynamic Systems with Particle Swarms. In Proceedings of the 2001 Congress on Evolutionary Computation (IEEE Cat. No.01TH8546), Seoul, Republic of Korea, 27–30 May 2001; IEEE: Seoul, Republic of Korea, 2001; Volume 1, pp. 94–100. [Google Scholar]
  63. Tsoulos, I.G.; Tzallas, A.; Karvounis, E. A Rule-Based Method to Locate the Bounds of Neural Networks. Knowledge 2022, 2, 412–428. [Google Scholar] [CrossRef]
  64. Kingma, D.P.; Ba, J. Adam: A Method for Stochastic Optimization. arXiv 2014, arXiv:1412.6980. [Google Scholar] [CrossRef]
  65. Cunningham, P.; Delany, S.J. K-Nearest Neighbour Classifiers—A Tutorial. ACM Comput. Surv. 2022, 54, 1–25. [Google Scholar] [CrossRef]
  66. Fix, E.; Hodges, J. Discriminatory Analysis, Nonparametric Discrimination; USAF School of Aviation Medicine: Randolph Field, OH, USA, 1951. [Google Scholar]
  67. Cortes, C.; Vapnik, V. Support-Vector Networks. Mach. Learn. 1995, 20, 273–297. [Google Scholar] [CrossRef]
  68. Burges, C.J. A Tutorial on Support Vector Machines for Pattern Recognition. Data Min. Knowl. Discov. 1998, 2, 121–167. [Google Scholar] [CrossRef]
  69. Toki, E.I.; Zakopoulou, V.; Tatsis, G.; Plachouras, K.; Siafaka, V.; Kosma, E.I.; Chronopoulos, S.K.; Filippidis, D.E.; Nikopoulos, G.; Pange, J.; et al. A Game-Based Smart System Identifying Developmental Speech and Language Disorders in Child Communication: A Protocol Towards Digital Clinical Diagnostic Procedures. In New Realities, Mobile Systems and Applications; Auer, M.E., Tsiatsos, T., Eds.; Lecture Notes in Networks and Systems; Springer: Cham, Switzerland, 2022; Volume 411, pp. 559–568. ISBN 978-3-030-96295-1. [Google Scholar]
  70. Unity® 2022. Available online: https://unity.com/ (accessed on 15 February 2022).
  71. CMUSphinx 2016. Available online: https://cmusphinx.github.io/ (accessed on 20 October 2022).
  72. Pantazoglou, F.K.; Papadakis, N.K.; Kladis, G.P. Implementation of the Generic Greek Model for CMU Sphinx Speech Recognition Toolkit. In Proceedings of the eRA-12 International Scientific, Athens, Greece, 24–26 October 2017. [Google Scholar]
  73. SeeSo: Eye Tracking Software 2022. Available online: https://manage.seeso.io/#/console/sdk (accessed on 10 November 2022).
  74. Borys, M.; Plechawska-Wójcik, M. Eye-Tracking Metrics in Perception and Visual Attention Research. EJMT 2017, 3, 11–23. [Google Scholar]
  75. Powell, M.J.D. A Tolerant Algorithm for Linearly Constrained Optimization Calculations. Math. Program. 1989, 45, 547–566. [Google Scholar] [CrossRef]
  76. Grady, S.A.; Hussaini, M.Y.; Abdullah, M.M. Placement of Wind Turbines Using Genetic Algorithms. Renew. Energy 2005, 30, 259–270. [Google Scholar] [CrossRef]
  77. Charilogis, V.; Tsoulos, I.G. Toward an Ideal Particle Swarm Optimizer for Multidimensional Functions. Information 2022, 13, 217. [Google Scholar] [CrossRef]
  78. Chang, C.-C.; Lin, C.-J. LIBSVM: A Library for Support Vector Machines. ACM Trans. Intell. Syst. Technol. TIST 2011, 2, 1–27. [Google Scholar] [CrossRef]
  79. Sim, G.; Bond, R. Eye Tracking in Child Computer Interaction: Challenges and Opportunities. Int. J. Child-Comput. Interact. 2021, 30, 100345. [Google Scholar] [CrossRef]
  80. Jeong, S.-H.; Lee, T.R.; Kang, J.B.; Choi, M.-T. Analysis of Health Insurance Big Data for Early Detection of Disabilities: Algorithm Development and Validation. JMIR Med. Inform. 2020, 8, e19679. [Google Scholar] [CrossRef]
Figure 1. Eye-tracking results.
Mathematics 11 01643 g001
Figure 2. Heart rate results.
Mathematics 11 01643 g002
Figure 3. Game play results.
Mathematics 11 01643 g003
Table 1. Variables from scores of the game activities.
Variable DescriptionCount
Object recognition6
Click on objects7
Vocal intensity1
Verbal response6
Memory task2
Emotion recognition3
Hearing test1
Puzzle solving2
Moving objects2
Total30
Table 2. Variables from the heart rate statistics.
Variable DescriptionCount
Mean HR5
HR standard deviation5
HR total range5
Total15
Table 3. Variables from the eye-tracking metrics.
Variable DescriptionCount
Fixation counts10
Time spent6
Total16
Table 4. Target variables defining the classes.
Target Variable NameDescription
DisorderAny disorder of the following
ASDAutism spectrum disorder
ADHDAttention deficit hyperactivity disorder
IDIntellectual disability
SLDSpecific learning disorder
CDCommunication disorders
Table 5. Comparison of classification methods using error rate (%) for the eye-tracking dataset.
ClassBFGSGeneticPSOINNADAMKNNSVM
Disorder19.5317.7614.148.6715.4628.7824.53
ASD27.0724.3225.5919.9425.6627.0024.97
ADHD27.3023.4223.4219.6925.4529.0030.00
ID40.3031.5037.3326.6337.1042.0032.00
SLD29.4425.6825.8822.4926.1725.0027.33
CD29.4625.4927.9623.7826.9726.3324.67
Average28.8524.7025.7220.2026.1429.6927.25
Table 6. Comparison of classification methods using error rate (%) for the heart rate dataset.
ClassBFGSGeneticPSOINNADAMKNNSVM
Disorder29.2621.2622.0918.9520.5422.2224.33
ASD32.3120.6123.1919.8320.8522.2220.12
ADHD34.1121.1126.6919.8921.4325.5623.33
ID31.1320.8924.9819.6120.7123.8920.00
SLD32.9819.1722.0219.0620.6523.8923.18
CD31.6120.1720.4820.0221.2223.8924.63
Average31.9020.5423.2519.5620.9023.6122.60
Table 7. Comparison of classification methods using error rate (%) for the game scores dataset.
ClassBFGSGeneticPSOINNADAMKNNSVM
Disorder25.9221.9224.3718.9523.4524.4223.49
ASD28.8420.9625.4220.3923.0523.4926.66
ADHD29.6421.5429.6221.5223.4726.5124.80
ID29.6222.6426.6721.2523.4726.5124.80
SLD30.2222.5927.1521.9521.5626.2829.33
CD30.6122.2525.9222.5723.2823.2523.91
Average29.1421.9826.5321.1123.0224.8125.86
Table 8. Precision and recall metrics for Genetic and INN for corresponding datasets.
DatasetGenetic PrecisionGenetic RecallINN
Precision
INN
Recall
Eye Tracking0.760.730.880.84
Heart Rate0.660.630.700.66
Game Responses0.690.580.750.62
Disclaimer/Publisher’s Note: The statements, opinions and data contained in all publications are solely those of the individual author(s) and contributor(s) and not of MDPI and/or the editor(s). MDPI and/or the editor(s) disclaim responsibility for any injury to people or property resulting from any ideas, methods, instructions or products referred to in the content.

