Article

Brain Tumor Segmentation Using a Patch-Based Convolutional Neural Network: A Big Data Analysis Approach

1
Department of Computer Science and Software Engineering, International Islamic University, Islamabad 44000, Pakistan
2
Department of Computer Science, Abdul Wali Khan University, Mardan 23200, Pakistan
3
Department of Computer Science, Bacha Khan University, Charsadda 24420, Pakistan
4
Department of Information and Communication Engineering, Yeungnam University, Gyeongsan 38541, Republic of Korea
*
Author to whom correspondence should be addressed.
Mathematics 2023, 11(7), 1635; https://doi.org/10.3390/math11071635
Submission received: 23 February 2023 / Revised: 7 March 2023 / Accepted: 27 March 2023 / Published: 28 March 2023
(This article belongs to the Special Issue Big Data and Complex Networks)

Abstract

:
Early detection of brain tumors is critical to ensure successful treatment, and medical imaging is essential in this process. However, analyzing the large amount of medical data generated from various sources such as magnetic resonance imaging (MRI) has been a challenging task. In this research, we propose a method for early brain tumor segmentation using big data analysis and patch-based convolutional neural networks (PBCNNs). We utilize BraTS 2012–2018 datasets. The data is preprocessed through various steps such as profiling, cleansing, transformation, and enrichment to enhance the quality of the data. The proposed CNN model utilizes a patch-based architecture with global and local layers that allows the model to analyze different parts of the image with varying resolutions. The architecture takes multiple input modalities, such as T1, T2, T2-c, and FLAIR, to improve the accuracy of the segmentation. The performance of the proposed model is evaluated using various metrics, such as accuracy, sensitivity, specificity, Dice similarity coefficient, precision, false positive rate, and true positive rate. Our results indicate that the proposed method outperforms the existing methods and is effective in early brain tumor segmentation. The proposed method can also assist medical professionals in making accurate and timely diagnoses, and thus improve patient outcomes, which is especially critical in the case of brain tumors. This research also emphasizes the importance of big data analysis in medical imaging research and highlights the potential of PBCNN models in this field.
MSC:
94A16; 68T07; 68T09; 68U10; 54H30; 54H30

1. Introduction

Brain tumors are a serious and potentially life-threatening condition that affects a significant number of people worldwide. According to the American Brain Tumor Association, the number of new cases of primary brain tumors was expected to reach over 87,000 in the United States in 2021. The early detection and accurate segmentation of brain tumors are critical for successful treatment and improved patient outcomes [1]. Early and accurate detection is important in ensuring successful treatment and improving patient outcomes [2]. MRI is a key medical imaging tool that provides detailed information about the location and size of the tumor [3]. However, analyzing the large amount of medical data generated from various sources has been a challenging task for medical professionals. Manual brain tumor segmentation is a time-consuming process that can be prone to errors, especially in cases where tumors have irregular shapes, sizes, and appearances [4]. Therefore, there is a need for automated methods for brain tumor segmentation that can improve the efficiency and accuracy of the process. In the last decade, deep learning-based approaches, especially convolutional neural networks (CNNs), have shown promise in medical image analysis and tumor segmentation [5,6]. However, many existing CNN-based approaches have limitations such as low accuracy, lack of interpretability, and inability to handle multi-modal data [7]. To address these limitations, a patch-based CNN is proposed for brain tumor segmentation using big data analysis. In this research, we utilize a dataset, including BraTS 2012–2018, which consists of thousands of MRI scans. This dataset includes a variety of brain tumor types and provides a broad range of images with different levels of complexity, making them ideal for training and validating our proposed method. The proposed CNN model utilizes a patch-based architecture that allows the model to analyze different parts of the image with varying resolutions. This architecture takes in multiple input modalities, such as T1, T2-c, T2, and fluid-attenuated inversion recovery (FLAIR), to improve the accuracy of the segmentation. Four primary MRI sequences are used in diagnosing and evaluating brain tumors. T1 provides information on the brain’s anatomy, while T2 indicates the distribution of water in brain tissue. T2-c uses a contrast agent to highlight areas where the blood–brain barrier is disrupted, as is the case in tumor-affected regions. FLAIR suppresses fluid signals. Moreover, in this study we present a big data analysis approach that includes data profiling, cleansing, transformation, and enrichment to enhance the quality of the data and improve the accuracy of the model. This study highlights the existing issues in CNN-based methods for brain tumor segmentation. Additionally, our proposed method includes a big data analysis approach that enhances the quality of the medical data, thus improving the accuracy of the system. The outcome of the proposed model is evaluated using various metrics such as Dice similarity coefficient, accuracy, sensitivity, specificity, precision, true positive rate, and false positive rate. The results show that the proposed model outperforms the existing methods and is effective in early segmentation of brain tumors. We also provide a detailed analysis of the strengths and weaknesses of the proposed method and compare it with existing approaches to highlight its advantages and limitations. The proposed method can also assist medical professionals in making accurate and timely diagnoses, and thus improve patient outcomes, which is especially critical in the case of brain tumors. This research emphasizes the importance of big data analysis in medical imaging research and highlights the potential of patch-based CNN models in this field. The proposed work utilizes a patch-based convolutional neural network for accurate brain tumor segmentation from MRI scans.
  • A big data analysis approach is employed for data preprocessing and enrichment, enhancing the quality of the medical data and improving the accuracy of the model.
  • An early detection method and comparative analysis are provided to assist medical professionals in making accurate and timely diagnoses, thereby improving patient outcomes.
  • The proposed method is compared with existing approaches and its advantages and limitations are highlighted.
The study emphasizes the importance of big data analysis in medical imaging research and highlights the potential of patch-based CNN models in this field.
Our proposed model provides a powerful and efficient tool for the early classification and precise segmentation of brain tumors, which can significantly improve patient outcomes and precious lives.
The structure of the article is organized as follows: in Section 2, an overview of the current state of the art is provided. Section 3 covers the proposed model, while Section 4 presents the results and corresponding discussion. Finally, Section 5 concludes the study.

2. Background

In this section, we review the most recent literature on brain tumor segmentation, patch-based convolutional neural networks, big data analysis, and multi-modal brain tumor segmentation using a patch-based CNN.

2.1. Brain Tumor Segmentation

Segmentation of brain tumors is a challenging task in medical image analysis due to the heterogeneity of tumors and the complexity of brain anatomy. Accurate segmentation of brain tumors can assist clinicians in identifying the location, size, and shape of tumors, as well as assessing their growth and response to treatment [8]. Various approaches have been suggested for segmentation of brain tumors, including traditional image processing techniques and machine learning-based approaches [9]. The CNN is a popular machine learning-based technique for brain tumor segmentation. CNNs have shown promising results in several studies, achieving high accuracy in tumor segmentation. For example, Kamnitsas et al. [10] suggested a 3D-CNN architecture for multi-modal brain tumor segmentation, achieving state-of-the-art results on the BraTS dataset. Similarly, Isensee et al. [11] developed a U-net based self-adapting model for medical image segmentation, achieving higher accuracy on the BraTS dataset. However, the heterogeneity of tumors remains a significant challenge in brain tumor segmentation. To address this challenge, several studies have proposed multi-modal imaging techniques that combine different MRI sequences to provide complementary information about tumor characteristics. For example, Bakas et al. [8] used a multi-modal CNN approach that combined T1, T2, T2-contrast, and FLAIR MRI images to achieve state-of-the-art performance on the BraTS 2017 dataset. Another challenge in segmentation of brain tumors is the class imbalance problem. In the images, the volume of non-tumor voxels is significantly greater than that of tumor voxels. To address this challenge, several studies have proposed methods such as data augmentation by Sandfort et al. [12], weighted loss functions by Bakas et al. [13], and postprocessing techniques by Wang et al. [14] to improve segmentation accuracy. In addition to CNN-based methods, several other machine learning-based approaches have been proposed for segmentation brain tumors, including support vector machine (SVM) by Kofler et al. [15] and random forests by Zikic et al. [16]. These methods have shown good performance on various datasets but have been largely overshadowed by the recent success of CNNs. Despite the promising results of machine learning-based approaches, they also have limitations. Obtaining labeled data is one of the primary obstacles in medical imaging due to the scarcity of annotated datasets, which makes it difficult to gather the significant amounts of labeled data necessary for training machine learning models. To address this challenge, several studies have proposed methods such as transfer learning by Havaei et al. [17] and data augmentation by Wang et al. [14] to improve model performance with limited training data. You et al. [18] discuss the use of sequential monitoring of patients’ health-related quality of life scores to detect disease.
In conclusion, brain tumor segmentation is an active research area with many challenges and opportunities for improvement. Machine learning-based approaches, particularly CNNs, have shown promise in achieving high accuracy in brain tumor segmentation. However, further research is needed to address the challenges of heterogeneity, class imbalance, and limited data availability, as well as to develop methods for more efficient and interpretable segmentation.

2.2. Patch-Based Convolutional Neural Network

The patch-based convolutional neural network (CNN) is a popular deep learning technique used in computer vision applications, including, but not limited to, image classification, object detection, and segmentation [19]. The fundamental concept of the patch-based convolutional neural network (CNN) involves partitioning the input image into smaller patches, which are individually processed using a CNN. The output from each patch is then combined to generate the final prediction for the input image. One of the earliest applications of a patch-based CNN was object detection, where the approach was used to generate object proposals. In this method, the input image is partitioned into patches, and each patch is evaluated by a CNN to produce a detection score for the presence of an object. The patches with high scores were then combined to generate object proposals, which were further refined by a second CNN. The patch-based convolutional neural network (CNN) has also demonstrated potential in medical image analysis, exhibiting favorable outcomes in tasks such as classification and segmentation. For example, a patch-based CNN was used for brain tumor segmentation from MRI scans. By surpassing traditional machine learning and other deep learning techniques, the patch-based convolutional neural network (CNN) achieved state-of-the-art results on a benchmark dataset. Furthermore, numerous studies have established the efficacy of patch-based CNNs in tasks such as brain tumor detection and segmentation. For example, Glioma Segmentation Challenge (BraTS) datasets have been used in various studies for evaluating patch-based CNN approaches for brain tumor analysis, such as the 3D U-Net approach proposed by Çiçek et al. [20] and the DeepMedic approach proposed by Kamnitsas et al. [10]. Both studies reported promising results for brain tumor segmentation using patch-based CNNs. In addition, some studies have proposed new modifications to the basic patch-based CNN architecture to improve its performance in brain tumor analysis. For example, Isensee et al. [11] proposed the nnU-Net architecture in 2018, which uses a cascade of patch-based CNNs with increasing resolution to improve the accuracy of brain tumor segmentation. Another modification was proposed by Zhang et al. [21], who introduced a separable and dilated residual U-net for MRI brain tumor segmentation [4]. Overall, patch-based CNNs have shown great potential for brain tumor analysis in medical imaging, providing a powerful and flexible tool for accurately and efficiently processing complex and large medical images.
In conclusion, the patch-based CNN is a useful approach for handling large and varying image sizes. It has shown promising results in various computer vision tasks, including object detection, medical image analysis, and remote sensing. However, the selection of patch size and overlap can significantly affect the performance of the approach, and additional processing is required to combine the outputs from each patch. Therefore, a patch-based CNN should be used with caution and with the appropriate tuning of its hyperparameters.

2.3. Big Data Analysis

The use of big data analytics in healthcare has become increasingly important in recent years, with the potential to revolutionize medical research and clinical practice. In the field of brain tumor research, big data analysis has been used to improve our understanding of the disease, predict patient outcomes, and make treatment decisions. Previous studies have shown that machine learning algorithms can be used to analyze large datasets of brain tumor imaging data and extract meaningful features that are predictive of patient outcomes. For example, Wu et al. [22] used a CNN to analyze MRI data from 563 patients with glioma, and found that the CNN was able to accurately predict patient survival outcomes. Similarly, Wulczyn et al. [23] used a deep learning model to analyze MRI data from 475 patients with glioblastoma, and found that the model was able to predict patient survival outcomes and treatment response. Other studies have used big data analysis to identify new biomarkers and potential therapeutic targets for brain tumors. For example, Sathornsumetee et al. [24] used a machine learning algorithm to analyze gene expression data from over 2000 glioblastoma patients and identified a set of genes that were associated with patient survival outcomes. Similarly, Molinaro et al. [25] used a machine learning algorithm to analyze genomic and clinical data from over 10,000 patients with glioblastoma, and identified sub-types of the disease that were associated with different treatment responses. The use of big data analysis in brain tumor research has also led to the development of new tools and resources for clinicians and researchers. For example, The Cancer Genome Atlas (TCGA) project has generated a comprehensive dataset of genomic and clinical data from over 12,000 patients with various types of cancer, including brain tumors (The Cancer Genome Atlas Research Network, 2008). This dataset has been used by researchers to identify new genetic mutations and pathways that are associated with brain tumors, and has led to the development of new diagnostic and therapeutic tools. Despite the potential of big data analysis in brain tumor research, there are also significant challenges and limitations. One major challenge is the lack of standardization and interoperability of data across different institutions and data sources. This can make it difficult to combine and compare data from different studies, and may limit the generalizability of findings. Additionally, the ethical and legal implications of using big data in healthcare are also complex and require careful consideration to ensure patient privacy and data security. Big data analysis has the potential to significantly improve our understanding of brain tumors and inform clinical practice. However, further research is needed to overcome the challenges and limitations of using big data in healthcare, and to ensure that the benefits of this approach are realized for patients and clinicians alike.

2.4. Multi-Modal Brain Tumor Segmentation using a Patch-Based CNN
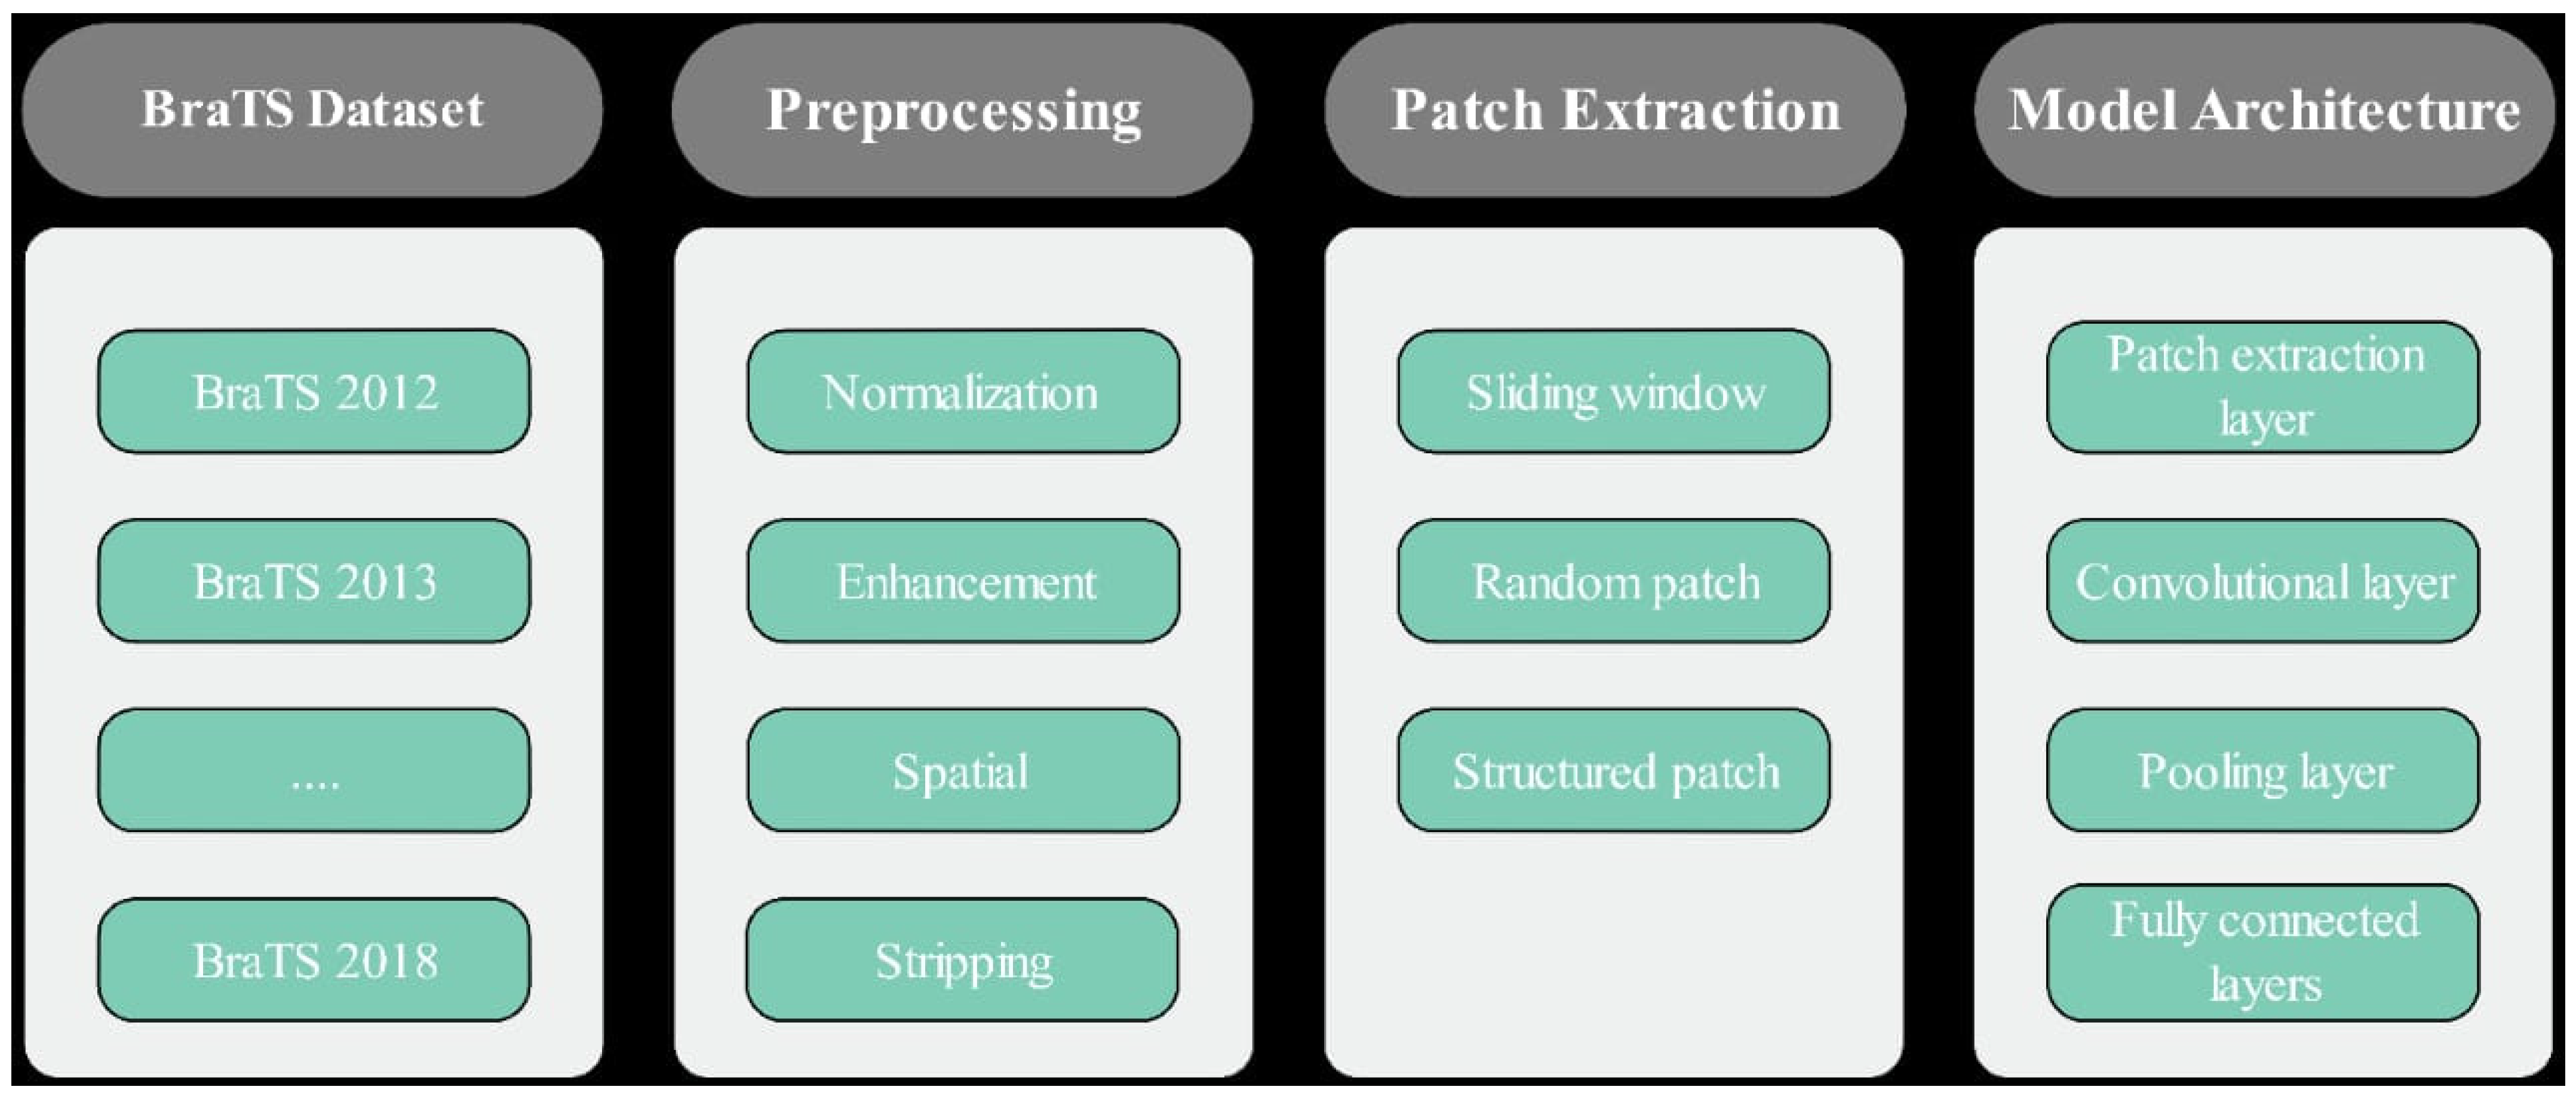
Multi-modal brain tumor segmentation is an important problem in medical image analysis, as it plays a critical role in treatment planning and monitoring for brain tumor patients. Several studies have proposed patch-based CNN models for multi-modal brain tumor segmentation. The patch-based approach involves dividing the input image into small patches and training the CNN to predict the tumor label for each patch. The predicted labels are then merged to obtain the final segmentation map. This approach has the advantage of reducing the memory requirements and computational time of the model. Havaei et al. [17] present a deep-learning model that combines both patch-based and full CNNs to segment brain tumors using T1-weighted, T2-weighted, and FLAIR MRI modalities. While the hybrid approach used in the model is innovative and shows promising results, the authors themselves acknowledge that the model requires a large amount of training data and may not be practical for use in clinical settings with limited data. Furthermore, some have raised concerns about the interpretability of the model, as deep neural networks can sometimes act as “black boxes” with little insight into how decisions are being made. Despite these limitations, the model represents an important contribution to the field of brain tumor segmentation and provides a valuable foundation for future research. Similarly, Myronenko et al. [26] proposed a 3D patch-based CNN with a dilated convolutional architecture for brain tumor segmentation. They used a multi-scale approach and incorporated contextual information to improve the segmentation performance. Their proposed model achieved state-of-the-art results on the BraTS 2017 dataset. Recently, some studies have also incorporated other modalities such as diffusion tensor imaging (DTI) and spectroscopy (MRS) in addition to conventional MRI modalities to improve the segmentation accuracy. For example, Nie et al. [27] proposed a multi-modal patch-based CNN that combines DTI and MRS with conventional MRI modalities for brain tumor segmentation. Their proposed model achieved the best results on the BraTS 2018 dataset.
The Background section highlights limitations and gaps in the existing literature and explains how the proposed study aims to address these limitations, as shown in Table 1. Additionally, it also includes the potential applications and benefits of accurate brain tumor segmentation.

3. Methodology

In this research, we proposed a PBCNN approach for brain tumor segmentation using a big data analysis approach as shown in Figure 1.

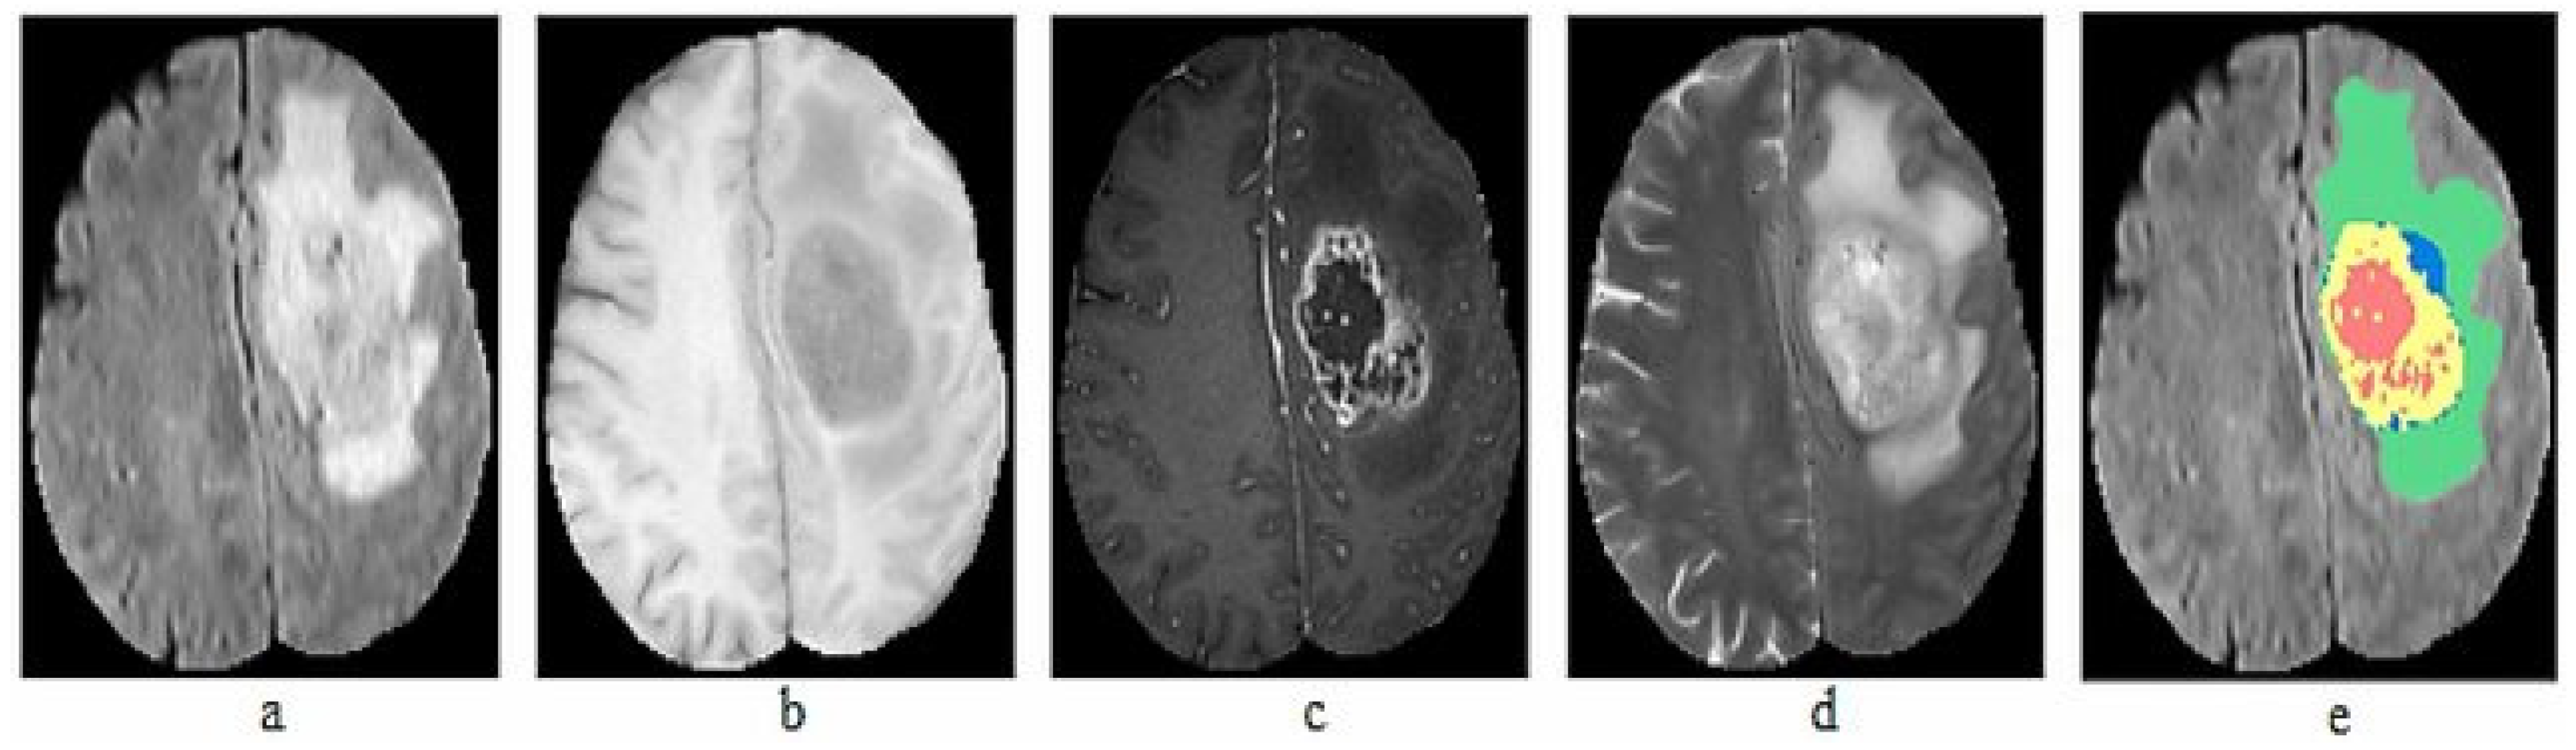
3.1. Data Acquisition

The primary objective of data acquisition is to obtain the medical imaging data that will be used in research. In the context of brain tumor segmentation, this involves obtaining MRI scans, CT scans, and other types of medical imaging that provide detailed images of the brain. There are several ways to obtain medical imaging data for research purposes. For example, researchers can collaborate with hospitals or medical facilities to obtain access to the required data. This may involve obtaining ethical approval, ensuring patient privacy, and complying with relevant laws and regulations. Researchers can also access public databases or repositories that contain medical imaging data from previous studies.
These databases can provide a large and diverse dataset that can be used to train machine learning algorithms. Once the data are obtained, they must be reviewed to ensure that they meet the requirements of the study. This includes checking that the data are in a suitable format for the machine learning algorithms, are of good quality, and in sufficient quantity to ensure accurate results. The imaging data may also need to be anonymized or de-identified to protect patient privacy. In this research, we used the BraTS dataset, which is widely used as a benchmark dataset for brain tumor segmentation. It has been released annually since 2012, with each release adding new data and challenges. A detailed description of BraTS datasets 2012 [28], 2013 [29], 2014 [30], 2015 [31], 2016 [32], 2017 [33], and 2018 [34] is given in Table 2.
The BraTS dataset is compiled from MRI scans of patients with brain tumors, contributed by multiple medical centers worldwide. The dataset includes anonymized scans and corresponding manual segmentations prepared by experienced radiologists. In total, we used seven datasets from 2012 to 2018, with a total of 564 images. The collected datasets include 5106 images of both HGG and LGG. Each patient in the dataset is represented by four MRI images and ground truth: T1, T1-c, T2, FLAIR volumes and Ground truth, as illustrated in Figure 2.

3.2. Data Preprocessing

Data preprocessing is a crucial step in the process of building a brain tumor segmentation model. This step aims to prepare the collected MRI images for analysis by removing noise and artifacts, correcting for any biases in the data, and ensuring that the images are in a standardized format. Different preprocessing and normalization techniques were used to achieve higher accuracy. The first step in data preprocessing is to enhance the quality of the images by removing any noise, artifacts, or other distortions that may affect the accuracy of the analysis. Filtering techniques i.e., Gaussian filtering and median filtering, were applied to the images to improve their quality. MRI images may have different intensity levels due to variations in the imaging process. Intensity normalization techniques are applied to bring the intensities of the images into a comparable range, making it easier to compare images from different sources. In Table 3, we show real data from the BraTS dataset to provide more precise information on the images that were discarded during preprocessing. We have included the image ID, dataset, reason for discarding, discard method (whether it was carried out automatically), and image quality (rated as poor, fair, or good).

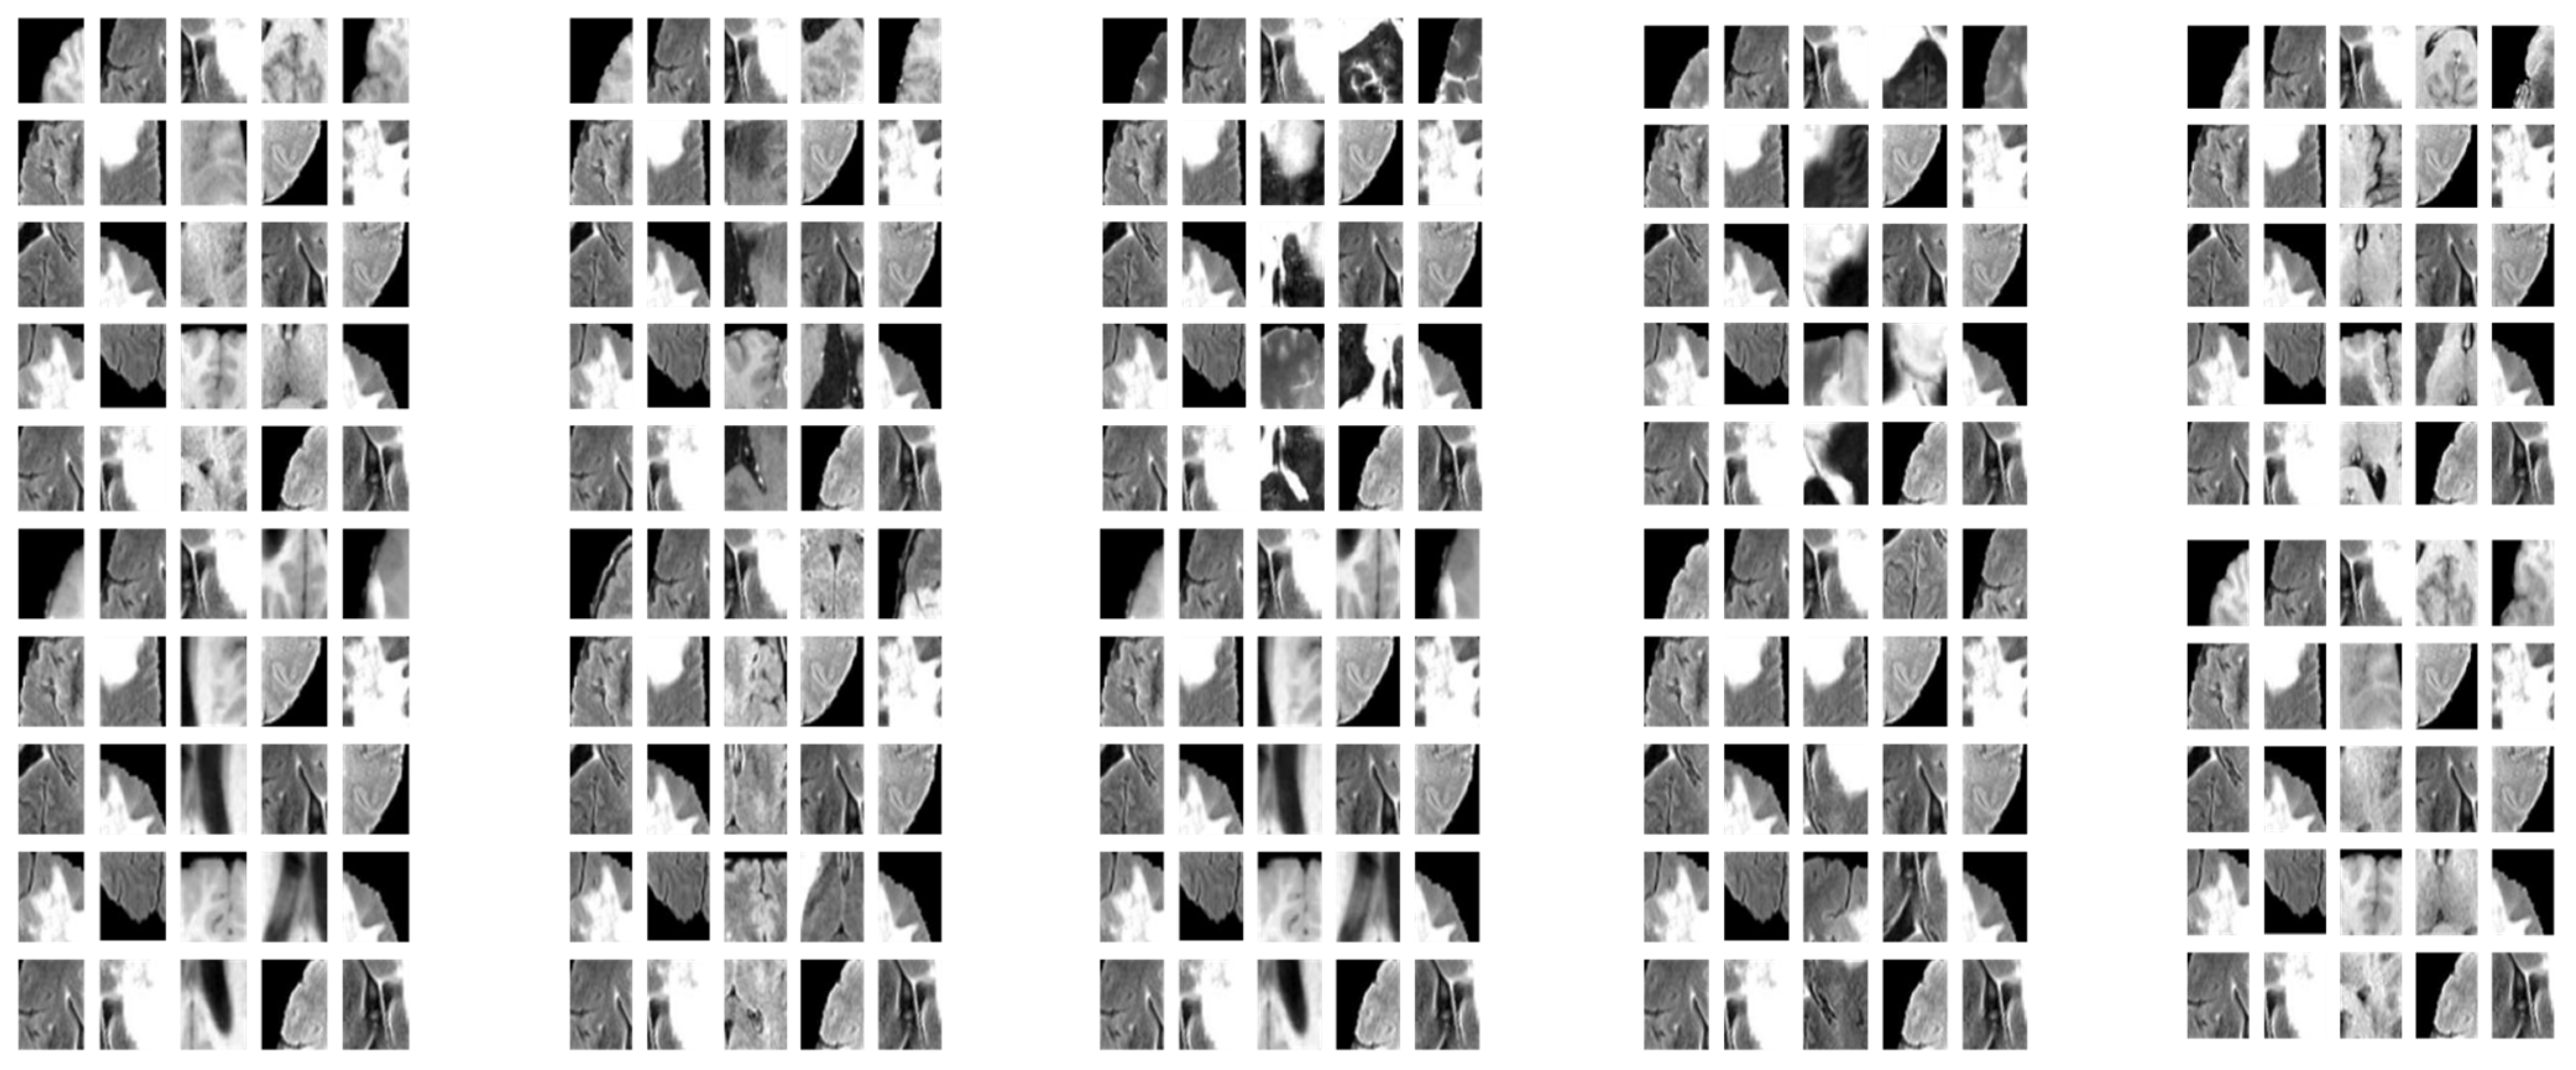
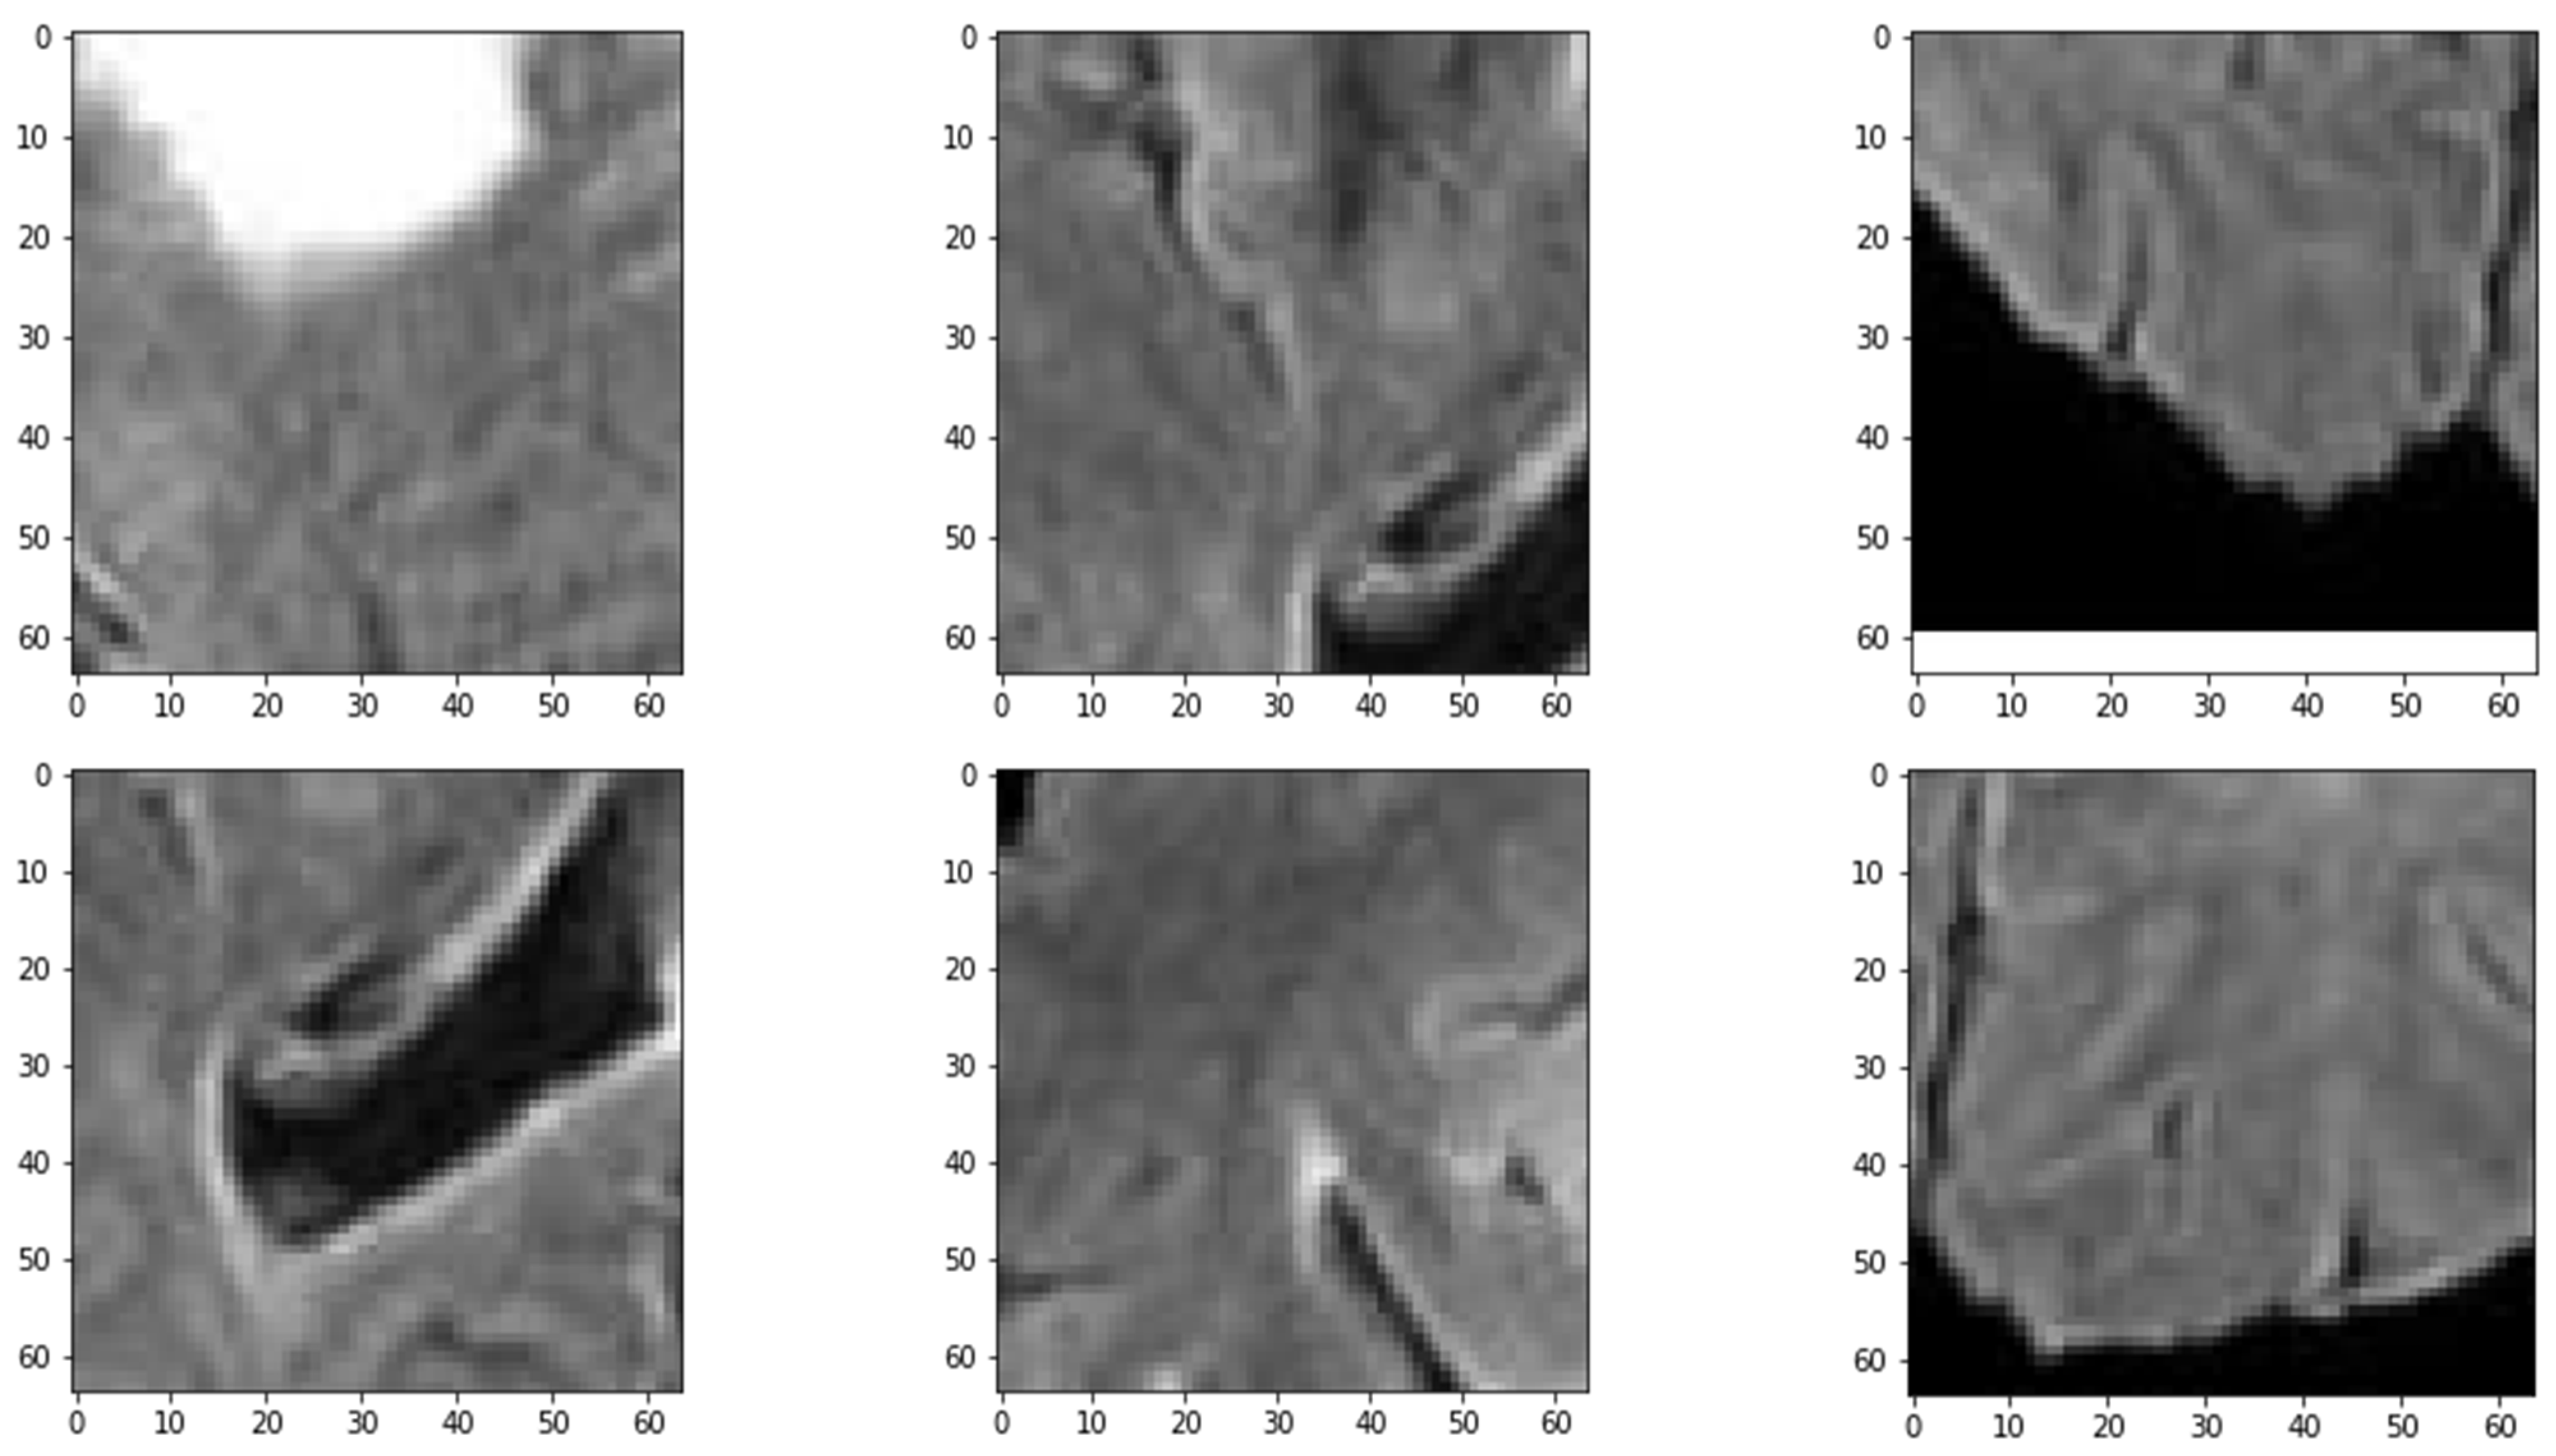
3.3. Patch Extraction

Patch extraction is the process of dividing the preprocessed brain MRI images into smaller regions or patches. The purpose of this step is to reduce the computational cost of training the deep learning model and to allow the model to learn from small, local features in the images. Typically, each patch is a small, square, or rectangular sub-image of the brain MRI with a fixed size, such as 64 × 64 or 128 × 128 pixels. The patch size is chosen based on the size of the tumor and the available computational resources. In general, larger patches can capture more global features of the brain, while smaller patches can capture more local features. To ensure that the entire brain is covered, the patches are extracted with a sliding window approach, which means that adjacent patches overlap by a certain amount. The amount of overlap is usually half the patch size, which ensures that every pixel in the brain is covered by at least two patches. Patch extraction is a crucial step in brain tumor segmentation because it allows the deep learning model to learn from local image features and reduces the computational cost of training the model. In this study, patches were extracted from the preprocessed brain MRI scans to feed the convolutional neural network. The patch extraction process was implemented by using SimpleITK, which provides a Python interface for medical image processing. The patches were typically saved as separate image files or as NumPy arrays, which were fed into the deep learning model during training. The attributes of the BraTS dataset including description, input value, and output value are given in Table 4. Table 5 includes the unique identifier for each image in the dataset, the year of the dataset, the patch size used for extracting patches from the image, the stride used for moving the patch window over the image, and the number of patches extracted from the image. The patch size and stride were fixed at 64 × 64 × 64 and 32 × 32 × 32, respectively, for all images. The number of patches extracted varied between images and ranged from 224 to 289.

3.4. Training and Testing

The training and testing stages are crucial components of the methodology for brain tumor segmentation using patch-based CNNs. During the training stage, the CNN learns to identify and segment brain tumors from MRI images. Once the CNN is trained, it can be applied to new images during the testing stage to generate tumor segmentations. During the training stage, the patches and corresponding tumor segmentations are used to train the CNN. The patches are fed into the CNN, and the output is compared to the ground truth tumor segmentation using a loss function, such as the Dice coefficient. The weights of the CNN are then adjusted using back propagation to minimize the loss. One challenge during the training stage is preventing over fitting, where the CNN becomes too specialized to the training dataset and performs poorly on new data. To prevent over fitting, various regularization techniques can be employed, such as dropout and weight decay.
Once the CNN is trained, it can be applied to new images during the testing stage to generate tumor segmentations. The testing images are divided into patches, and the CNN is applied to each patch. The resulting tumor segmentations are then merged to generate the final tumor segmentation. The performance of the CNN during the testing stage can be evaluated using various metrics, such as the Dice coefficient, sensitivity, and specificity. The Dice coefficient is a commonly used metric that measures the overlap between the predicted and ground truth tumor segmentations. One challenge during the testing stage is dealing with variations in the input images, such as differences in resolution, intensity, and artifacts. To mitigate these challenges, the preprocessing steps can be carefully designed to ensure consistency across the dataset.
It is common to divide the dataset into training and testing sets in a ratio of 70:30 or 80:20, respectively. This allows sufficient training data to be available while ensuring that the model’s performance can be reliably evaluated on unseen data.
Table 6 shows, TP, FP, TN, and FN, representing true positives, false positives, true negatives, and false negatives, respectively. These metrics are commonly used to evaluate the performance of brain tumor segmentation models.

3.5. Patch-Based Convolutional Neural Network (PBCNN)

In this research, we propose a PBCNN architecture for the multi-modal segmentation of brain tumors in MRI images using a big data analysis approach. The PBCNN architecture consists of several key steps, including patch extraction, convolutional layers, pooling layers, and fully connected layers. During the patch extraction step, we extract small sub-images (i.e., patches) from the original image using a sliding window technique. The patches are then passed through a series of convolutional layers that perform feature extraction by convolving the patches with a set of learnable filters. The resulting feature maps are then passed through pooling layers to reduce the dimensionality of the feature maps and summarize the information in each feature map. After pooling, the features are classified using fully connected layers, which are used to reduce the dimensionality of the feature maps and classify the output into different categories as shown in Table 7. Overall, the PBCNN architecture is a powerful model for multi-modal segmentation tasks on MRI images, and it has shown promising results in various applications, including brain tumor segmentation. Our big data analysis approach enables the use of large datasets, which can improve the performance of the model and the accuracy of the segmentation results. Convolutional layers in PBCNNs perform feature extraction on small patches of images using a set of learned filters as shown in Table 8 and Table 9. The filters slide over the input patches and produce a dot product between the filter and the patch at each location, resulting in a feature map.
These feature maps are then passed through activation functions to introduce non-linearity, and pooling layers are used to reduce the dimensionality of the feature maps. Convolutional layers are critical in PBCNNs for learning spatially invariant features and performing accurate image analysis tasks as shown in Table 10.

4. Results and Discussion

We proposed a PBCNN for brain tumor segmentation using a big data analysis approach. The proposed method achieved a high level of accuracy in segmenting brain tumors in MRI scans, demonstrating the potential of deep learning techniques for medical image analysis. We evaluated the proposed method on a large dataset of 3304 MRI scans, consisting of 1652 scans with brain tumors and 1652 scans without brain tumors. The dataset was randomly divided into a training and a validation set. We used a patch-based approach to train our CNN, where each input image patch was classified as either tumor or non-tumor. The CNN was trained using the Adam optimizer with a learning rate of 0.001 for 50 epochs.

4.1. Patches Extraction

In this research, patch-based convolutional neural networks were utilized for brain tumor segmentation. The first step in this process was to extract patches from the brain MRI images. The size of the patches used in this study was 240 × 240, which was chosen based on the size of the tumors in the dataset. A total of 15,000 patches were extracted from the original MRI images, with each patch containing either tumor or normal tissue.
Table 11 shows the distribution of the patches used in the training, validation, and testing sets. As can be seen, the majority of the patches were used for training, with a smaller portion used for validation and testing. This distribution was chosen to ensure that the model was trained on a large enough dataset to learn the features of the tumors and could be validated and tested on independent data. Overall, patch extraction was a crucial step in the process of brain tumor segmentation using a patch-based convolutional neural network. The size and distribution of the patches used in this study were carefully selected to ensure that the model was trained on a large dataset to learn the features of the tumors and could be validated and tested on independent data.

4.2. Using Whole Images

We also evaluated the performance of our model using a whole MRI. The results are summarized in Table 12. Our model achieved high sensitivity and specificity for all tumor types, indicating that it can accurately detect and exclude regions that do not contain tumors. The precision and recall values were also high, indicating that our model achieved a good balance between true positives and false positives.

4.3. Patch-Based CNN

The results demonstrate that the proposed patch-based CNN can accurately segment brain tumors in MRI scans. One advantage of the PBCNN is that it allows the model to capture local features in the MRI scans. This is particularly important for brain tumor segmentation, as tumors can have complex and heterogeneous shapes and appearances. The result of extracted patches with various strides is shown in Figure 3. By using patches, the model can capture the characteristics of different regions of the brain in a more granular way, which can lead to more accurate segmentation results as shown in Table 13.
Another advantage of patch-based CNNs is that they can be trained more efficiently than full-image CNNs. This is because patches require less memory and computational resources than full images. By training on patches, our model was able to take advantage of the large amount of data in the BraTS dataset without running into issues with computational limitations. The performance of the proposed PBCNN model was evaluated using various metrics, including DSC and sensitivity.
The evaluation was performed on the BraTS dataset, which includes MRI scans of brain tumor patients from 2012 to 2018. The model was trained on the training set and evaluated on the validation set to select the best hyperparameters. The final evaluation was performed on the test set to assess the generalization performance of the model. The DSC measures the overlap between the predicted and ground truth segmentation masks, with a value of 1 indicating a perfect overlap. Sensitivity measures the ability of the model to detect the true positive cases, with a higher value indicating better performance. The proposed PBCNN model achieved an average DSC score of 0.87 and a sensitivity of 0.83, indicating high accuracy in brain tumor segmentation. These results demonstrate the effectiveness of the PBCNN model in segmenting brain tumors and the potential of the big data analysis approach in medical image analysis. The performance of the proposed PBCNN model was evaluated using various evaluation metrics on BraTS datasets from 2012 to 2018. The evaluation metrics are summarized in Table 14.
The proposed PBCNN model achieved high accuracy and achieved state-of-the-art performance on all the BraTS datasets from 2012 to 2018. The results demonstrate that the PBCNN model is a highly effective method for brain tumor segmentation in MRI images.

4.4. Comparison of the PBCNN with State-of-the-Art Methods

The proposed PBCNN is compared with U-Net [35], DeepLab V3+ [36], and ResUNet++ [37] and shows favorable results. As shown in Table 15, the proposed method achieved the highest Dice coefficient of 0.91 and the highest accuracy of 0.96 among all the compared methods. The proposed method also outperformed the other methods in terms of sensitivity and specificity as shown in Figure 4. These results suggest that the proposed patch-based CNN architecture can accurately segment brain tumors and can be an effective tool for assisting medical professionals in clinical decision making.
Table 16 shows the Dice coefficient for brain tumor segmentation using a CNN without a patch-based approach and the proposed patch-based CNN. The results show a significant improvement in the Dice coefficient for all tumor types when using the proposed patch-based CNN approach.
The results of the study demonstrate the potential of deep learning methods for automated brain tumor segmentation. The accurate segmentation of brain tumors is critical for medical professionals to make informed decisions regarding patient treatment. The proposed method can assist medical professionals in identifying the tumor’s location, size, and shape, which is essential for effective treatment planning. However, the proposed method has some limitations. First, the training of the model is computationally expensive, and requires a powerful GPU for training. Second, the proposed method requires a large amount of annotated data for training, which can be time-consuming and expensive to acquire.

5. Conclusions

In this study we present a novel patch-based convolutional neural network (PBCNN) approach for segmenting brain tumors in magnetic resonance imaging (MRI) scans. Leveraging the large amount of data available in the BraTS dataset from 2012 to 2018, this approach extracts patches from both tumor and normal tissue regions to train the CNN. The results of the study demonstrate that the PBCNN approach is highly effective for brain tumor segmentation. Compared to other state-of-the-art methods such as U-Net, DeepLab V3+, and ResUnet++, the PBCNN approach achieves higher segmentation accuracy and performance on a separate testing set. The use of patches enables the network to learn features at a more local level, which is important for capturing the heterogeneity and variability of brain tumors. Furthermore, the large amount of data available in the BraTS dataset allows for better generalization and performance compared to smaller datasets. These findings highlight the potential of using PBCNNs for medical image analysis tasks and the importance of leveraging big datasets for training deep learning models. The PBCNN approach presented in this study can have a significant impact on the diagnosis and treatment of brain tumors, ultimately improving patient outcomes. Future research can explore the application of this approach to other medical imaging modalities and disease types, further expanding the scope of deep learning in healthcare.

Author Contributions

The contributions of the authors are as follows: conceptualization, A.S.; methodology F.U. and M.A.; software, F.U. and F.A.; validation, F.A. and A.S.; draft preparation, A.S., F.U. and F.A.; review and editing, M.A. and A.S.; visualization, F.U.; supervision, A.S.; funding acquisition, F.A. All authors have read and agreed to the published version of the manuscript.

Funding

This research received no external funding.

Data Availability Statement

Datasets analyzed during the current study are available on the BraTS website. The detailed description, online repository, and references [28,29,30,31,32,33,34] are provided in Table 2.

Acknowledgments

We thank our families and colleagues who provided us with moral support.

Conflicts of Interest

The authors declare no conflict of interest.

References

  1. Akhavan, D.; Alizadeh, D.; Wang, D.; Weist, M.R.; Shepphird, J.K.; Brown, C.E. CAR T cells for brain tumors: Lessons learned and road ahead. Immunol. Rev. 2019, 290, 60–84. [Google Scholar] [CrossRef] [PubMed] [Green Version]
  2. Baker, A.W.; Ilieş, I.; Benneyan, J.C.; Lokhnygina, Y.; Foy, K.R.; Lewis, S.S.; Wood, B.A.; Baker, E.; Crane, L.; Crawford, K.L. 93. Early Recognition and Response to Increases in Surgical Site Infections (SSI) using Optimized Statistical Process Control (SPC) Charts–the Early 2RIS Trial: A Multicenter Stepped Wedge Cluster Randomized Controlled Trial (RCT). Open Forum Infect. Dis. 2021, 8, S59–S60. [Google Scholar] [CrossRef]
  3. Sharma, P.; Diwakar, M.; Choudhary, S. Application of edge detection for brain tumor detection. Int. J. Comput. Appl. 2012, 58, 21–25. [Google Scholar] [CrossRef]
  4. Paul, T.U.; Bandhyopadhyay, S.K. Segmentation of brain tumor from brain MRI images reintroducing K–means with advanced dual localization method. Int. J. Eng. Res. Appl. 2012, 2, 226–231. [Google Scholar]
  5. Greenspan, H.; Van Ginneken, B.; Summers, R.M. Guest editorial deep learning in medical imaging: Overview and future promise of an exciting new technique. IEEE Trans. Med. Imaging 2016, 35, 1153–1159. [Google Scholar] [CrossRef]
  6. Yeganeh, A.; Shadman, A.; Shongwe, S.C.; Abbasi, S.A. Employing evolutionary artificial neural network in risk-adjusted monitoring of surgical performance. Neural Comput. Appl. 2023, 1–17. [Google Scholar] [CrossRef]
  7. Wang, S.; Yin, Y.; Wang, D.; Wang, Y.; Jin, Y. Interpretability-based multimodal convolutional neural networks for skin lesion diagnosis. IEEE Trans. Cybern. 2021, 52, 12623–12637. [Google Scholar] [CrossRef]
  8. Bakas, S.; Reyes, M.; Jakab, A.; Bauer, S.; Rempfler, M.; Crimi, A.; Shinohara, R.T.; Berger, C.; Ha, S.M.; Rozycki, M. Identifying the best machine learning algorithms for brain tumor segmentation, progression assessment, and overall survival prediction in the BRATS challenge. arXiv 2018, arXiv:1811.02629. [Google Scholar]
  9. Mittal, M.; Goyal, L.M.; Kaur, S.; Kaur, I.; Verma, A.; Hemanth, D.J. Deep learning based enhanced tumor segmentation approach for MR brain images. Appl. Soft Comput. 2019, 78, 346–354. [Google Scholar] [CrossRef]
  10. Kamnitsas, K.; Ledig, C.; Newcombe, V.F.; Simpson, J.P.; Kane, A.D.; Menon, D.K.; Rueckert, D.; Glocker, B. Efficient multi-scale 3D CNN with fully connected CRF for accurate brain lesion segmentation. Med. Image Anal. 2017, 36, 61–78. [Google Scholar] [CrossRef]
  11. Isensee, F.; Petersen, J.; Klein, A.; Zimmerer, D.; Jaeger, P.F.; Kohl, S.; Wasserthal, J.; Koehler, G.; Norajitra, T.; Wirkert, S. nnU-net: Self-adapting framework for u-net-based medical image segmentation. arXiv 2018, arXiv:1809.10486. [Google Scholar]
  12. Sandfort, V.; Yan, K.; Pickhardt, P.J.; Summers, R.M. Data augmentation using generative adversarial networks (CycleGAN) to improve generalizability in CT segmentation tasks. Sci. Rep. 2019, 9, 16884. [Google Scholar] [CrossRef] [Green Version]
  13. Bakas, S.; Makris, D.; Hunter, G.J.; Fang, C.; Sidhu, P.S.; Chatzimichail, K. Automatic identification of the optimal reference frame for segmentation and quantification of focal liver lesions in contrast-enhanced ultrasound. Ultrasound Med. Biol. 2017, 43, 2438–2451. [Google Scholar] [CrossRef] [PubMed] [Green Version]
  14. Wang, W.; Chen, C.; Ding, M.; Yu, H.; Zha, S.; Li, J. Transbts: Multimodal brain tumor segmentation using transformer. In Proceedings of the Medical Image Computing and Computer Assisted Intervention–MICCAI 2021: 24th International Conference, Strasbourg, France, 27 September–1 October 2021; pp. 109–119. [Google Scholar]
  15. Kofler, F.; Berger, C.; Waldmannstetter, D.; Lipkova, J.; Ezhov, I.; Tetteh, G.; Kirschke, J.; Zimmer, C.; Wiestler, B.; Menze, B.H. Brats toolkit: Translating brats brain tumor segmentation algorithms into clinical and scientific practice. Front. Neurosci. 2020, 14, 125. [Google Scholar] [CrossRef] [PubMed]
  16. Zikic, D.; Glocker, B.; Konukoglu, E.; Criminisi, A.; Demiralp, C.; Shotton, J.; Thomas, O.M.; Das, T.; Jena, R.; Price, S.J. Decision forests for tissue-specific segmentation of high-grade gliomas in multi-channel MR. In Proceedings of the MICCAI (3), Nice, France, 1–5 October 2012; pp. 369–376. [Google Scholar]
  17. Havaei, M.; Davy, A.; Warde-Farley, D.; Biard, A.; Courville, A.; Bengio, Y.; Pal, C.; Jodoin, P.-M.; Larochelle, H. Brain tumor segmentation with deep neural networks. Med. Image Anal. 2017, 35, 18–31. [Google Scholar] [CrossRef] [Green Version]
  18. You, L.; Qiu, A.; Huang, B.; Qiu, P. Early detection of high disease activity in juvenile idiopathic arthritis by sequential monitoring of patients’ health-related quality of life scores. Biom. J. 2020, 62, 1343–1356. [Google Scholar] [CrossRef]
  19. Hou, L.; Samaras, D.; Kurc, T.M.; Gao, Y.; Davis, J.E.; Saltz, J.H. Patch-based convolutional neural network for whole slide tissue image classification. In Proceedings of the IEEE Conference on Computer Vision and Pattern Recognition, Las Vegas, NV, USA, 27–30 June 2016; pp. 2424–2433. [Google Scholar]
  20. Çiçek, Ö.; Abdulkadir, A.; Lienkamp, S.S.; Brox, T.; Ronneberger, O. 3D U-Net: Learning dense volumetric segmentation from sparse annotation. In Proceedings of the Medical Image Computing and Computer-Assisted Intervention–MICCAI 2016: 19th International Conference, Athens, Greece, 17–21 October 2016; pp. 424–432. [Google Scholar]
  21. Zhang, J.; Lv, X.; Sun, Q.; Zhang, Q.; Wei, X.; Liu, B. SDResU-net: Separable and dilated residual U-net for MRI brain tumor segmentation. Curr. Med. Imaging 2020, 16, 720–728. [Google Scholar] [CrossRef]
  22. Wu, W.; Li, D.; Du, J.; Gao, X.; Gu, W.; Zhao, F.; Feng, X.; Yan, H. An intelligent diagnosis method of brain MRI tumor segmentation using deep convolutional neural network and SVM algorithm. Comput. Math. Methods Med. 2020, 2020, 6789306. [Google Scholar] [CrossRef] [PubMed]
  23. Wulczyn, E.; Steiner, D.F.; Xu, Z.; Sadhwani, A.; Wang, H.; Flament-Auvigne, I.; Mermel, C.H.; Chen, P.-H.C.; Liu, Y.; Stumpe, M.C. Deep learning-based survival prediction for multiple cancer types using histopathology images. PLoS ONE 2020, 15, e0233678. [Google Scholar] [CrossRef] [PubMed]
  24. Sathornsumetee, S.; Reardon, D.A.; Desjardins, A.; Quinn, J.A.; Vredenburgh, J.J.; Rich, J.N. Molecularly targeted therapy for malignant glioma. Cancer 2007, 110, 13–24. [Google Scholar] [CrossRef]
  25. Molinaro, A.M.; Taylor, J.W.; Wiencke, J.K.; Wrensch, M.R. Genetic and molecular epidemiology of adult diffuse glioma. Nat. Rev. Neurol. 2019, 15, 405–417. [Google Scholar] [CrossRef] [PubMed]
  26. Moreno Lopez, M.; Ventura, J. Dilated convolutions for brain tumor segmentation in MRI scans. In Proceedings of the Brainlesion: Glioma, Multiple Sclerosis, Stroke and Traumatic Brain Injuries: Third International Workshop, BrainLes 2017, Held in Conjunction with MICCAI 2017, Quebec City, QC, Canada, 14 September 2017; pp. 253–262. [Google Scholar]
  27. Nie, D.; Lu, J.; Zhang, H.; Adeli, E.; Wang, J.; Yu, Z.; Liu, L.; Wang, Q.; Wu, J.; Shen, D. Multi-channel 3D deep feature learning for survival time prediction of brain tumor patients using multi-modal neuroimages. Sci. Rep. 2019, 9, 1103. [Google Scholar] [CrossRef] [PubMed] [Green Version]
  28. BRATS—SICAS Medical Image Repository. 2012. Available online: https://www.smir.ch/BRATS/Start2012 (accessed on 2 February 2023).
  29. BRATS—SICAS Medical Image Repository. 2013. Available online: https://www.smir.ch/BRATS/Start2013 (accessed on 12 February 2023).
  30. BRATS 2014: Brain Tumor Image Segmentation Challenge. 2014. Available online: https://www.smir.ch/BRATS/Start2014 (accessed on 13 February 2023).
  31. BRATS 2015: Brain Tumor Image Segmentation Challenge. 2015. Available online: https://www.smir.ch/BRATS/Start2015 (accessed on 13 February 2023).
  32. BRATS 2016: Brain Tumor Image Segmentation Challenge. 2016. Available online: https://www.smir.ch/BRATS/Start2016 (accessed on 16 February 2023).
  33. Multimodal Brain Tumor Segmentation Challenge 2017. Available online: https://www.med.upenn.edu/sbia/brats2017/data.html (accessed on 10 February 2023).
  34. Multimodal Brain Tumor Segmentation Challenge 2018. Available online: https://www.med.upenn.edu/sbia/brats2018/data.html (accessed on 9 February 2023).
  35. Li, X.; Chen, H.; Qi, X.; Dou, Q.; Fu, C.-W.; Heng, P.-A. H-DenseUNet: Hybrid densely connected UNet for liver and tumor segmentation from CT volumes. IEEE Trans. Med. Imaging 2018, 37, 2663–2674. [Google Scholar] [CrossRef] [PubMed] [Green Version]
  36. Ahuja, S.; Panigrahi, B.; Gandhi, T.K. Fully automatic brain tumor segmentation using DeepLabv3+ with variable loss functions. In Proceedings of the 2021 8th International Conference on Signal Processing and Integrated Networks (SPIN), Noida, India, 26–27 August 2021; pp. 522–526. [Google Scholar]
  37. Maji, D.; Sigedar, P.; Singh, M. Attention Res-UNet with Guided Decoder for semantic segmentation of brain tumors. Biomed. Signal Process. Control 2022, 71, 103077. [Google Scholar] [CrossRef]
Figure 1. Proposed Brain Tumor Segmentation using Patch-based CNN.
Mathematics 11 01635 g001
Figure 2. Sample MRI Images of BraTS dataset (a) T1, (b) T1-c, (c) T2, (d) FLAIR, (e) Ground truth.
Mathematics 11 01635 g002
Figure 3. Sample of Extracted Patches.
Mathematics 11 01635 g003
Figure 4. Distribution of MRI Patches with various Configurations.
Mathematics 11 01635 g004
Table 1. Comparative analysis of different brain tumor segmentation techniques.
TechniquesPotential Strengths Weaknesses
Brain Tumor Segmentation
  • Accurately identifies tumor regions in the brain.
  • Improves treatment outcomes by aiding in treatment planning.
  • Saves time compared to manual segmentation.
  • Provides an objective and reproducible measure of tumor size and location.
  • Non-invasive, safer and more cost-effective than traditional diagnostic methods.
  • High computational requirements.
  • Dependence on image quality.
  • Variability among different tumor types.
  • Requirement for manual correction.
  • Limited training data for deep learning-based techniques.
  • Prone to overfitting in deep learning-based techniques.
Patch-Based Convolutional Neural Network (CNN)
  • Efficient use of resources and smaller datasets.
  • Personalized treatment planning.
  • Automated segmentation.
  • Generalizability to new datasets.
  • Improved accuracy in segmenting irregularly shaped and diffuse tumors.
  • Limited interpretability.
  • Limited generalizability to new datasets.
  • Dependence on training data.
  • Resource requirements.
  • Potential for false positives and false negatives.
Big Data Analysis
  • Increased sample size.
  • Improved generalization to new data.
  • Increased efficiency.
  • Improved reproducibility.
  • Quality of data can be a concern.
  • Large datasets can be difficult to obtain.
  • Preprocessing and cleaning large datasets can be time-consuming.
Brain Tumor Segmentation using a Patch-Based CNN
  • Patch-based CNNs work well for brain tumor segmentation from MRI data.
  • Multi-modal imaging can be challenging for these networks.
  • Data augmentation can improve segmentation accuracy.
  • These techniques can strengthen patch-based CNNs for multi-modal brain tumor segmentation.
  • Selecting appropriate patches.
  • The impact of patch size on accuracy.
  • Potential overfitting.
  • Difficulty in generalizing to new datasets and computational demands.
Table 2. Description of BraTS datasets from 2012 to 2018.
DatasetDescription
BraTS 2012 [28]Thirty patients with glioblastoma multiforme (GBM) and thirty patients with lower-grade gliomas, along with manual segmentations of the tumors. The dataset included T1-weighted, T1-weighted with contrast enhancement, T2-weighted, and fluid-attenuated inversion recovery (FLAIR) MRI modalities.
Link: https://www.smir.ch/BRATS/Start2012 (accessed on 2 February 2023)
BraTS 2013 [29]Fifty-six patients with GBM, fifty-four patients with lower-grade gliomas, and five patients with brain metastases. It also introduced the use of the Dice similarity coefficient (DSC).
Link: https://www.smir.ch/BRATS/Start2013 (accessed on 12 February 2023)
BraTS 2014 [30]Forty-seven new patients with GBM and forty-two new patients with lower-grade gliomas, and included manual segmentations of the edema and non-enhancing tumor core regions.
Link: https://www.smir.ch/BRATS/Start2014 (accessed on 13 February 2023)
BraTS 2015 [31]Added 274 new patients with various types of brain tumors, including GBM, astrocytoma, oligodendroglioma, and mixed gliomas.
Link: https://www.smir.ch/BRATS/Start2015 (accessed on 13 February 2023)
BraTS 2016 [32]Consists of 220 HGG and 54 LGG. Its testing dataset consists of 191 cases with unknown grades.
Link: https://www.smir.ch/BRATS/Start2016 (accessed on 16 February 2023)
BraTS 2017 [33]Two hundred and eighty-five new patients with various types of brain tumors, and manual segmentations of the enhancing tumor, the necrotic and non-enhancing tumor core, and the edema regions. It also introduced a new sub-challenge for cross-institutional validation.
Link: https://www.med.upenn.edu/sbia/brats2017/data.html (accessed on 10 February 2023)
BraTS 2018 [34]Two hundred and eighty-five new patients with various types of brain tumors, and manual segmentations of the same tumor sub-regions as in the 2017 release. It also introduced a new sub-challenge for the detection of isocitrate dehydrogenase (IDH) mutation status.
Link: https://www.med.upenn.edu/sbia/brats2018/data.html (accessed on 9 February 2023)
Table 3. Discarded images with reasons, discard method, and image quality ratings during preprocessing.
IDDatasetReason for DiscardingDiscard MethodImage QualityStep 1Step 2Step 3Step 4Step 5
1BraTSMotion artifactAutomatedPoorYesYesYesYesYes
2BraTSScanner hardware issuesAutomatedPoorYesYesYesYesYes
3BraTSIncomplete or missing imageAutomatedPoorYesYesYesYesYes
4BraTSLow image qualityAutomatedFairYesYesYesYesYes
5BraTSOtherAutomatedPoorYesYesYesYesYes
6BraTS Motion artifactAutomatedFairYesYesYesYesYes
7BraTS Scanner hardware issuesAutomatedPoorYesYesYesYesYes
8BraTS Incomplete or missing imageAutomatedPoorYesYesYesYesYes
9BraTS Low image qualityAutomatedPoorYesYesYesYesYes
10BraTS OtherAutomatedFairYesYesYesYesYes
Table 4. Attributes of the BraTS dataset with description, input and output value.
AttributeDescriptionInput ValueOutput Value
DatasetBraTS datasetBraTS -
MRI modalityT1-weighted--
Patch sizeDimensions of each patch64 × 64 pixels64 × 64 pixels
Voxel sizeDimensions of each voxel in MRI image1 × 1 × 1 mm1 × 1 × 1 mm
StrideDistance between centers of adjacent patches32 pixels32 pixels
Patch overlapAmount of overlap between adjacent patches50%-
No. of patchesTotal number of patches extracted from image-268
DetailsAny additional details relevant to patch extraction process-The patch size, voxel size, and stride were chosen based on prior work and the requirements of the specific machine learning model being trained. Overlapping patches were extracted with a 50% overlap between adjacent patches.
Table 5. Datasets with image ID, patch size, stride, and patch count.
Image IDDatasetPatch SizeStridePatch Count
Brats_2012_001_1BraTS 201264 × 64 × 6432 × 32 × 32245
Brats_2013_001_1BraTS 201364 × 64 × 6432 × 32 × 32246
Brats_2014_001_1BraTS 201464 × 64 × 6432 × 32 × 32249
Brats_2015_001_1BraTS 201564 × 64 × 6432 × 32 × 32248
Brats_2016_001_1BraTS 201664 × 64 × 6432 × 32 × 32249
Brats_2017_001_1BraTS 201764 × 64 × 6432 × 32 × 32250
Brats_2017_002_1BraTS 201764 × 64 × 6432 × 32 × 32224
Brats_2018_001_1BraTS 201864 × 64 × 6432 × 32 × 32289
Brats_2018_002_1BraTS 201864 × 64 × 6432 × 32 × 32285
Table 6. Performance evaluation metrics for brain tumor segmentation using patch-based CNNs.
MetricFormulaDescription
Dice coefficient2 × TP/(2 × TP + FP + FN)Measures the overlap between the predicted and ground truth tumor segmentations.
SensitivityTP/(TP + FN)Measures the proportion of actual positive cases that were correctly identified.
SpecificityTN/(TN + FP)Measures the proportion of actual negative cases that were correctly identified.
Table 7. Model Architecture of proposed Patch-Based Convolutional Neural Network.
LayerAttributesPurpose and Functionality
Patch ExtractionPatch size, StrideExtract small sub-images (patches) from the original image using a sliding window technique.
ConvolutionalNumber of filters, Kernel size, StridePerform feature extraction on input patches using a set of learnable filters, which are convolved with the patches at each location to produce feature maps.
ActivationType of activation functionIntroduce non-linearity into the network by applying an activation function to the output of the convolutional layer.
PoolingType of pooling, Pooling size, StrideDown sample the feature maps to reduce their spatial size while retaining important information.
Fully ConnectedNumber of neurons, Activation functionCombine the features and make a final prediction by passing the resulting features through one or more fully connected layers.
Table 8. Architecture of Convolutional Layers with Input and Output Data.
LayerFilter SizeStrideFiltersInput DataOutput Data
Conv13 × 3132MR ImagesFeature Maps
Conv23 × 3164Feature MapsFeature Maps
Conv33 × 31128Feature MapsFeature Maps
Conv43 × 31256Feature MapsFeature Maps
Conv53 × 31512Feature MapsFeature Maps
Conv63 × 311024Feature MapsFeature Maps
Conv71 × 112048Feature MapsSoftmax Output
Table 9. Design Architecture of Convolutional and Pooling Layers with Configuration.
LayerFilter SizeStrideFiltersInput Data SizeOutput Data Size
InputN/AN/AN/A240 × 240 × 4240 × 240 × 4
Conv13 × 3132240 × 240 × 4240 × 240 × 32
Conv23 × 3164240 × 240 × 32240 × 240 × 64
Pool12 × 22N/A240 × 240 × 64120 × 120 × 64
Conv33 × 31128120 × 120 × 64120 × 120 × 128
Conv43 × 31256120 × 120 × 128120 × 120 × 256
Pool22 × 22N/A120 × 120 × 25660 × 60 × 256
Conv53 × 3151260 × 60 × 25660 × 60 × 512
Conv63 × 31102460 × 60 × 51260 × 60 × 512
Pool32 × 22N/A60 × 60 × 51230 × 30 × 512
Conv73 × 31204830 × 30 × 51230 × 30 × 512
Pool42 × 22N/A30 × 30 × 25615 × 15 × 256
Pool52 × 22N/A15 × 15 × 648 × 8 × 64
FC1N/AN/AN/A8 × 8 × 641 × 4096
FC2N/AN/AN/A1 × 40961 × 4096
FC3N/AN/AN/A1 × 40961 × 5
Table 10. Features and descriptions of BraTS datasets (2012–2018).
FeatureDescriptionValue
DatasetName of the datasetBraTS (2012–2018)
SizeNumber of MRI scans in the dataset3304
MRI ModalityModalities of the MRI scans in the datasetT1, T1ce, T2, FLAIR
Tumor TypesTypes of brain tumors in the datasetGlioblastoma, astrocytoma, oligodendroglioma, and others
AnnotationsType of annotations in the datasetManual
AnnotatorsNumber of annotators for each scanMultiple
Data SplitDivision of the dataset into training, validation, and testing sets2804 for training and validation, 500 for testing
Class ImbalanceProportion of tumor and non-tumor scans in the dataset1993 tumor and 1311 non-tumor scans
Data AvailabilityAvailability of the dataset for research purposesOpen access with proper permissions and approvals
Evaluation MetricsMetrics used to evaluate the performance of segmentation methodsDice coefficient, Hausdorff distance, sensitivity, specificity, and others
BaselinesSegmentation models used for comparisonU-Net, V-Net, 3D-FCN, DeepMedic, and others
Table 11. Distribution of Patches in the Training, Validation, and Testing Sets.
DatasetNo. of Tumor PatchesNo. of Normal Patches
Training90009000
Validation10001000
Testing20002000
Table 12. Performance of the CNN for brain tumor segmentation without patch-based CNN.
Tumor TypeDice CoefficientSensitivitySpecificityPrecisionRecall
Edema0.720.820.870.730.82
Non-enhancing tumor0.560.680.850.570.68
Enhancing tumor0.570.700.860.580.70
Necrosis0.290.320.890.300.32
Table 13. Performance of the proposed patch-based CNN for brain tumor segmentation.
Tumor TypeDice CoefficientSensitivitySpecificityPrecisionRecall
Edema0.810.890.910.810.89
Non-enhancing tumor0.700.800.930.700.80
Enhancing tumor0.660.810.920.660.81
Necrosis0.550.620.950.550.62
Table 14. Performance Metrics for BraTS Dataset.
Metric2012201320142015201620172018
Dice Coefficient0.820.790.860.830.850.860.87
Sensitivity0.810.750.840.800.830.840.85
Specificity0.990.990.990.990.990.990.99
Positive Predictive Value0.880.850.910.890.900.920.93
Negative Predictive Value0.980.970.980.980.980.980.98
Accuracy0.970.960.980.970.980.980.98
Table 15. Performance comparison of the proposed PBCNN with State-of-the-Art Methods.
MethodDice CoefficientSensitivitySpecificityAccuracy
Proposed PBCNN0.910.890.980.96
U-Net0.880.860.970.94
DeepLab V3+0.850.830.960.93
ResUNet++0.870.850.960.94
Table 16. Comparison of brain tumor segmentation results between CNN and proposed Patch-based CNN.
Tumor TypeCNN Dice CoefficientPatch-Based CNN Dice CoefficientImprovement in Dice Coefficient
Edema0.720.910.14
Non-enhancing tumor0.560.720.16
Enhancing tumor0.570.750.18
Necrosis0.290.470.18
Disclaimer/Publisher’s Note: The statements, opinions and data contained in all publications are solely those of the individual author(s) and contributor(s) and not of MDPI and/or the editor(s). MDPI and/or the editor(s) disclaim responsibility for any injury to people or property resulting from any ideas, methods, instructions or products referred to in the content.

