1. Introduction
Pipeline networks are a major component of the oil and gas industry that facilitates the transport of raw and processed hydrocarbons across vast distances. The three main pipeline types are gathering, transmission, and distribution systems. These pipelines transport fluids at high temperatures and pressure [
1]. Over the years, industries have developed a preference for pipelines with improved transportation capacity, resulting in an increased demand for pipelines with larger diameters [
2]. To meet this demand, pipes with enhanced strength, adequate ductility, and toughness were required. The development of high-strength steel (HSS) was driven by the need for improved pipe material properties with durability to withstand operations in harsh environments while maintaining performance [
3,
4].
1.1. High-Strength Steel Pipelines in the Oil and Gas Industry
As a result of being exposed to harsh conditions and different terrains, pipelines are subjected to pipe degradation mechanisms and external forces [
5]. Among the different types of external forces a pipe could be subjected to, axial compressive stress is known to be the most significant [
5,
6,
7,
8,
9]. Recent studies on the influence of axial compressive stress on the failure of a straight pipe have shed light on the detrimental effects of the load [
10]. The effects of axial compression on a pipe’s failure pressure are more severe in the presence of corrosion. Corrosion is the most common and pernicious form of pipe degradation in steel pipes. Corrosion may present itself as a single defect (completely isolated from all other defects) or interacting defects (two or more defects in close proximity) [
11].
The presence of corrosion defects in an HSS pipeline subjected to internal pressure and axial compressive stress results in a drastic drop in the pipe failure pressure. This reduction in failure pressure is more severe at the pipe bends than in the straight pipe region for a corrosion defect of the same geometry [
12]. This is due to the Bourdon Effect, caused by the difference in surface area of the pipe elbow at the intrados and extrados, which causes the component to straighten out [
13]. When this occurs, the cross-section of the pipe elbow is subjected to ovalisation [
14]. Due to this, pipe elbows are regarded as the weakest link in a piping system. As such, the integrity of pipe elbows of a pipeline must be assessed periodically to prevent failures.
1.2. Pipeline Integrity Assessment Methods
In a pipeline system, the operating pressure depends on the maximum allowable pressure of the pipeline network. The maximum allowable pressure is determined by the most critical component in the pipe network. For this reason, pipe integrity assessment standards and codes have been developed over the years to assess the failure pressure of straight pipes. For example, the DNV-RP-F101 (known as the most comprehensive code in the industry), ASME B31G, Modified AMSE B31G, RSTRENG, and PCORRC are the conventional corrosion assessment codes applicable to straight pipes [
2]. The DNV-RP-F101 code incorporates the influence of internal pressure and axial compressive stress acting on a corroded pipe with a single defect. As for interacting defects, only the influence of internal pressure is considered. Since these methods were developed for straight pipes, using them for pipe elbows would result in inaccurate failure pressure predictions.
Despite being the weakest link in a piping network, the industry lacks a dedicated failure pressure assessment standard and code for the failure pressure prediction of corroded HSS pipe elbows subjected to internal pressure and axial compressive stress. In the late 70s, Goodall developed an equation known as the Goodall Formula to assess the limit pressure of a thin-walled elbow based on flow stress [
15]. However, this equation is only applicable to defect-free pipe elbows. Duan and Shen, in 2006, furthered Goodall’s work and proposed the Modified Goodall Equation to assess the failure pressure of a corroded pipe elbow with a single defect subjected to internal pressure only [
16]. As real-life scenarios often require pipe elbow assessment for interacting corrosion defects incorporating axial compressive stress and internal pressure, numerical methods such as the Finite Element Method (FEM) are often used. Numerical methods are known to be highly accurate but can be time-consuming and impractical in time-critical situations.
1.3. Artificial Neural Network as a Failure Pressure Prediction Tool
In recent years, various studies have used Artificial Neural Networks (ANN) in pipeline corrosion assessment [
10,
17,
18,
19]. An ANN is a machine learning tool comprising a complex network of artificial neurons that relate the input and output variables. It has shown promising results in developing new corrosion assessment methods. Tohidi and Sharifi, in 2016, developed an empirical solution to evaluate the residual strength of the ultimate bearing capacities of steel girders based on an ANN [
17]. The training data for the ANN was generated using the FEM. The trained ANN was then validated using an arbitrary dataset also generated using the FEM.
Following this approach, in 2021, Lo et al. [
8] and Vijaya Kumar et al. [
20] formulated a set of empirical equations for the failure pressure prediction of corroded straight pipes subjected to internal pressure and axial compressive stress. This was achieved by developing an ANN that was trained using data generated using the FEM. The resulting matrix representation of the trained ANN was then utilised as the basis for formulating the empirical equations. The developed equations could produce highly accurate predictions, with an R
2 value of 0.99, and an ANN can be used for the failure pressure prediction of corroded pipes.
Using a similar approach, this paper aims to develop an empirical equation for the failure pressure prediction of corroded API 5L X70, API 5L X80, and API 5L X100 pipe elbows subjected to internal pressure and axial compressive stress using data generated by FEM. The developed ANN will then be used to study the failure behaviour of corroded pipe elbows for single, longitudinally interacting, and circumferentially interacting corrosion defects located at the intrados and extrados.
2. Methodology
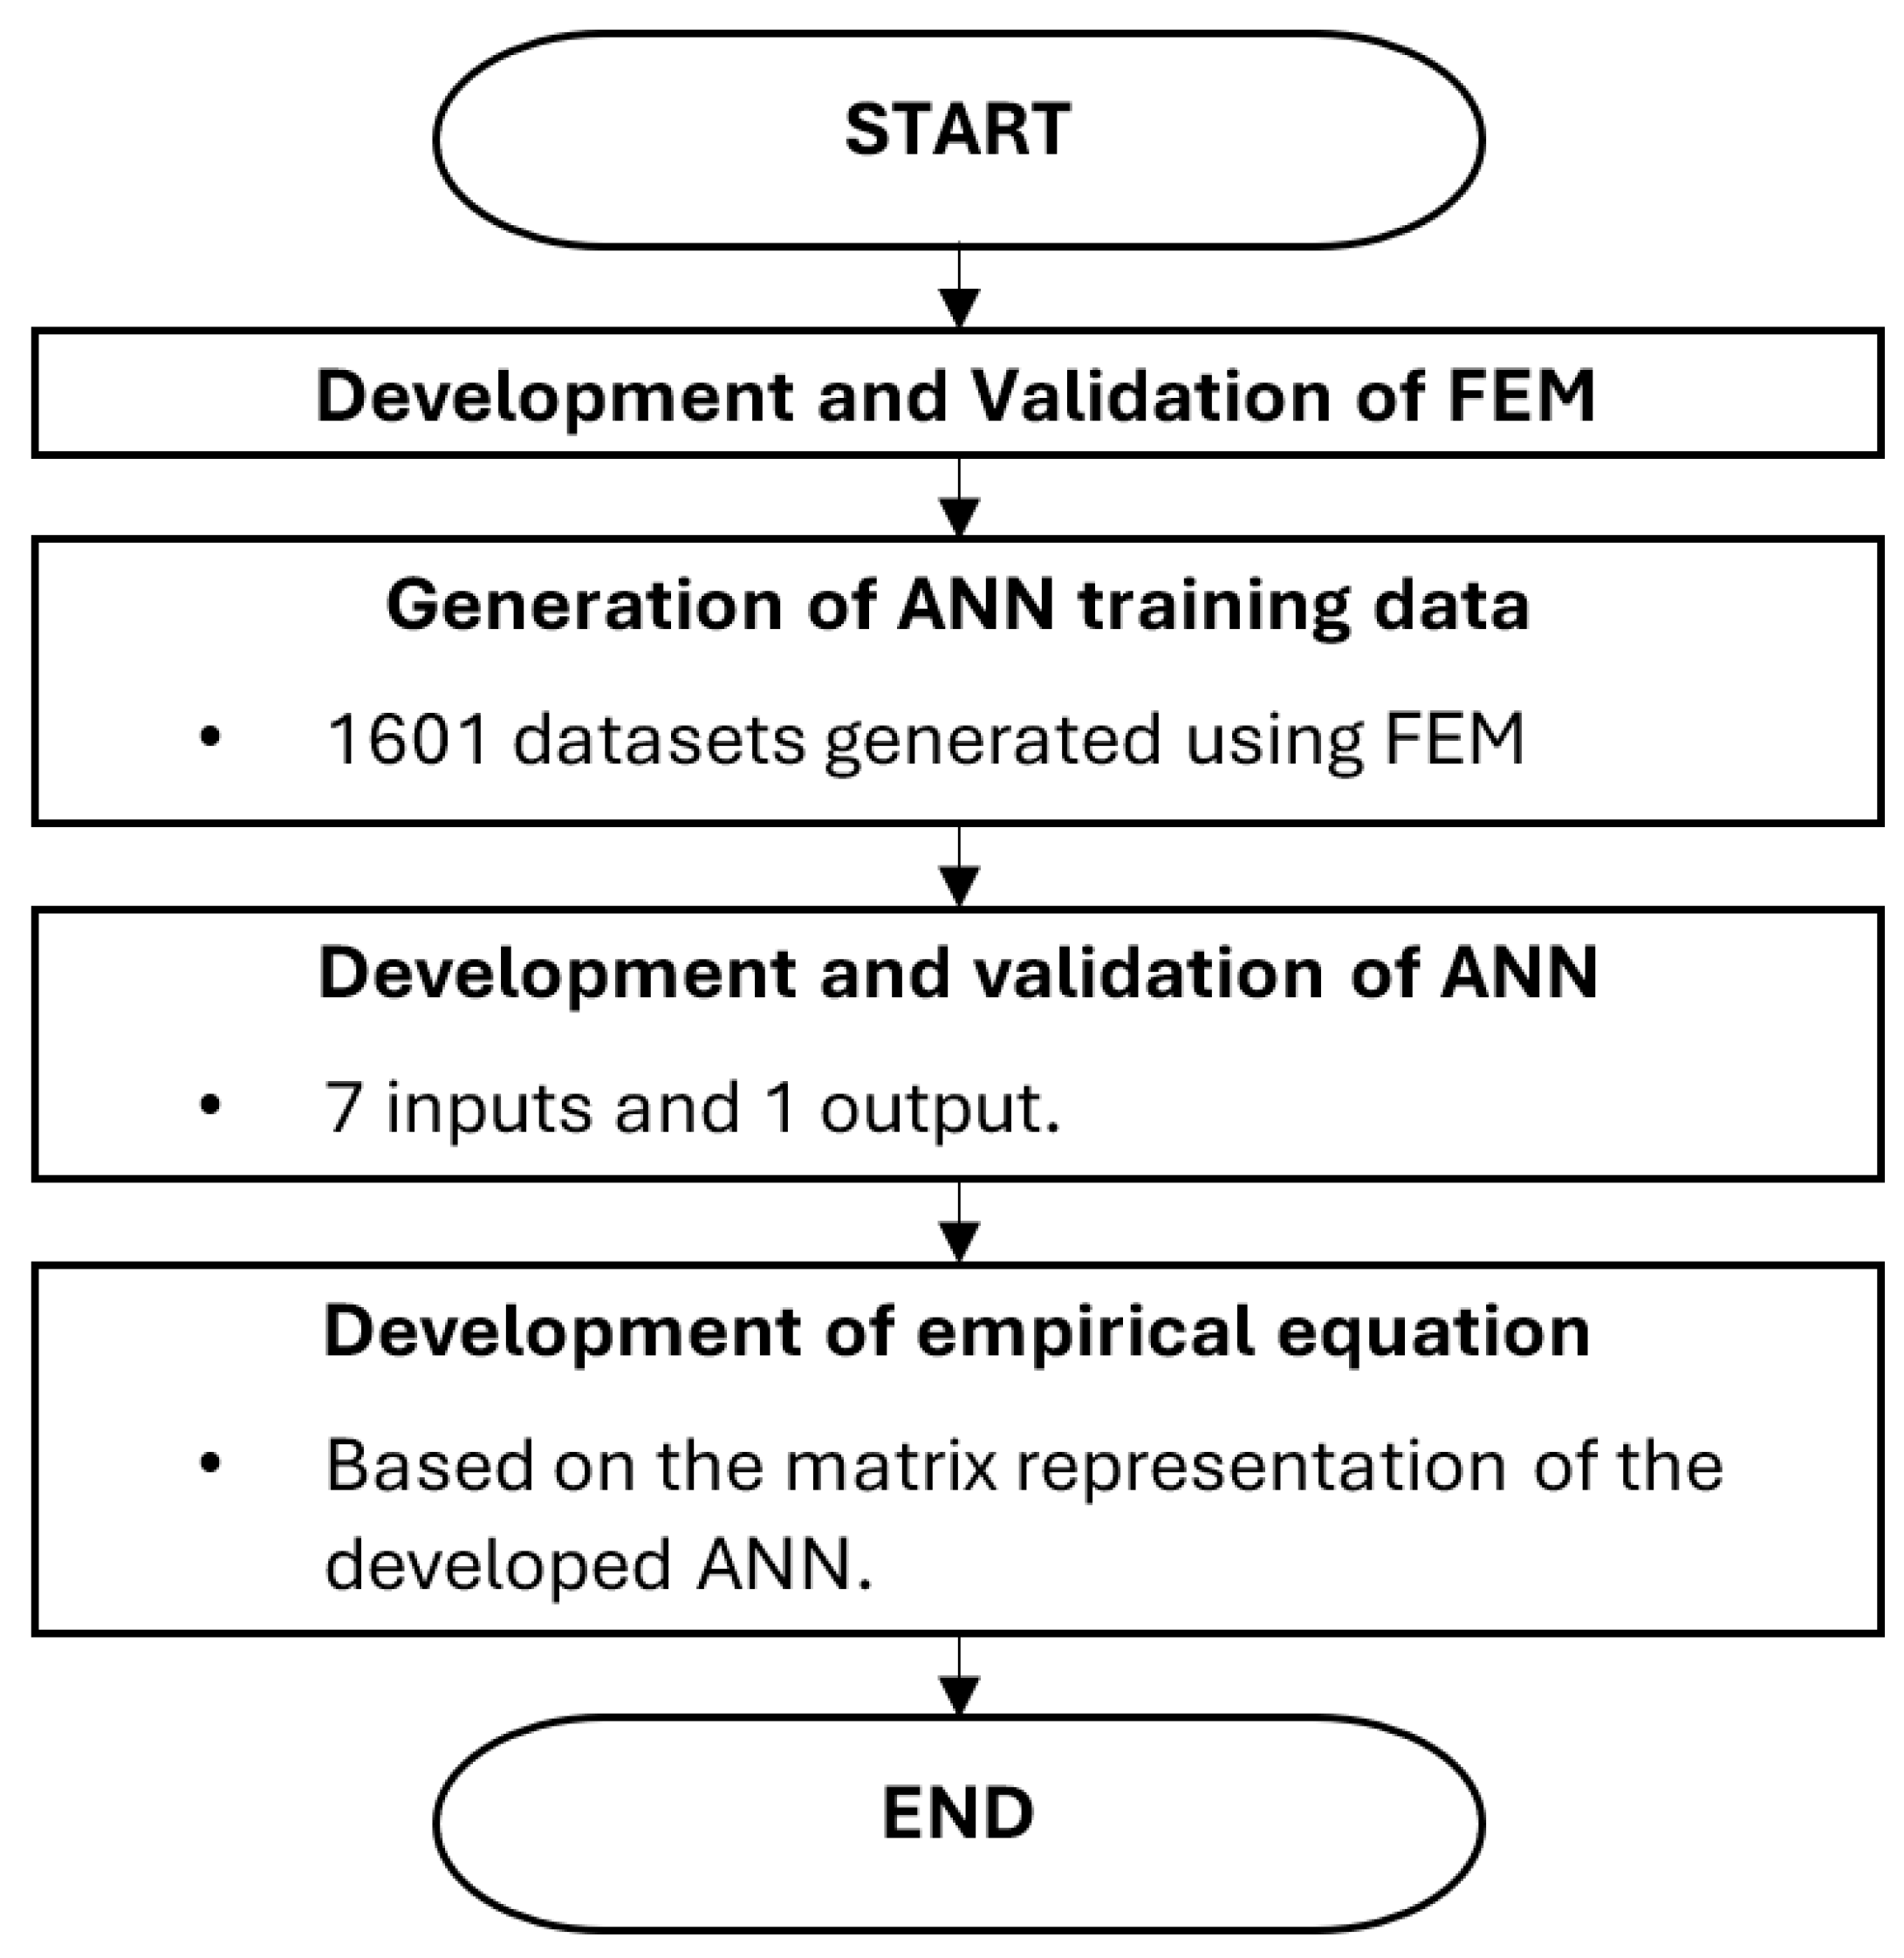
In this study, the incorporation of an FEM and ANN was used to develop a set of empirical equations for the failure pressure prediction of corroded pipe elbows subjected to internal pressure and axial compressive stress. The developed FEM was validated using burst test data from previous studies. Upon validation of the FEM, ANN training data was generated and used to develop the ANN. The ANN was validated using regression analysis, and the validated model was then used to develop a set of empirical equations for failure pressure prediction of corroded pipe elbows. The overview of the research is illustrated by the flowchart in
Figure 1.
2.1. Geometric Parameters
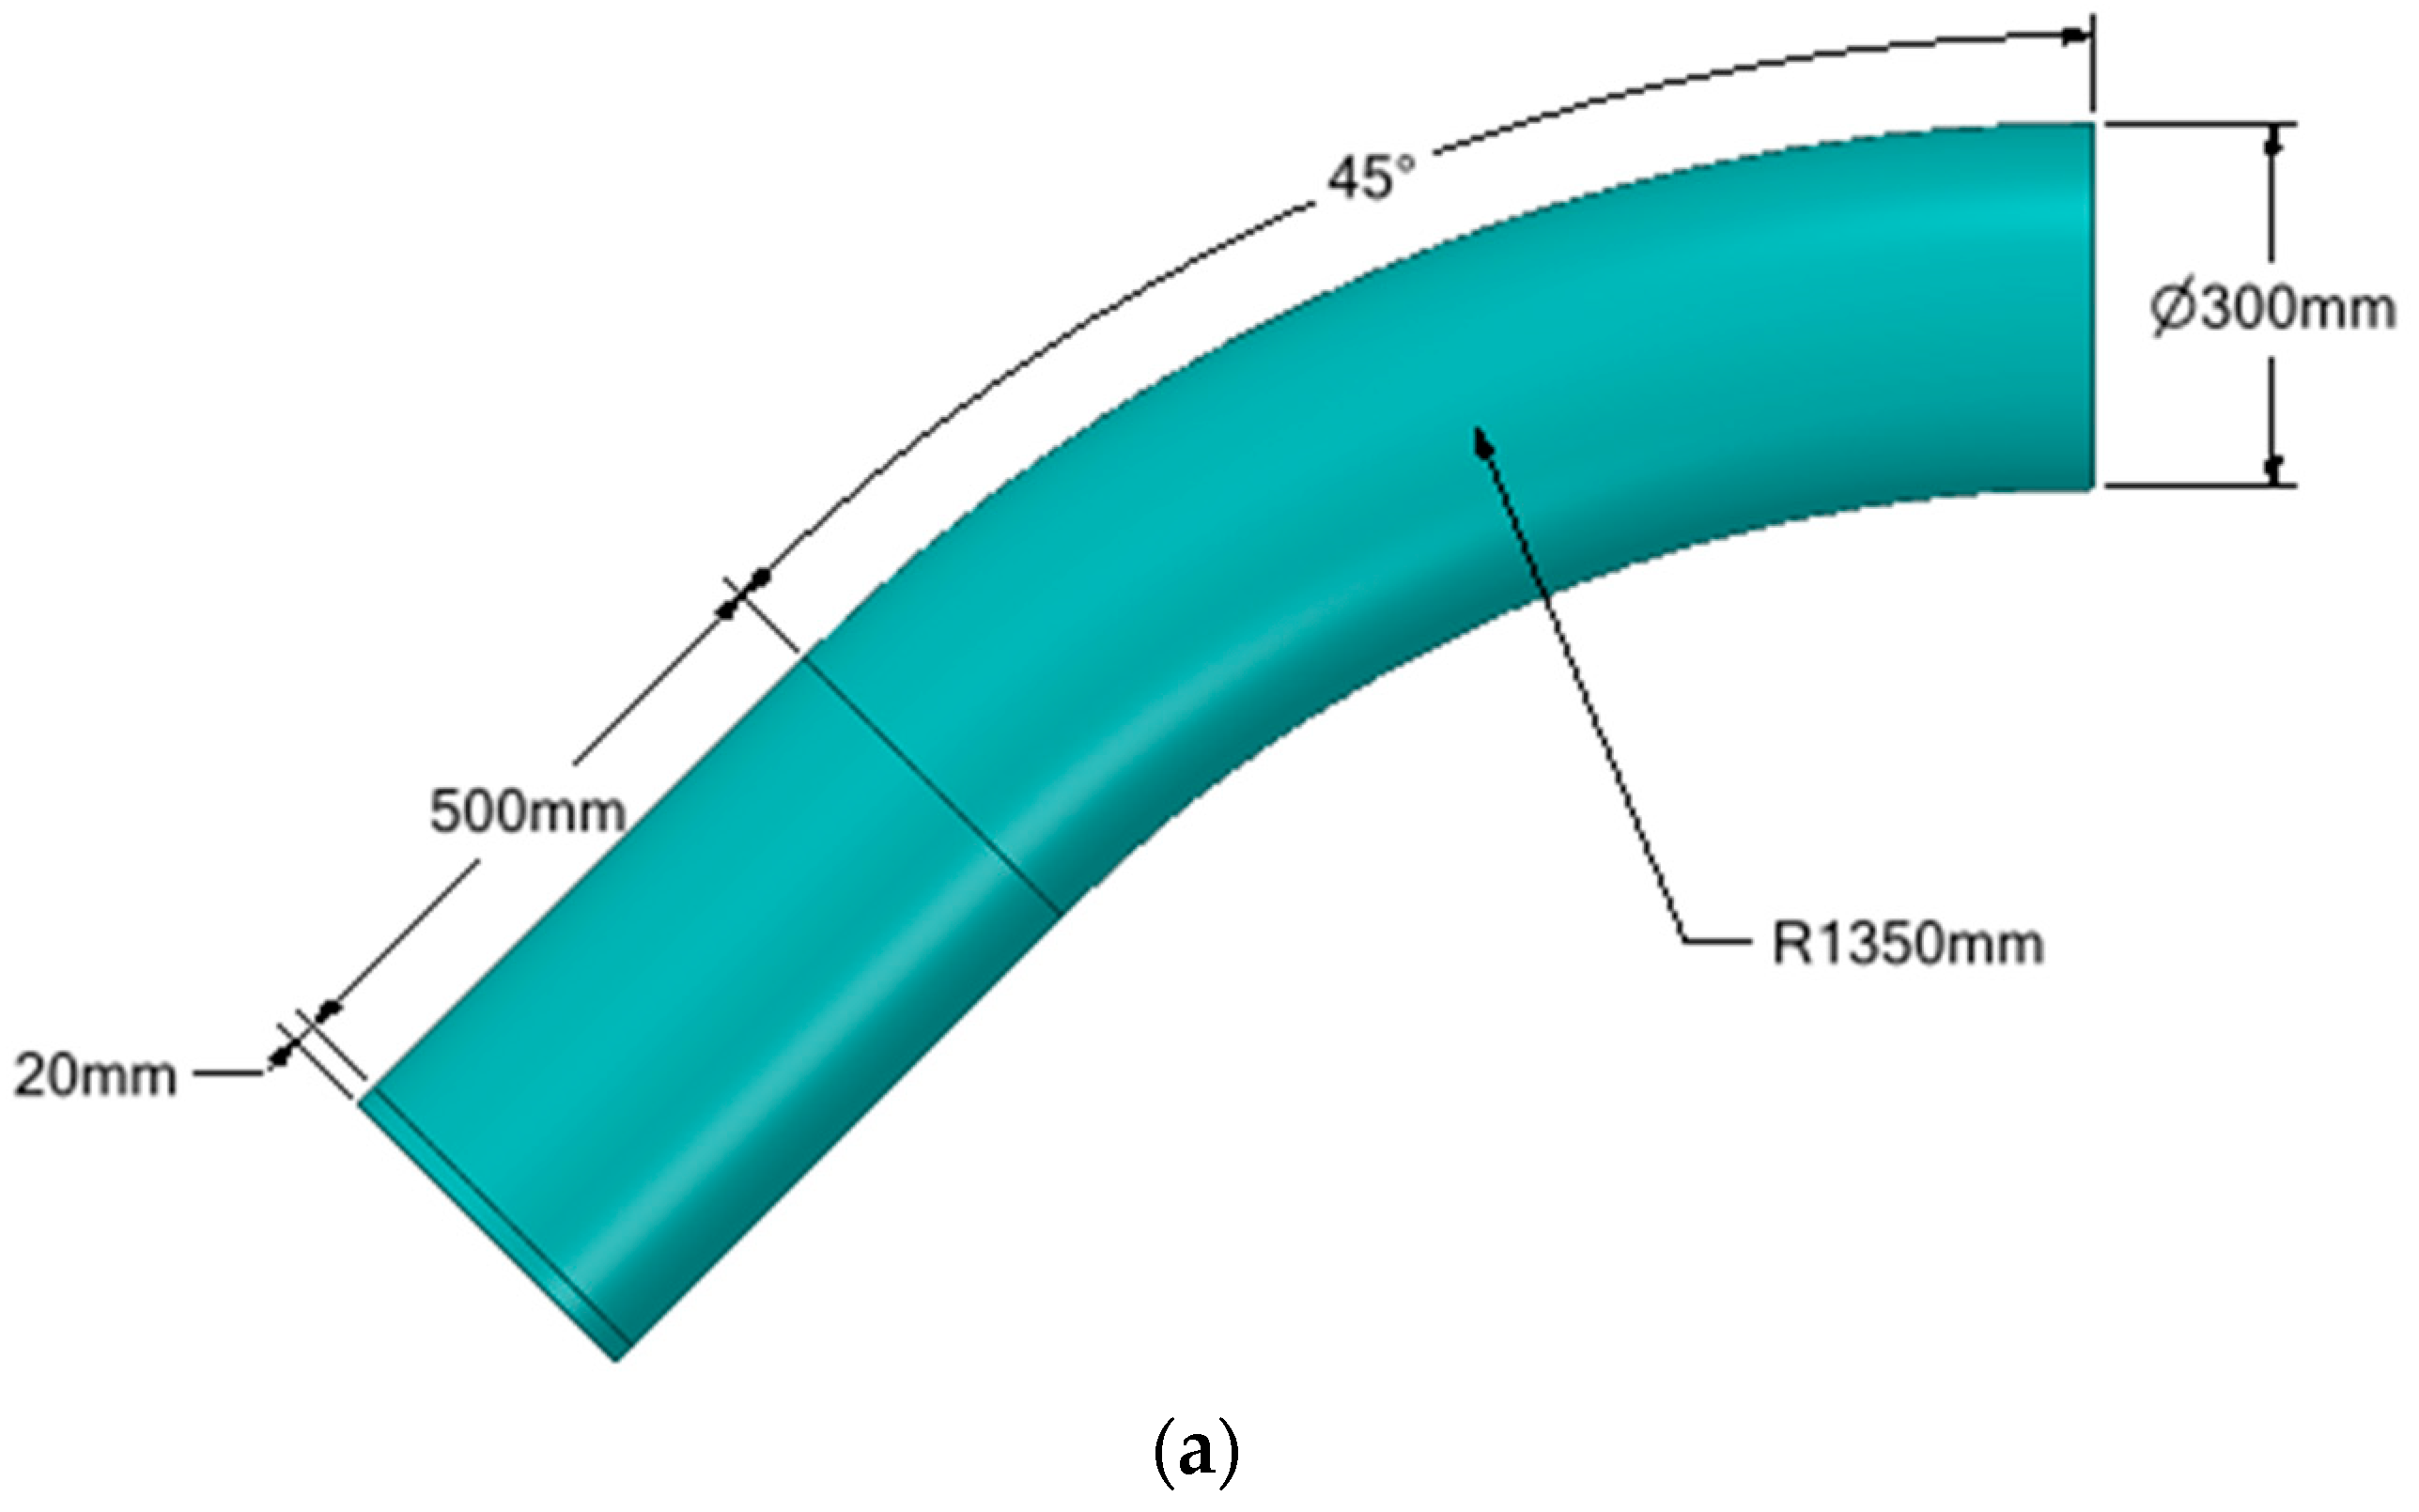
This study considers five parameters for investigation: the defect depth, length, spacing in both longitudinal and circumferential directions, and axial compressive stress acting on the pipe. These parameters are represented as normalised values, as tabulated in
Table 1. The chosen range of parameters was based on critical parameters determined from past research [
12]. The pipe diameter,
, and wall thickness,
, were set to 300 mm and 10 mm, respectively. The bending radius of the pipe elbow and the width of the corrosion defect were fixed at 4.5
and 100 mm, respectively. The modelled pipe elbows for finite element analysis (FEA) were designed with endplates of 20 mm.
2.2. Pipe Material Properties
This study utilised three pipe grades: API 5L X70, API 5l X80, and API 5L X100. These pipe grades were selected as they are the most common pipe grades used in the industry recently [
2,
12,
21,
22]. During finite element (FE) simulations, the material properties of these pipe grades were represented as nonlinear true stress-strain curves, as illustrated in
Figure 2. The mechanical properties of the pipe materials and endplate are summarised in
Table 2.
2.3. Validation of the Finite Element Method
The FEM employed in this study was validated using burst test results from past literature. The results of the validation study are summarised in
Table 3.
Based on the results in
Table 3, the maximum failure pressure difference observed was −2.81%. Hence, it is evident that the employed FEM is capable of producing highly accurate failure pressure results.
2.4. Generation of Training Data Using Finite Element Method
The training data for the development of the ANN was generated using the FEM. A total of 1601 datasets were generated. During the FE simulations, quarter models (
Figure 3) were utilised to minimise computation time without compromising the accuracy of results. A 500-mm straight pipe section was added to the pipe bend section to prevent endcap effects. A rectangular-shaped defect idealisation was used in this study [
11].
A mesh convergence test was conducted to optimise the number of elements the models were discretised into. A finer mesh was used at the defect region while the mesh size was increased with an aspect ratio of 0.5, moving away from the defect region. Symmetry boundary conditions were applied at appropriate axes to ensure that the quarter model was represented as a whole. The model was constrained from translation and rotation in the x, y, and z directions at the outer surface of the endplate to prevent unwanted rigid body movement.
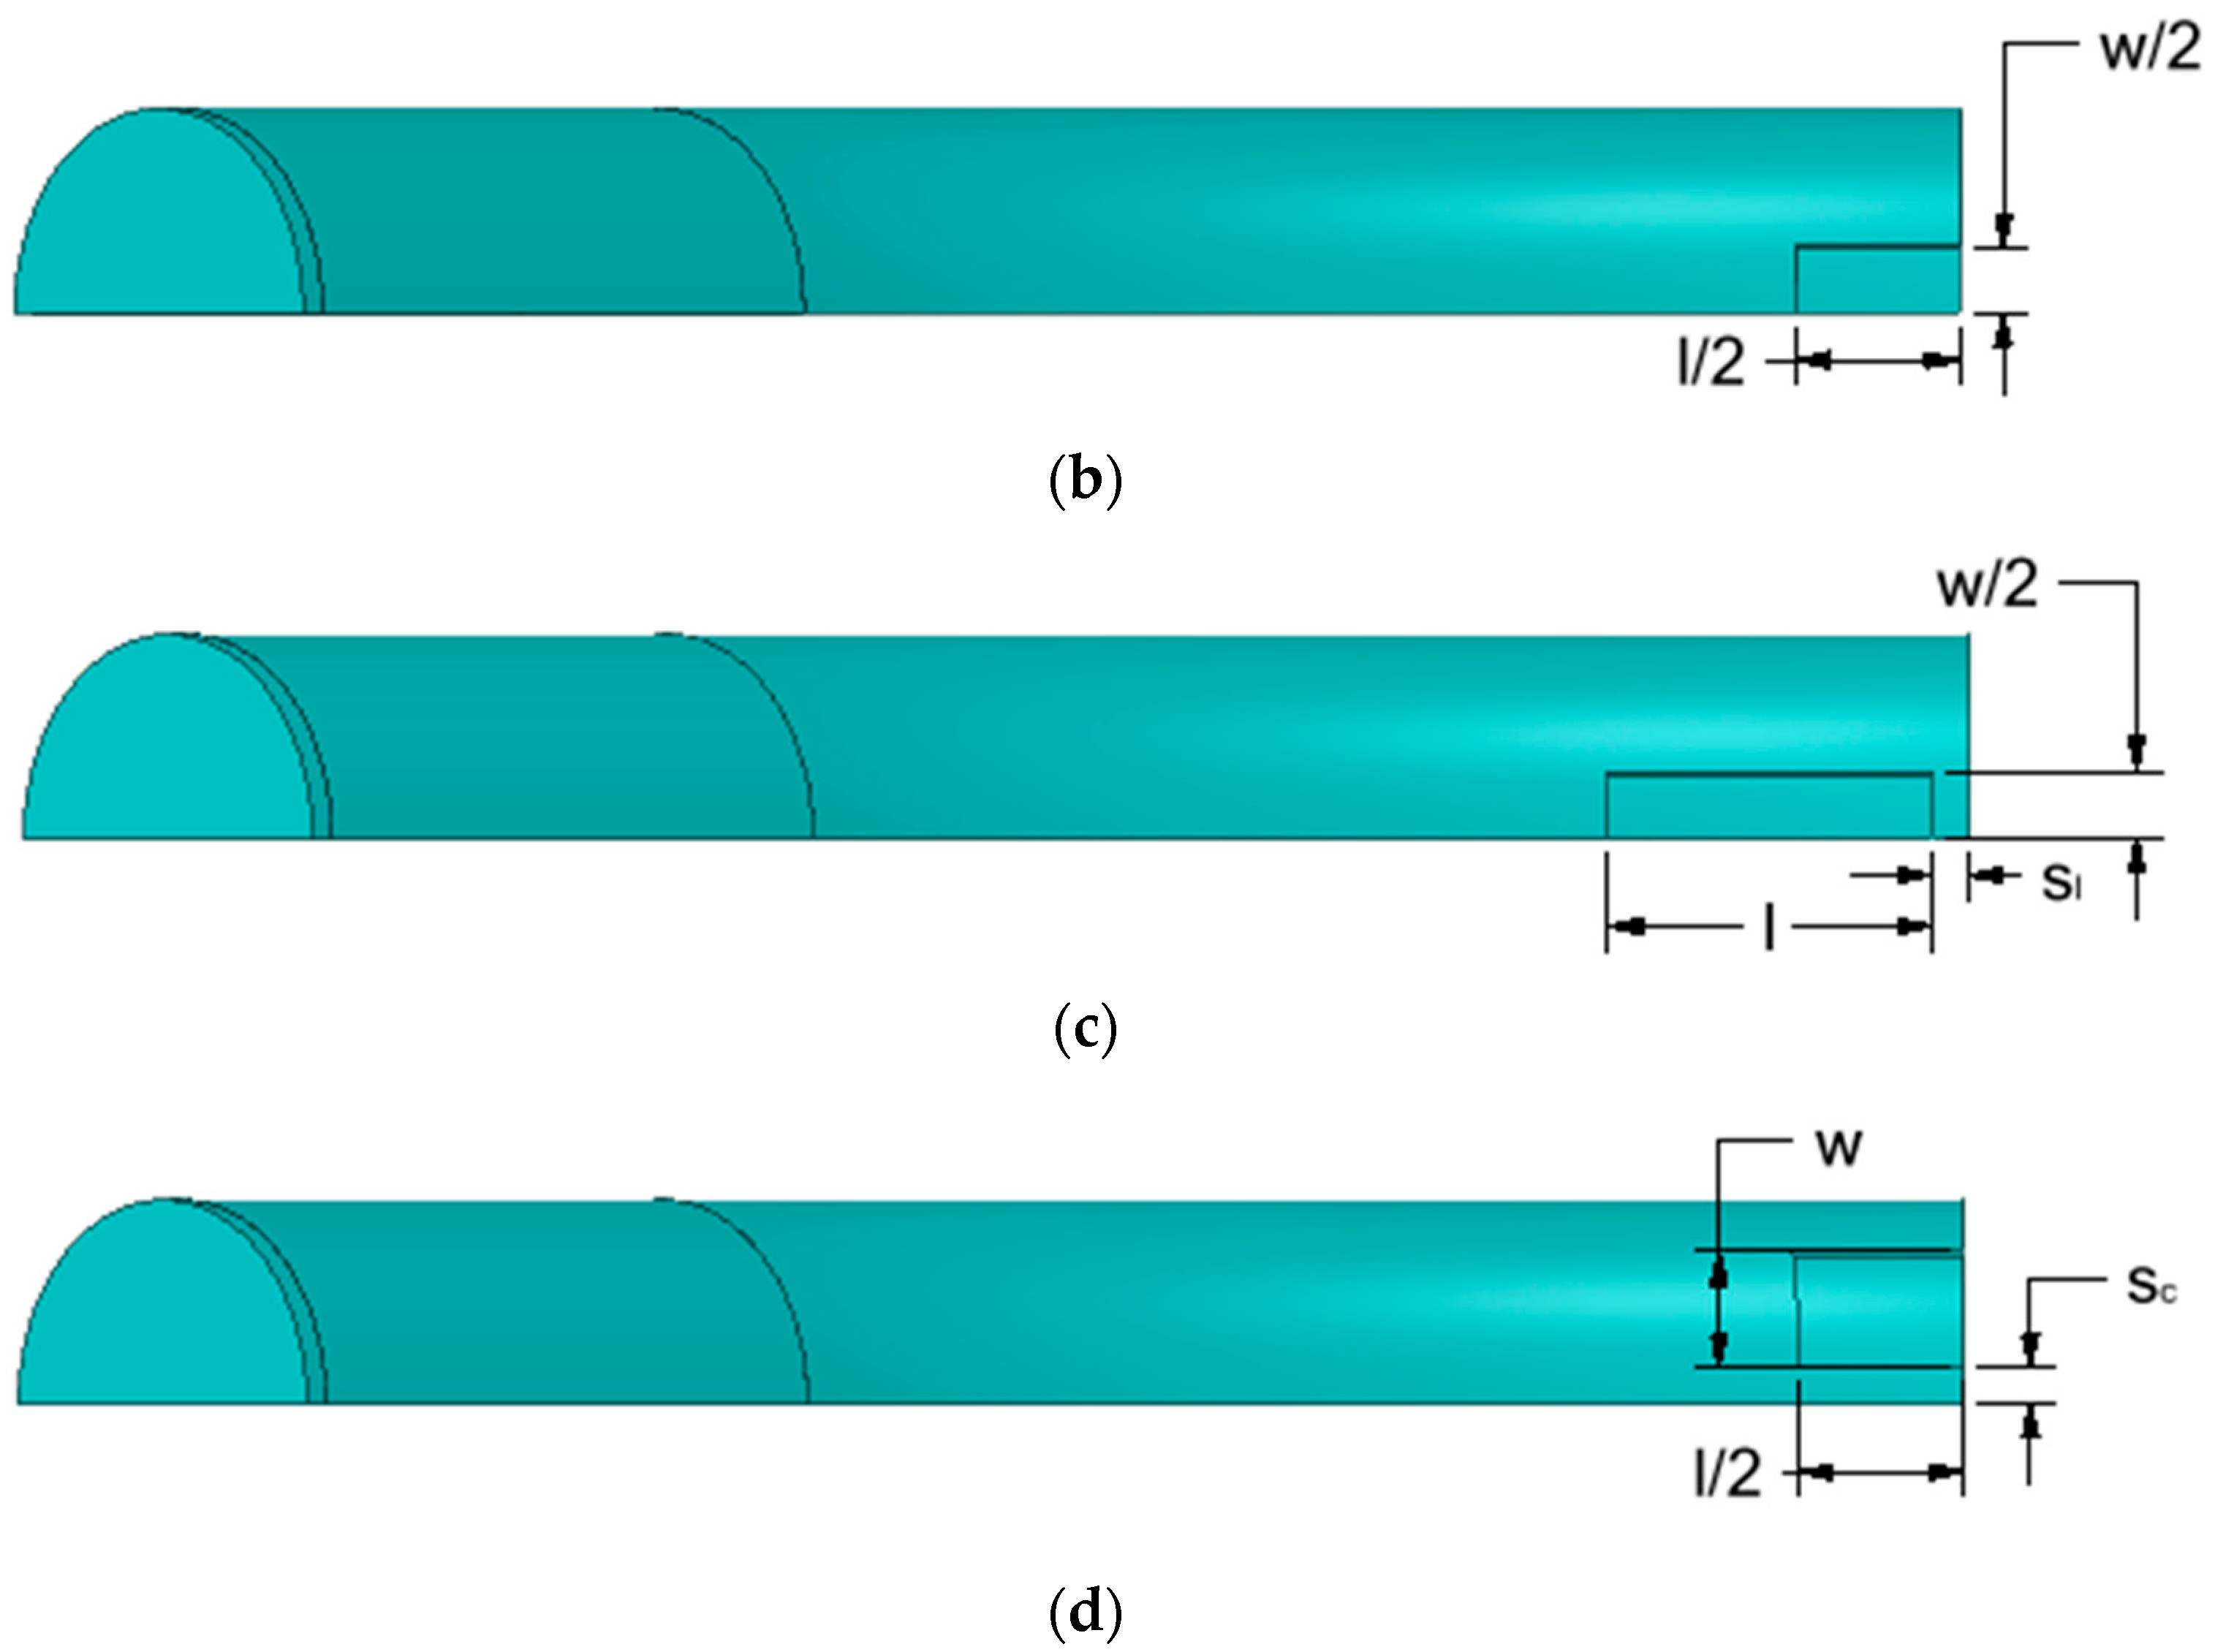
A direct nonlinear transient analysis utilising a time-dependent dynamic load was considered. During the FE analysis, internal pressure and axial compressive stress were applied to the model simultaneously in one timestep. A constant force was applied to the outer surface of the endplate representing axial compressive stress, while pressure was applied incrementally to the inner surface of the pipe representing internal pressure, as illustrated in
Figure 4. The pipe was assumed to be isotropic and homogenous, and the numerical analysis was conducted at isothermal conditions.
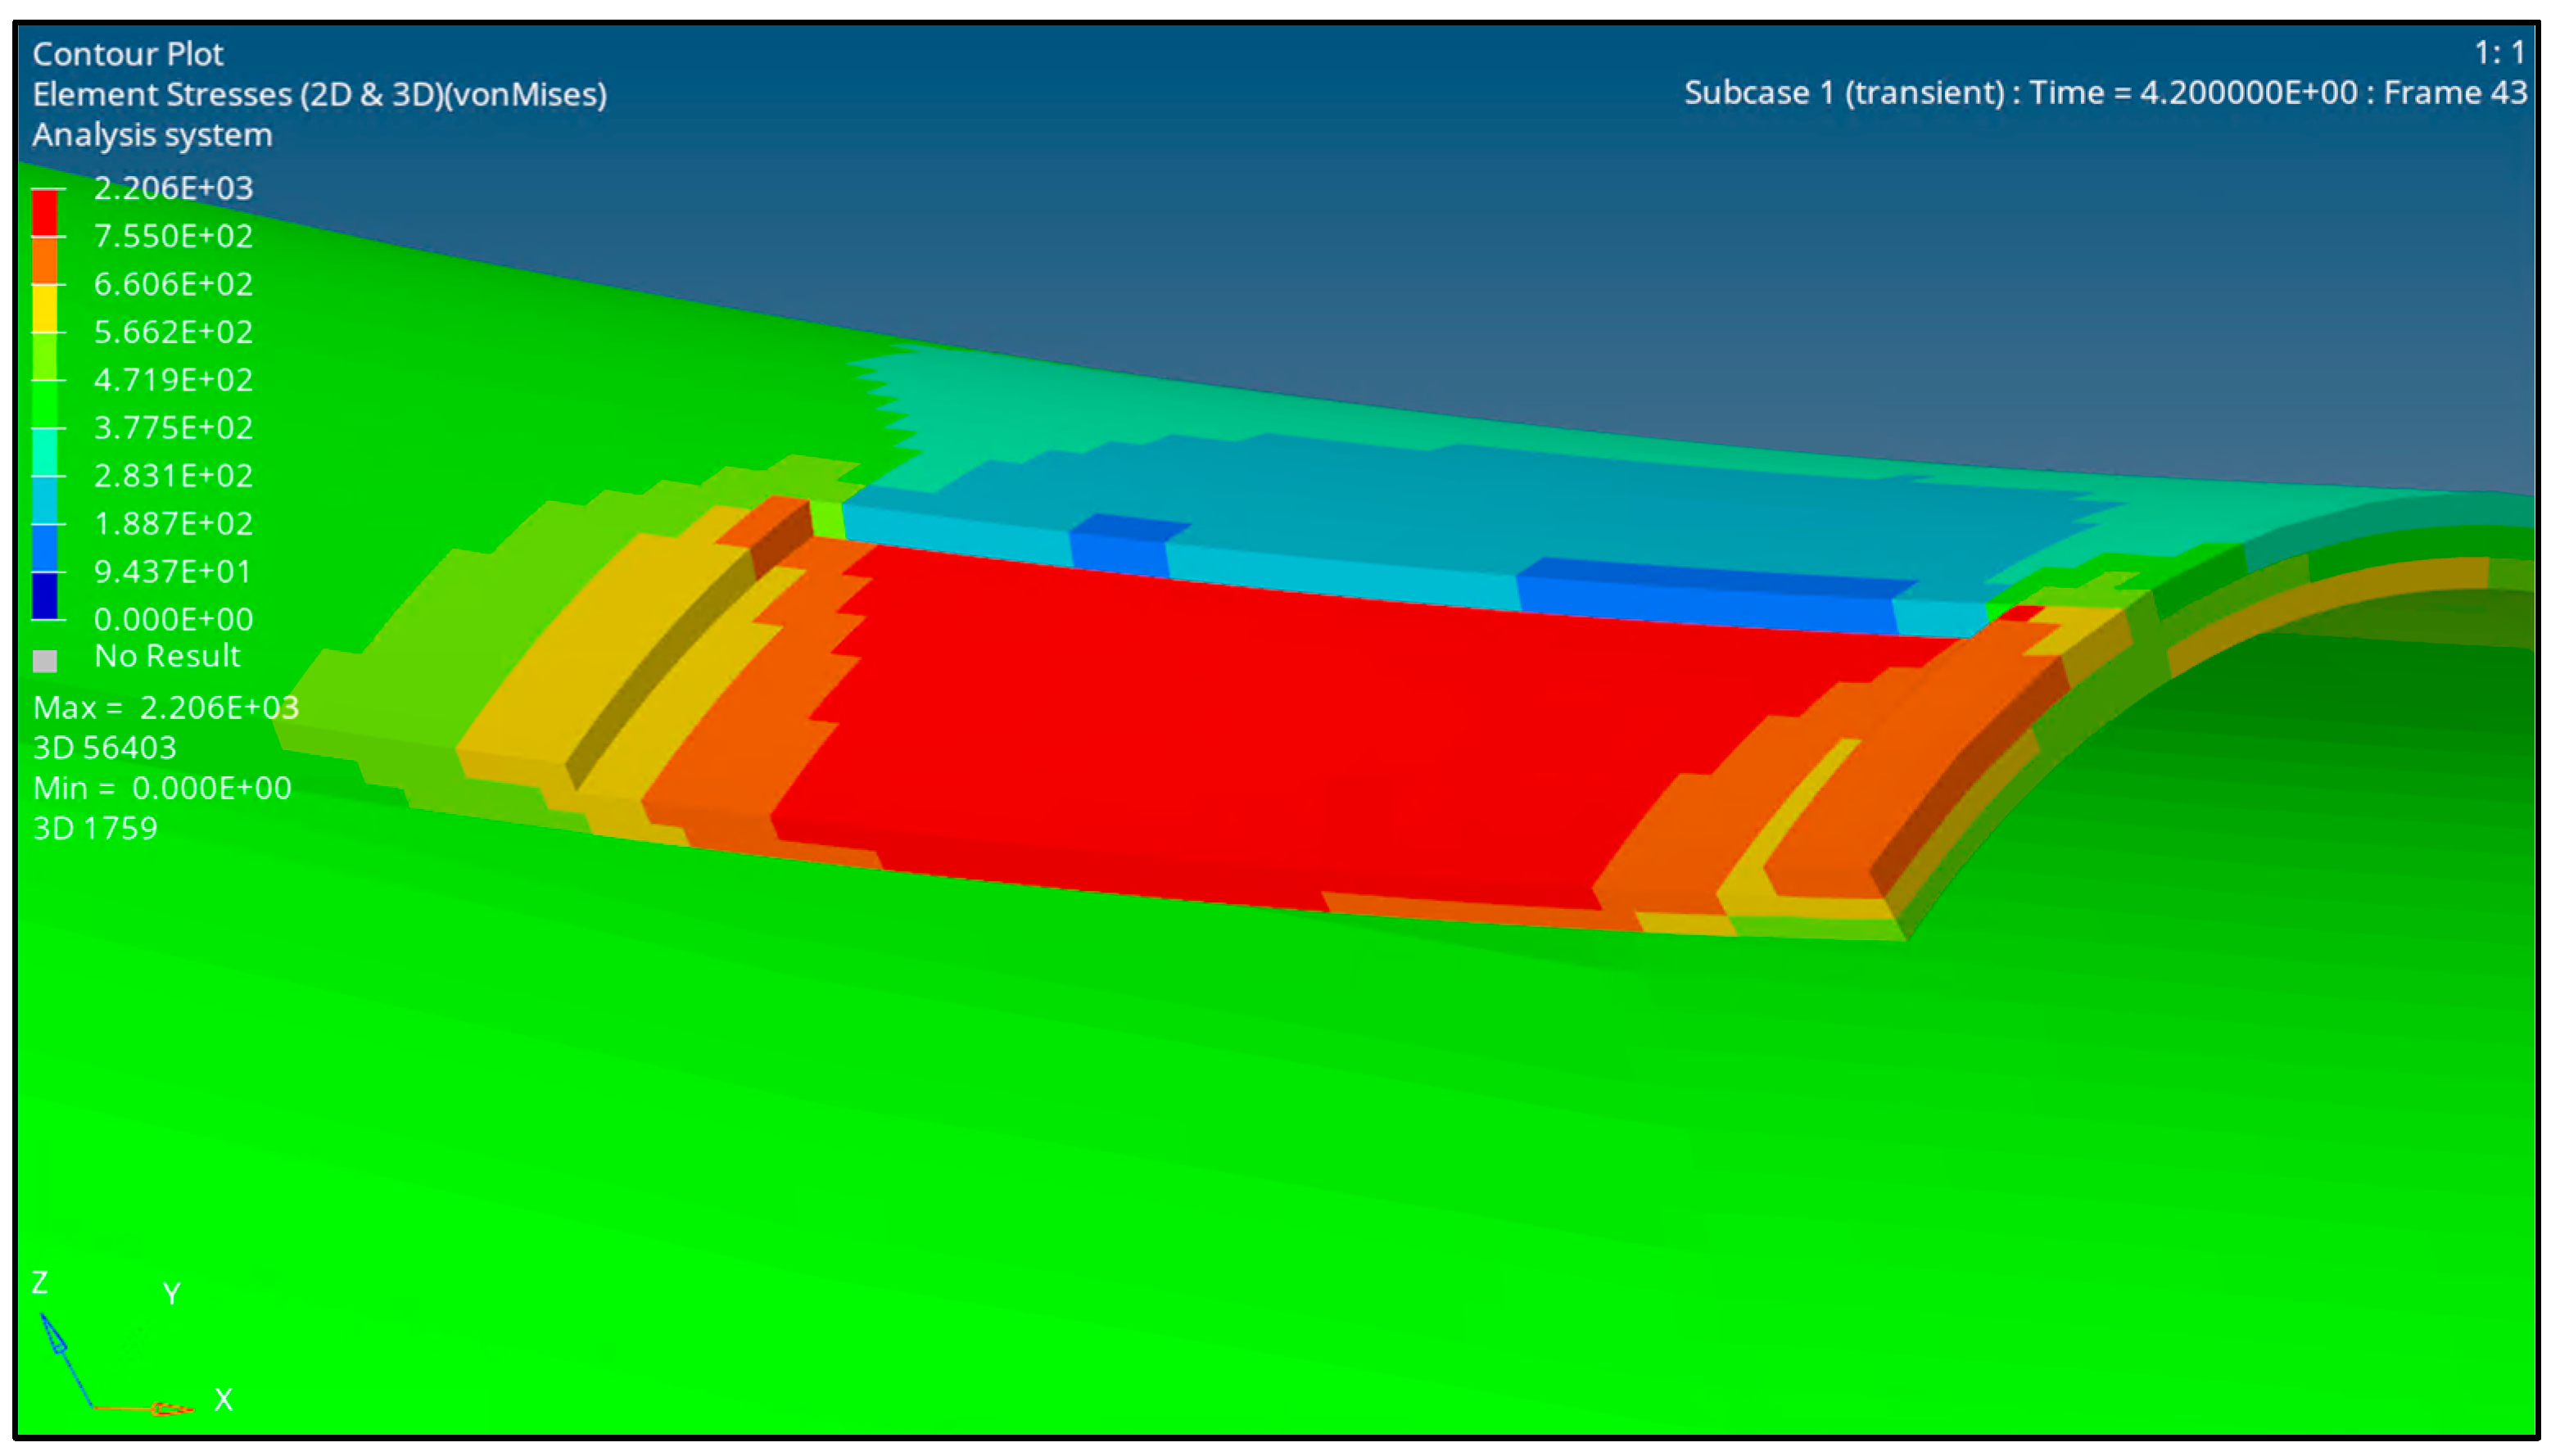
The failure of the pipe was analysed based on the von Mises stress criterion, where the pipe was assumed to have failed when the stress at the region of interest exceeded the true ultimate tensile strength of the material. The red contour region, as depicted in
Figure 5, represents the region of failure. The failure pressure is recorded when the red contour region completely penetrates the wall thickness.
2.5. Development of Artificial Neural Network
This study utilised the structure and dataflow of feed-forward neural networks (FFNN) with the Levenberg–Marquardt backpropagation algorithm (supervised learning) [
17]. This algorithm minimises the cost function (Equation (1)) by tuning the weights and biases of an ANN. In Equation (1),
denotes the predicted output of the ANN, while
denotes the expected output of the ANN. Data travels from the input nodes in the input layer to the output node in the output layer passing through artificial neural nodes in the hidden layers between the input and output layers. A hyperbolic tangent activation function was utilised at the neurons in the hidden layers, while a linear activation function was applied at the output neuron.
A total of 70% of the training dataset was introduced to the ANN for training, while the remaining data was reserved as validation (15%) and testing (15%) data. The validation dataset was used to obtain an unbiased assessment of the neural network to fit the training parameters while the hyperparameters of the network were being tuned. Meanwhile, the testing dataset was used to obtain an unbiased assessment of the final model fit on the training data. To tune the ANN parameters, the algorithm computes the lowest possible gradient that can be achieved using Equation (2). The ANN was developed with the optimum number of hidden layers and neurons by analysing the regression plots of the ANN. It was ensured that the developed ANN achieved an R
2 value of 0.99 or greater.
3. Results and Discussion
The results and discussion section of this study is divided into three subsections covering the development of the ANN, followed by the development of the empirical equations, and the failure behaviour analysis of corroded HSS pipe elbows.
3.1. Development of Artificial Neural Network
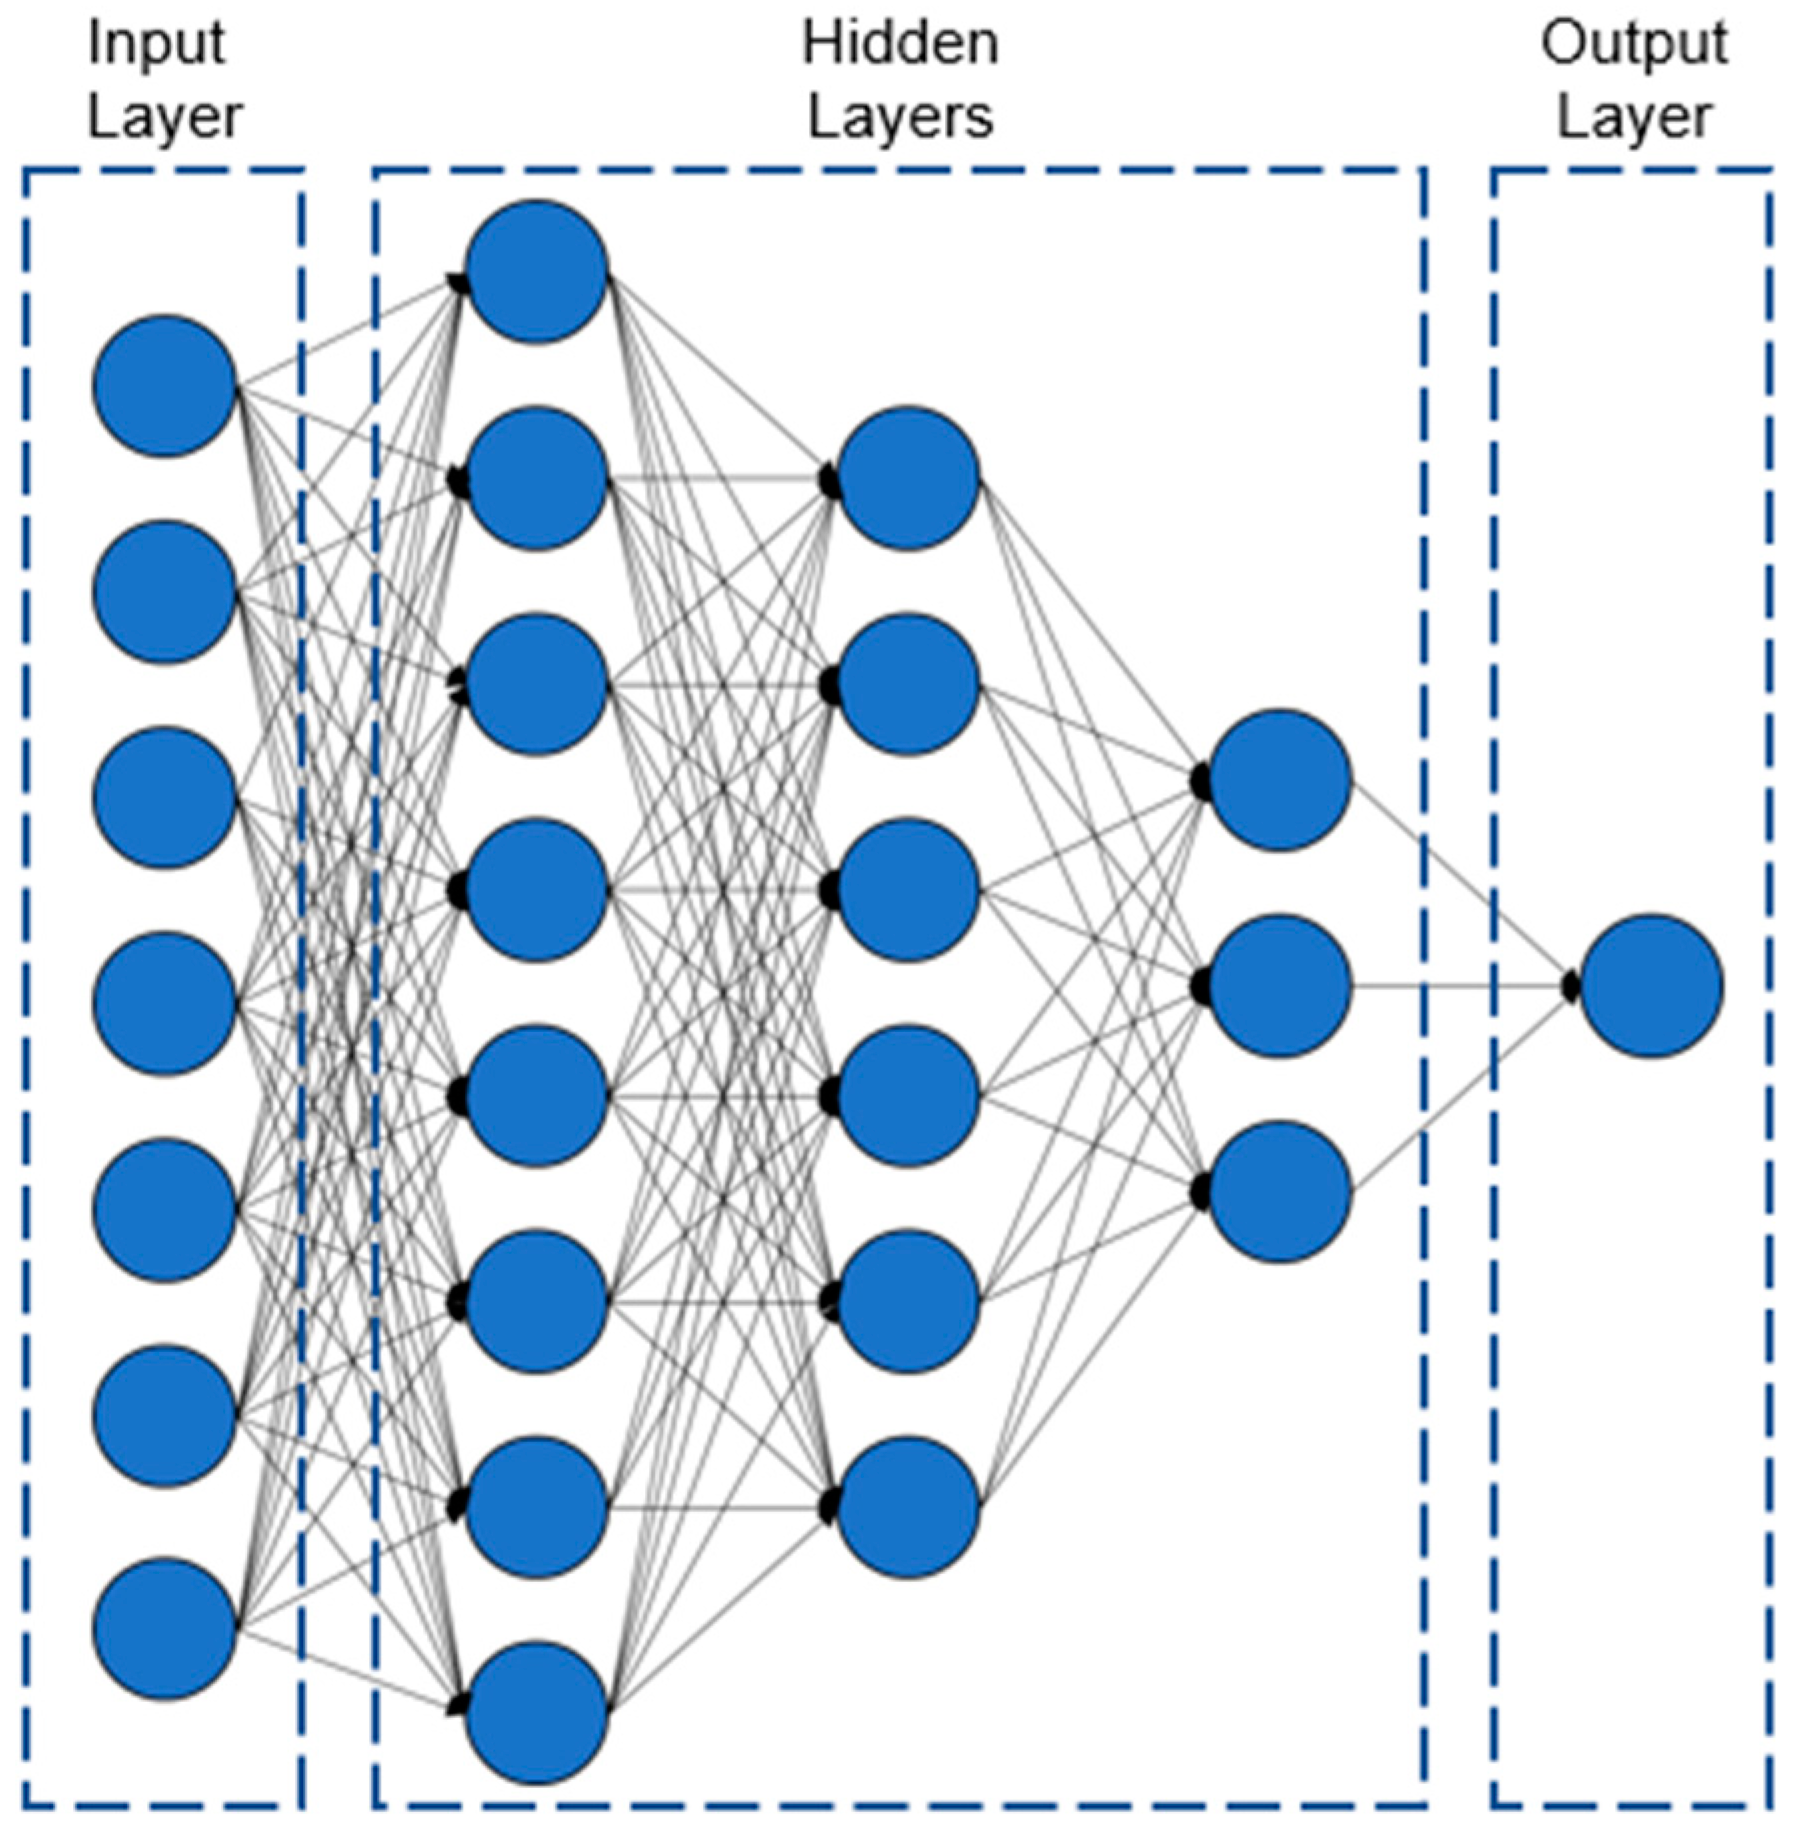
The input parameters of the ANN were the normalised defect depth, length, longitudinal and circumferential spacing, normalised axial compressive stress, the ultimate tensile strength of the material, and the location of the corrosion defect. The ANN was therefore developed with seven neurons in the input layer. The output layer consisted of one neuron, which output the corresponding normalised failure pressure of the corroded pipe. The ANN consisted of three hidden layers with eight neurons in the first hidden layer, six neurons in the second hidden layer, and three neurons in the third hidden layer, as illustrated in
Figure 6.
A total of 1601 datasets were used to train the FFNN. The training parameters of the ANN are summarised in
Table 4. A regression analysis was conducted to measure the capability of the neural network to produce results close to the training data. The result of the regression analysis is summarised in
Table 5. Based on the regression analysis, it was observed that the developed ANN was highly capable of producing results highly similar to those of the training data.
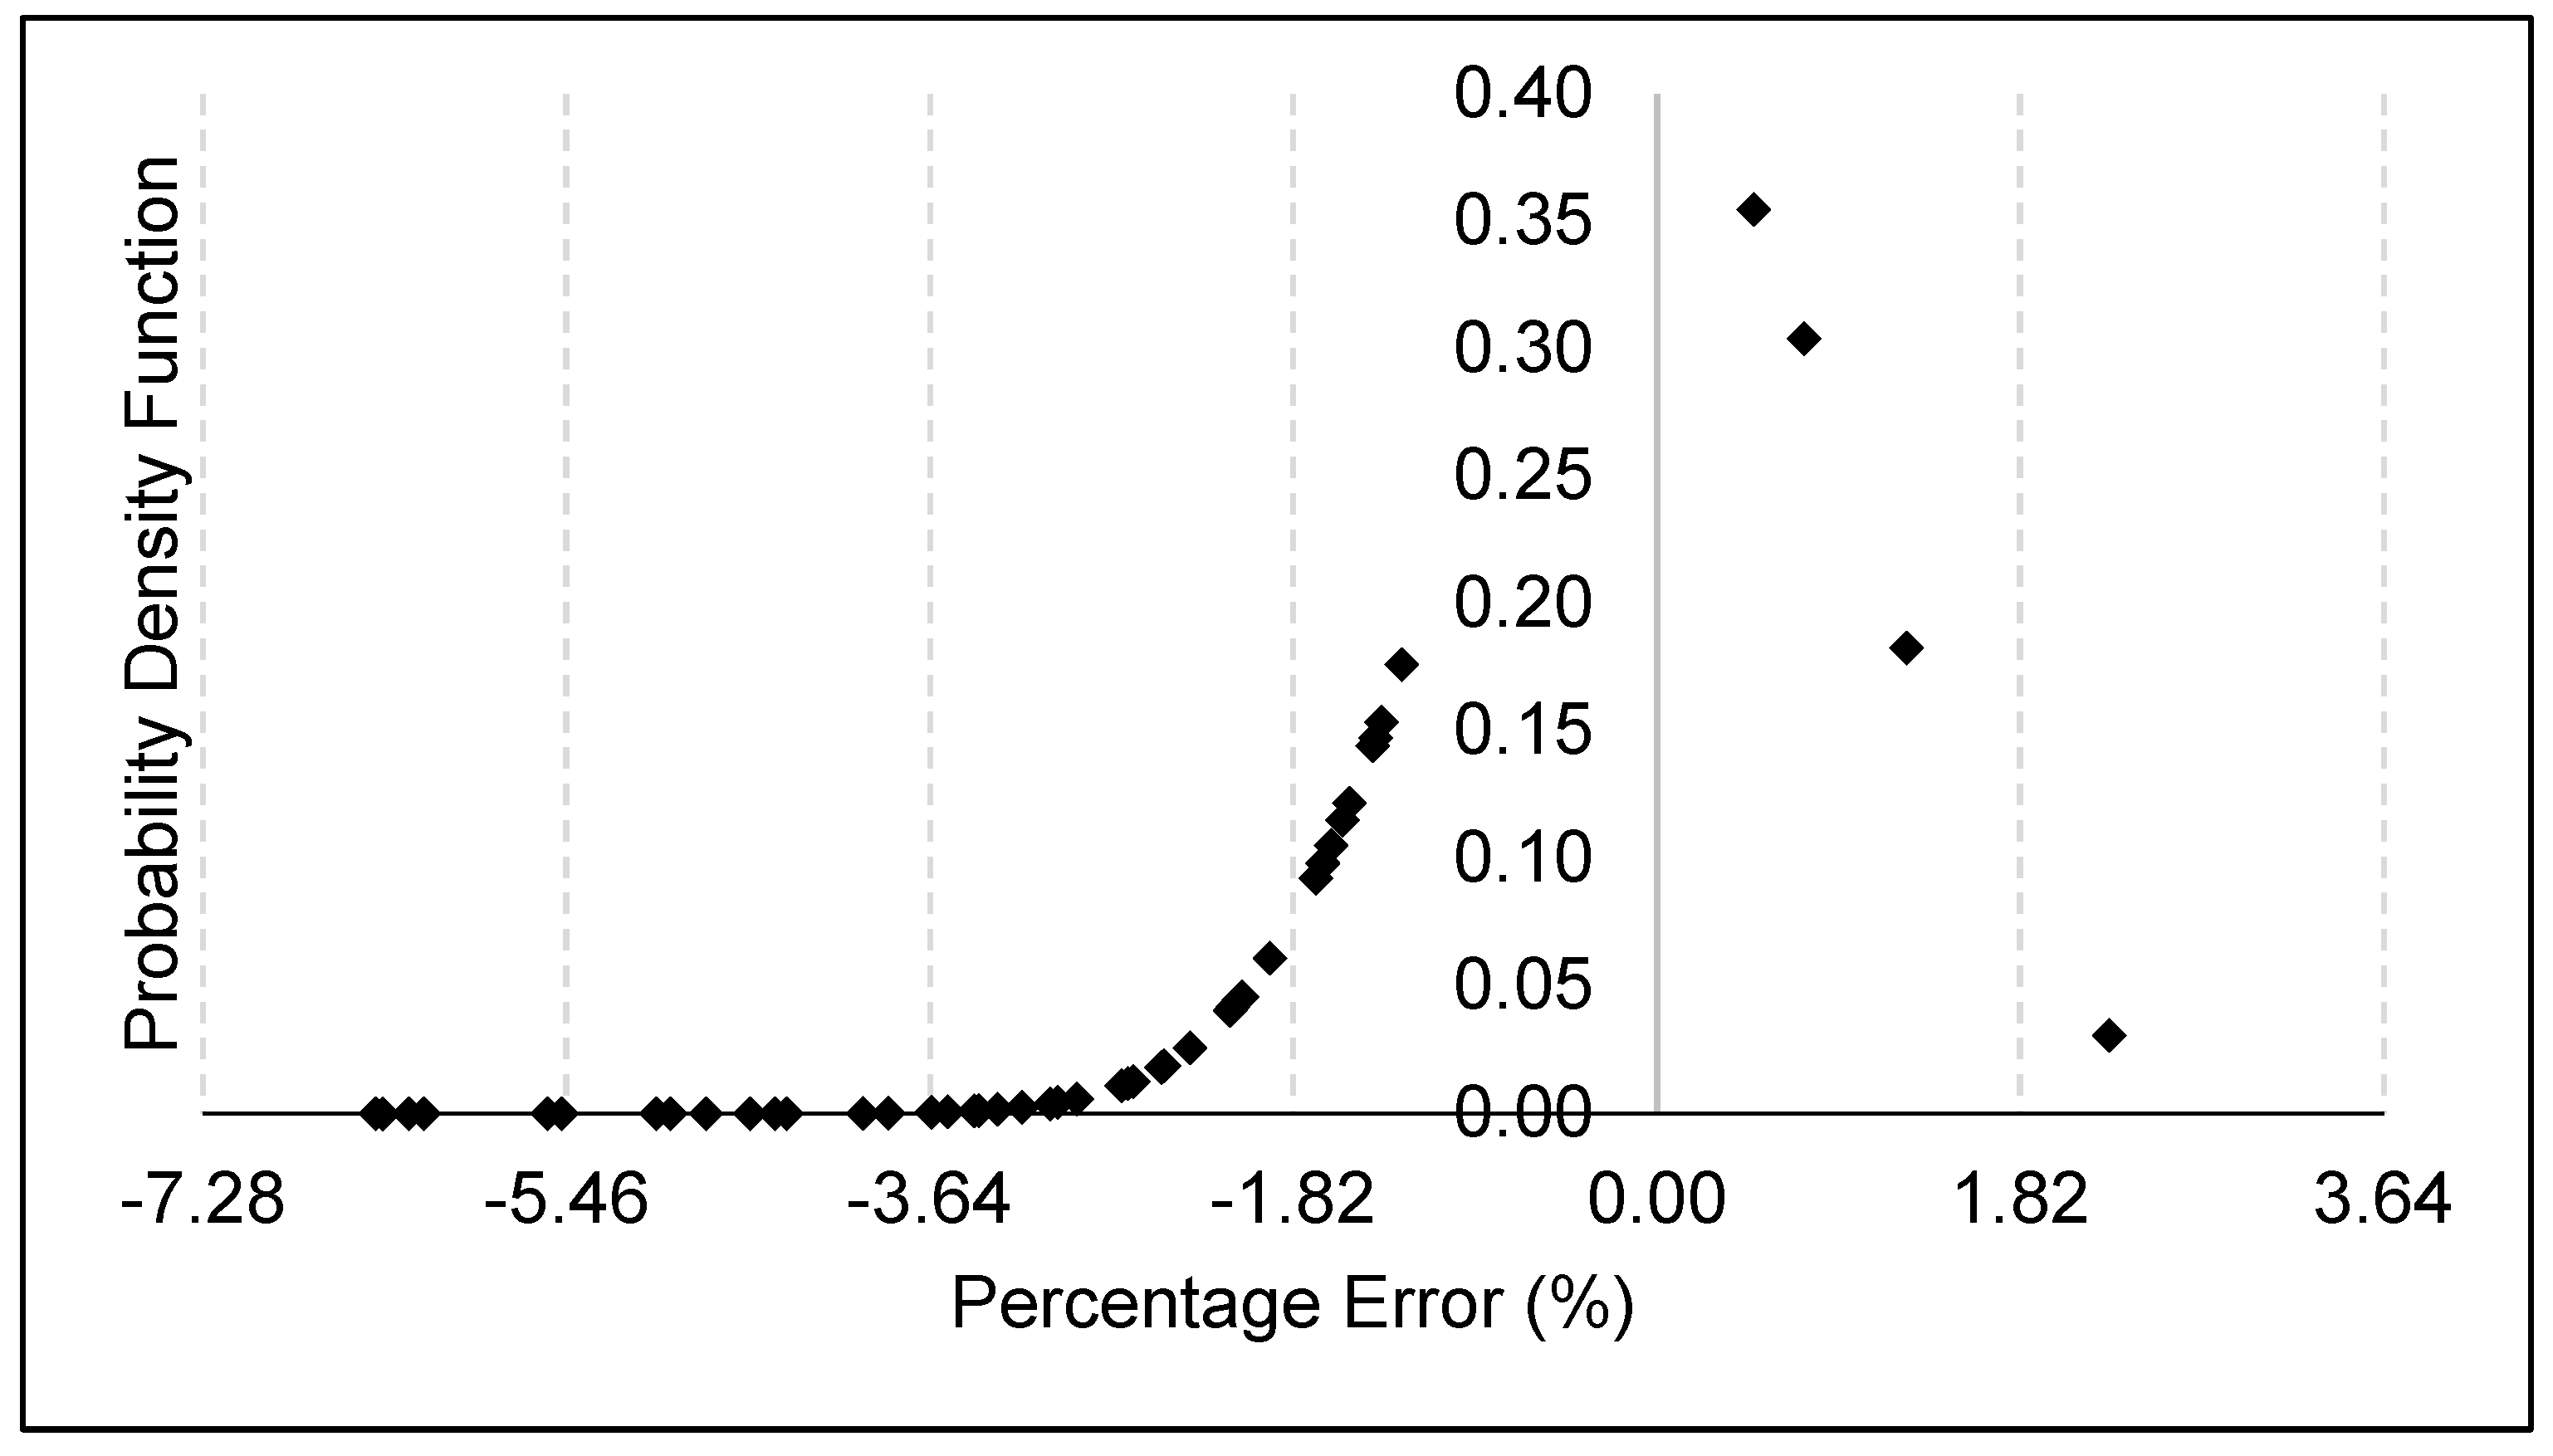
In addition to the regression analysis, the developed ANN was validated against an arbitrary dataset that was also generated using the FEM. A total of 30 datasets each for defects located at the intrados and extrados, respectively, were used to validate the ANN. The probability distribution of the percentage difference in failure pressure obtained using the FEM and the developed ANN is represented in
Figure 7. The maximum and minimum percentage difference obtained was 2.26% and −6.42%, respectively, while the standard deviation was measured to be 1.82. Based on
Figure 6, it was observed that the percentage differences fell within four standard deviations of the mean. As such, the probability of obtaining a percentage error of more than 7.28% is 1 in 15787. A small amount of overestimation was found in only 6.67% of the validation data, and the maximum overestimation was only 2.26%.
The developed ANN is applicable for the failure pressure prediction of corroded pipe elbows with single, longitudinally, or circumferentially interacting corrosion defects subjected to internal pressure and axial compressive stress. The ANN is capable of producing reliable results for pipe elbows of true ultimate tensile strength that range from 606.72 MPa to 890.88 MPa, with normalised defect depths of 0.0 to 0.8, normalised defect lengths of 0.0 to 1.4, normalised defect spacing (longitudinal and circumferential) of 0.0 to 2.0, and the normalised axial compressive stress of 0.0 to 0.8 for defects located at the intrados and extrados.
3.2. Development of Empirical Equation
An empirical equation to predict the failure pressure of an HSS corroded pipe elbow subjected to internal pressure, and axial compressive stress was developed based on the matrix representation of the ANN. Equations (3)–(6) are used to evaluate the failure pressure of a corroded pipe elbow. Equation (5) represents the activation function used for the ANN, while Equations (6)–(14) are used for the normalisation of the input parameters.
3.3. Failure Behaviour of Corroded High-Strength Steel Pipe Elbow
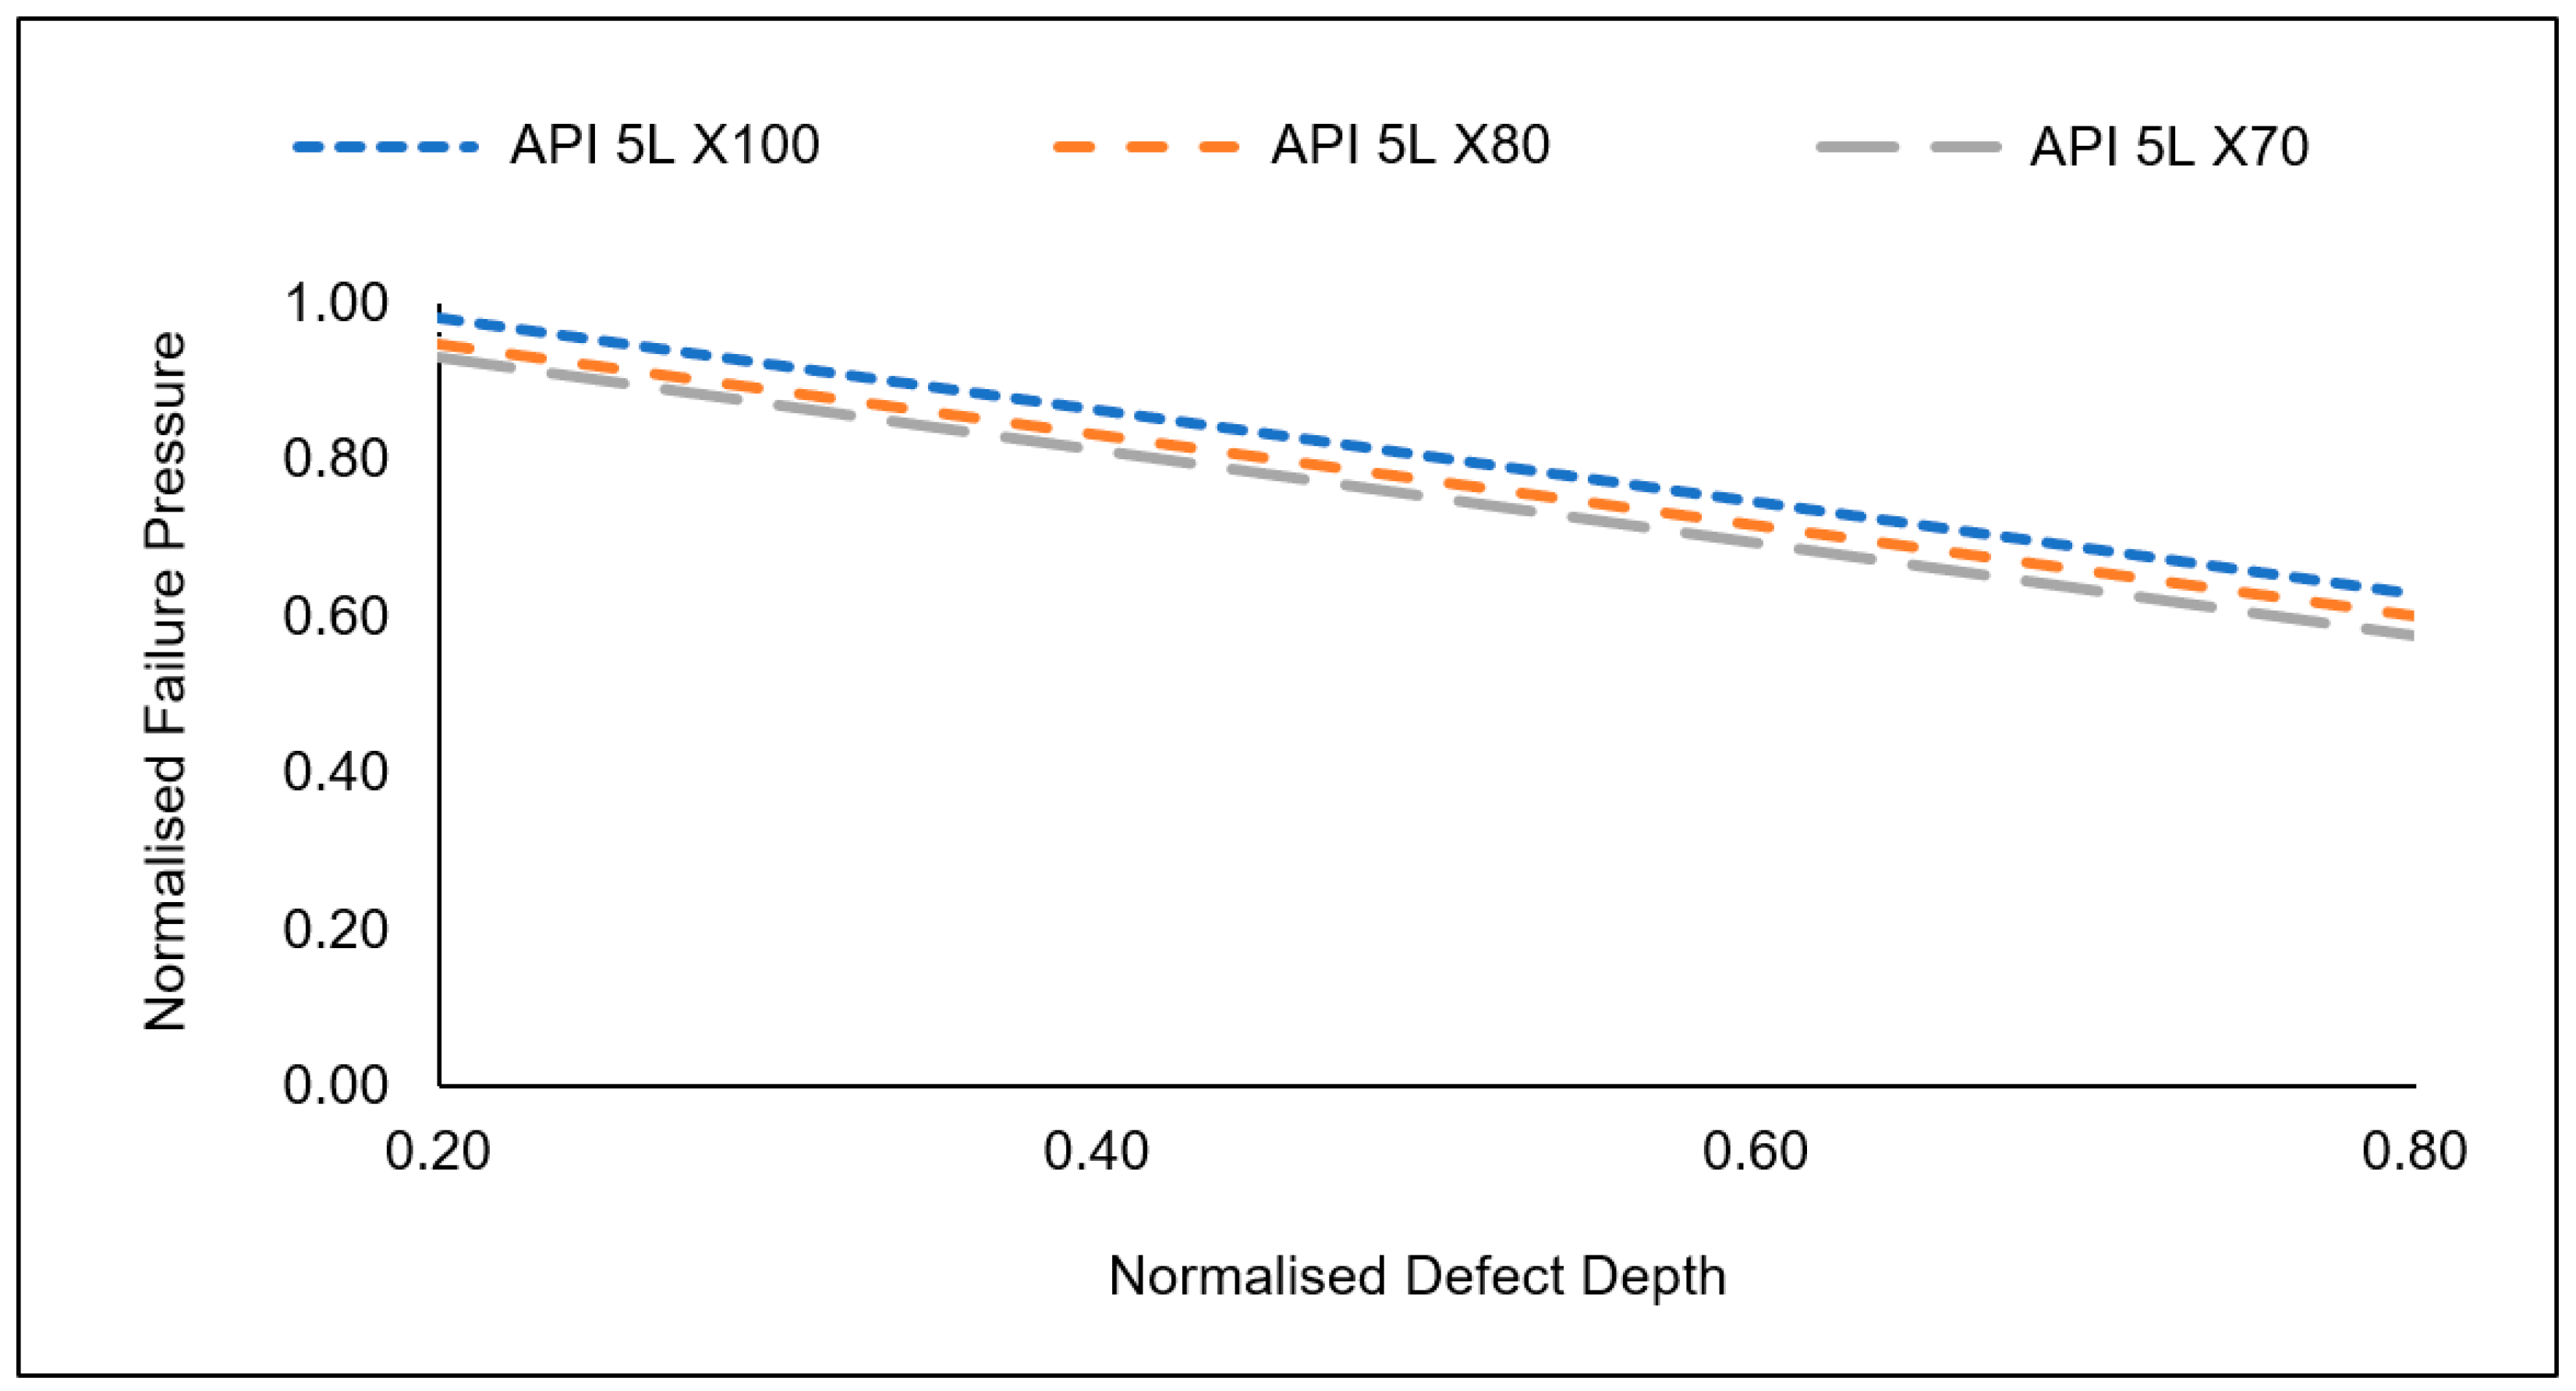
The developed empirical equation was used to carry out parametric studies to investigate the failure behaviour of corroded HSS pipe elbows subjected to internal pressure and axial compressive stress. Previous studies have looked into the influence of internal pressure on corroded pipe elbows. However, the incorporation of axial compressive stress has proven to be more detrimental to the failure pressure of a pipe elbow. In this study, the failure behaviours of three HSS materials were investigated. Based on the analysis, it was found that the trends in the failure behaviour of a corroded pipe elbow were similar regardless of the material’s true ultimate tensile strength. It should be noted that despite having the same trend, the significance of the drop in failure pressure was higher for materials with lower true ultimate tensile strength, as illustrated in
Figure 8.
In general, the incorporation of axial compressive stress in the analysis resulted in a significant drop in failure pressure for all cases investigated in this study. The magnitude of reduction in failure pressure increases as the defect depth and length increase. For shallow depths ( < 0.5) with a normalised defect length of 0.2 to 0.8, it was observed that the reduction in failure pressure was less significant (12.56–24.65%) as opposed to deep defects ( > 0.5). On average, the incorporation of axial compressive stress resulted in a (30.0–40.0%) drop in failure pressure. Evidently, axial compressive stress is a significant parameter that influences the failure pressure of a corroded pipe elbow and should be considered during corroded pipeline failure pressure assessments.
For all three materials, there was a significant reduction in failure pressure as the defect depth was increased with a maximum decrease of 78.3% observed for a corroded pipe elbow with longitudinally aligned interacting corrosion defects (normalised spacing of 0.0) of normalised defect depth of 0.8 located at the intrados subjected to internal pressure and a normalised axial compressive stress of 0.8. In all cases, the reduction in failure pressure was linear. Similar trends were observed in a study by Shuai et al. [
12]. Based on
Figure 9, this reduction in failure pressure is more significant at the intrados due to the stress concentrations in pipe elbow due to their geometry. Stress concentrations exist at the intrados, even when a pipe elbow is defect-free.
Not only the defect depth significantly influences the failure pressure of a corroded pipe elbow, but also the defect length. The defect length significantly influences the failure pressure until the critical defect length is reached. Beyond the critical length, the failure pressure plateaus. This scenario is illustrated in
Figure 10. In this study, the critical defect length was observed at a normalised defect length of 1.1. The maximum drop in failure pressure was observed to be 66.73% observed for a corroded API 5L X70 pipe with longitudinally aligned interacting corrosion defects with a normalised defect spacing of 0.0 (two defects adjacent to each other) located at the intrados with a normalised defect depth of 0.8, and a normalised defect length of 1.4. Beyond this point, the failure pressure remains constant, with a maximum change of only 2.3%.
Although not as significant as the defect depth and length, defect spacing also significantly influences the failure pressure of a corroded pipe elbow. As the longitudinal defect spacing increased from 0.0 to 2.0, it was observed that the failure pressure of a corroded pipe elbow increased, as illustrated in
Figure 11. This is because when two corrosion defects are in close proximity, an overlap region of stress concentration is created. As the spacing between these defects is increased, this overlap region reduces in size. As a result, the failure pressure of the pipe elbow increases. On the contrary, the circumferential defect spacing has an insignificant influence on the failure pressure of a corroded pipe elbow, as shown in
Figure 12.
4. Conclusions
In conclusion, the industry lacks a failure pressure assessment method for corroded HSS pipe elbows subjected to combined loadings. Using the FEM and an ANN, this study has put forward a set of empirical equations for the failure pressure prediction of corroded pipe elbows with true ultimate tensile strength values ranging from 606.72 MPa to 890.88 MPa subjected to internal pressure and axial compressive stress. The developed model results in failure pressure predictions that are reliable, with a maximum percentage difference of 6.42%. Based on the failure behaviour analysis of corroded HSS pipes, it was found that defect depth, length, spacing (longitudinal), and axial compressive stress greatly influenced the failure pressure of a corroded pipe elbow, especially for defects located at the intrados with reductions in failure pressure ranging from 12.56–78.3%. On the contrary, the effects of circumferential defect spacing were insignificant, with a maximum of only a 6.78% reduction of failure pressure. The failure pressure trend for all three materials used in this study was similar. However, pipes with higher true ultimate tensile strength proved to have a comparatively less significant reduction in failure pressure.
5. Recommendations for Future Work
In this study, only single, longitudinally interacting, and circumferentially interacting defects are considered. Future work could consider the incorporation of more than two defects in close proximity to one another. Corrosion does not necessarily occur in pairs only. They may form clusters that interact in both the longitudinal and circumferential directions, generally categorised as complex defects.
Author Contributions
Conceptualisation, S.D.V.K. and S.K.; Methodology, S.D.V.K.; Software, S.K.; Validation, S.D.V.K.; Formal analysis, S.D.V.K.; Investigation, S.D.V.K.; Resources, S.K.; Data curation, S.D.V.K.; Writing—original draft, S.D.V.K.; Writing—review & editing, S.K., V.P. and M.O.; Visualization, S.K.; Supervision, S.K. and V.P.; Project administration, S.K.; Funding acquisition, S.K. All authors have read and agreed to the published version of the manuscript.
Funding
This work was supported by Yayasan Universiti Teknologi PETRONAS, Malaysia (015LC0-304).
Institutional Review Board Statement
Not applicable.
Informed Consent Statement
Not applicable.
Data Availability Statement
Not applicable.
Conflicts of Interest
The authors declare no conflict of interest.
Nomenclature
| Cost function of an ANN using backpropagation algorithm |
| Diameter of pipe |
| Depth of defect |
| Hidden neuron of artificial neural network |
| Input variable of artificial neural network |
| Normalised input variable of artificial neural network |
| Length of defect |
| Output variable of artificial neural network |
| Failure pressure of a corroded pipe elbow |
| Intact pressure of a pipe elbow |
| Bend radius of pipe elbow |
| Predicted output of an ANN |
| Circumferential defect spacing |
| Longitudinal defect spacing |
| Pipe wall thickness |
| Ultimate tensile strength |
| Defect width |
| Expected output of an ANN |
| True ultimate tensile strength |
| Axial compressive stress |
| Yield stress |
| θ | Location of defect |
Abbreviations
| ANN | Artificial Neural Network |
| FE | Finite Element |
| FEA | Finite Element Analysis |
| FEM | Finite Element Method |
| FFNN | Feed Forward Neural Networks |
| HSS | High-strength Steel |
References
- Parvizsedghy, L.; Zayed, T. Predictive risk-based model for oil and gas pipelines predictive risk-based model for oil and gas pipelines. In Proceedings of the Canadian Society of Civil Engineering 2013 Annual Conference, Montreal, QC, Canada, 1 June 2013. [Google Scholar]
- Bhardwaj, U.; Teixeira, A.P.; Soares, C.G. Burst strength assessment of X100 to X120 ultra-high strength corroded pipes. Ocean. Eng. 2021, 241, 110004. [Google Scholar] [CrossRef]
- Belato Rosado, D.; De Waele, W.; Vanderschueren, D.; Hertelé, S. Latest developments in mechanical properties and metallurgical features of High Strength Line Pipe Steels. Int. J. Sustain. Constr. Des. 2013, 4. [Google Scholar] [CrossRef] [Green Version]
- Bott, I.D.S.; de Souza, L.F.G.; Teixeira, J.C.G.; Rios, P.R. High-strength steel development for pipelines: A brazilian perspective. Met. Mater. Trans. A 2005, 36, 443–454. [Google Scholar] [CrossRef]
- Li, X.; Chen, Y.; Zhou, J. Plastic Interaction Relations for Corroded Steel Pipes under Combined Loadings. In Proceedings of the 12th Biennial International Conference on Engineering, Construction, and Operations in Challenging, Honolulu, HI, USA, 14–17 March 2010; pp. 3328–3344. [Google Scholar]
- Arumugam, T.; Karuppanan, S.; Ovinis, M. Finite element analyses of corroded pipeline with single defect subjected to internal pressure and axial compressive stress. Mar. Struct. 2020, 72, 102746. [Google Scholar] [CrossRef]
- Roy, S.; Grigory, S.; Smith, M.; Kanninen, M.F.; Anderson, M. Numerical Simulations of Full-Scale Corroded Pipe Tests with Combined Loading. J. Press. Vessel. Technol. 1997, 119, 457–466. [Google Scholar] [CrossRef]
- Lo, M.; Karuppanan, S.; Ovinis, M. Failure Pressure Prediction of a Corroded Pipeline with Longitudinally Interacting Corrosion Defects Subjected to Combined Loadings Using FEM and ANN. J. Mar. Sci. Eng. 2021, 9, 281. [Google Scholar] [CrossRef]
- Kumar, S.D.V.; Lo, M.; Karuppanan, S.; Ovinis, M. Empirical Failure Pressure Prediction Equations for Pipelines with Longitudinal Interacting Corrosion Defects Based on Artificial Neural Network. J. Mar. Sci. Eng. 2022, 10, 764. [Google Scholar] [CrossRef]
- Chin, K.T.; Arumugam, T.; Karuppanan, S.; Ovinis, M. Failure pressure prediction of pipeline with single corrosion defect using artificial neural network. Pipeline Sci. Technol. 2020, 4, 10–17. [Google Scholar] [CrossRef]
- DNV. Recommended Practice DNV-RP-F101; DNV: Oslo, Norway, 2017. [Google Scholar]
- Shuai, Y.; Zhang, X.; Huang, H.; Feng, C.; Cheng, Y.F. Development of an empirical model to predict the burst pressure of corroded elbows of pipelines by finite element modelling. Int. J. Press. Vessel. Pip. 2021, 195, 104602. [Google Scholar] [CrossRef]
- Abdulhameed, D.; Adeeb, S.; Cheng, R.; Martens, M. The Influence of the Bourdon Effect on Pipe Elbow. In Proceedings of the 11th International Pipeline Conference, Calgary, AB, Canada, 26–30 September 2016. [Google Scholar] [CrossRef]
- Abdulhameed, D.; Cheng, R.; Martens, M. The Influence of Bourdon Effect and Ovalization Effect on The Stress Distribution on Pipe Elbows. In Proceedings of the Pipeline Technology Conference, Berlin, Germany, 23–25 May 2016; pp. 1–17. [Google Scholar]
- Goodall, I.W. Lower Bound Limit Analysis of Curved Tubes Loaded by Combined Internal Pressure and In-Plane Bending Movement; C.E.G.B: Black Lion Hill, UK, 1978; pp. 1–18. [Google Scholar]
- Duan, Z.-X.; Shen, S.-M. Analysis and experiments on the plastic limit pressure of elbows. Int. J. Press. Vessel. Pip. 2006, 83, 707–713. [Google Scholar] [CrossRef]
- Tohidi, S.; Sharifi, Y. Load-carrying capacity of locally corroded steel plate girder ends using artificial neural network. Thin-Walled Struct. 2016, 100, 48–61. [Google Scholar] [CrossRef]
- Soomro, A.A.; Mokhtar, A.A.; Kurnia, J.C.; Lashari, N.; Lu, H.; Sambo, C. Integrity assessment of corroded oil and gas pipelines using machine learning: A systematic review. Eng. Fail. Anal. 2021, 131, 105810. [Google Scholar] [CrossRef]
- Soomro, A.A.; Mokhtar, A.A.; Kurnia, J.C.; Lashari, N.; Sarwar, U.; Jameel, S.M.; Inayat, M.; Oladosu, T.L. A review on Bayesian modeling approach to quantify failure risk assessment of oil and gas pipelines due to corrosion. Int. J. Press. Vessel. Pip. 2022, 200, 104841. [Google Scholar] [CrossRef]
- Kumar, S.V.; Karuppanan, S.; Ovinis, M. Failure Pressure Prediction of High Toughness Pipeline with a Single Corrosion Defect Subjected to Combined Loadings Using Artificial Neural Network (ANN). Metals 2021, 11, 373–397. [Google Scholar] [CrossRef]
- Khalaj, G.; Azimzadegan, T.; Khoeini, M.; Etaat, M. Artificial neural networks application to predict the ultimate tensile strength of X70 pipeline steels. Neural Comput. Appl. 2013, 23, 2301–2308. [Google Scholar] [CrossRef]
- Chen, Y.; Zhang, H.; Zhang, J.; Liu, X.; Li, X.; Zhou, J. Failure assessment of X80 pipeline with interacting corrosion defects. Eng. Fail. Anal. 2015, 47, 67–76. [Google Scholar] [CrossRef]
| Disclaimer/Publisher’s Note: The statements, opinions and data contained in all publications are solely those of the individual author(s) and contributor(s) and not of MDPI and/or the editor(s). MDPI and/or the editor(s) disclaim responsibility for any injury to people or property resulting from any ideas, methods, instructions or products referred to in the content. |
© 2023 by the authors. Licensee MDPI, Basel, Switzerland. This article is an open access article distributed under the terms and conditions of the Creative Commons Attribution (CC BY) license (https://creativecommons.org/licenses/by/4.0/).


