Article

Do Innovation Metrics Reflect Sustainable Policy Making in Europe? A Comparative Study Case on the Carpathian and Alpine Mountain Regions

by
Andrei Coca
1,
Manuela Rozalia Gabor
2,* and
Irina Olimpia Susanu
3
1
Doctoral School IOSUD, “George Emil Palade” University of Medicine, Pharmacy, Science, and Technology of Târgu Mures, 540142 Târgu Mureș, Romania
2
Department ED1—Economic Science, Faculty of Economics and Law, “George Emil Palade” University of Medicine, Pharmacy, Science, and Technology of Târgu Mures, 540142 Târgu Mureș, Romania
3
Department of Business Administration, Faculty of Economics and Business Administration, “Dunărea de Jos” University of Galați, 800008 Galați, Romania
*
Author to whom correspondence should be addressed.
Mathematics 2023, 11(6), 1558; https://doi.org/10.3390/math11061558
Submission received: 14 February 2023 / Revised: 16 March 2023 / Accepted: 21 March 2023 / Published: 22 March 2023

Abstract

:
This paper questions the evaluation of innovation systems and innovation measurements and the effectiveness of innovation policies applied at the territorial level by assessing whether the existing European regional scoreboard is effective in providing accurate inputs for decision-makers in mountainous regions. The aim of the research is to provide, through comparative analysis by using statistical multi-methods of two mountainous macro-regions (the Alps and the Carpathians), a possible and available path to develop novel perspectives and alternative views on innovation systems’ performance for informed and territorial-based policy making by using the indicators of the Regional Innovation Scoreboard. The methodology used includes descriptive statistics, chi-square bivariate test, Student’s t test, one-way ANOVA with Bonferroni post hoc multiple comparisons, multilinear regression analysis, and decision tree with CRT (classification and regression trees) algorithm. Our results emphasize the similarities and differences between the Alpine and Carpathian mountain regions, find the best predictors for each mountain region, and provide a scientific basis for the development of a holistic approach linking measurement theory, innovation systems, innovation policies, and their territorial approach toward sustainable development of mountain areas. The paper’s contribution is relevant in the context of remote, rural, and mountain areas, which are usually left behind in terms of innovation chances and in the context of the COVID-19 aftermath with budget constraints. The present results are pertinent for designing effective smart specialization strategies in these regions due to the difficulties that most remote areas and less developed regions are facing in developing innovation policies.

1. Introduction

Innovation as a concept and its systems are broadly considered to be essential in setting up the scene for economic growth upon Research, Development, and Innovation (RDI) outcomes. This scene is, of course, determined by disruptions and frequently by policies that target innovation or that are based on innovation. Since policy per se counts on pillars such as efficiency and productivity, it is less likely to foster disruptions. This might not be the case in Europe for the long term since the continent lags behind China, the United States, South Korea, and Japan in terms of innovation indicators in most of the well-known reports and statistical yearbooks.
For almost a century, we have known that innovation is an important tool for economic progress and competitiveness [1,2], but how to make it work is still a challenge for both academia and policy makers [3]. This is because, first, it is difficult to measure the number and types of indicators to use and a theory on innovation systems for policy is missing [4], and, second, there is still a characterization problem even though the number of indicators that measure innovation has increased over the decades [5].
Innovation, while still an emerging concept in development policies, is no longer an abstract notion [6], being defined, characterized, and measured by performance indicators in different metrics—for example, the Regional Innovation Scoreboard and Global Innovation Index 2020—thus succeeding in shaping the global economy as well as entrepreneurial dynamics at the territorial level [6].
The previous research that used data of the Global Innovation Index 2020 Report [6,7,8,9,10,11], especially the variables related to innovation infrastructure and Porter’s classification [12,13] of economies (factor-driven economy/efficiency-driven economy/innovation-driven economy), shows significant differences between the Carpathian regions [8,9,10,11] regarding Information and Communication Technology (ICT) access, ICT use, and the environmental performance of these countries [6].
Mountain regions from all around the world have a fantastic potential for sustainable development [6,8,9,10,11,14], and in some areas even best practices can be spotted in sustainability-related topics, but are these regions up to new development frameworks based on novel approaches, innovation capabilities, and outputs? From the RDI perspective, the specific meaning of “sustainable development” [15] in our paper is to stress the importance of making an evidence-based decision-making process in terms of policy. In this context, starting from the concept of “sustainable development”, other policy interventions are needed to fill development gaps in the progress stages [16] of mountainous areas, and global growth today mostly relies on innovation, knowledge, and technology transfer. These policies should and possibly could target mountainous areas which in some cases are lagging behind. Therefore, to this point, we are not able to understand whether mountains (and particularly the Alps and the Carpathians) are up to generate innovation or rather to absorb and adapt it. Specific indicators for innovation based on territorial specificities have not been developed yet.
Based on these considerations, the aim of the research is to create a new path for and a new perspective on developing novel perspectives that provide alternative views on innovation systems’ performance for informed and territorial-based policy making, especially for European mountain regions.
Our specific objectives are to analyze if the indicators that measure and reflect the innovation from the Regional Innovation Scoreboard offer sufficient information regarding the similarities and/or differences between the Alpine and Carpathian mountain regions. The main motivation to analyze these mountain regions is that both these mountain ranges are trans-national, covering the territory of many countries. In both the Alpine and Carpathian space, the member states ratified into force strategic international documents dealing with the sustainability of mountain regions: the Carpathian Convention for the Carpathians and the Alpine Convention in the case of the Alps. Both mountain areas have similar environmental, economic, and historical conditions, and there is a history of public development interventions within each of them. All these mentioned conditions apply to other European mountain ranges; therefore, a comparison would be, although extremely interesting and beneficial, more difficult to be realized without clustering in the first-phase territories that have similar development approaches, internal cohesion in decision-making processes, and, of course, various stages of development.
For the analysis, complex statistical methods were used (detailed in Section 3 of the paper) as follows: descriptive statistics, Student’s t test, chi-square bivariate test, the multilinear regression model with collinearity diagnosis, and the one-way ANOVA with Bonferroni post hoc multiple comparisons, together with machine learning methods such as the decision tree with CRT (classification and regression trees) growing method. The novelty of this paper stands in applying well-known and widely recognized statistical methods for new purposes, such as establishing key indicators and good predictors among innovation metrics that could deepen the evaluation on innovation in terms of policy in rural and remote areas. Our practical contribution is given by complementary use of statistical methods and machine learning methods; the Discussion section details all the advantages of these methods for our analysis.
Our study relies on quantitative data since, at the regional (NUTS 2) level, this is the only official data available. The advance we create with our contribution is to have a critical approach on specific indicators that, according to territorial applied policies and the state of the art at the macroregional level, might tell and influence territorial development differently. The approach as well as the potential audience is multidisciplinary, and we consider this a positive aspect of our work, in line with the scientific recommendations of mainly all European (and not only) high-level fora. It is also important to mention from the beginning that this research is only a part of the doctoral thesis of the first author.
For this analysis, the collected data from Eurostat [17,18] at the NUTS 2 level are only for the mountain regions of 10 European countries (Czech Republic, Hungary, Romania, Italy, Serbia, Slovakia, Slovenia, Germany, France, and Switzerland) from the most recent available data (2019 and 2021) and splitting the mountain regions according to the quality of being European Union or not and according to their corresponding performance group in terms of innovation. Scoreboards have powerful policy implications since political decisions are made on the conclusions drawn from them [19].
The international literature referring to innovation is rather rich, and our specific contribution is linked directly to mountain areas and the sustainability of policy making in mountain regions. Therefore, we consider that our research results fill a gap in the literature and highlight new insights for policy makers, respectively, and identify the best predictors for performance groups from the Alps and Carpathians regions.

2. Literature Review

Regional policy and technology policy increasingly converge into regional innovation policies in the European regions [20,21]. Regional innovation performance is an important indicator for decision-making policy referring to the implementation of policies for regional development [21]. The aspect of innovation was, in most of the research papers, linked to technology and/or the R&D sector from the perspective of economic growth issues [22]. The research results of Radosevic [22] pointed out a gap between local demand and supply for R&D and innovation as one of the key issues for long-term growth of the Central and Eastern European regions. Despite diverse work regarding this subject, studies of policy learning in innovation policy continue to be scarce [23]. The European Research Area has become a key reference point for research policy in Europe since 2000, aiming to overcome the weaknesses of the research, development, and innovation activities and policies across the EU [24]. An overall research result describes the evolution, conditions, and objectives of the innovation policy of the European Union, and makes the main assumptions of the Lisbon and Europe 2020 strategies [25].
The problem of innovation in mountainous areas was researched as a factor of sustainable tourism development in Europe and/or worldwide [26,27,28] in Slovakia and Romania, for the Carpathians, usually from a consumer of innovation point of view and/or as social impact of innovation [29,30], as a sustainable innovation ecosystem [31], or a regional innovation system [32], not policy makers. Policy makers were attracted by the clusters interests to boost innovation in industrial growth [33] to generate economic development in disadvantaged localities and regions from Central and Eastern European countries [33]. Suurna and Kattel [34] examined the implication of policies and policy-making systems in Central and Eastern Europe (CEE) having evolved during the last 30 years and the role played by the European Union in these processes. The authors demonstrated first an overemphasis on the linear trend of innovation and showed the weak administrative environment and the lack of policy skills for creating networking and, more important, the lack of long-term planning [34,35]. The role of innovative technology for development was investigated, and only a few studies dealt with the influence of networks on the adoption of technologies by farmers from mountainous regions [36]. The particularities of science and technology policy makers in the Central and Eastern European economies was the subject of much research [37]. At that time, the authors demonstrated how the socialist model of innovation was still shaping innovation policies in CEE in general [37]. For the same regions of Europe, the CEE countries, Szymanska [38] demonstrated the significant interdependence between the state budget expenditure on R&D and the level of innovativeness by using reports on research innovativeness in CEE. Laznjak and Svarc [39] conducted a cross-national analysis of the Science in Society (SiS) in terms of differences and similarities in policy-making taking into consideration the national reports from the FP7 project by Monitoring Policy and Research Activities Related to Science in Society in Europe. An interesting and important aspect of innovation policy was analyzed by Paliokaite [40] referring to the lower capacity to absorb public funds earmarked for the promotion of innovation in the peripheral regions.
The empirical analysis of the Nordic–Baltic region conducted by Tonurist and Kattel [41] started with a meta-analysis of Nordic policy cooperation but also included information regarding supra-regional program participation. They used semistructured interviews with RDI agency executives from the Nordic–Baltic regions and showed that RDI policies are cross-national, but under particular conditions.
As a model for sustainable regional innovation, another used the Quadruple Helix model [42], but the authors concluded that the Quadruple Helix model is still far from a well-established concept in innovation research and policy [42] in general and not for a specific mountain region, and civil society participation in smart specialization has remained low [42]. Important aspects of innovation were linked also to explore the role of government policy in the innovation of creative industries from a macrodynamic perspective [30] based on a systematic literature review for China [43] and China and the UK [30], not a quantitative analysis.
Directly linked to the European mountain regions, we found a few research papers referring to sustainable practices in mountainous regions [44] but not linked to the innovation aspects in these regions. Another research paper belonged to Kuscer et al. [45], which emphasized the link between innovation, sustainable tourism, and the environment in the development of mountainous destinations (for Austria, Slovenia, and Switzerland, so only for the Alpine regions [46]) based on questionnaires from managers [45]. There is also research on the Tatras mountains [47], which analyzed the implementation of innovation in mountainous destinations and its effect on sustainable tourism development in a mountainous region, being imperative to engender innovation spots [48].
Therefore, the governmental context of European policy-making [49,50], its redistributive content, applicability, and the consideration of accommodating diverse, and sometime conflicting, interests and goals, together can have a stalling effect on the policy-making process [51]. A permanent producer for regional policy-making directly linked to a policy will be new to regional policy-makers [52].
Based on this theoretical framework and the research results from the literature review, we formulated a set of four research hypotheses accordingly with the aim and objectives of our research (Figure 1):
In the next section, we detail for each research hypothesis the statistical method for testing it and the specific references from the literature for each.

3. Materials and Methods

According to the aim, subject, and hypothesis of the research, the variables used for research were extracted from EUROSTAT data, respectively, the Regional Innovation Scoreboard [21] for 2019 and 2021 at the NUTS 2 level [17,18], and only for the European regions with mountain areas (Alps and Carpathians) The mountain regions selected in the present research are presented in detail in Table 1. The research database included both categorial and continuous variables, as follows:
  • Categorical variables such as (in parentheses is mentioned the codification number received by each category for the analysis by the statistical software SPSS 23.0 licensed):
    Country: Czech Republic (code 1), Hungary (code 2), Poland (code 3), Romania (code 4), Slovakia (code 5), Serbia (code 6), Italy (code 7), Austria (code 8), Slovenia (code 9), Switzerland (code 10), Germany (code 11), and France (code 12) (the mountain regions from each country included in the research are presented in Table 1 according to the NUTS2 codes and names);
    The mountain regions: the Alps (1), the Carpathians (2);
    Regions NUTS 2 with EUROSTAT codes and names;
    Quality of the country to be (or not) member/of the European Union (EU), such as code 1 for EU members and code 2 for non-EU members;
    Performance group: innovation leader (code 5), strong innovator (code 4), moderate innovator (code 3), modest innovator (code 2), and emerging innovator (code 1);
    Mountain area: partly/total (no codes, string variables).
  • Continuous variables as selected from the Eurostat database as normalized scores by indicator for 2019 and 2021 are represented by the majority common innovation indicators from the Regional Innovation Scoreboard [21] for 2019 and 2021 as follows:
    Population with tertiary education
    Lifelong learning
    Scientific co-publications
    Most-cited publications
    Research and Development expenditure public sector
    Research and Development expenditure business sector
    Non-Research and Development innovation expenditures
    Product or process innovators
    Marketing or organizational innovators (2019)/Business process innovators (2021)
    Innovative SMEs collaborating with others
    Public–private co-publications
    Patent Cooperation Treaty (PCT) patent applications
    Trademark applications
    Design applications
    Employment MHT manufacturing and knowledge-intensive services
    Sales of new-to-market and new-to-firm innovations.
The following innovation indicators were excluded from the research frame: for 2019 the ”SMEs innovating in-house” and for 2021 ”Digital skills”, ”Innovation expenditures per person employed”, ”IT specialists”, ”Employment in innovative SMEs”, and ”Air emissions by fine particulates”. The decision rule for eliminating was linked to the correspondent and/or the availability of indicators for 2019 and 2021.
To ensure a better granularity of the results, comparison, and analysis, the initial database was split according to the mountain territory (Alps/Carpathians) and year (2019/2021); the indicators of descriptive statistics [26] were calculated according to these subsamples and to emphasize the value differences before and after the COVID-19 pandemic for innovation indicators.
All the data were tested for normal distribution with the one-sample Kolmogorov—Smirnov. With a small number of exceptions, all the variables have normal distributions.
The inferential statistic methods were applied to find out if there are statistically significant differences between the two mountain areas, and between years and countries for each mountain region. For the comparison between these groups of variables, the independent Student’s t test was applied to compare the mean values of all the innovation indicators. To test if there are statistically significant differences between the Alps and the Carpathians referring to the performance group of the NUTS2 regions from the study, the chi-square bivariate test was applied.
To determine the causality relationship between innovation indicators and to find the best predictors for innovation in the Alps and Carpathians mountain regions, a multilinear regression model with the enter method and collinearity diagnosis (Equation (1)) [53,54,55,56] was applied with performance groups as dependent variables and all the remaining innovation indicators as independent variables of the models, separately for each mountain region: Model 1 for the Alps and Model 2 for the Carpathians. Statistical significance for regression coefficient p-value < 0.1 was considered and a value of VIF ∈ [1,10] for collinearity analysis. The final regression models were made without those independent variables with VIF values outside of the interval [1,2,3,4,5,6,7,8,9,10].
Y = β0 + β1x1 + β2x2 + …… + βnxn + ε1
where βi’s (i = 1,2…n) are the regression coefficients, which represent the value at which the criterion variable changes when the predictor variable changes. The beta value is used in measuring how effectively the predictor variable influences the criterion variable; it is measured in terms of standard deviation [53,54,55,56].
A machine learning analysis based on the decision tree with CRT (classification and regression trees) “growing method” was applied to find out which innovation indicators grouped better the mountain regions based on their similarities in the performance groups. The statistical hypothesis for the decision tree was H0: Variables are independent, with the alternative hypothesis H1: The variables are dependent. Two variables are independent if the condition is satisfied (Equation (2)) and chi-square statistics are calculated according to Equation (3) [57]:
P(X = x1/Y = y1) = P (X = x1) and P(Y = y1/X = x1) = P (Y = y1)
χ 2 calculated = i = 1 p j = 1 q n i j n t i j 2 n t i j
where nij are the observed values,
  • ntij are the theoretical values (except those values that will be satisfied in the independent condition),
  • p = number of lines, and
  • q = number of columns.
To compare the variables with different degrees of freedom, the Tschuprow normalization t value was calculated [57] based on Equation (4):
t = χ c a l c u l a t e d 2 n ( p 1 ) ( q 1 )
The Gini index (Equation (5)) and conditional Gini index (Equation (6)) were used for the CRT algorithm of the decision tree [57] to measure the concentration of values of dependent variable Y:
I ( Y ) = 1 i = 1 p n i n 2
I ( Y / X ) = j = 1 q n j n 1 i = 1 p n i j n j 2
where p = the number of the modalities of the dependent variable and q = the number of nodes into which the division is made.
The advantages of using a decision tree compared with classical statistical methods [57,58,59,60] are as follows:
  • Comparing with CHAID (Chi-Square Automatic Interaction Detector) are the normalized importance of the independent variables;
  • Allows the prediction of individuals to distinct categories based on their measures according to one or more predictor variables;
  • Allows utilization of both categorial and continuous type of data by using different algorithms (CHAID, CRT); groups/classifies the individuals in homogenous groups by independent variables.
The decision tree with CRT algorithm was applied in both conditions: (1) with validation set approach using random assignment 50% for training sample and 50% for test sample and (2) no validation but with Gini index and Tschuprow normalization. Both results are presented in the Results section.
To find out inside each mountain region (Alps/Carpathians) which countries are different according to all 16 innovation indicators, the one-way ANOVA with Bonferroni post hoc multiple comparisons was applied, but only for variables that resulted as good predictors from the regression analysis.
In Table 2 are presented the research hypothesis, the theoretical background from the literature review, and statistical methods applied to test each of them.
For all the statistical analyses, SPSS 23.0 software (licensed) was used. For statistical significance, a threshold of p-value < 0.05 was considered. All these results are presented in detail in the next section.

4. Results

In order to describe the data, the descriptive statistic was used: absolute and relative frequencies for category variables, mean ± standard deviation (minimum—maximum) for continuous variables. We centralized the descriptive statistical indicators for all the continuous variables from the research in Table 3 grouped by year and mountain area. Based on the results from Table 3, the important differences (in terms of numbers) between the Alps and the Carpathians for the majority of the innovation indicators can be seen but with some similarities in terms of the evolution of indicator values in 2021 (during the COVID-19 pandemic) compared with 2019 in terms of decreasing values for R&D expenditure public sector, R&D expenditure business sector, and non-R&D innovation expenditures. Another similarity for the Alps and the Carpathians is the relatively equal values for 2019 and 2021 for trademark applications. An inverse evolution for 2021 compared with 2019 was registered for sales of new-to-market and new-to-firm innovations with an increase for the Carpathians and a decrease for the Alps.
All the data were tested for normal distribution with the one-sample Kolmogorov—Smirnov. With a small number of exceptions (Non-R&D innovation expenditures—0.200, Design applications—0.200, Employment MHT manufacturing and knowledge-intensive services—0.200, and Sales of new-to-market and new-to-firm innovations—0.182), all the variables have normal distributions.
For a better visualization and comparison of the value of the innovation index (with fixed base for 2014) for the Alps and Carpathians regions, we represent graphically these values for the period 2014–2021 with the specification line of the average value for EU27 for this period (Figure 2). It is obvious the positioning of most Carpathian regions below the EU27 line, with some exceptions for three regions from the Czech Republic (CZ06—Jihovýchod), Hungary (HU11 Budapest), and Slovakia (SK01—Bratislavský kraj) and almost all the Alps regions above the EU27 average, with some exceptions, respectively, for two regions from Italy (ITC2—Valle d’Aosta/Vallée d’Aoste and ITC 3—Liguria) and one region from Slovenia (SI03—Vzhodna Slovenija). Except for the Italian mountain regions, all the mountain regions from developed European countries registered a value of the innovation index over the EU27 mean value but with a decreasing value for the time of the COVID-19 pandemic for the Alps and an increasing value for the Carpathians.
The evidence can be observed through the graphical representation based on box plots of the distribution of the average values of the innovation index according to the county and mountain region (Figure 3) and according to the performance group of the NUTS2 region (Figure 4). The median value for the Carpathian regions is under the value for 2014 (100 = fixed base for period 2014–2021), and all the regions from the Alps are over this value. For the Carpathian mountains, the best value is registered by the Czech Republic, followed by Poland and Serbia and lower values for Romania. For the Alps regions, the best position is owned by Switzerland, followed by Germany and Austria, and the lower value is owned by Slovenia but closer to Italy. According to the performance group (Figure 4), all the Carpathian regions are situated in the performance interval from the emerging innovator to the moderate one, and all the Alps regions are distributed in the performance group from moderate to strong innovator performance.
To test if there are statistically significant differences between the Alps and Carpathian regions according to the performance group, the chi-square bivariate test was applied. The results confirm the differences (Table 4) for p-value < 0.001.
The distribution of the number of NUTS 2 mountain regions on the performance group of innovation is presented in Figure 5. The distribution of mountain regions for the Alps is somewhat polarized; ten regions are innovation leaders and eight are moderate innovators, with none of the Carpathian regions in the innovation leader or strong innovation performance groups. The almost Carpathian regions are in the emerging performance group, with an important number of regions (27) in the moderate performance group.
To test if there are statistically significant differences between the mean values for the innovation indicators, the Student’s t test was applied. The results show, for which innovator indicators, that there are statistically significant differences (Table 5) for a p-value < 0.05. According to the results, the innovator indicators whose means differs in the Alpine and Carpathian regions are lifelong learning, most-cited publication, R&D expenditure public sector, product or process innovator, innovative SMEs collaborating with others, public–private co-publications, PCT patent applications, trademark applications, employment MHT manufacturing and knowledge-intensive services, and sales of new-to-market and new-to-firm innovations. There are also differences for statistical significance of p-value ≤ 0.1 for the variables: scientific co-publications (p-value = 0.073), R&D expenditure business sector (p-value = 0.095), non-R&D innovation expenditures (p-value = 0.097), and innovation index (p-value = 0.106).
Based on the abovementioned results and according to the aim of the research, we applied the regression models with the enter method and collinearity diagnosis to identify the best predictor for the Alps (Model 1) and the Carpathians (Model 2) regions with the performance group as dependent variable and all the innovator indicators (variables from Table 2) as independent variables of the models. For the performance group, the SPSS codes for each group are 1—emerging, 2—modest, 3—moderate, 4—strong, and 5—leader. After the collinearity testing, those independent variables with values out of [1,2,3,4,5,6,7,8,9,10] values of VIF were excluded for each model: (1) for Model 1—Alps: Population with tertiary education, Lifelong learning, and Public–private co-publications and (2) for Model 2—Carpathians: Scientific co-publications, Product or process innovators, innovative SMEs collaborating with others, and Public–private co-publications. The results are presented below.
Both models are statistically significant with p < 0.05 for ANOVA and a good value for determinant coefficient R2 > 0.700. All the statistics for the regression models are presented below (Table 6, Table 7 and Table 8).
The values of determinant coefficient R2 indicate that 95.6% of the variance of the dependent variable of the performance group (from emerging to leader innovators) for the Model 1—Alps regions and 89.3% for the Model 2—Carpathians regions are explained by the independent variables, respectively, the innovation indicators, but both values are higher than 0.700 and both regression models are statistically significant (Table 7). The normal P-P plots from Figure 6a,b conform to the normal distributions of the regression standardized residuals for both models.
The results from Table 8 indicate that for Model 1—the Alps, the variables Population with tertiary education, Lifelong learning, and Public–private co-publications are out of VIF values between 1 and 10. The best predictors (p-value < 0.100) for the performance group for the Alps regions are (from the most important according to the value of standardized coefficients beta to the least important): (1) R&D expenditure public sector, (2) Sales of new-to-market and new-to-firm innovations, (3) Non-R&D innovation expenditures, (4) PCT patent applications, (5) Scientific co-publications, (6) Most-cited publications, (7) Employment MHT manufacturing and knowledge-intensive services.
Therefore, according to the data from Table 8, the models’ equations for the Alps regions is (Equation (7)):
Performance group (Alps) = 0.589 − 1.078 Scientific co-publications + 1.659 Most-cited publications + 2.079 R&D expenditure public sector − 0.432 R&D expenditure business sector + 1.701 Non R&D innovation expenditure + 0.382 Product or process innovators + 0.442 Marketing or organizational innovators + 0.111 Innovative SMEs collaborating with others + 1.5777 PCT patent applications + 0.580 Trademark applications − 0.015 Design applications + 0.879 Employment MHT manufacturing and knowledge-intensive services − 1.560 Sales of new-to-market and new-to-firm innovations
According to Equation (1) for the Alps regions, there are 6 predictors for performance groups, as follows: at increasing with 1 unit of scientific co-publications the performance group decreased with 1.078; at increasing with 1 unit of most-cited publications the performance group increased with 1.659; at increasing with 1 unit of R&D expenditure public sector the performance group increased with 2.079; at increasing with 1 unit of non-R&D innovation expenditure the performance group increased with 1.701; at increasing with 1 unit of the PCT patent applications the performance group increased with 1.577; at increasing with 1 unit of Employment MHT manufacturing and knowledge-intensive services the performance group increased with 0.879, and at increasing with 1 unit of Sales of new-to-market and new-to-firm innovations the performance group decreased with 1.560.
The results from Table 9 indicated that for Model 2—the Carpathians, the variables Scientific co-publications, Product or process innovators, Innovative SMEs collaborating with others, and Public–private co-publications are out of VIF values between 1 and 10 and were excluded from the final model. The best predictors (p-value < 0.100) for performance group for Carpathian regions are (from the most important according to the value of standardized coefficients beta to the least important): (1) PCT patent applications, (2) R&D expenditure public sector, (3) R&D expenditure business sector, (4) Population with tertiary education, and (5) Employment MHT manufacturing and knowledge-intensive services.
For the Carpathian regions, according to the data from Table 9, the models’ equation is Equation (8):
Performance group (Carpathians) = 1.368 − 1.177 Population with tertiary education + 1.054 Lifelong learning − 1.299 Most-cited publications + 2.331 R&D expenditure public sector + 2.002 R&D expenditure business sector + 0.622 Non R&D innovation expenditure + 0.650 Marketing or organizational innovators − 4.471 PCT patent applications + 2.115 Trademark applications + 0.191 Design applications +0.620 Employment MHT manufacturing and knowledge-intensive services − 0.563 Sales of new-to-market and new-to-firm innovations
From the results of regression analysis, we find five predictors for the Carpathian regions, and the value of the regression coefficients from Equation (2) show that at increasing with 1 unit of R&D expenditure business sector the performance group increased with 2.002; at increasing with 1 unit of R&D expenditure public sector the performance group increased with 2.331; at increasing with 1 unit of the PCT patent applications the performance group decreased with 4.471; at increasing with 1 unit of Employment MHT manufacturing and knowledge-intensive services the performance group increased with 0.620, and at increasing with 1 unit of Population with tertiary education the performance group decreased with 1.177.
In Figure 7a–c are presented the distribution of the Alps and Carpathians regions (with performance group marked on the graphics) on the common predictors, respectively: the R&D expenditure public sector, the PCT patent applications, and the Employment MHT manufacturing and knowledge-intensive services.
Because in the performance groups classified as “moderate” and “emerging +” in Figure 4 show the presence of both mountain regions, a decision tree with CRT (classification and regression trees) “growing method” was applied to find the innovation indicators that grouped better in performance groups and the one-way ANOVA with Bonferroni post hoc multiple comparisons to identify the similarities and differences inside each of these mountain regions at the country level.
The results of the decision tree with CRT algorithm (no validation), performance group as dependent variables, and all the innovation indicators as independent variables indicate that the “population with tertiary education” with the cutoff value of 0.2220 (Figure 8a) is the innovation indicator which grouped the mountain regions in different performance groups (Figure 8a). Therefore, for values under 0.2220 of population with tertiary education, there are no mountain regions in the performance groups strong and leader. The decision tree with CRT algorithm and validation treatment by using random assignment 50% for training sample (Figure 8b) and 50% for test sample (Figure 8c) indicate the same variable as a good predictor for the performance group but with a cutoff value of 0.1815. By applying this method separately for the Alps and Carpathians regions, the same indicator was found but with a different cutoff value for the Alps, respectively, 0.3555.
The normalized importance of independent variables is presented in Figure 9a for the Alps and Figure 9b for the Carpathians.
Some differences can be observed: for the Alps, the population with tertiary education, R&D expenditure public sector, PCT patent applications, and Business process innovators are in the first places of importance, while for the Carpathians, PCT patent applications, Non-R&D innovation expenditure, and R&D expenditure business sector are the variables which grouped the Carpathian regions in the performance groups.
To detail more these similarities and differences between mountain regions and countries, the one-way ANOVA with Bonferroni post hoc multiple comparisons was applied; all the results in Table 10 indicate only the statistically significant pairs of different countries (p-value < 0.05). On the first column are indicated the hierarchy for best predictors of the regression models.
Based on the results from Table 10, we can observe that:
  • For the Alps, an important polarization can be observed for Switzerland that differs from the rest of the Alpine countries regarding the majority of the best predictors except for scientific co-publications. For Germany, the indicator “employment MHT manufacturing and knowledge-intensive services” differs statistically significantly from Italy, Austria, and France;
  • For the Carpathians, the Czech Republic differs from all the rest of the countries for different indicators (from Romania for all the best predictors except employment MHT manufacturing and knowledge-intensive services but from Serbia for this indicator). Romania is another country that differs from Hungary for PCT patent application, from Czech republic for R&D expenditure public sector, from Hungary and Poland for population with tertiary education, and from the Czech Republic, Hungary, and Poland for R&D expenditure business sector.

5. Discussion

Innovation varies cross-nationally and is sometime grouped in regions or metropolitan areas which manages with the main aim to generate an innovation ecosystem [61] conducive for the appearance of products that easily penetrate the international market [6].
Measuring innovation at the territorial level is always a difficult task, and it is an even bigger challenge to do it in mountain regions. Our analysis shows that innovations are present mainly in high-income regions. However, the share of developing regions is also gradually increasing. A significant capacity for frontier innovation exists in a small group of more technologically sophisticated Alpine regions. Since in the Carpathians innovations are limited to a few technologies, an appropriate innovation policy is likely to differ from the Alpine approaches. Innovation is a multidimensional phenomenon subject to territorial heterogeneity, and innovation policy lacks measures that capture specific sectorial and territorial adapted determinants leading to place-based innovation.
Practically, in terms of the geographical position of mountain regions closer to the western part of Europe, and, of course, closer to the developed European economies such as Germany, Switzerland, France, and Austria, those mountain regions are in the at least moderate performance groups. We included here the Czech Republic and Slovenian mountain regions. The statistically significant differences (p-value = 0.000) between the Alps and the Carpathians for the indicators “most-cited publications”, “lifelong learning” [62], “PCT patent applications”, and “trademark applications” reflect the RDI directions and strategies from those European countries.
The complex statistical methods together with the machine learning method (decision tree with CRT) reveal important aspects, particularities, similarities, and differences between the Alps and Carpathians regions as follows:
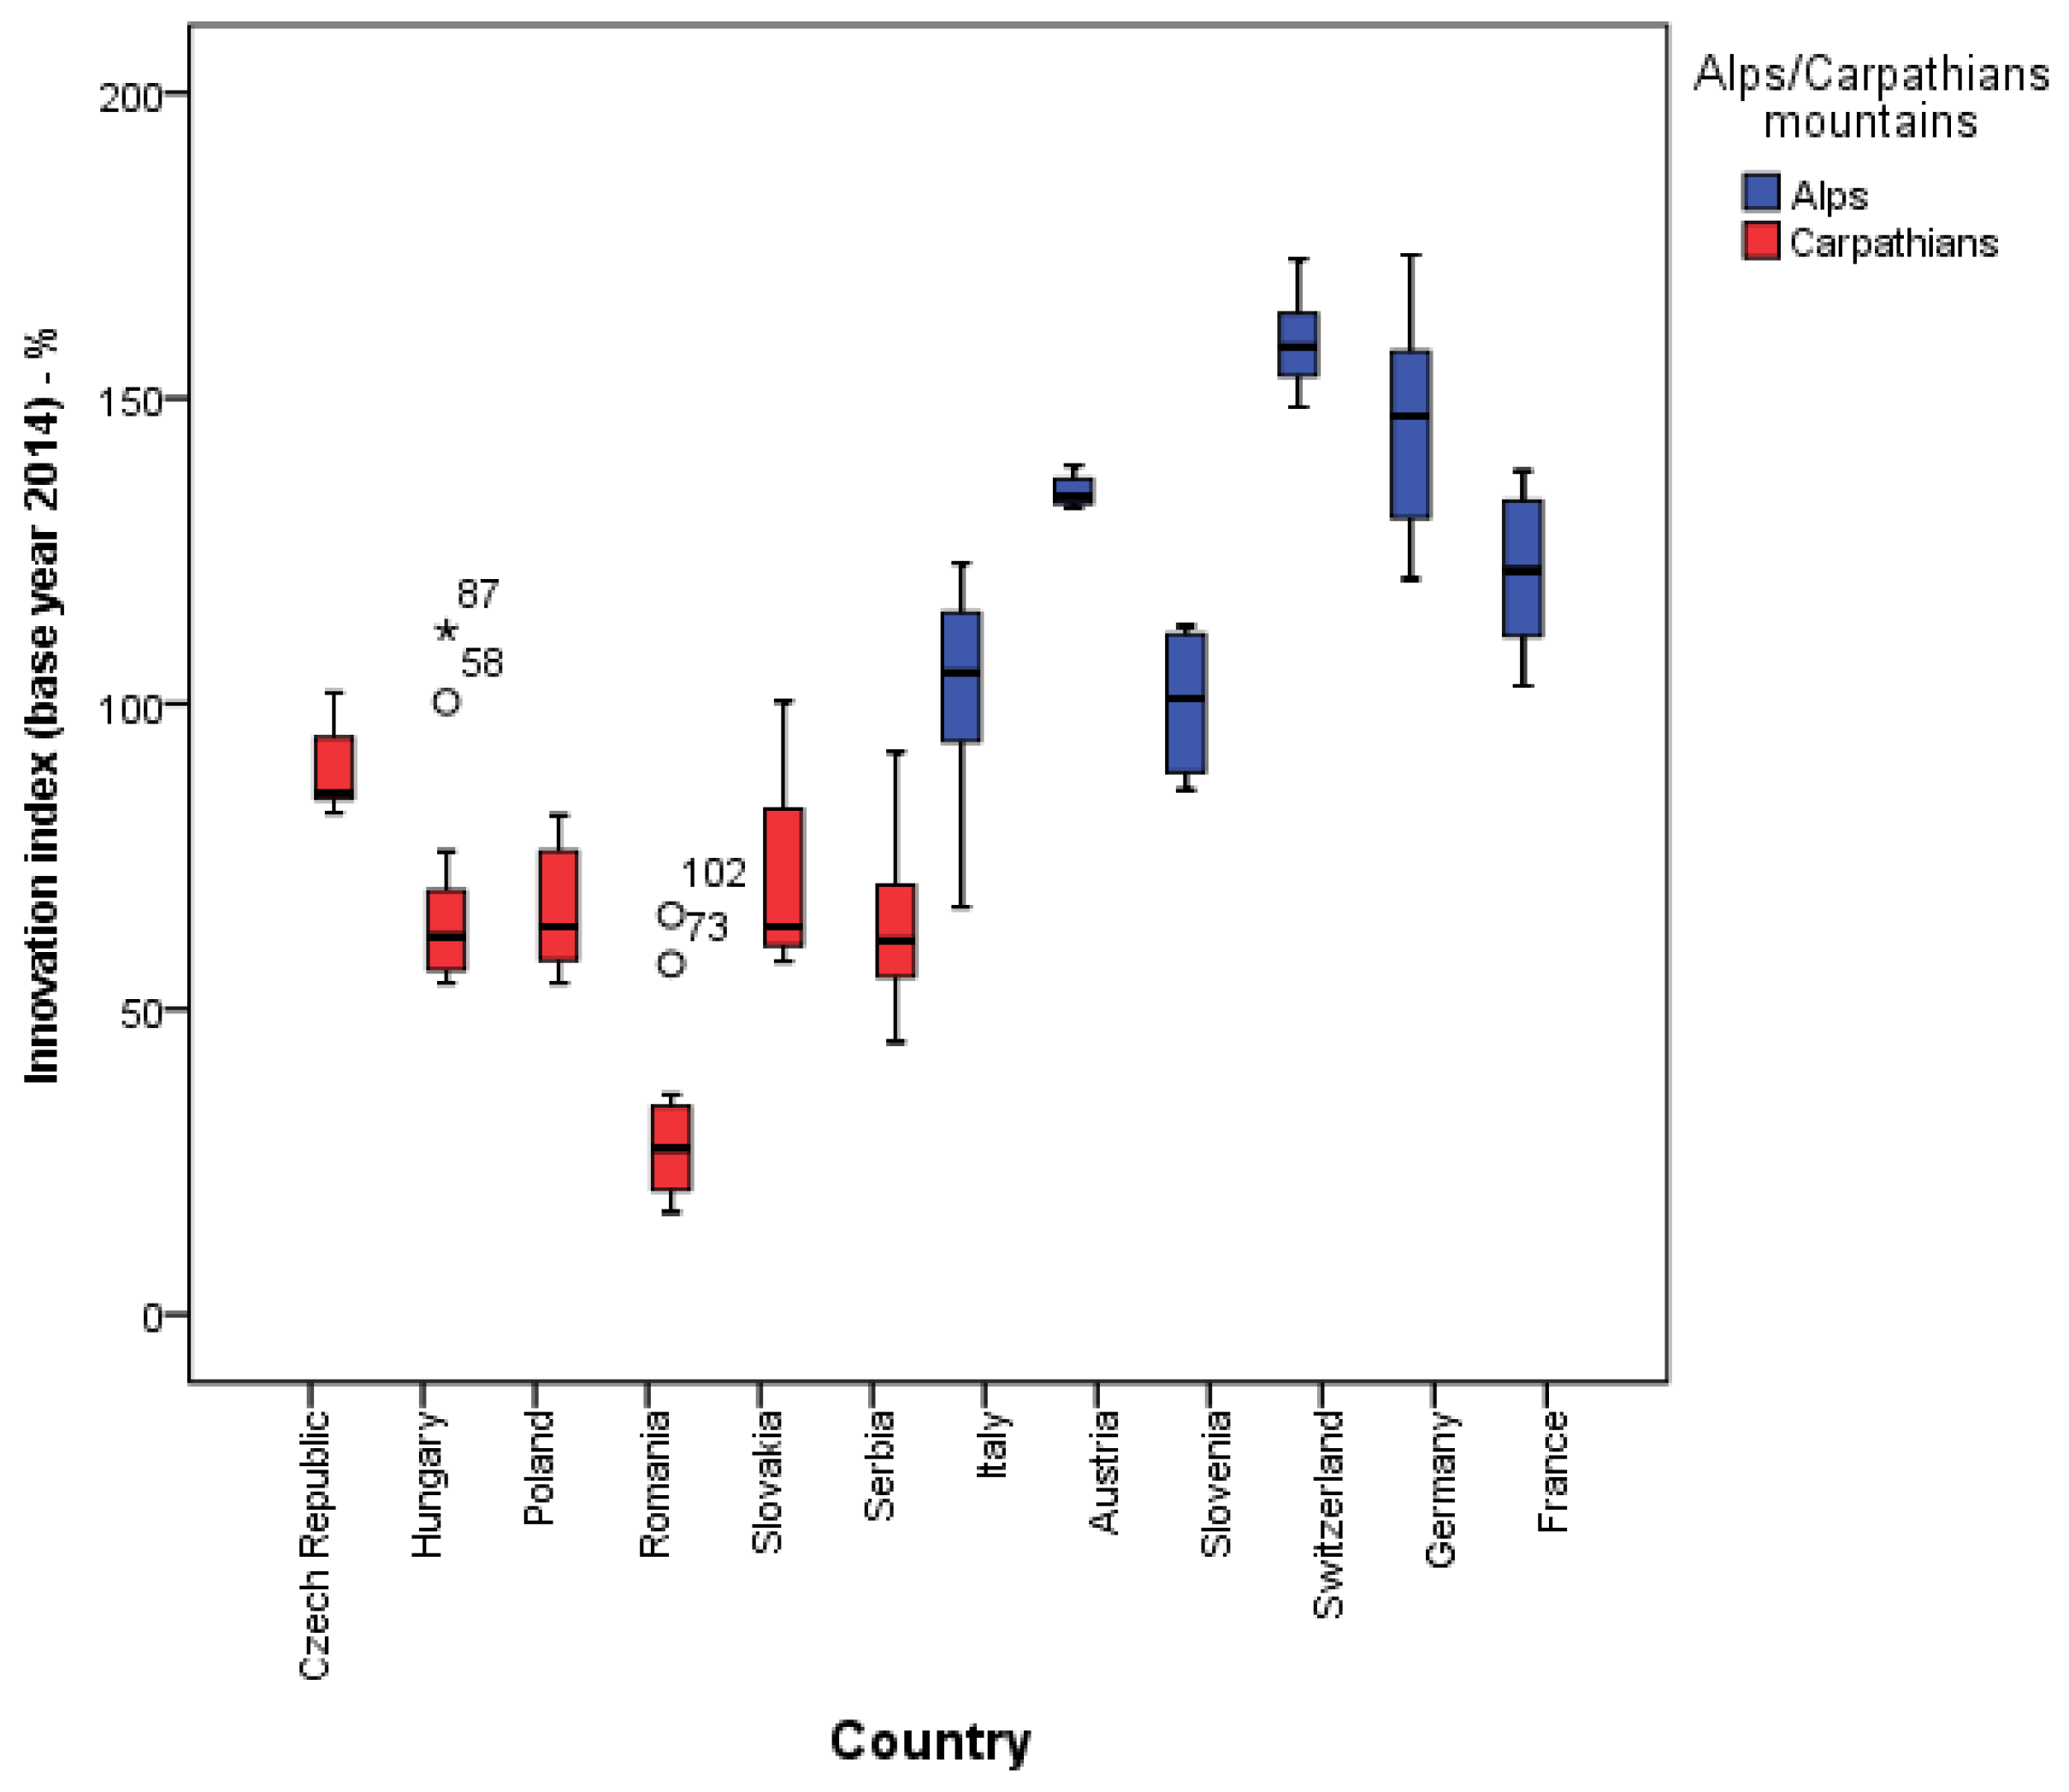
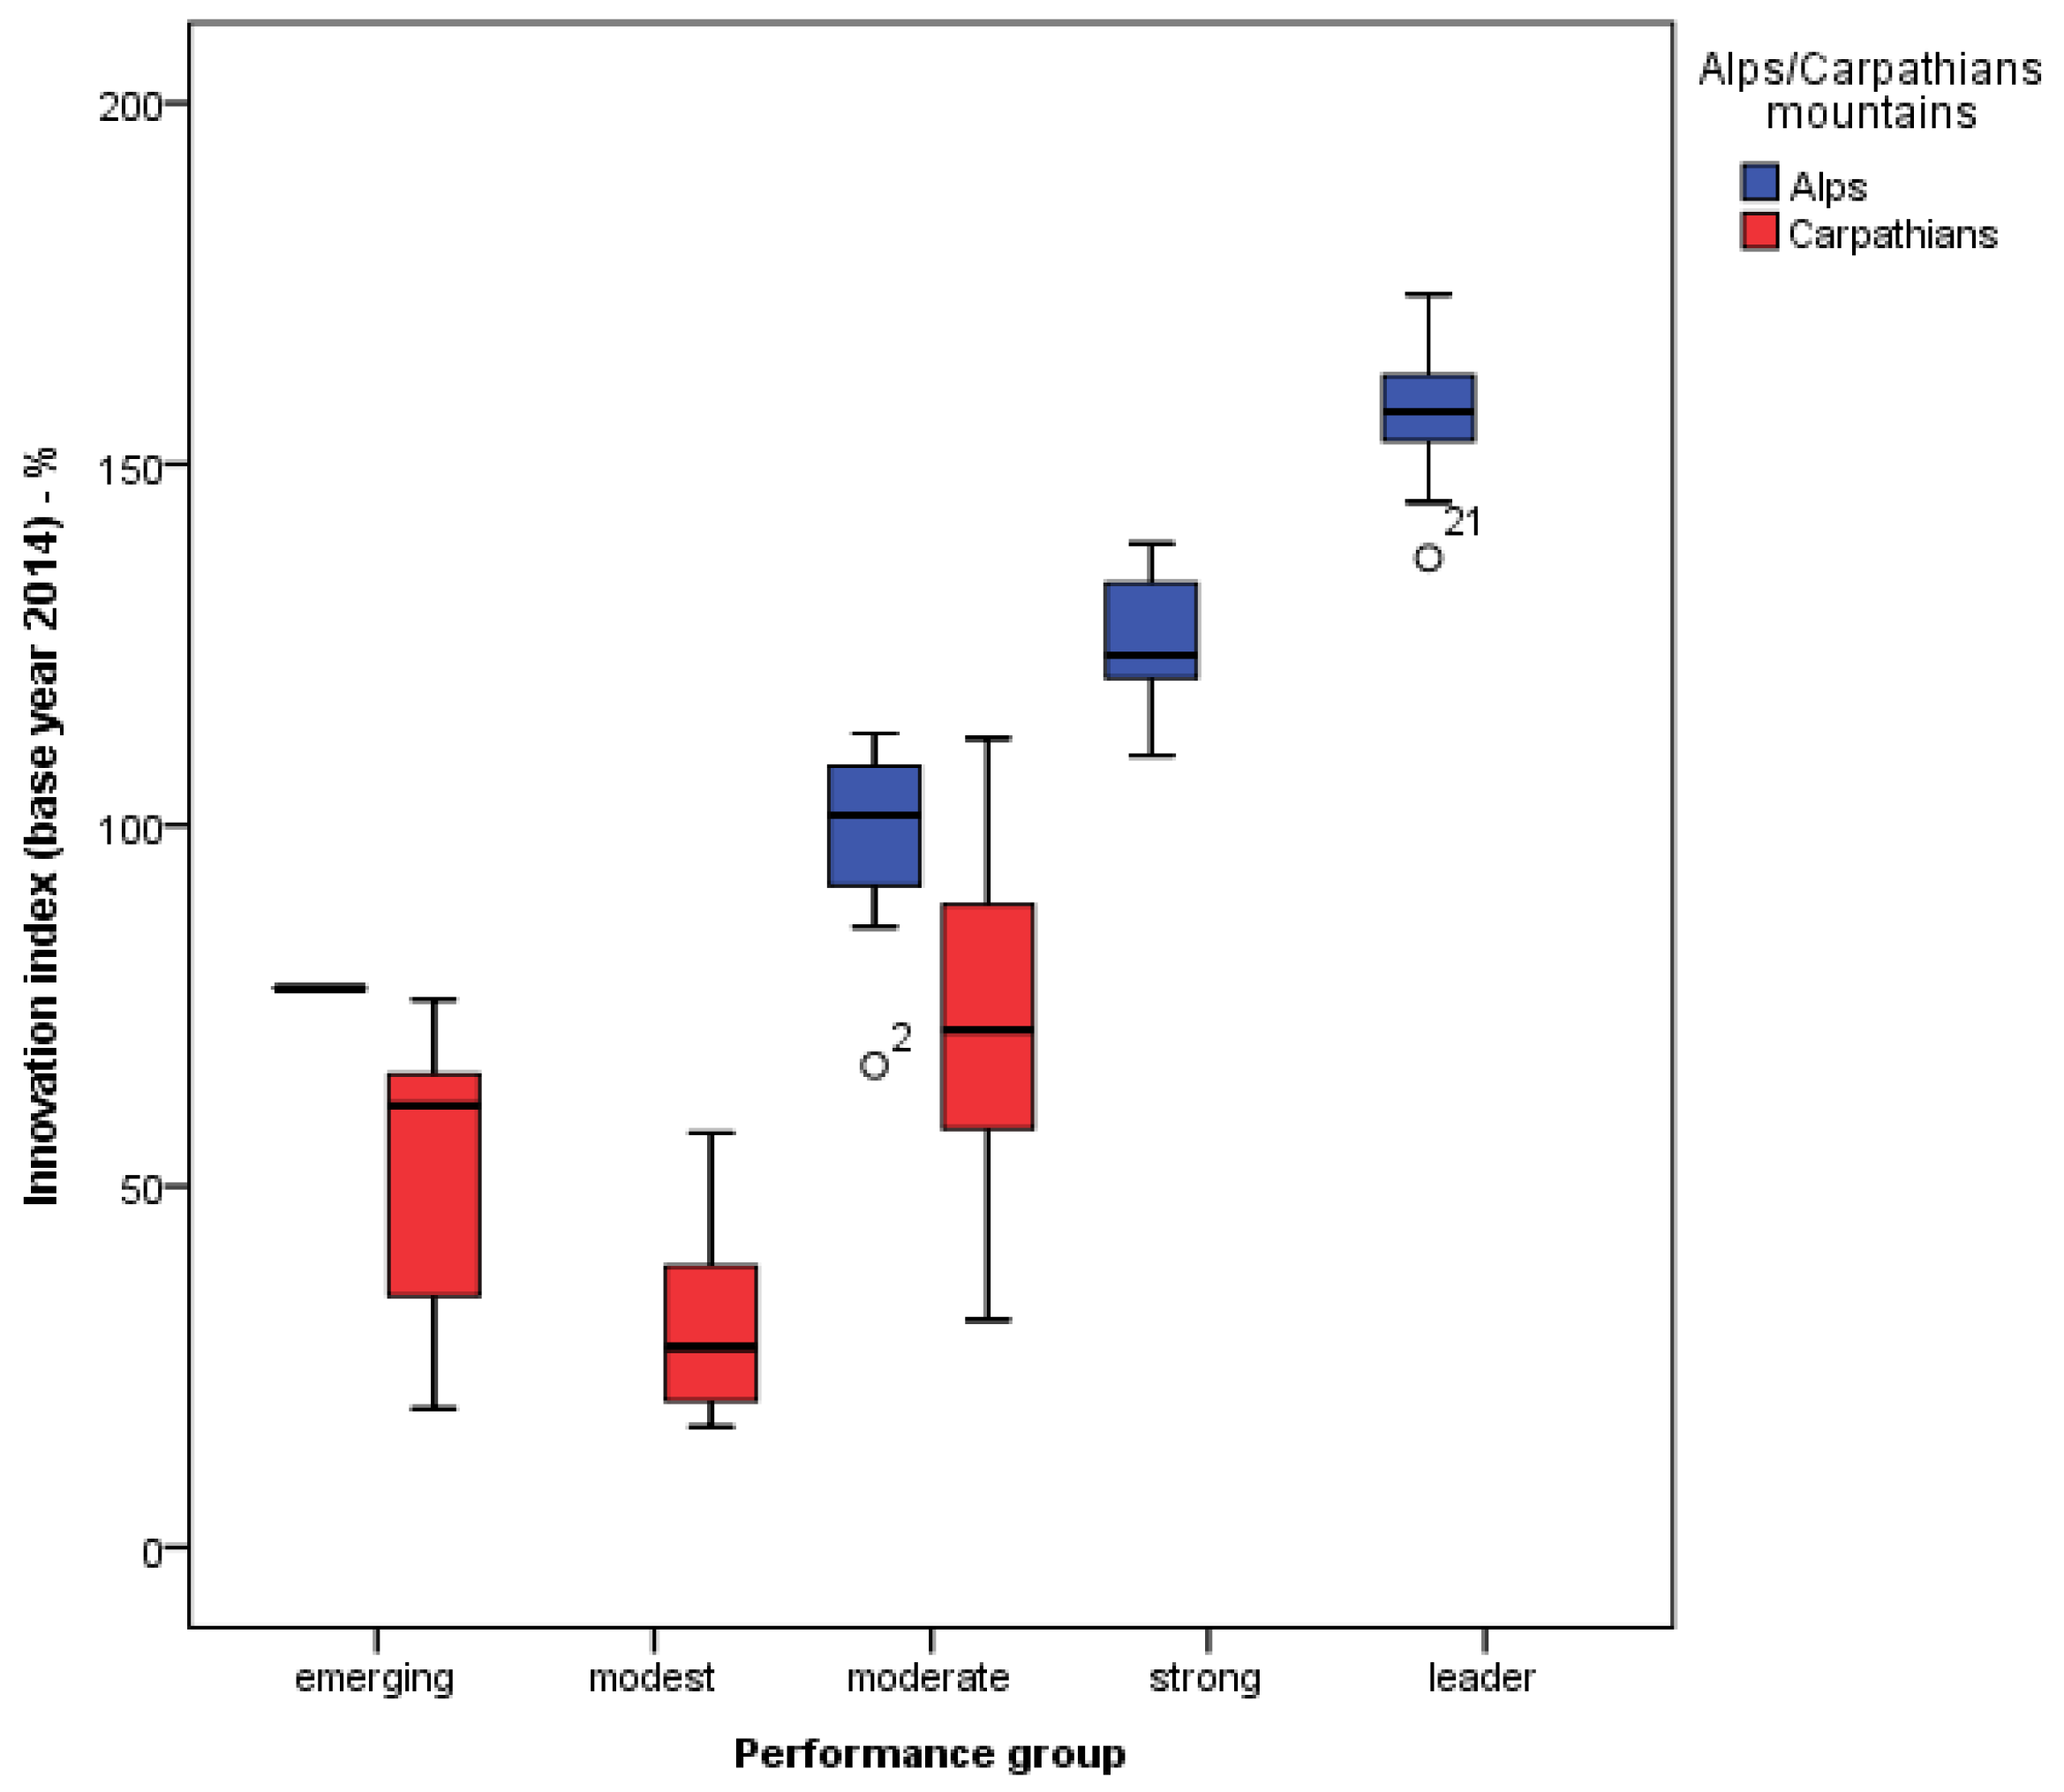
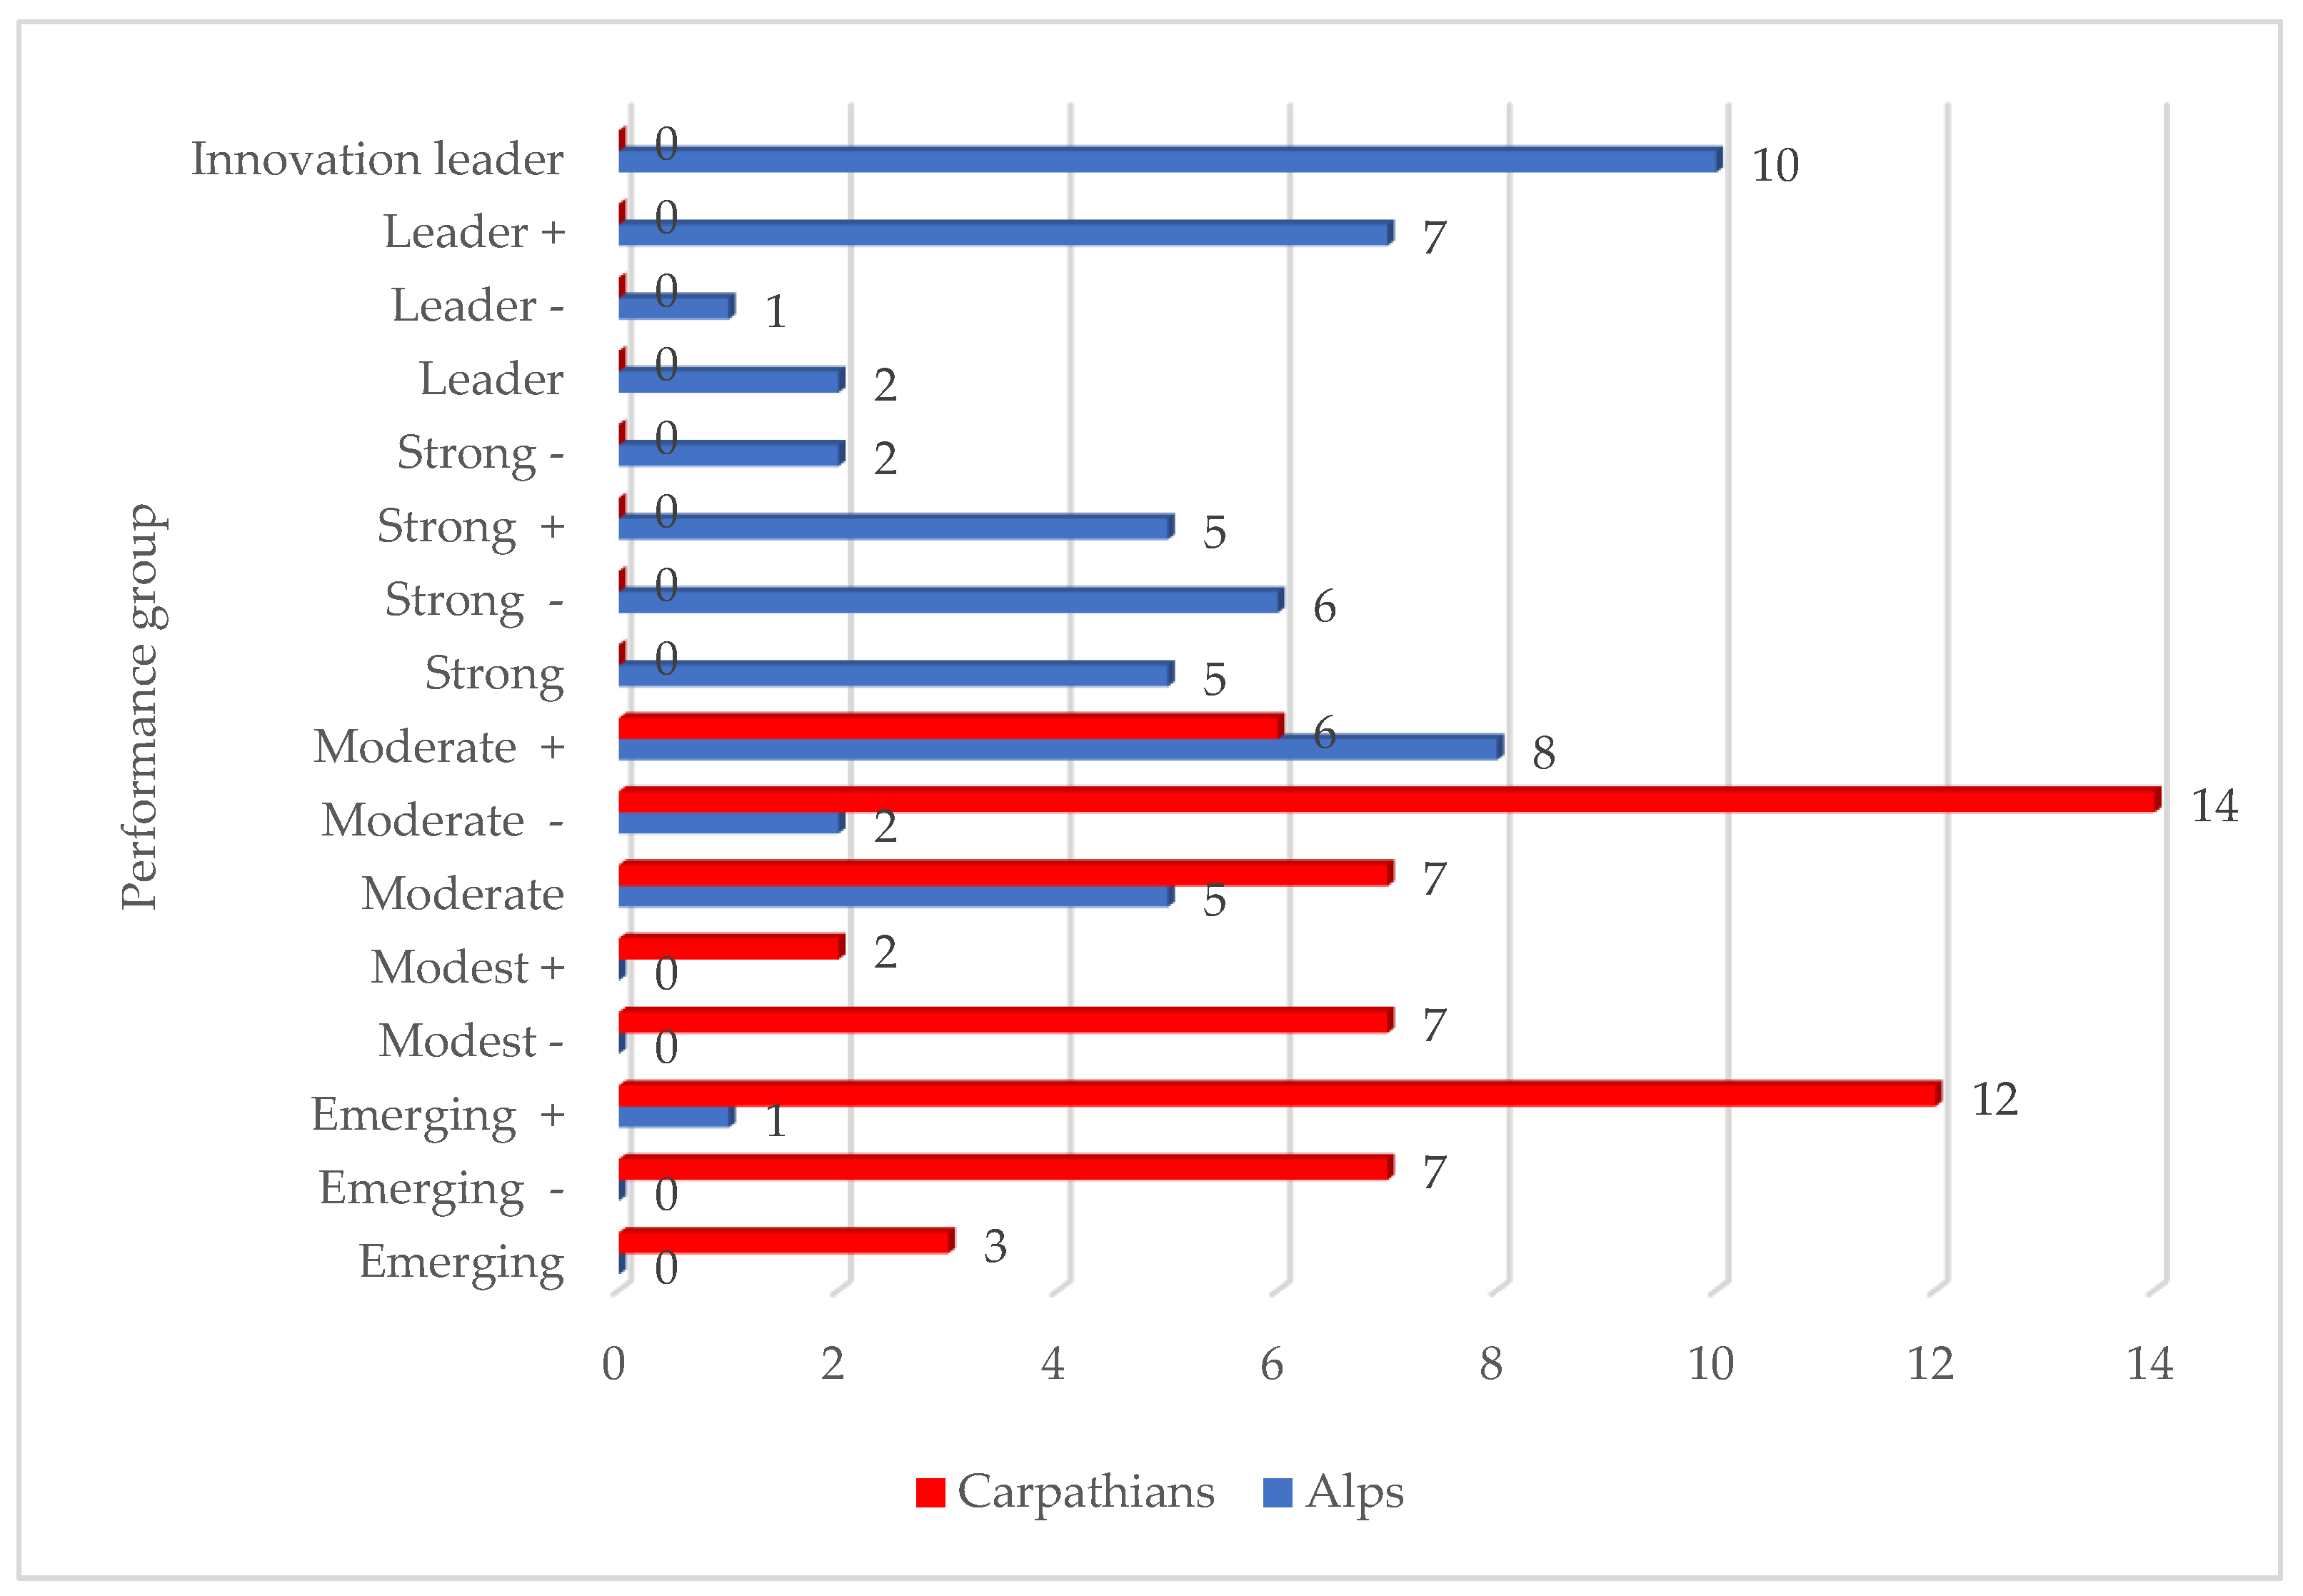
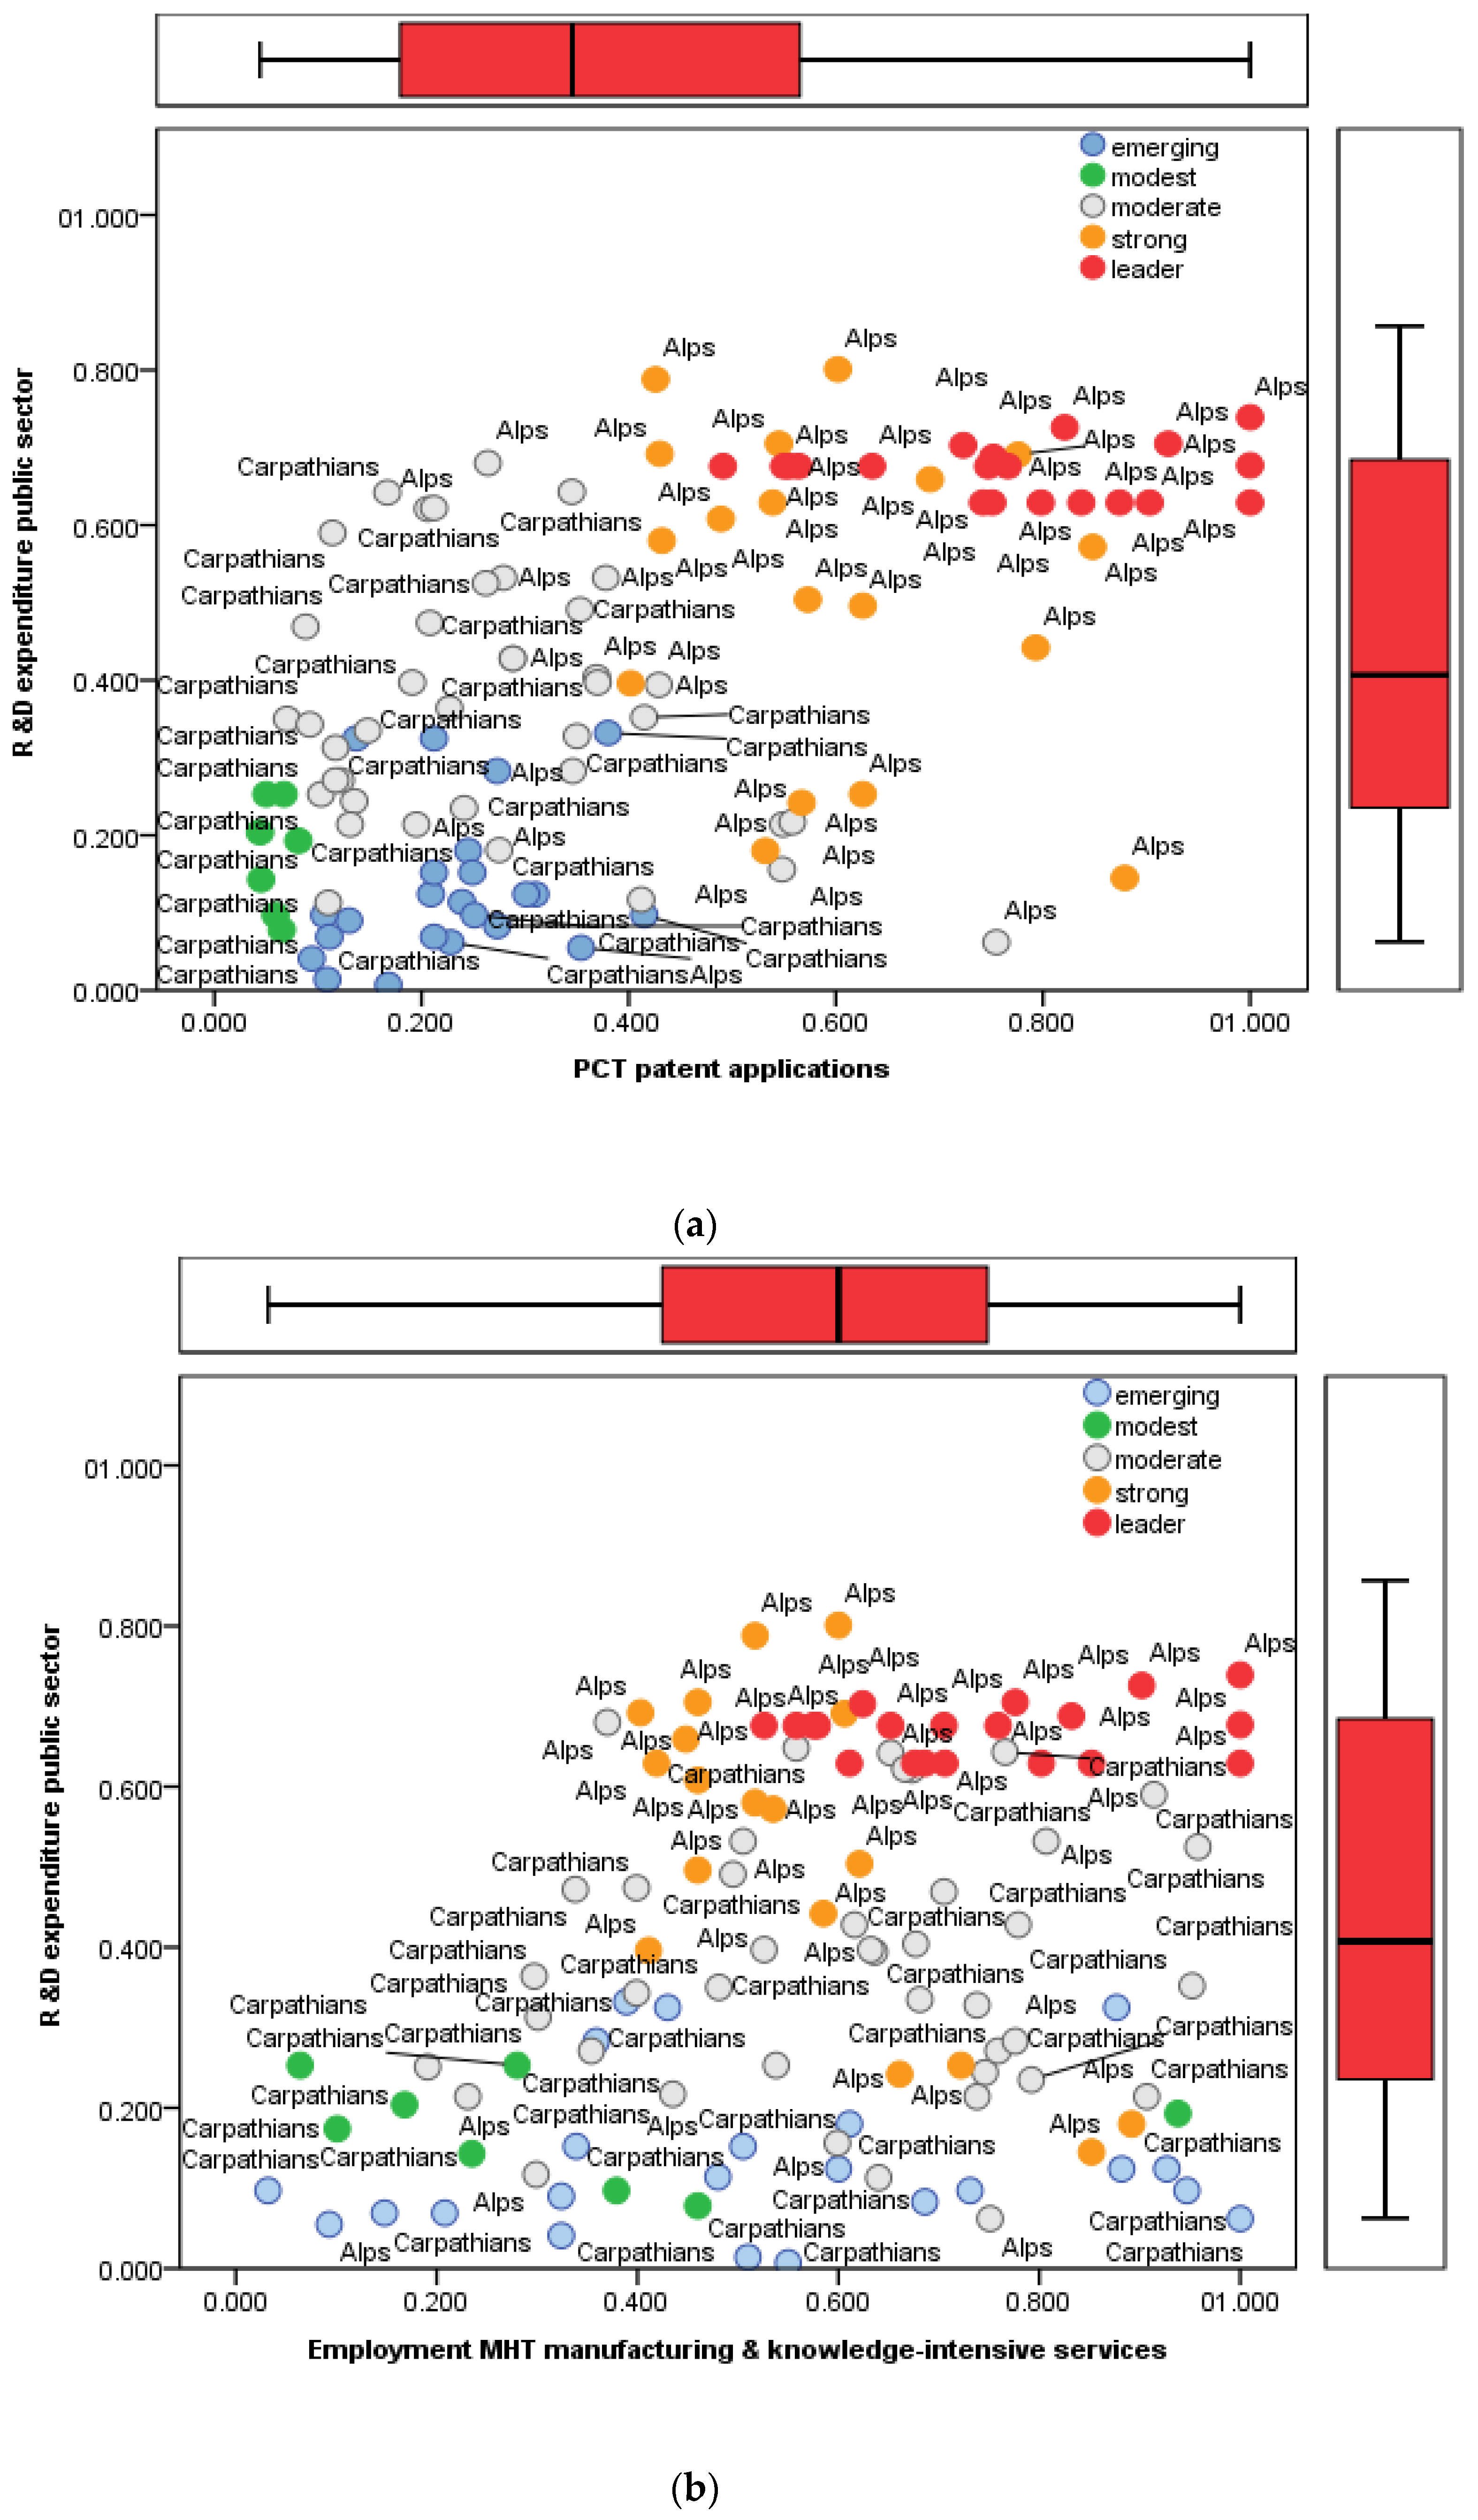
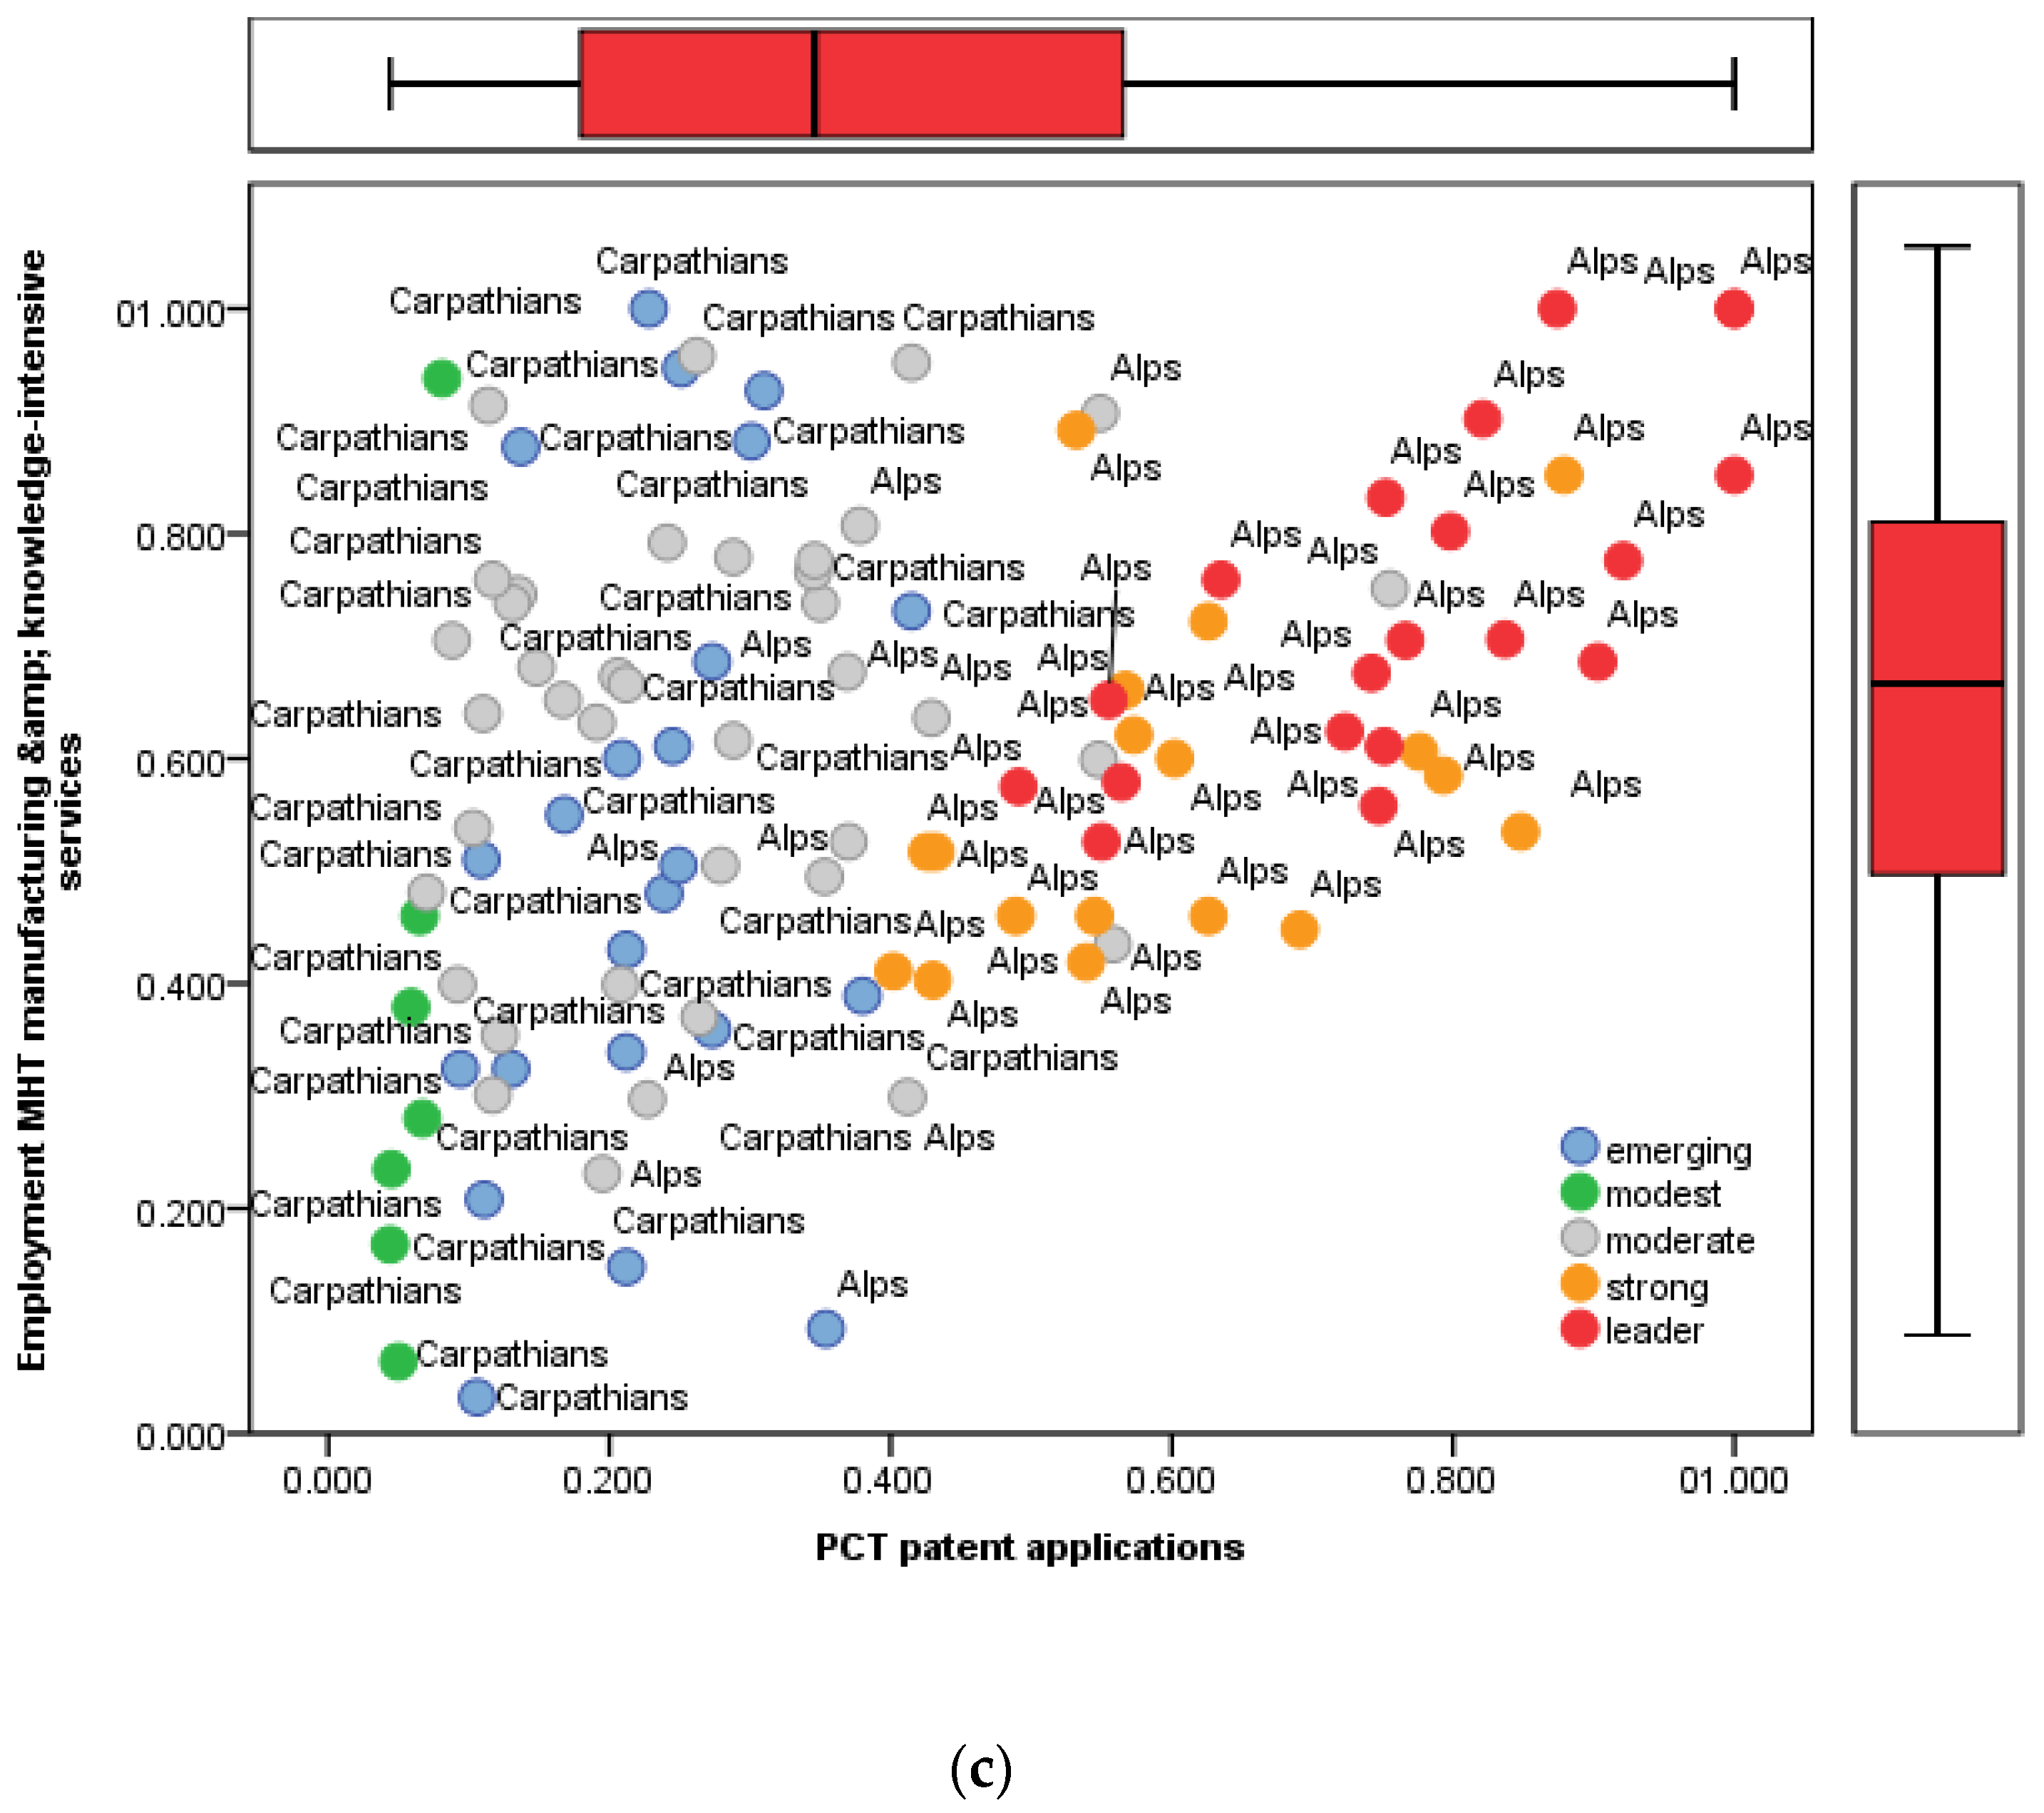
  • There are both Carpathians and Alps regions in the performance group “moderate,” but there is obviously a polarization of these regions, respectively, the Alps into strong and leader innovation of performance groups and the Carpathians regions in the emerging and modest performance groups; there are statistically significant differences between the mountain regions referring to the performance group based on the results of the chi-square bivariate test;
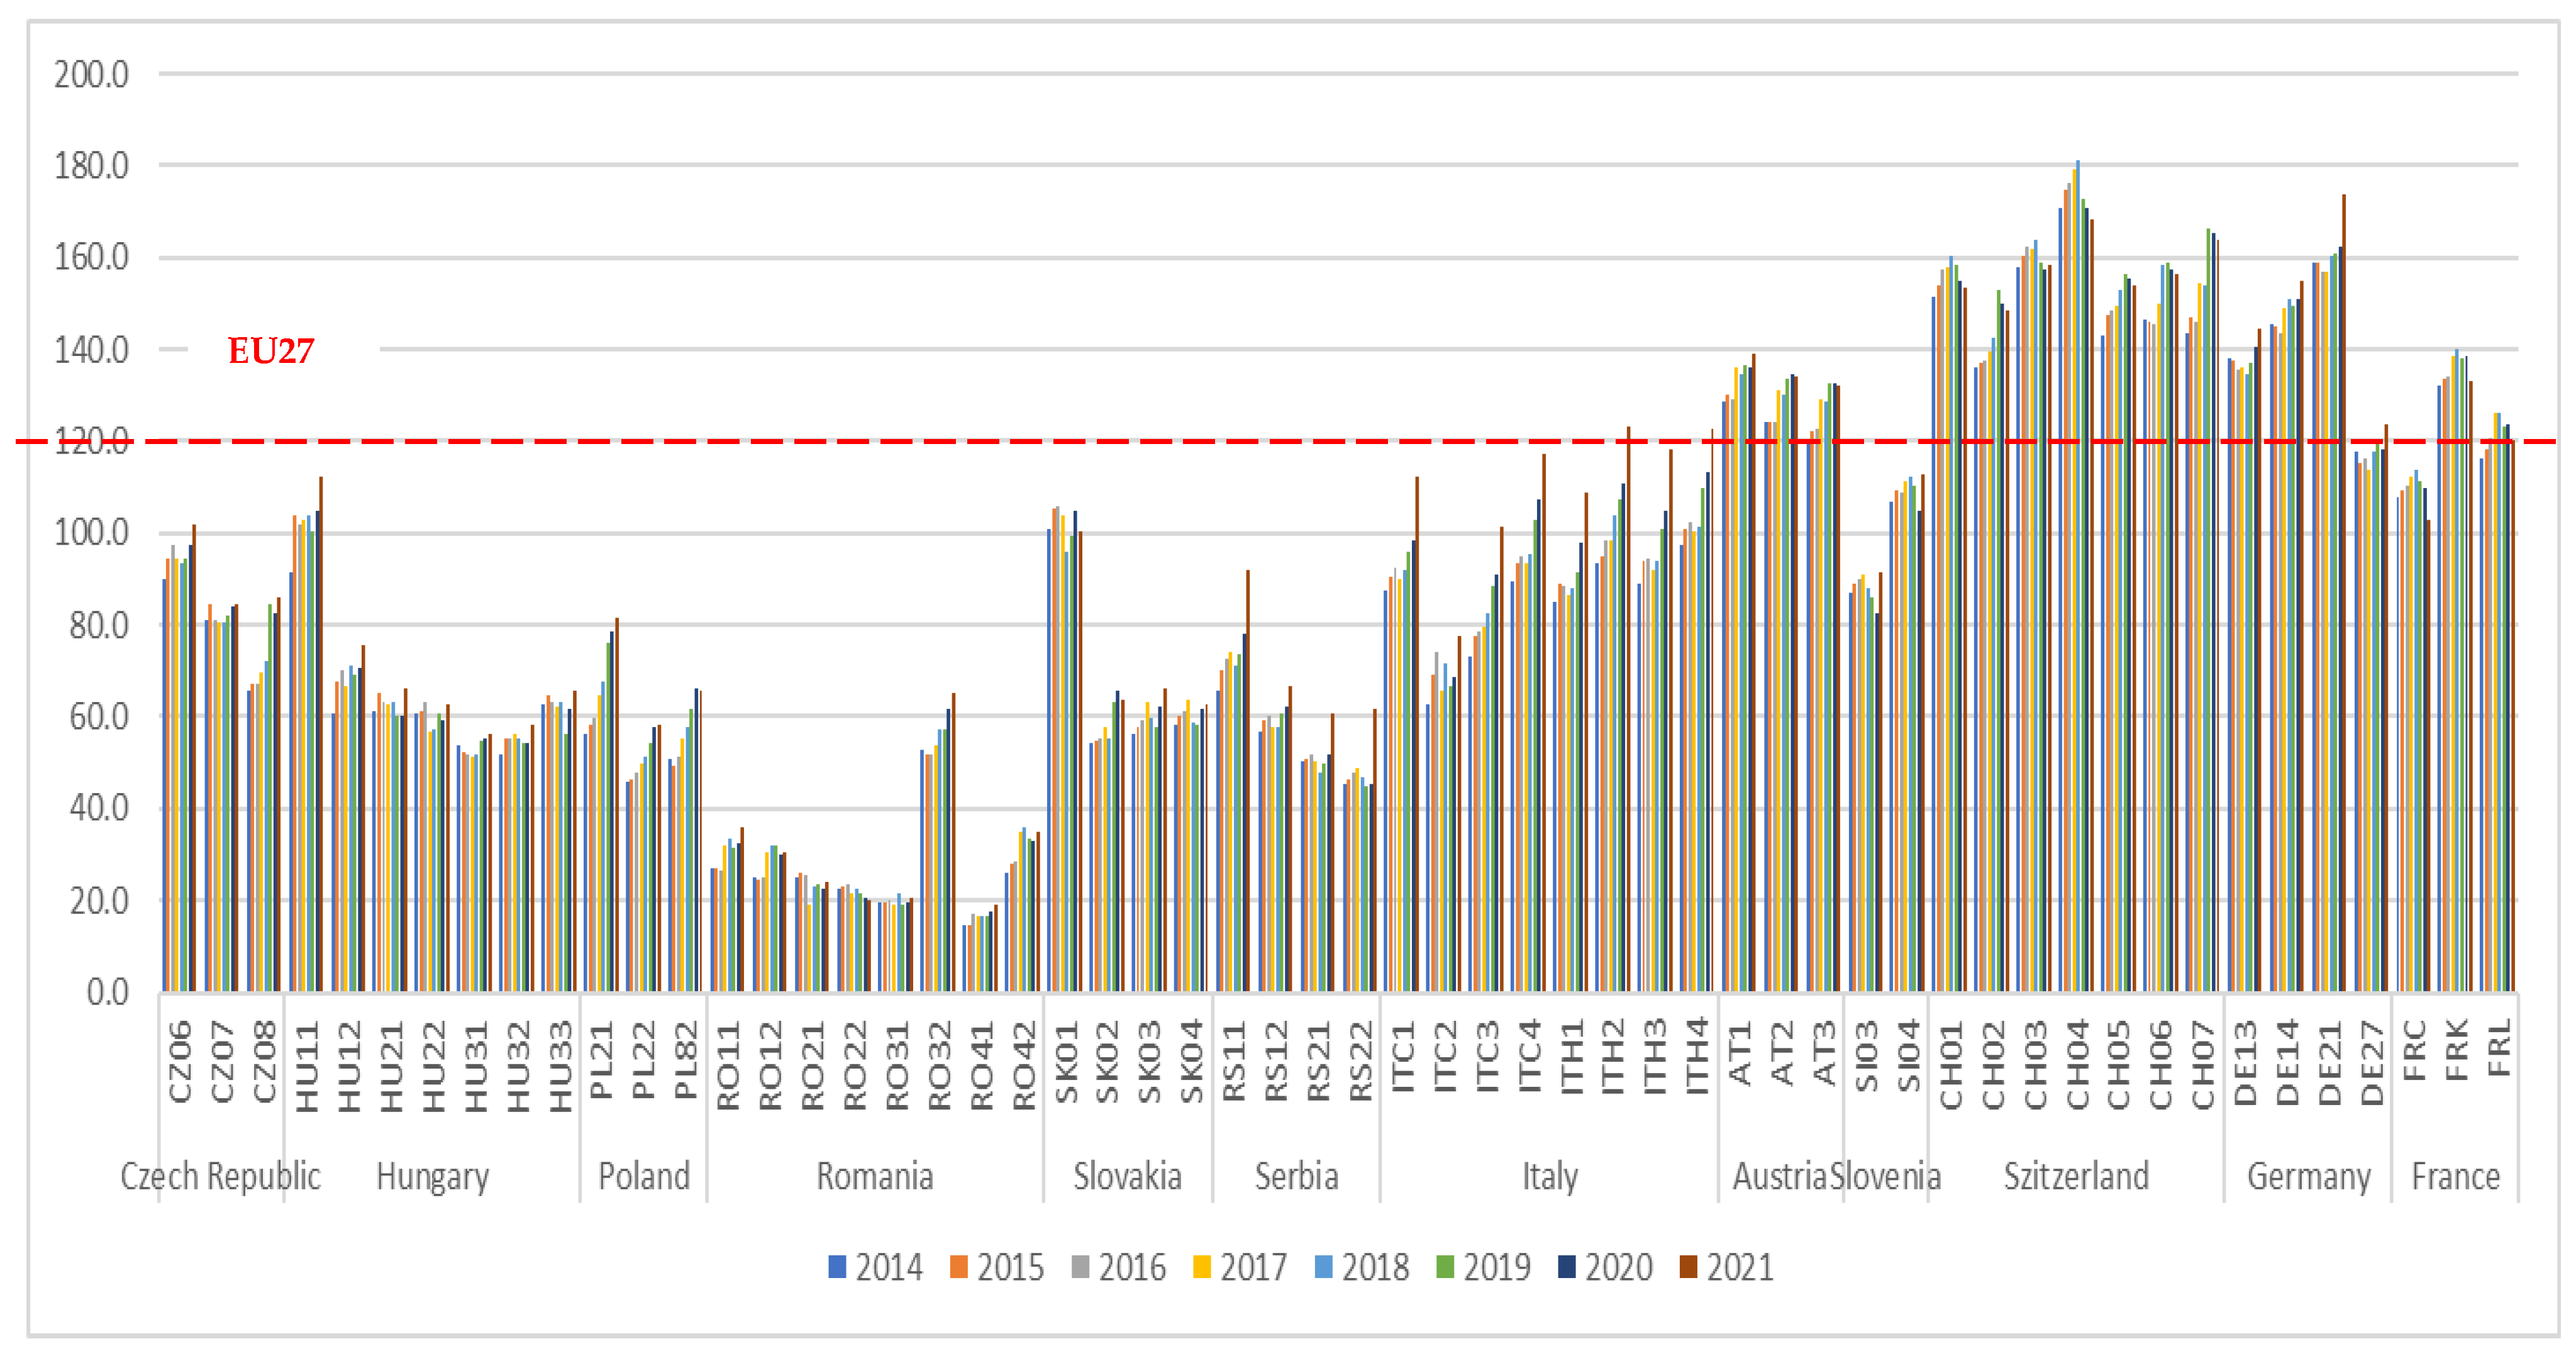
  • There are no statistically significant differences between two mountain regions for some innovation indicators such as (based on the Student’s t test) population with tertiary education, scientific co-publications, R&D expenditure business sector, non-R&D innovation expenditure, marketing or organizational innovators, design applications, and innovation index (base year 2014);
  • There are common best predictors for the Alps and the Carpathians as follows (based on the regression analysis): R&D expenditures public sector, the PCT patent applications (with an opposite sign in the regression equations with negative contribution for the Alps and a positive one for the Carpathians), the Employment MHT manufacturing and knowledge-intensive services;
  • The best predictors for performance groups from the Alps are (based on the regression analysis): (1) R&D expenditure public sector, (2) Sales of new-to-market and new-to-firm innovations, (3) Non-R&D innovation expenditures, (4) PCT patent applications, (5) Scientific co-publications, (6) Most-cited publications, (7) Employment MHT manufacturing and knowledge-intensive services;
  • The best predictors for performance groups from the Carpathians are (based on the regression analysis): (1) PCT patent applications, (2) R&D expenditure public sector, (3) R&D expenditure business sector, (4) Population with tertiary education, (5) Employment MHT manufacturing and knowledge-intensive services;
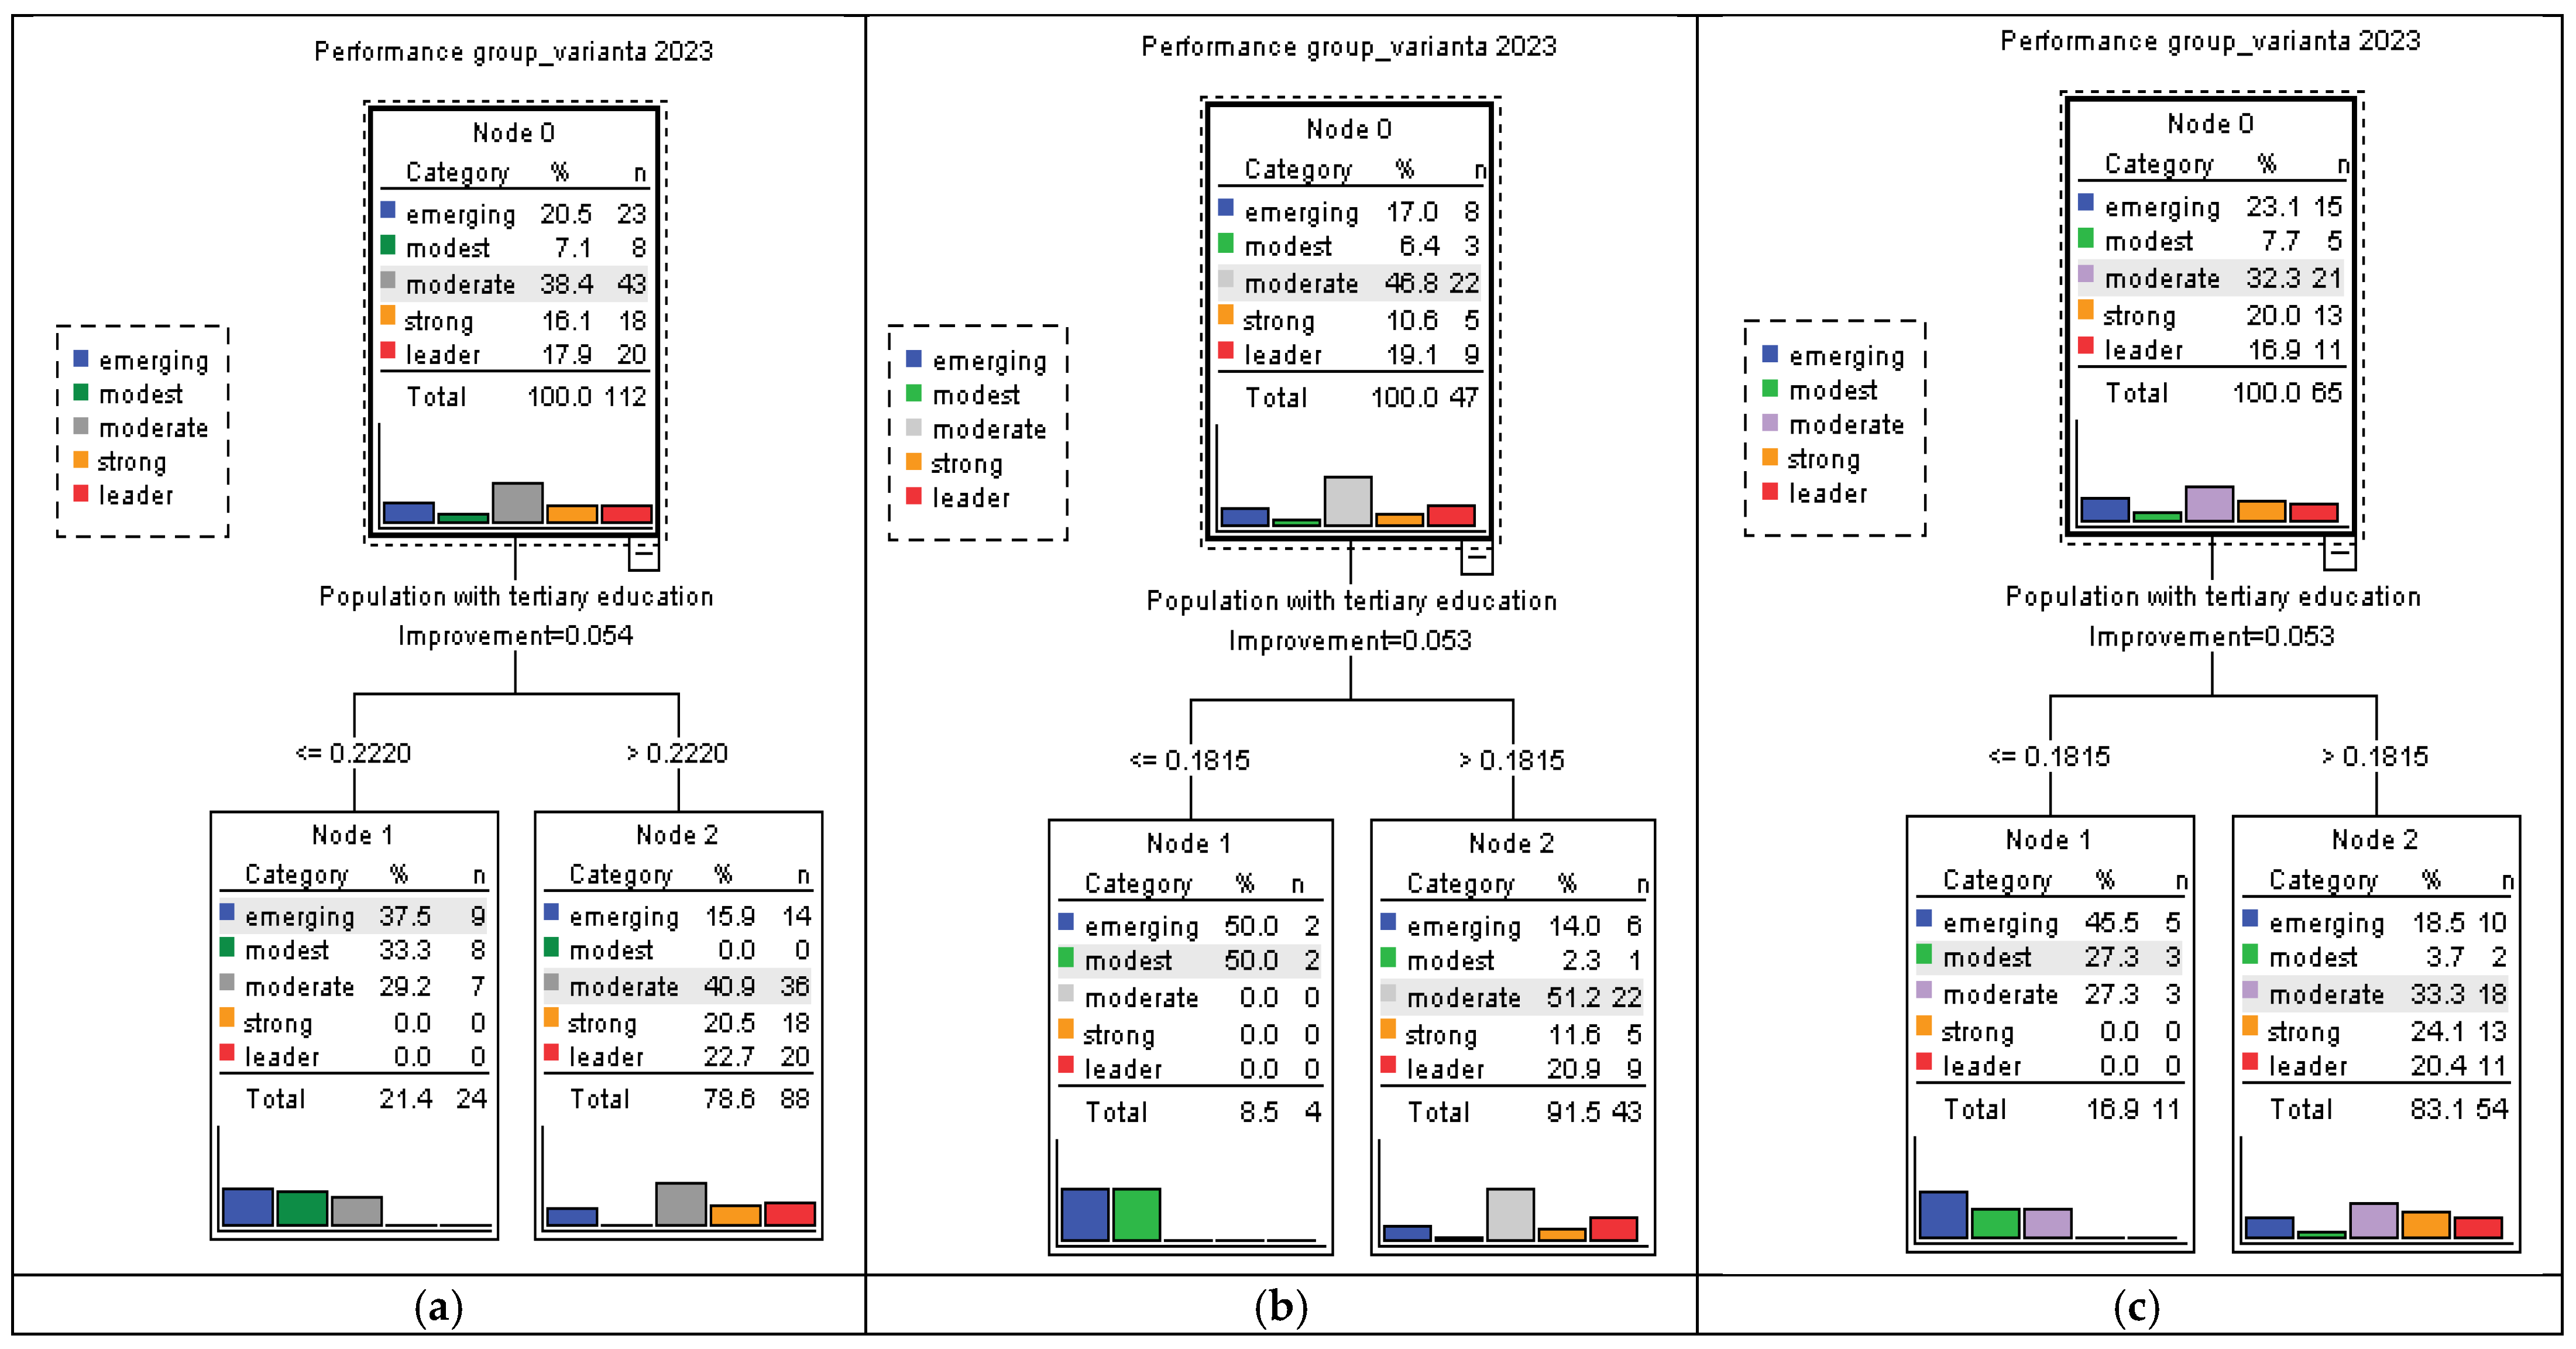
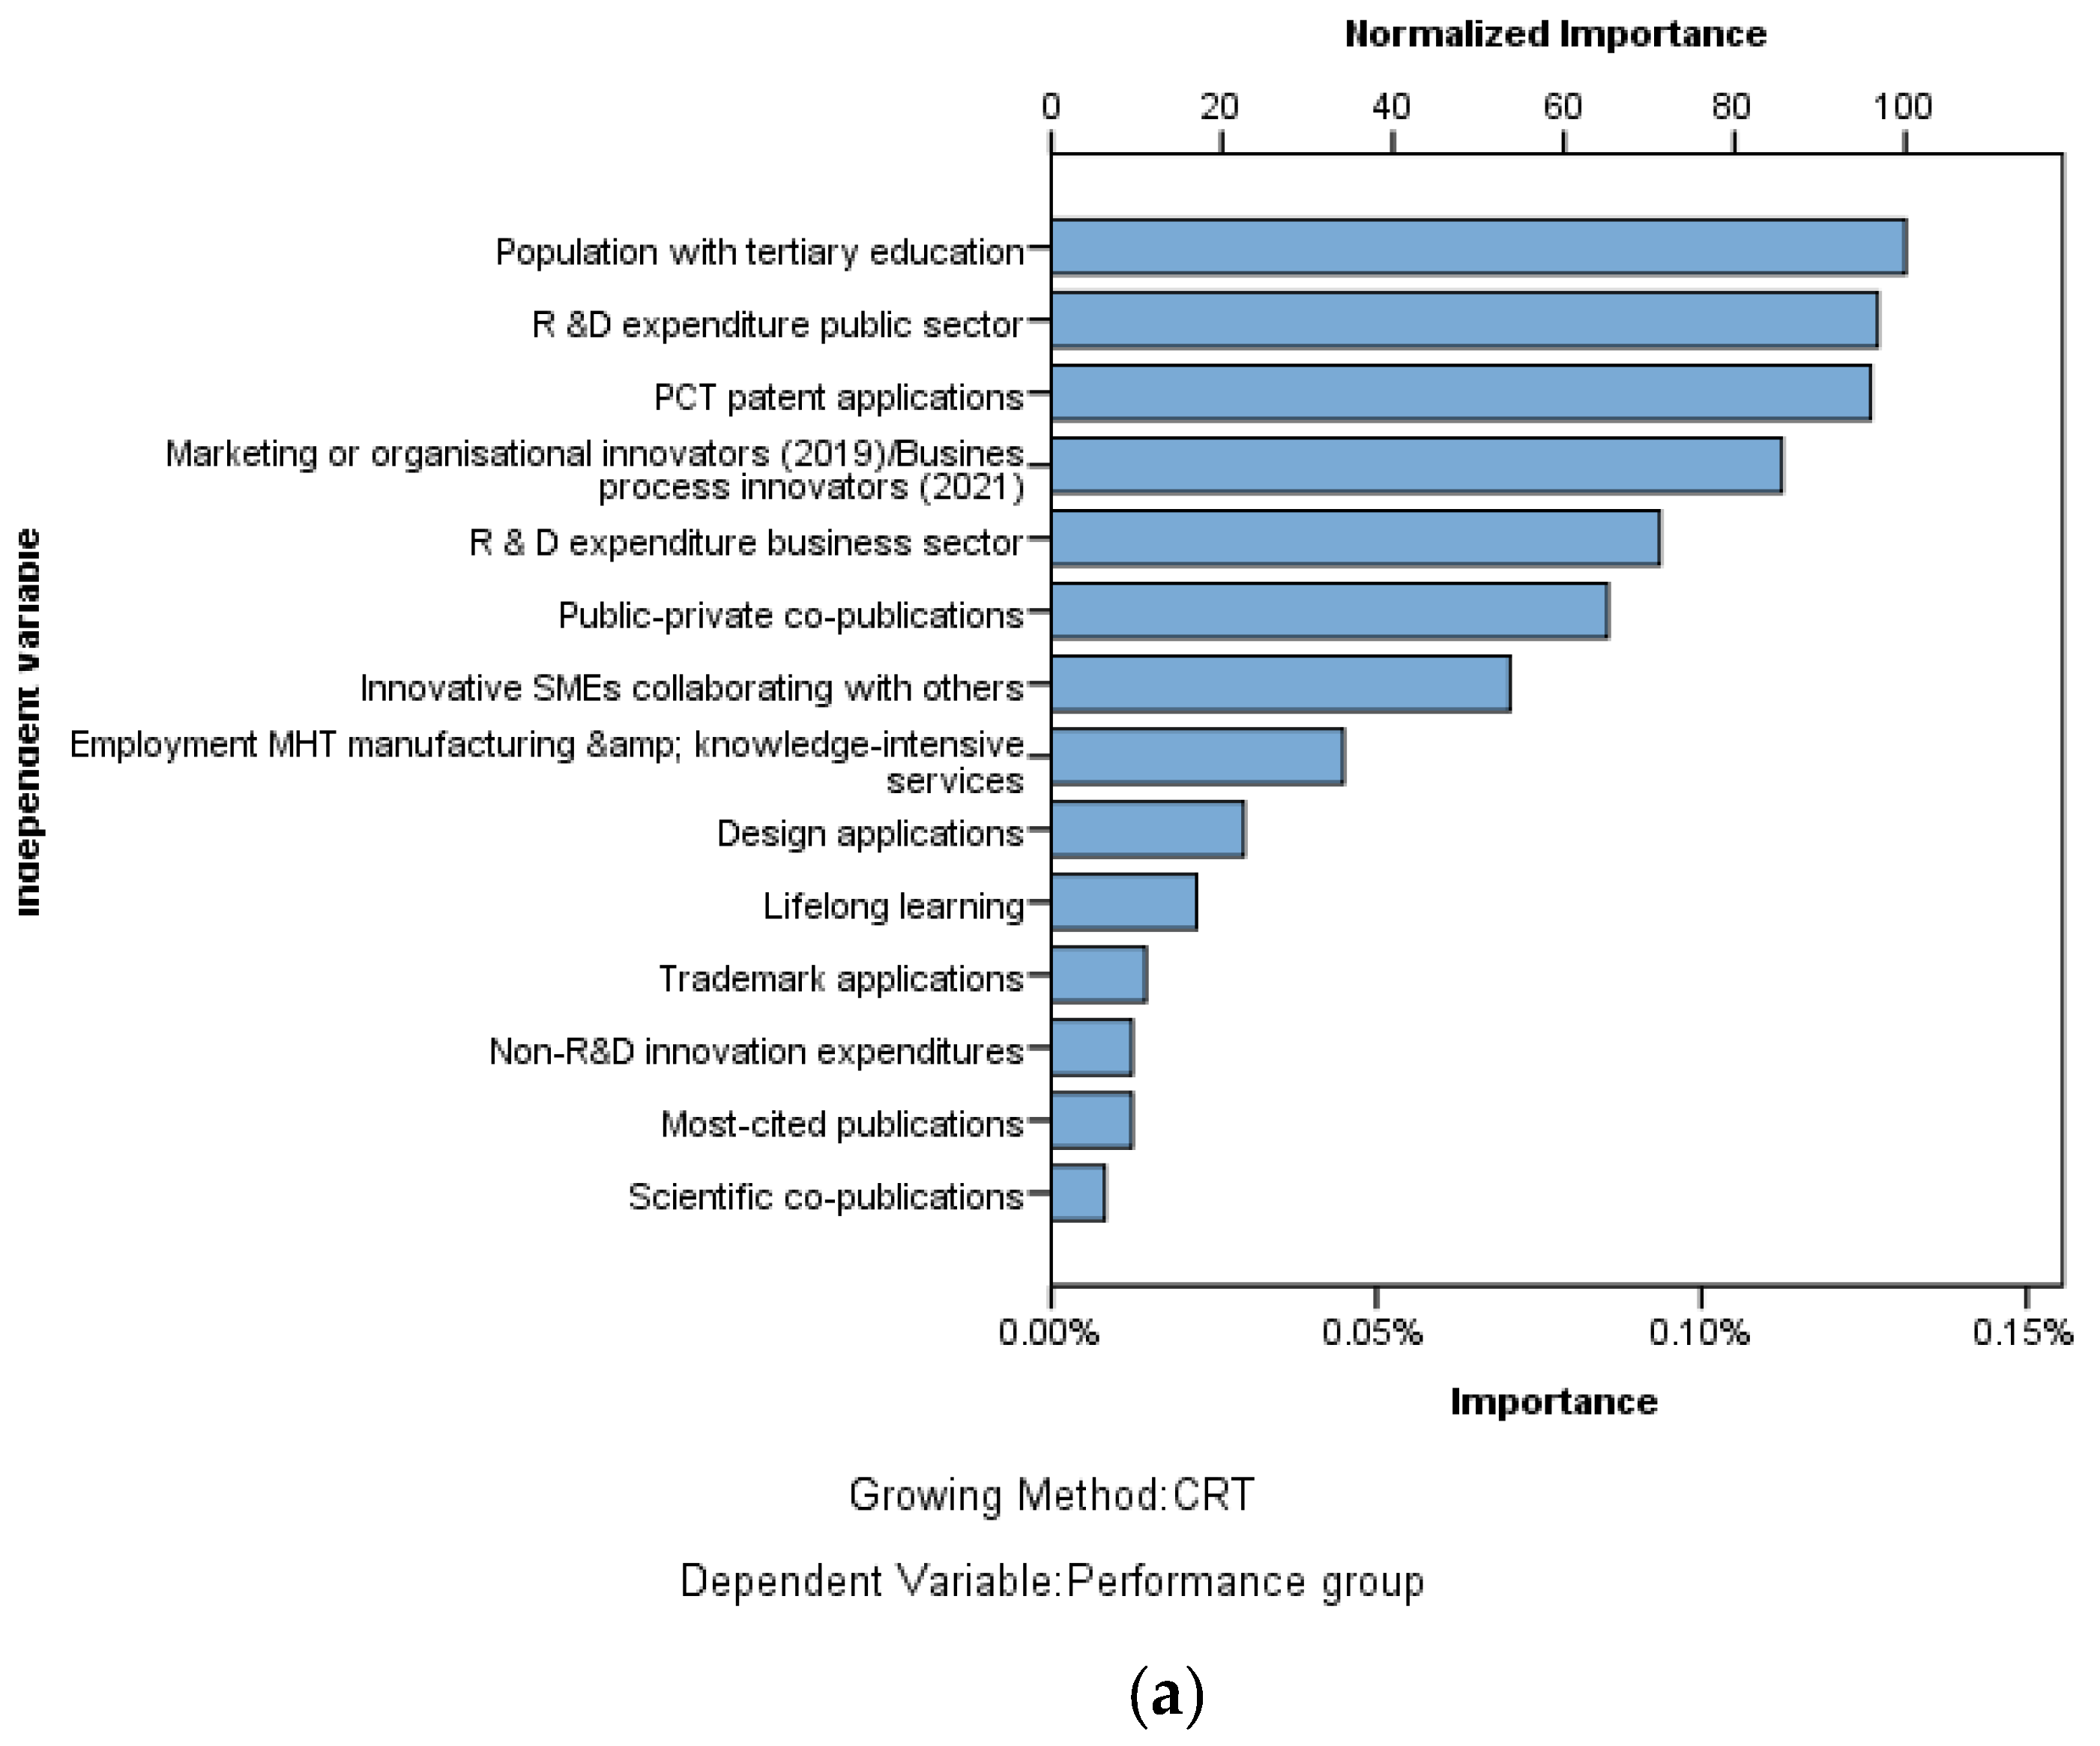
  • The innovator indicator that separates better the mountain regions inside each performance group is the population with tertiary education, based on the decision tree with the CRT growing method; none of the final nodes from the decision tree are “pure” (all the individuals belong to the same group), which means the resulting groups are still heterogeneous, and this reveals that there are more causal/association relationships or other influences/good predictors that dichotomize these mountains areas;
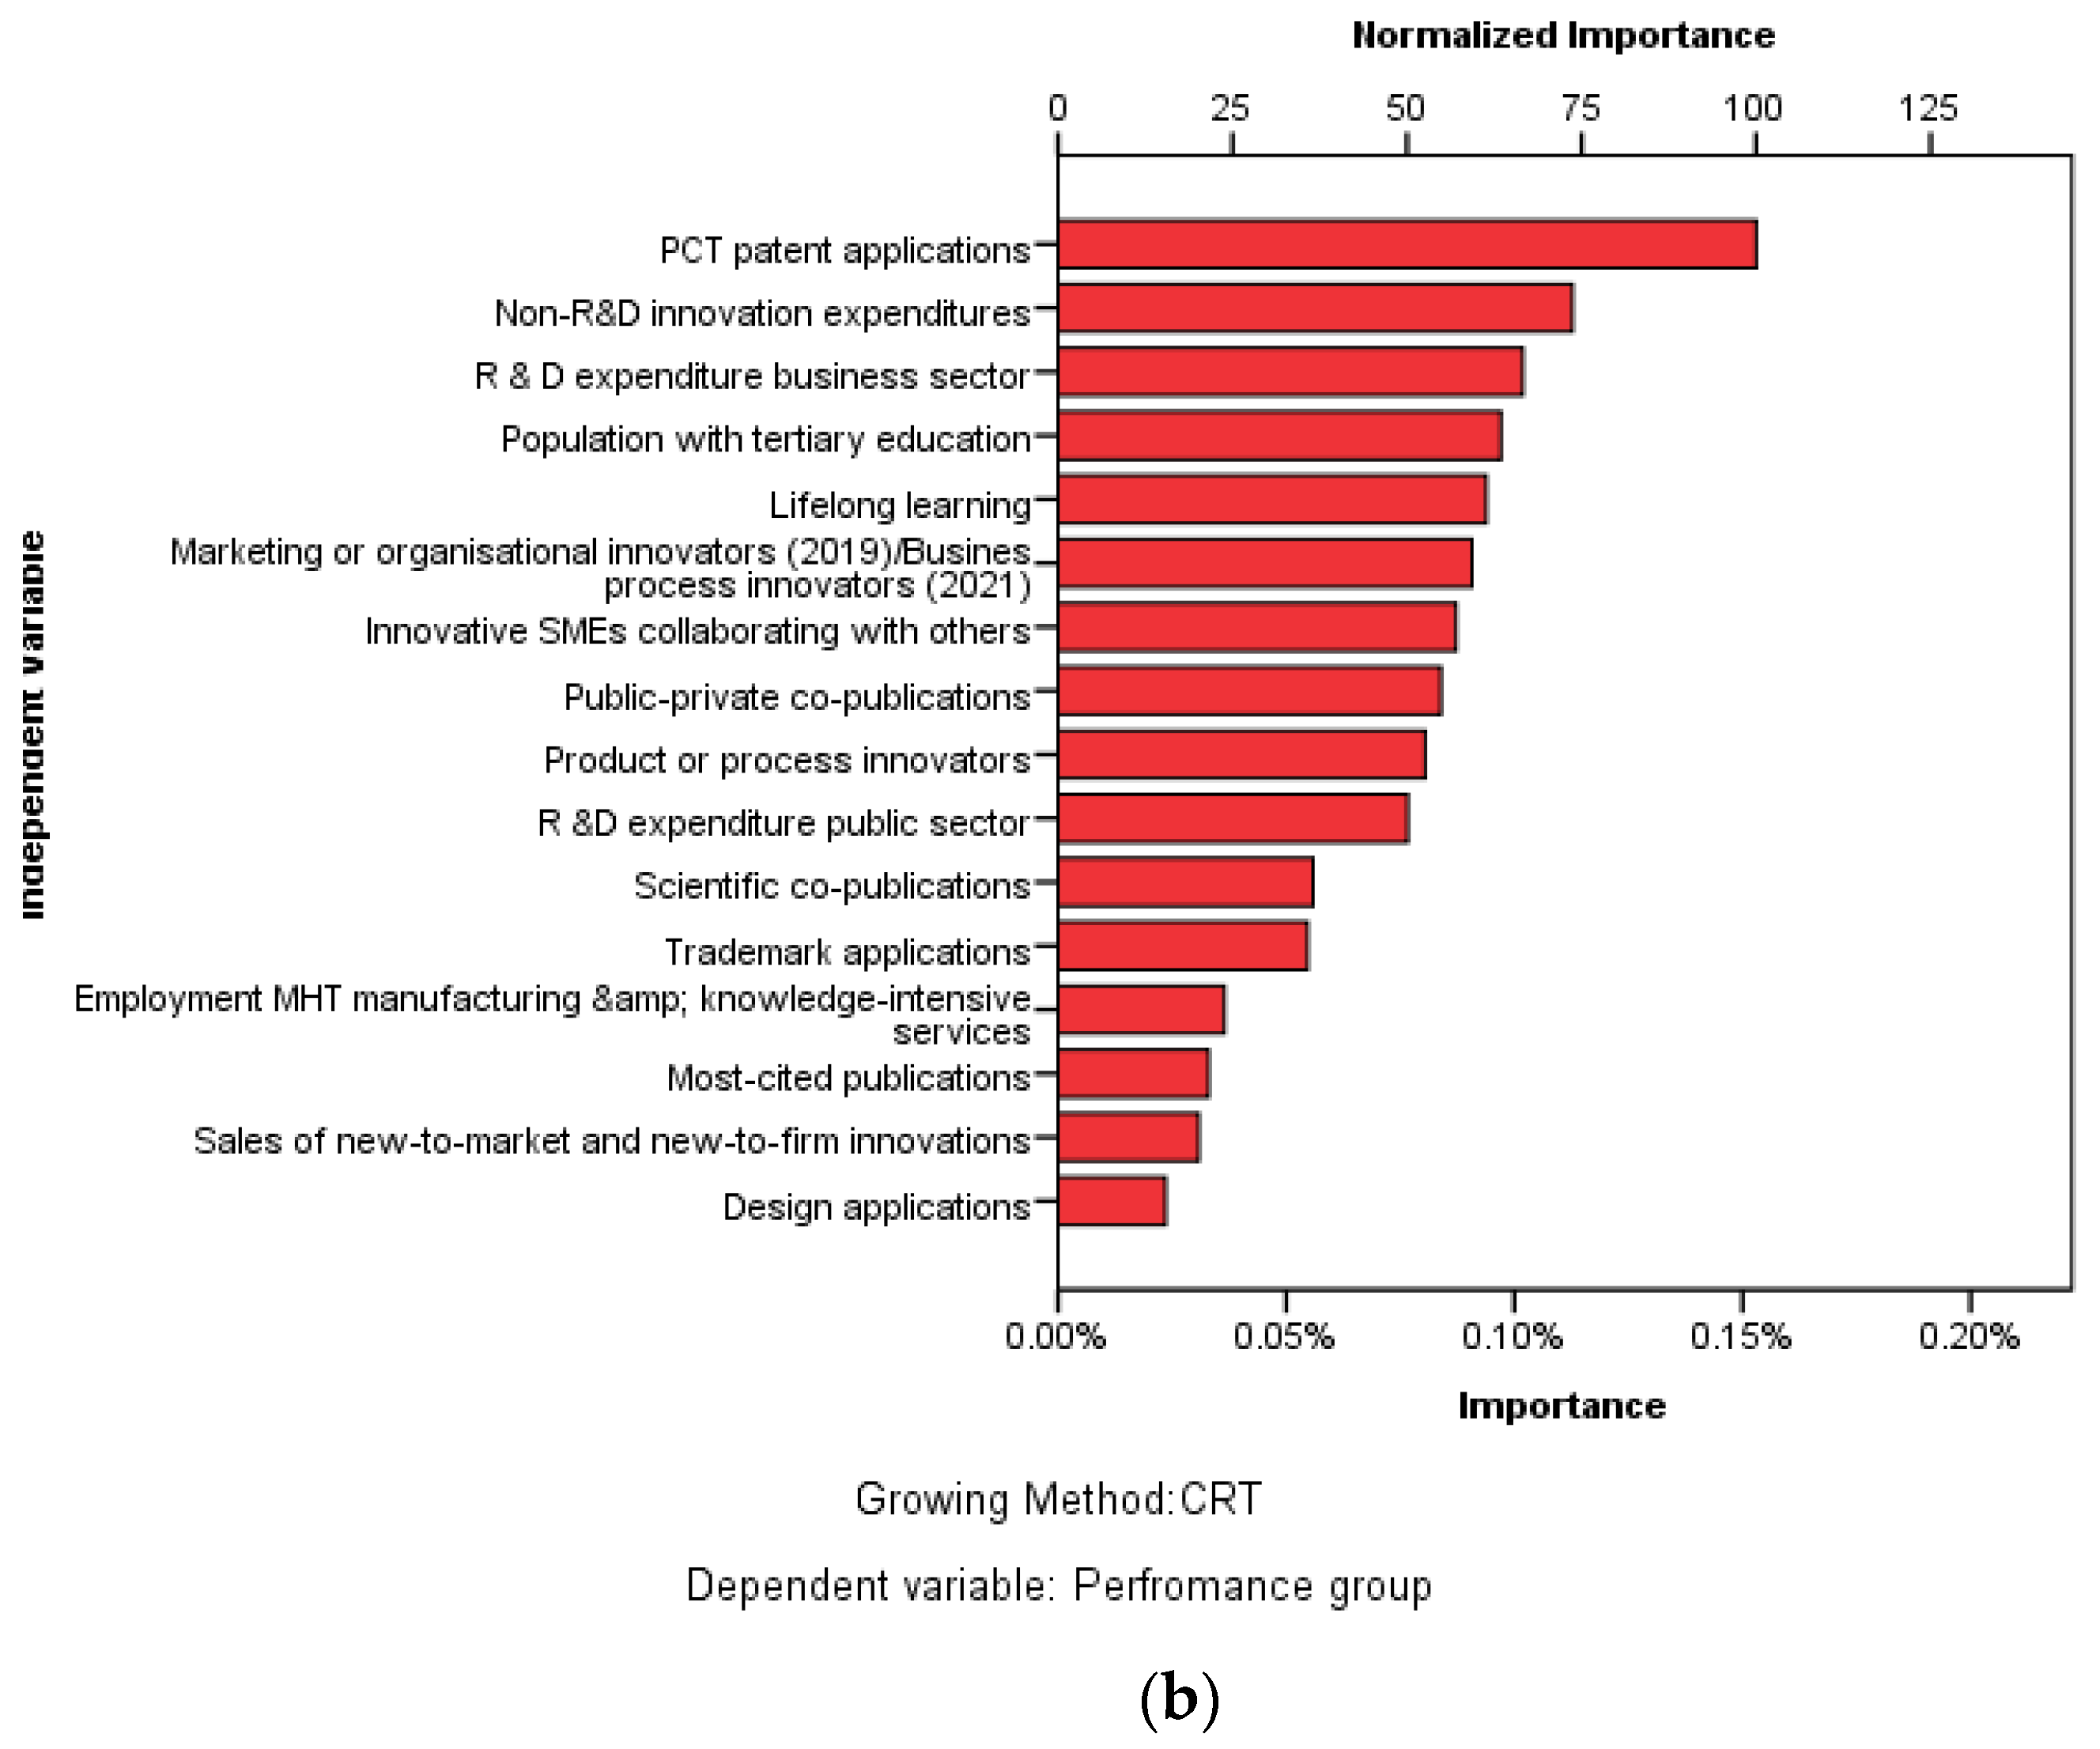
  • There are also some differences between the Alps and the Carpathians, based on the normalized importance of independent variables from the decision tree analysis, respectively: for the Alps, the population with tertiary education, R&D expenditure public sector, PCT patent applications, and business process innovators are in the first place of importance, whereas for the Carpathians, PCT patent applications, non-R&D innovation expenditure, and R&D expenditure business sector are the variables that grouped the Carpathians regions in performance groups;
  • The one-way ANOVA with Bonferroni post hoc multiple comparisons helped to emphasize inside each mountain regions the polarized countries for each best predictor.
The above-mentioned results help us to remark the validation of the research hypotheses such as:
  • The research hypothesis H1: There are significant differences between performance groups of the Alps and the Carpathians directly linked to policy and public spendings is confirmed accordingly with the chi-square bivariate test and descriptive statistics.
  • The research hypothesis H2: There are significant differences among RIS indicators for the Alps and the Carpathians mountains regions is partially confirmed for a part of the innovation indicators except population with tertiary education, scientific co-publications, R&D expenditure business sector, non-R&D innovation expenditure, marketing or organizational innovators, design applications, and innovation index (base year 2014).
  • The research hypothesis H3: The Alps and the Carpathians have different predictors for performance group of innovation is partially confirmed due to the multilinear regression results we found out and also the common best and statistically significant predictors for the Alps and the Carpathians, as follows: R&D expenditures public sector the PCT patent applications (with an opposite sign in the regression equations with negative contribution for the Alps and a positive one for the Carpathians), the Employment MHT manufacturing and knowledge-intensive services;
  • The research hypothesis H4: There are significant differences inside each mountain area (the Alps, the Carpathians) based on the geographical position of NUTS2 regions (West-East) is confirmed based on our results of the one-way ANOVA with Bonferroni post hoc multiple comparisons and in line with the results from the international literature [22,33,34,37,38,40,41,45].
We found out through statistical analysis that the COVID-19 pandemic has persisted for these regions. In 2021 compared with 2019, there are many mountain regions having negative migrations from strong to moderate (regions from France and Italy), from moderate to emerging performance groups (Hungary, Italy, Poland, Serbia, Slovenia), and from modest to emerging (regions from Romania and Serbia). Only the country capital from the Carpathians regions remains in the same performance group and only those that have the best positions in the performance groups, respectively: Bratislava, Bucharest, Budapest, and Belgrade. The countries from the performance groups ”leaders” and ”strong” (Switzerland and Germany) have no negative migrations after the time of the COVID-19 pandemic. There is only one mountain region from France with negative migration from strong to moderate. All the Austrian and Slovenian mountain regions kept their performance groups after the time of the COVID-19 pandemic, and three Italian regions have had positive migrations from moderate to strong. The situations are completely different for the Carpathians regions; all the regions have negative migration from moderate to modest and/or emerging performance groups.
However, by using a machine learning method (such as decision tree), a better perspective of how all these results might impact innovation policy could be of real help for stakeholders, helping them to decipher the best approach for each mountain region. In this light, the results generated by the new approach from our study based on machine learning methods combined with classical statistical methods could be useful, since the software will be able, after running the training set, to recognize a pattern, group data with similar characteristics determining a similar outcome, and generate an algorithm. In contrast to this method, the conventional statistical tests assume that the data and outcome are to some degree known, and the model is created by the user [63].
Regarding the choice of each statistical method applied in the research, the main advantages taken into consideration for each one was as follows:
  • the independent Student’s t test for the advantages of comparing the mean values for the continuous variables with normal distribution and the advantage to use this test due to the possibility to be applied under the non-normal distribution circumstances if there are over 30 statistical observations [64];
  • The one-way ANOVA with Bonferroni post hoc test multiple comparisons for the possibility to compare the variations between and within groups of mountain regions (Alps/Carpathians) to find what regions and/or countries have the best positive mean difference for each variable from the study;
  • The one-way ANOVA with Bonferroni post hoc test multiple comparisons helped to examine both the difference between means of dependent variables under the effect of controlled independent variables and the influence of uncontrolled independent variables [65];
  • Comparatively with other explicative methods (regression analysis, for example) ANOVA used as independent variable the categorial variables treated as continuous ones [66] and showed exactly the source of significant differences at the combined groupings based on two or more characteristics (Colibabă, 2000: 6) [67];
  • ANOVA used simultaneously metric and non-metric variables [68].
Regarding the regression analysis applied for research purposes, the statistical method has multiple advantages [56] to time series data and especially for macroeconomic analysis such as:
  • Show the intensity of the link between variables by the percent of variance of dependent variables explained by all the independent variables introduced in the model, and for our research this aspect is important to highlight those waste management indicators that are dependent on other latent, unquantifiable variables;
  • Show the statistical significance of the model by ANOVA test and therefore if there is an important link between variables (p-value of the model);
  • Help to quantify the contribution of each independent variable to variance of dependent variable in terms of direction (positive/negative) and quantity (the value of regression coefficient);
  • Based on standardized beta coefficients, the regression model helps to hierarchize the importance of each independent variable in the regression model;
  • By using the collinearity diagnosis, the researcher has the possibility to eliminate those independent variables perfectly correlated with other independent variables.
Our results have limitations linked to the statistical data [69] only for two years, more exactly for two years before and during the COVID-19 pandemic [62]. Another limit of our research could be considered that we do not retain here the EUSALP Strategy that is also targeting innovation, but this is a governance-based macro-regional strategy and lot place/local-based, specific to a NUTS2 region. Gaps and certain limitations of this study could be countered by advancing the theme upon including reviews on governance of innovation systems and policy, policy instruments, and coordination setup for innovation at the territorial level. For future research, the authors will take into consideration expanding the research area by including more mountain regions and extending the timeframe for analysis, as well as take into consideration the other important economic indicators such as Porter and Stern’s national innovation model [69,70]

6. Conclusions

To conclude, we can affirm that our results partially confirm the Porter and Stern results [69,70] that a limited focus on innovation capacity, especially for Eastern Europe, will constrain the progress of countries [13,69,70], and the proactive economies will prosper [69,70].
The positioning of most Carpathian regions below the EU27 baseline and the Alpine regions just above the same baseline attest to the fact that no common policy measures toward innovations will be considered. In fact, this has historical causes (such as capitalism vs. communism, private ownership vs. collectivization, differentiated bottom-up approaches in the Alps vs. common top-down state-based approaches in the Carpathians), but, considering the policy manifestation in the last decades, we see that since the Alpine regions have developed and operationalized smart specialization strategies, this is not the case in the Carpathians where the concept is still emergent. A territorial differentiator among the study areas is the location of the innovation hotspots. Since the main economic and applied-research-oriented cities of the Alpine countries are in the Alpine regions, unfortunately the Carpathian area is lacking this. Considering that innovation return is lower in developed countries than in emerging economies (i.e., the return gained upon each new innovation investment is lower than the previous) [71], there are still steps worth taking in the Carpathian mountain areas toward an economy based on innovation systems, contributing to resilience, thus contributing to both innovation policy and cohesion policy.
As in the case of the social innovation concept [29,72], the constructive interaction between public, private, and civil society institutions is the key factor for innovation in the European mountain areas [29]. Public policy must create open innovation environments [73] accordingly with the quintuple helix harmonizing the ecosystem [61,74] to internalize emerging spillovers [31].
Our research results highlight multiple particularities of this important field and of innovation and, most important, directly link the innovation policy in Europe in general and mountain regions especially.
Scoreboards are based on measurements that provides country rankings. To get findings on the regional level, in our case mountain regions, the only available metric is the Regional Innovation Scoreboard (RIS), which is the regional score for the main tool, namely the European Innovation Scoreboard. We can say that the RIS has strong policy implications since it is the only one measuring innovation at the regional level using the same indicator for the entire territory, and it should drive policy decisions. Since it is only evidence-based policy and not informed decision making, it is questionable the relevance for the practice of innovation policy. It is rather difficult to follow an evidence-based roadmap for innovation in mountain economies since there is only a theoretical direct link between initial inputs and impacts. Considering the innovation roadmap starting from R&D expenditure in the public sector as an initial input, in order to reach the impact of GDP growth there are intermediate outputs that will be assessed such as new doctorate graduates and international scientific co-publications, that lead toward another layer, including patent applications and trademarks, which finally translates into knowledge-intensive services and high-tech product exports as final outputs. These, in the end, will generate the impact. In this case, the gap in mountain regions is the capacity to generate and follow temporal relationships in the innovation networks [75]. The indicators can be used to fulfill a communication function to raise awareness of innovation, but they should not be seen as effective items to make policy decisions [76] because policies are effective when designed and implemented in a context-specific scenario [77]. In mountain areas, innovation governance instead of being context-specific is often based on policies designed and implemented as a copy of policies meant initially for other systems, areas, sectors, and contexts. This is also the case when trying to copy Alpine policies in the Carpathians. The public sector should enhance the process, providing accurate legal frameworks [78], procurement of innovation, and shared risks in R&D [31]. At this point, it is quite difficult to improve what cannot be measured, and if the innovation metrics exist at some point, although it does not focus on thematic transversal topics (rurality, mountain areas, remote areas, peripheral areas) [46], innovation-based policies in mountain areas are not yet applied.
As clusters could be a good solution for the economic prosperity of the Central and Eastern European regions in general [33,79] and the Carpathian regions in particular, and need institutional help to evolve into profitable innovation areas, the effects on innovation systems are related to specific capacities of the relevant organizations implementing change [23]. The European Union’s impact is positive in CEE regarding the innovation policies specific for reorienting economic policies in general to a more sustainable growth [34]. Our research results sustain the results of Acha and Balazs [37] regarding the needed to change the mental models that underlie innovation policy makers and sustain pro-innovation policy in CEE [38].
The methodological contribution consists in the research approach of complementary and multidisciplinary applying of well-known and widely recognized statistical methods together with machine learning methods, the decision tree with CRT algorithm for the above-mentioned advantages, and in respect to the aim and objectives of the research. The practical contribution consists in the comparative analysis for the Alps and the Carpathians regions, an analysis that for an important number of aspects linked to the innovation capacity from these regions find out statistically significant differences (p-value < 0.05), giving a critical inside look for stakeholders of territorial applied policy and macroregional levels. From the theoretical contribution point of view, our research results fill a gap in the scientific literature for innovation capacity and for mountain regions, in particular, and emphasize the macroeconomic discrepancy in terms of innovation politics, sustaining of innovation capacities, and innovation regional strategies. The authors will extrapolate findings to sectorial policies in those mountain regions that address innovation or the Research, Development, and Innovation (RDI) component of growth in their smart specialization strategies.

Author Contributions

Conceptualization, A.C. and M.R.G.; methodology, M.R.G.; validation, M.R.G. and I.O.S.; formal analysis, M.R.G.; investigation, A.C. and M.R.G.; data curation, A.C. and I.O.S.; writing—original draft preparation, A.C. and M.R.G.; writing—review and editing, A.C. and M.R.G.; visualization, A.C. and I.O.S.; supervision, A.C. and M.R.G. All authors have read and agreed to the published version of the manuscript.

Funding

This research received no external funding.

Acknowledgments

This research was supported by “Dunărea de Jos” University of Galați, Galați, Romania.

Conflicts of Interest

The authors declare no conflict of interest.

References

  1. Solow, R.M. A contribution to the theory of economic growt. Q. J. Econ. 1956, 70, 65–94. [Google Scholar] [CrossRef]
  2. Solow, R.M. Technical Change and the Aggregate Production Function. Rev. Econ. 1957, 39, 312–320. [Google Scholar] [CrossRef] [Green Version]
  3. Janger, J.; Schubert, T.; Andries, P.; Rammer, C.; Hoskens, M. The EU 2020 Innovation Indicator: A step forward in measuring innovation outputs and outcomes? Res. Policy 2017, 46, 30–42. [Google Scholar] [CrossRef] [Green Version]
  4. Grupp, F.; Schubert, T. Review and new evidence on composite innovation indicators for evaluating national performance. Res. Policy 2010, 39, 67–78. [Google Scholar] [CrossRef]
  5. Dziallas, M.; Blind, K. Innovation indicators throughout the innovation process: An extensive literature analysis. Technovation 2019, 80–81, 3–29. [Google Scholar] [CrossRef]
  6. Coca, A.; Blaga, P. Gaps and Preliminary Perspectives Concerning Innovation Infrastructure in the Carpathian Countries. Acta Amrisiensis Ser. Oeconomica 2020, 3, 21–30. [Google Scholar]
  7. Cornell University; INSEAD; WIPO. The Global Innovation Index 2020: Who Will Finance Innovation? Cornell University: Ithaca, NY, USA, 2020. [Google Scholar]
  8. Food and Agriculture Organization of the United Nations (FAO) Concept Paper: International Year of Mountains, Rome. 2020. Available online: http://www.fao.org/iym/en/aboutiym/iym2002.pdf (accessed on 20 October 2022).
  9. Nordic Centre for Spatial Development. Mountain Areas in Europe: Analysis of Mountain Areas in EU Member States, Acceding and Other European Countries; Nordic Centre for Spatial Development: Perisher Valley, Australia, 2004; pp. 3–4. [Google Scholar]
  10. The Framework Convention on the Protection and Sustainable Development of the Carpathians (Carpathian Convention). Available online: http://www.carpathianconvention.org/the-convention-17.html (accessed on 20 October 2022).
  11. United Nations Division for Sustainable Development, United Nations Conference on Environment & Development Agenda 21, Rio de Janerio. 1992, p. 120. Available online: https://sustainabledevelopment.un.org/content/documents/Agenda21.pdf (accessed on 20 October 2022).
  12. Porter, M.; Sachs, J.; McArthur, J. Executive summary: Competitiveness and stages of economic development. In The Global Competitiveness Report 2001–2002; Porter, M., Sachs, J., Cornelius, P.K., McArthur, J.W., Schwab, K., Eds.; Oxford University Press: New York, NY, USA, 2002; pp. 16–25. [Google Scholar]
  13. Dzidrov, M.; Ceravolo, L.S.; Simeonov, S. From Efficiencyto Innovation-Driven Economy with Stimulation of Innovation. Int. J. Sci. Eng. Res. 2016, 7, 1144–1147. [Google Scholar]
  14. Coca, A.; Gabor, M.R. Optional Quality Term ‘Mountain Product’ among Geographical Indications. How do we Stand in the Carpathian Countries. In Proceedings of the International Conference “Risk in Contemporary Economy”, Galati, Romania, 31 March–1 April 2022; pp. 450–460. [Google Scholar]
  15. Tomislav, K. The concept of sustainable development: From its beginning to the contemporary issues. Zagreb Int. Rev. Econ. Bus. 2018, 21, 67–94. [Google Scholar] [CrossRef] [Green Version]
  16. Manioudis, M.; Meramveliotakis, G.; Meramveliotakis, G. Broad strokes towards a grand theory in the analysis of sustainable development: A return to the classical political economy. New Political Econ. 2022, 25, 866–878. [Google Scholar] [CrossRef]
  17. EUROSTAT. Regional Innovation Scoreboard 2019. Available online: https://research-and-innovation.ec.europa.eu/statistics/performance-indicators/european-innovation-scoreboard_en (accessed on 10 October 2022).
  18. EUROSTAT. Regional Innovation Scoreboard 2021. Available online: https://ec.europa.eu/research-and-innovation/en/statistics/performance-indicators/european-innovation-scoreboard/eis (accessed on 10 October 2022).
  19. Arundel, A. Innovation Survey Indicators: What impact on Innovation Policy? Sci. Technol. 2007, 2007, 49–64. [Google Scholar]
  20. Hasink, R. Regional innovation policies compared, hassink, r conf on european cities: Growth and decline. Urban Stud. 1993, 30, 1009–1024. [Google Scholar] [CrossRef]
  21. Lopes, J.M.; Silveira, P.; Oliveira, J. Analyzing the root of regional innovation performance in the European territory. Int. J. Innov. Sci. 2021, 13, 565–582. [Google Scholar] [CrossRef]
  22. Radosevic, S. (Mis)match between Demand and Supply for Technology: Innovation, R & D and Growth Issues in Countries of Central and Eastern Europe; University College London: London, UK, 2004; Volume 42, pp. 71–81. [Google Scholar]
  23. Borras, S. Policy learning and organizational capacities in innovation policies. Sci. Public Policy 2021, 38, 725–734. [Google Scholar] [CrossRef]
  24. Sandu, S. Convergence of the romanian research, development and innovation within innovation union. Int. Natl. Eur. Values Public Adm. Balk. 2021, 4, 60–67. [Google Scholar]
  25. Gajewski, M. Policies Supporting Innovation in the European Union in The Context of the Lisbon Strategy and the Europe 2020 Strategy. Comp. Econ. Res.-Cent. East. Eur. 2017, 20, 109–127. [Google Scholar] [CrossRef] [Green Version]
  26. Gajdosikova, Z.; Marakova, V. Inovations as a factor of sustainable tourism development in mountain destinations. Int. Colloq. Reg. Sci. 2016, 2016, 1055–1063. [Google Scholar]
  27. Bacoș, I.B.; Gabor, M.R. Consumers’ Preferences of Winter Tourist Packages in Romania: A Quantitative Case Study. Ann. Dunarea De Jos Univ. Galati Fascicle I. Econ. Appl. Inform. 2020, 26, 157–164. [Google Scholar] [CrossRef]
  28. Bacoș, I.B.; Gabor, M.R. Tourism economy. Mountain tourism: Quantitative analysis of winter destinations in Romania. Economics 2021, 9, 55–70. [Google Scholar] [CrossRef]
  29. Perlik, M. Impacts of Social Innovation on Spatiality in Mountain–Lowland Relationships—Trajectories of Two Swiss Regional Initiatives in the Context of New Policy Regimes. Sustainability 2021, 13, 3823. [Google Scholar] [CrossRef]
  30. Liu, Z. The Impact of Government Policy on Macro Dynamic Innovation of the Creative Industries: Studies of the UK’s and China’s Animation Sectors. J. Open Innov. Technol. Mark. Complex. 2021, 7, 168. [Google Scholar] [CrossRef]
  31. Costa, J.; Matias, J.C. Open Innovation 4.0 as an Enhancer of Sustainable Innovation Ecosystems. Sustainability 2020, 12, 8112. [Google Scholar] [CrossRef]
  32. Zarębski, P.; Krupin, V.; Zwęglińska-Gałecka, D. Renewable Energy Generation Gaps in Poland: The Role of Regional Innovation Systems and Knowledge Transfer. Energies 2021, 14, 2935. [Google Scholar] [CrossRef]
  33. Pohulak-Zoledowska, E. Clusters-supporting policies in chosen central and eastern europe countries. Hradecke Ekon. Dny 2009, 12, 163–169. [Google Scholar]
  34. Suurna, M.; Kattel, R. Europeanization of innovation policy in Central and Eastern Europe. Sci. Public Policy 2010, 37, 646–664. [Google Scholar] [CrossRef]
  35. Favre-Bonte, V.; Gardet, E.; Thevenard-Puthod, C. The influence of territory on innovation networks characteristics. An application to mountain tourism. Rev. D Econ. Reg. Et Urbaine 2020, 2, 227–260. [Google Scholar]
  36. Filippini, R.; Marescotti, M.E.; Gaviglio, A. Social Networks as Drivers for Technology Adoption: A Study from a Rural Mountain Area in Italy. Sustainability 2020, 12, 9392. [Google Scholar] [CrossRef]
  37. Acha, V.; Balazs, K. Transitions in thinking: Changing the mindsets of policy makers about innovation. Technovation 1999, 19, 345–353. [Google Scholar] [CrossRef]
  38. Szymanska, E. Pro-innovation policy in the countries of central & eastern europe. In Proceedings of the 10th International Scientific Conference on Economic Policy in the European Union Member Countries, Economic Policy in the European Union Member Countries, Vendryně, Czech Republic, 19–21 September 2012; pp. 291–304. [Google Scholar]
  39. Laznjak, J.; Svarc, J. Policy-making on science in society between Europeanization and core-periphery divide. Innov. Eur. J. Soc. Sci. Res. 2016, 29, 98–112. [Google Scholar] [CrossRef]
  40. Paliokaite, A. An innovation policy framework for upgrading firm absorptive capacities in the context of catching-up economies. J. Entrep. Manag. Innov. 2019, 15, 103–129. [Google Scholar] [CrossRef]
  41. Tonurist, P.; Kattel, R. Can Research, Development, and Innovation Policies Cross Borders? The Case of Nordic-Baltic Region. Sci. Public Policy 2017, 44, 328–340. [Google Scholar]
  42. Roman, M.; Varga, H.; Cvijanovic, V.; Reid, A. Quadruple Helix Models for Sustainable Regional Innovation: Engaging and Facilitating Civil Society Participation. Economies 2020, 8, 48. [Google Scholar] [CrossRef]
  43. Zhang, Y.H.; Chen, S.L.; Wang, S.Y. Technology Innovation and Environmental Mountains: An Empirical Study in China’s Inland River Regions. J. Costal Res. 2020, 2020, 171–176. [Google Scholar] [CrossRef]
  44. Huber, R.; Bugmann, H.; Rigling, A. Sustainable Land-use Practices in European Mountain Regions under Global Change: An Integrated Research Approach. Ecol. Soc. 2013, 18, 3. [Google Scholar] [CrossRef] [Green Version]
  45. Kuscer, K.; Mihalic, T.; Pechlaner, H. Innovation, sustainable tourism and environments in mountain destination development: A comparative analysis of Austria, Slovenia and Switzerland. J. Sustain. Tour. 2017, 25, 489–504. [Google Scholar] [CrossRef]
  46. Zanon, B. Territorial Innovation in the Alps. Heterodox Reterritorialization Processes in Trentino, Italy. Ital. J. Plan. Pract. 2018, 8, 1–37. [Google Scholar]
  47. Gajdosikova, Z.; Gajdosik, T.; Marakova, V. Innovation Process in Mountain Destinations: Does Sustainability Matter? The High Tatras Case Study. Model. Innov. Sustain. Technol. Econ. Policy Perspect. 2018, 2018, 159–175. [Google Scholar]
  48. Gaf-Deac, J.I.; Ciutacu, O.T. Agglomeration Economies in Mountain Areas: Multi-Storeyed Montain Concentration in North-Eastern Romania. In Proceedings of the 4th International Conference on Economic Scientific Research—Theoretical, Empirical and Practical Approaches (ESPERA), Bucharest, Romania, 13–14 November 2014; pp. 413–427. [Google Scholar]
  49. Hipp, C.; Gallego, J.; Rubalcaba, L. ; Rubalcaba, L. Shaping innovation in European knowledge-intensive business services. Serv. Bus. 2015, 9, 41–55. [Google Scholar] [CrossRef]
  50. Deserti, A.; Rizzo, F.; Smallman, M. Experimenting with co-design in STI policy making. Policy Des. Pract. 2020, 3, 135–149. [Google Scholar] [CrossRef]
  51. Heritier, A. Policy-making by subterfuge: Interest accommodation, innovation and substitute democratic legitimation in Europe—Perspectives from distinctive policy areas. J. Public Policy 1997, 4, 171–189. [Google Scholar] [CrossRef]
  52. Koschatzky, K.; Stahlecker, T. A new Challenge for Regional Policy-Making in Europe? Chances and Risks of the Merger Between Cohesion and Innovation Policy. Eur. Plan. Stud. 2010, 18, 7–25. [Google Scholar] [CrossRef]
  53. Achen, C.H. Interpreting and Using Regression; Sage Publications: Newbury Park, CA, 1982. [Google Scholar]
  54. Aguinis, H. Regression Analysis for Categorical Moderators; Guilford Press: New York, NY, USA, 2004. [Google Scholar]
  55. Allison, P.D. Multiple Regression; Pine Forge Press: Thousand Oaks, CA, USA, 1999. [Google Scholar]
  56. Gabor, M.R. Analysis and Inference of Marketing Data; C. H. Beck: Bucharest, Romania, 2016. [Google Scholar]
  57. Petcu, N. Tehnici de Data Mining Rezolvate in SPSPS Clementine; Albastra: Cluj-Napoca, Romania, 2010; p. 81. [Google Scholar]
  58. Gorunescu, F. Data Mining—Concepte, Modele și Tehnici; Albastra: Cluj Napoca, Romania, 2006; p. 142. [Google Scholar]
  59. Rakotomalala, R. Les Methodes d’Induction d’Arbres; Laboratoire ERIC: Lyon, France, 2005. [Google Scholar]
  60. McCormik, K.; Salcedo, J. SPSS Statistics for Data Analysis and Visualization; John Wiley & Sons: Hoboken, NJ, USA, 2017; pp. 355–392. [Google Scholar]
  61. Fernandez, S.G.; Kubus, R.; Perez-Inigo, J.M. Innovation Ecosystems in the EU: Policy Evolution and Horizon Europe Proposal Case Study (the Actors’ Perspective). Sustainability 2019, 11, 4735. [Google Scholar] [CrossRef] [Green Version]
  62. De Araújo Costa, I.P.; Moreira, M.A.L.; de Araújo Costa, A.P.; de Souza de Barros Teixeira, L.F.H.; Gomes, C.F.S.; Dos Santos, M. Strategic Study for Managing the Portfolio of IT Courses Offered by a Corporate Training Company: An Approach in the Light of the ELECTRE-MOr Multicriteria Hybrid Method. Int. J. Inf. Technol. Decis. Mak. 2022, 21, 351–379. [Google Scholar] [CrossRef]
  63. Ley, C.; Martin, R.K.; Pareek, A.; Groll, A.; Seil, R.; Tischer, T. Machine learning and conventional statistics: Making sense of the differences. Knee Surg. Sport Traumatol Arthrosc. 2022, 30, 753–757. [Google Scholar] [CrossRef]
  64. Giannelloni, J.L.; Vernette, E. Etudes de Marche, 2nd ed.; Vuibert: Paris, France, 2003. [Google Scholar]
  65. Malhorta, N. Etudes Marketing avec SPSS, 4th ed.; Pearson Education France: Paris, France, 2004. [Google Scholar]
  66. Lebart, L.; Morineau, A.; Piron, M. Statistique Exploratoire Multidimensionnelle, 2nd ed.; Dunod: Paris, France, 1997. [Google Scholar]
  67. Colibabă, D. Advances Statistical Methods for Market Research; ASE Publishing House: Bucharest, Romania, 2020. [Google Scholar]
  68. d’Astous, A. Le Projet de Recherche en Marketing; Chenelièr Éducation: Montréal, QC, Canada, 2005. [Google Scholar]
  69. Porter, M.; Stern, S. National Innovative Capacity. Available online: https://www.hbs.edu/ris/Publication%20Files/Innov_9211_610334c1-4b37-497d-a51a-ce18bbcfd435.pdf (accessed on 12 November 2020).
  70. Furman, J.L.; Michael, E.; Porter, M.E.; Stern, S. The determinants of national innovative capacity. Res. Policy 2002, 31, 899–933. [Google Scholar] [CrossRef] [Green Version]
  71. Fragkandreas, T. When Innovation Does Not Pay Off: Introducing the “European Regional Paradox”. Eur. Plan. Stud. 2013, 21, 2078–2086. [Google Scholar] [CrossRef]
  72. Ludvig, A.; Sarkki, S.; Zivojinovic, I. Policy impacts on social innovation in forestry and back: Institutional change as a driver and outcome. For. Policy Econ. 2021, 122, 102335. [Google Scholar] [CrossRef]
  73. Bogers, M.; Chesbrough, H.; Moedas, C. Open Innovation: Research, Practices, and Policies. Calif. Manag. Rev. 2018, 60, 5–16. [Google Scholar] [CrossRef]
  74. Mann, C.; Loft, L.; Hernandez-Morcillo, M. Assessing forest governance innovations in Europe: Needs, challenges and ways forward for sustainable forest ecosystem service provision. Ecosyst. Serv. 2021, 52, 101384. [Google Scholar] [CrossRef]
  75. Kafouros, M.I.; Wang, C. The Role of Time in Assessing the Economic Effects of R&D. Innov. Ind. 2008, 15, 233–251. [Google Scholar]
  76. Edquist, C.; Zabala-Iturriagagoitia, J.M.; Barbero, J.; Zofio, J.L. On the meaning of innovation performance: Is the synthetic indicator of the Innovation Union Scoreboard flawled? Res. Eval. 2018, 27, 196–211. [Google Scholar] [CrossRef] [Green Version]
  77. Todtling, F.; Trippl, M.M. One size fits all? Towards a differentiated regional innovation policy approach. Res. Policy 2005, 34, 1203–1219. [Google Scholar]
  78. Mejlgaard, N.; Woolley, R.; Wuketich, M. A key moment for European science policy. JCOM-J. Sci. Commun. 2018, 17, 70539. [Google Scholar] [CrossRef] [Green Version]
  79. Remotti, L.A. IoT innovation clusters in Europe and the case for public policy. Data Policy 2021, 3, e25. [Google Scholar] [CrossRef]
Figure 1. Theoretical background, the research hypothesis, and inputs used in the research [6,22,23,24,25,30,33,34,37,38,39,40,41,45]. (Source: authors conception).
Mathematics 11 01558 g001
Figure 2. Innovation index (base year 2014). (Source: made by the authors based on EUROSTAT reports).
Mathematics 11 01558 g002
Figure 3. The box plots for the innovation index and country. (Notes: The symbols * and ° are for outliers).
Mathematics 11 01558 g003
Figure 4. The box plots for the innovation index and performance group.
Mathematics 11 01558 g004
Figure 5. Distribution of the NUTS2 regions on the performance groups.
Mathematics 11 01558 g005
Figure 6. The normal P-P plots of regression standardized residual. (a) Alps. (b) Carpathians.
Mathematics 11 01558 g006
Figure 7. (a) The distribution according to R&D expenditure public sector and PCT patent applications; (b) the distribution according to R&D expenditure public sector and Employment MHT manufacturing and knowledge-intensive services; (c) the distribution according to PCT patent applications and Employment MHT manufacturing and knowledge-intensive services.
Mathematics 11 01558 g007aMathematics 11 01558 g007b
Figure 8. Decision tree for performance group. (a)—No validation. (b)—Training sample. (c)—Test sample.
Mathematics 11 01558 g008
Figure 9. The normalized importance for decision tree by mountain regions. (a) Alps regions. (b) Carpathians regions.
Mathematics 11 01558 g009aMathematics 11 01558 g009b
Table 1. The NUTS 2 regions grouped by country and mountain area included in the present study.
Alps Mountain Area
ItalyAustriaSloveniaSwitzerlandGermanyFrance
ITC1 Piemonte, ITC2 Valle d’Aosta/Vallée d’Aoste, ITC3 Liguria, ITC4 Lombardia, ITH1 Provincia Autonom Bolzano/Bozen, ITH2 Provincia Autonoma Trento, ITH3 Veneto
ITH4 Friuli-Venezia Giulia
AT1 Ostösterreich, AT2 Südösterreich, AT3 WestösterreichSI03 Vzhodna Slovenija
SI04 Zahodna Slovenija
CH01 Région lémanique, CH02 Espace Mittelland
CH03Nordwestschweiz
CH04 Zürich
CH05 Ostschweiz
CH06 Zentralschweiz
CH07 Ticino
DE13 Freiburg
DE14 Tübingen
DE21 Oberbayern
DE27 Schwaben
FRC Bourgogne—Franche-Comté
FRK Auvergne—Rhône-Alpes
FRL Provence-Alpes-Côte d’Azur
Carpathian’s Mountain area
Czech RepublicHungaryPolandRomaniaSlovakiaSerbia
CZ06 Jihovýchod
CZ07 Strední Morava
CZ08 Moravskoslezsko
HU11 Budapest, HU12 Pest, HU21 Közép-Dunántúl, HU22 Nyugat-Dunántúl, HU31 CÉszak-Magyarország, HU32 Észak-Alföld, HU33 Dél-AlföldPL21 Malopolskie
PL22 Slaskie
PL82 Podkarpackie
RO11 Nord-Vest, RO12 Centru, RO21 Nord-Est
RO22 Sud-Est, RO31 Sud—Muntenia, RO32 Bucuresti—Ilfov, RO41 Sud-Vest Oltenia, RO42 Vest
SK01 Bratislavský kraj, SK02 Západné Slovensko, SK03 Stredné Slovensko, SK04Východné SlovenskoRS11 Belgrade
RS12 Vojvodina
RS21 Šumadija and Western Serbia
RS22 Southern and Eastern Serbia
Table 2. Resume of research hypothesis, theoretical background, and statistical methods.
Research HypothesisTheoretical BackgroundStatistical Methods Applied
H1: There are significant differences between performance groups of the Alps and Carpathians directly linked to policy and public spending.[22,30,38,40]
  • Descriptive statistics
  • Box plots
  • Chi-square bivariate test
H2: There are significant differences among RIS indicators for the Alps and Carpathians mountains regions.[6,24,39]
  • Descriptive statistics
  • Independent Student’s t test
H3: The Alps and Carpathians have different predictors for performance groups of innovation.[23,25,33,45]
  • Descriptive statistics
  • Multilinear regression with collinearity diagnosis with performance groups as dependent variables
  • Decision tree with CRT growing method
H4: There are significant differences inside each mountain area (Alps, Carpathians) based on the geographical position of NUTS2 regions (West-East).[22,33,34,37,38,40,41,45]
  • One-way ANOVA with Bonferroni post hoc multiple comparisons
Table 3. Descriptive statistics of the research data according to mountain area and year.
Innovation IndicatorAlps Mountain AreaCarpathians Mountain Area
2019202120192021
Population with tertiary education0.459 ± 0.193 (0.169–0.903)0.598 ± 0.229 (0.232–1.000)0.313 ± 0.205 (0.027–0.842)0.391 ± 0.271 (0.044–1.000)
Lifelong learning0.487 ± 0.279 (0.176–1.000)0.579 ± 0.281 (0.216–1.000)0.114 ± 0.092 (0.000–0.321)0.158 ± 0.099 (0.022–0.376)
Scientific co-publications0.631 ± 0.215 (0.266–1.000)0.710 ± 0.208 (0.312–1.000)0.325 ± 0.167 (0.062–0.827)0.384 ± 0.194 (0.090–0.911)
Most-cited publications0.563 ± 0.117 (0.340–0.842)0.613 ± 0.138 (0.395–0.968)0.242 ± 0.072 (0.146–0.467)0.242 ± 0.067 (0.032–0.356)
R&D expenditure public sector0.553 ± 0.189 (0.156–0.788)0.479 ± 0.232 (0.055–0.801)0.319 ± 0.153 (0.078–0.648)0.211 ± 0.178 (0.007–0.643)
R&D expenditure business sector0.671 ± 0.190 (0.316–1.000)0.609 ± 0.257 (0.118–1.000)0.321 ± 0.184 (0.009–0.665)0.207 ± 0.171 (0.000–0.721)
Non-R&D innovation expenditures0.570 ± 0.122 (0.374–0.764)0.313 ± 0.225 (0.000–0.757)0.518 ± 0.250 (0.064–0.954)0.403 ± 0.292 (0.000–1.000)
Product or process innovators0.590 ± 0.119 (0.340–0.880)0.740 ± 0.119 (0.564–0.998)0.256 ± 0.168 (0.022–0.543)0.367 ± 0.249 (0.025–1.000)
Marketing or organizational innovators (2019)/Business process innovators (2021)0.616 ± 0.158 (0.296–0.971)0.847 ± 0.165 (0.492–1.000)0.225 ± 0.139 (0.000–0.494)0.246 ± 0.248 (0.000–0.755)
Innovative SMEs collaborating with others0.330 ± 0.198 (0.099–0.856)0.571 ± 0.177 (0.163–0.846)0.192 ± 0.128 (0.012–0.459)0.297 ± 0.184 (0.019–0.762)
Public–private co-publications0.505 ± 0.252 (0.000–1.000)0.704 ± 0.207 (0.372–1.000)0.170 ± 0.148 (0.000–0.525)0.327 ± 0.164 (0.108–0.801)
PCT patent applications0.505 ± 0.182 (0.195–0.821)0.698 ± 0.202 (0.354–1.000)0.125 ± 0.069 (0.044–0.288)0.243 ± 0.091 (0.094–0.415)
Trademark applications0.534 ± 0.222 (0.156–1.000)0.570 ± 0.219 (0.174–1.000)0.172 ± 0.105 (0.043–0.445)0.177 ± 0.105 (0.047–0.416)
Design applications0.524 ± 0.190 (0.171–1.000)0.641 ± 0.225 (0.268–1.000)0.265 ± 0.194 (0.024–0.635)0.312 ± 0.183 (0.000–0.817)
Employment MHT manufacturing and knowledge-intensive services0.576 ± 0.152 (0.231–0.902)0.677 ± 0.217 (0.093–1.000)0.495 ± 0.240 (0.064–0.938)0.595 ± 0.267 (0.032–1.000)
Sales of new-to-market and new-to-firm innovations0.591 ± 0.130 (0.303–0.913)0.517 ± 0.334 (0.000–0.925)0.350 ± 0.174 (0.082–0.771)0.468 ± 0.144 (0.242–0.782)
(Source: made by the authors based on Regional Innovation Scoreboard reports for 2019 and 2021 [14,15]. Note: The normalized scores by indicators for each year were used).
Table 4. The results of chi-square test.
ValuedfAsymptotic Significance (2-Sided)
Pearson Chi-Square76.930 180.000
Likelihood Ratio102.026180.000
N of Valid Cases112
Table 5. The results of the Student’s t test grouping by mountain region.
Levene’s Test for Equality of Variancest-Test for Equality of Means
FSig.tdfSig. (2-tailed)Mean DifferenceStd. Error Difference95% Confidence Interval of the Difference
LowerUpper
Population with tertiary educationEVA0.1780.6744.0211100.0000.1763300.0438540.0894220.263238
EVNA 4.033109.9800.0000.1763300.0437190.0896890.262971
Lifelong learningEVA72.3650.00010.0931100.0000.3963680.0392720.3185420.474195
EVNA 9.81164.7580.0000.3963680.0404000.3156790.477058
Scientific co-publicationsEVA3.2860.0738.4621100.0000.3159410.0373370.2419480.389935
EVNA 8.414104.5190.0000.3159410.0375500.2414820.390400
Most-cited publicationsEVA15.7350.00017.9071100.0000.3462310.0193350.3079140.384547
EVNA 17.55379.7540.0000.3462310.0197250.3069740.385487
R&D expenditure public sectorEVA4.4680.0376.8461100.0000.2508050.0366370.1782000.323411
EVNA 6.796102.3160.0000.2508050.0369070.1776040.324007
R&D expenditure business sectorEVA2.8280.0959.6581100.0000.3754390.0388730.2984020.452476
EVNA 9.590102.6590.0000.3754390.0391500.2977920.453087
Non-R&D innovation expendituresEVA2.8090.097−0.7641030.446−0.0382550.050041−0.1374990.060989
EVNA −0.780102.9750.437−0.0382550.049023−0.1354810.058971
Product or process innovatorsEVA6.2520.01410.1421100.0000.3537840.0348820.2846560.422912
EVNA 10.29598.0630.0000.3537840.0343640.2855900.421978
Marketing or organizational innovatorsEVA0.4560.50113.1901100.0000.4963520.0376310.4217760.570929
EVNA 13.193109.5360.0000.4963520.0376220.4217920.570913
Innovative SMEs collaborating with othersEVA8.4680.0045.5881100.0000.2060010.0368660.1329420.279060
EVNA 5.53197.7520.0000.2060010.0372460.1320850.279917
Public–private co-publicationsEVA7.3390.0088.8131100.0000.3562100.0404190.2761100.436310
EVNA 8.70493.9290.0000.3562100.0409260.2749500.437470
PCT patent applicationsEVA29.4070.00012.8571060.0000.4135560.0321660.3497830.477329
EVNA 12.85775.2250.0000.4135560.0321660.3494800.477631
Trademark applicationsEVA23.2740.00011.7721100.0000.3776800.0320820.3141010.441259
EVNA 11.50674.3930.0000.3776800.0328240.3122830.443077
Design applicationsEVA1.2150.2737.7191100.0000.2942020.0381120.2186730.369732
EVNA 7.683105.7440.0000.2942020.0382900.2182860.370119
Employment MHT manufacturing and knowledge-intensive servicesEVA7.3630.0081.8911090.0610.0821650.043454−0.0039590.168289
EVNA 1.915105.2000.0580.0821650.042908−0.0029120.167242
Sales of new-to-market and new-to-firm innovationsEVA3.7720.0553.5861100.0010.1452430.0405000.0649820.225504
EVNA 3.53791.4220.0010.1452430.0410640.0636790.226808
Innovation index (base year 2014)-%EVA2.6590.10614.5441100.00069.6394.78860.15079.128
EVNA 14.488106.5540.00069.6394.80760.10979.168
(Note: EVA = Equal variances assumed, EVNA = Equal variances not assumed).
Table 6. Models Summary.
ModelsModelRR SquareAdjusted R SquareStd. Error of the Estimate
Alps10.956 b0.9130.8780.311
Carpathians20.893 b0.7980.7390.480
b Dependent Variable: Performance group.
Table 7. The ANOVA results for the regression models.
ModelsSum of SquaresdfMean SquareFSig.
Alps1Regression32.551132.50425.8360.000 b
Residual3.101320.097
Total35.65245
Carpathians2Regression37.379123.11513.5080.000 b
Residual9.454410.231
Total46.83353
b Dependent Variable: Performance group.
Table 8. The regression coefficients for Model 1—the Alps.
The Independent Variables for Model 1—Alps bUnstandardized CoefficientsStandardized CoefficientstSig.95.0% Confidence Interval for BCollinearity Statistics
B (βi)Std. ErrorBetaLower BoundUpper BoundToleranceVIF
β0-(Constant) β00.5890.405 1.4530.156−0.2371.414
x1 Scientific co-publications−1.0780.475−0.242−2.2690.030−2.045−0.1100.2384.200
x2 Most-cited publications1.6590.6510.2342.5500.0160.3342.9850.3223.101
x3 R&D expenditure public sector2.0790.4280.5064.8610.0001.2082.9510.2513.979
x4 R&D expenditure business sector−0.4320.423−0.112−1.0220.315−1.2940.4290.2274.399
x5 Non-R&D innovation expenditures1.7010.3750.4374.5320.0000.9362.4650.2923.426
x6 Product or process innovators0.3820.5940.0580.6420.525−0.8281.5910.3293.041
x7 Marketing or organizational innovators (2019)/Business process innovators (2021)0.4420.4470.0980.9870.331−0.4701.3530.2773.611
x8 Innovative SMEs collaborating with others0.1110.2870.0280.3880.700−0.4730.6960.5191.927
x9 PCT patent applications1.5770.4090.3963.8590.0010.7452.4100.2583.882
x10 Trademark applications0.5800.3830.1341.5150.140−0.2001.3600.3462.893
x11 Design applications−0.0150.388−0.004−0.0380.970−0.8050.7760.3103.228
x12 Employment MHT manufacturing and knowledge-intensive services0.8790.3480.2032.5270.0170.1701.5880.4232.366
x13 Sales of new-to-market and new-to-firm innovations−1.5600.330−0.460−4.7250.000−2.232−0.8870.2863.493
b Dependent Variable: Performance group.
Table 9. The regression coefficients for Model 1—the Carpathians.
The Independent Variables for Model 2—Carpathians bUnstandardized CoefficientsStandardized CoefficientstSig.95.0% Confidence Interval for BCollinearity Statistics
BStd. ErrorBetaLower BoundUpper BoundToleranceVIF
β0 (Constant)1.3680.317 4.3150.0000.7272.008
x1 Most-cited publications−1.2991.167−0.097−1.1130.272−3.6561.0580.6511.537
x2 R&D expenditure public sector2.3310.7410.4193.1430.0030.8333.8280.2773.611
x3 R&D expenditure business sector2.0020.6660.3993.0040.0050.6563.3480.2793.586
x4 Non-R&D innovation expenditures0.6220.3820.1831.6280.111−0.1491.3930.3912.557
x5 Marketing or organizational innovators (2019)/Business process innovators (2021)0.6500.7130.1370.9120.367−0.7892.0890.2184.581
x6 PCT patent applications−4.4711.122−0.477−3.9850.000−6.737−2.2050.3432.912
x7 Trademark applications2.1151.4580.2311.4510.155−0.8305.0600.1945.151
x8 Design applications0.1910.5650.0370.3380.737−0.9501.3320.4062.461
x9 Employment MHT manufacturing and knowledge-intensive services0.6200.3640.1671.7050.096−0.1141.3550.5161.937
x10 Sales of new-to-market and new-to-firm innovations−0.5630.586−0.103−0.9620.342−1.7450.6190.4302.328
x11 Population with tertiary education−1.1770.556−0.308−2.1160.040−2.300−0.0530.2324.306
x12 Lifelong learning1.0541.3840.1130.7610.451−1.7423.8490.2254.441
b Dependent Variable: Performance group.
Table 10. Results of one-way ANOVA with Bonferroni post hoc multiple comparisons by country.
Innovation IndicatorAlps RegionsCarpathians Regions
1-M1A/2-M2CR&D expenditure public sectorItaly—Austria, Italy—Switzerland, Italy—Germany, Slovenia—SwitzerlandCzech Republic—Romania
2-M1ASales of new-to-market and new-to-firm innovationsItaly—Switzerland,
Austria—Switzerland,
Germany—Switzerland
3-M1ANon-R&D innovation expendituresSwitzerland differs from all the countries (Austria, Italy, Germany, Slovenia, and France)
4-M1A/1-M2CPCT patent applicationsSwitzerland differs from all the countries (Austria, Italy, Germany, Slovenia, and France)Czech Republic—Romania,
Hungary—Romania
5-M1AScientific co-publicationsNo differences between countries
6-M1AMost-cited publicationsSwitzerland differs from all the countries (Austria, Italy, Germany, Slovenia, and France)
7-M1A/5-M2CEmployment MHT manufacturing and knowledge-intensive servicesItaly—Germany, Austria—Germany, France—Germany, Switzerland—FranceCzech Republic—Serbia (0.063), Hungary—Serbia (0.073), Slovakia—Serbia (0.054)
3—M2CR&D expenditure business sector Czech Republic—Romania, Czech Republic—Slovakia, Czech Republic- Serbia, Hungary—Romania, Hungary—Serbia, Poland—Romania, Poland—Serbia
4-M2CPopulation with tertiary educationHungary—Poland, Romania—Poland, Romania—Slovakia
(Note: M1A = regression model 1 for Alps, M2C = regression model 2 for Carpathians).
Disclaimer/Publisher’s Note: The statements, opinions and data contained in all publications are solely those of the individual author(s) and contributor(s) and not of MDPI and/or the editor(s). MDPI and/or the editor(s) disclaim responsibility for any injury to people or property resulting from any ideas, methods, instructions or products referred to in the content.

