Article

Structural Analysis of Projected Networks of Shareholders and Stocks Based on the Data of Large Shareholders’ Shareholding in China’s Stocks

College of Science, Beijing Forestry University, Beijing 100083, China
*
Author to whom correspondence should be addressed.
Mathematics 2023, 11(6), 1545; https://doi.org/10.3390/math11061545
Submission received: 26 February 2023 / Revised: 17 March 2023 / Accepted: 20 March 2023 / Published: 22 March 2023
(This article belongs to the Special Issue Complex Network Modeling: Theory and Applications)

Abstract

:
This paper establishes a shareholder-stock bipartite network based on the data of large shareholders’ shareholding in the Shanghai A-share market of China in 2021. Based on the shareholder-stock bipartite network, the statistically validated network model is applied to establish a shareholder projected network and a stock projected network, whose structural characteristics can intuitively reveal the overlapping portfolios among different shareholders, as well as shareholder allocation structures among different stocks. The degree of nodes in the shareholder projected network obeys the power law distribution, the network aggregation coefficient is large, while the degree of most nodes in the stock projected network is small and the network aggregation coefficient is low. Furthermore, the two projected networks’ community structures are analyzed, respectively. Most of the communities in the shareholder projected network and stock projected network are small-scaled, indicating that the majority of large shareholders hold different shares from each other, and the investment portfolios of large shareholders in different stocks are also significantly different. Finally, by comparing the stock projected sub-network obtained from the shareholder-stock bipartite sub-network in which the degree of shareholder nodes is 2 and the original stock projected network, the effectiveness of the statistically validated network model, and the community division method on the research of the shareholder-stock bipartite network are further verified. These results have important implications for understanding the investment behavior of large shareholders in the stock market and contribute to developing investment strategies and risk management practices.

1. Introduction

The financial system plays an increasingly important role in the national economy. As an important part of the financial system, the stock market has become a medium for enterprises to finance and provide capital income for investors. The stock market is a barometer of the development trend of the national economy. Once the stock market has a large abnormal phenomenon, the national real economy will inevitably be seriously affected. Therefore, it is particularly important to study the correlation between various stocks in the stock market and the structural characteristics of stock investors.
The stock market is essentially a complex system, which consists of a large number of stocks and their investors in the market. In recent years, the research on the stock market based on the complex network theory has made a lot of progress, but it mainly focuses on the linkage analysis of some important stock markets or the exploration of the interaction between the prices of stocks in a stock market. For example, a stock represents a network node, the connection between nodes represents the correlation between stock price fluctuations, and the connection weight represents the specific value of correlation. Thus, a stock-associated network can be established, and the basic topological properties and clustering structure of the stock-associated network can be studied [1,2,3,4]. In addition to using stock prices to analyze the stock market, shareholders are also a very important part of the stock market. The analysis and exploration of shareholders’ investment portfolios are conducive to a better understanding of the stock market, which may affect corporate governance and the quality of decision-making. Therefore, in this paper, we will use the complex network theory to establish a shareholder-stock network to study the investment relationship of shareholders in the stock market.
Unlike the stock-associated network which only contains stock nodes, the shareholder-stock network is composed of two different types of nodes: shareholder nodes and stock nodes, which are connected by the investment relationship between shareholders and stocks. Shareholder-stock network is a typical, and also very important bipartite network in complex networks. A bipartite network is composed of two types of nodes, and the connected edges only exist between different types of nodes. In addition to the shareholder-stock bipartite network, many networks are also bipartite networks, such as the author-thesis network [5], actor-film network [6], company-asset network [7,8], etc.
For the research on the nature of the shareholder-stock bipartite network, in addition to starting from the structure of the network itself, this paper will focus on obtaining the projected network of the same type of nodes according to the connection relationship of the bipartite network [9]. The projected network is a network composed of only the same type of nodes in the bipartite network, and the connection between nodes is based on the overlap of their connection with another type of node in the original bipartite network. The simplest way to establish a projected network is to connect two nodes of the same type when they have at least one common neighbor node. However, this method has certain limitations which will not only make the number of edges in the projected network excessive in the process of projection but also cause the loss of some information in the original bipartite network [9]. Therefore, in this paper, we refer to the statistically validated network model proposed by Michele Tumminello [9] to establish shareholder projected network and stock projected network, respectively. Specifically, we perform a statistical test on each connection in the projected network to verify whether the given link is consistent with the null hypothesis of a random connection between the nodes corresponding to the shareholder-stock bipartite network to obtain the projected network. The projected network obtained by this method retains the structural information of the original shareholder-stock bipartite network to a large extent.
After obtaining the shareholder projected network and stock projected network, we will analyze their network structure, including the average degree, clustering coefficient, and average path of the network [10]. Exploring the topological properties of projected networks based on the shareholder-stock network will help us to study the specific functions of the stock market. It has been found that many networks will form a local aggregation characteristic due to the non-uniformity of connecting edges [11,12]. The network can be divided into different sub-networks, each of which has a relatively close internal connection, and the connection between the relative sub-networks is relatively sparse. This ubiquitous network structure feature is called community or community structure, and accordingly, each sub-network is called a community. A community is usually composed of network nodes with similar functions or properties, and its essence is the regional coupling of social interaction between network nodes. For example, in the social network, the community structure based on individual characteristics makes human society have significant group differences [11]; in the World Wide Web, web communities formed by the close association of hyperlinks have similar discussion topics [13]. Therefore, the research on community structure helps to analyze the modules, functions, and properties of shareholder projected network and stock projected network, to better understand the investment characteristics of the stock market [14]. At present, research methods based on community structure have been widely applied to social networks, biological networks, financial networks, and networks in many other fields [15,16,17,18].
There are many methods to divide the community structure of complex networks. For example, according to the community formation process, there is the hierarchical clustering method, search method, and other methods. According to the physical properties of the division method, there is the network topology-based method, network dynamics-based method, and other methods. In 2003, Newman first proposed the concept of modularity, also known as Q-value, which can be applied to quantify and judge the quality of community division of a complex network [19]. A relatively good partition should satisfy that the nodes in the same community have a high degree of similarity, and the nodes in different communities have a low degree of similarity. The modular community division method is a mainstream community division method at present, which provides a specific objective function for community structure research [20,21,22,23,24,25]. Among many algorithms based on modularity, the Louvain algorithm [26] proposed by Vincent D. Blondel et al. is one of the most widely used algorithms, because it has the advantages of being fast and accurate, and is also applicable to large-scale networks. Therefore, this paper will use the Louvain algorithm to divide the community structure of the shareholder projected network and stock projected network.
In this paper, a shareholder-stock bipartite network will be established based on the data of all stocks in the Shanghai A-stock market and the top ten shareholders holding these stocks in 2021. Then, the statistically validated network model will be used to establish the corresponding shareholder projected network and stock projected network. The basic topological properties of the two projected networks are further explored. The results show that the clustering coefficient of the shareholder projected network is large, and the degree of the nodes is a power-law distribution, meeting the characteristics of scale-free networks and small-world networks. The average degree and clustering coefficient of the stock projected network are both small. The degree of most nodes in the stock projected network is also small, and the occurrence with the highest frequency is the node with a degree of 2.
Subsequently, the Louvain algorithm will be used to analyze the community structure of the shareholder projected network and stock projected network, respectively. Combined with the fact that the ranking of PageRank (PR) value of all nodes in the largest community sub-network is highly consistent with their ranking in the original network, we test the effectiveness of the community division method. In addition, we divide all communities into large-scale communities and small-scale communities according to whether the number of nodes in the community accounts for more than 1 % . Then, the specific number and scale of large and small communities in the division results are studied in depth, reflecting the essential characteristics of major shareholders’ shareholding. Finally, the stock projected sub-network obtained from the bipartite sub-network with 2 degrees of shareholders in the original shareholder-stock bipartite network is analyzed separately and compared with the original stock projected network. It was found that the two networks have strong structural similarities, thus further demonstrating the effectiveness of the statistically validated network model in the study of the shareholder-stock bipartite network problem.
The paper is organized as follows. In Section 2, we discuss the concept of a statistically validated network model, the basic topological properties of the network, and the community division algorithm. In Section 3, we specifically present the establishment process of the shareholder projected network and stock projected network and the results of a simple structural analysis of the two networks. In Section 4, we present the results of the community division of two projected networks and conduct in-depth research on the division results. Finally, we draw some conclusions.

2. Models and Methods

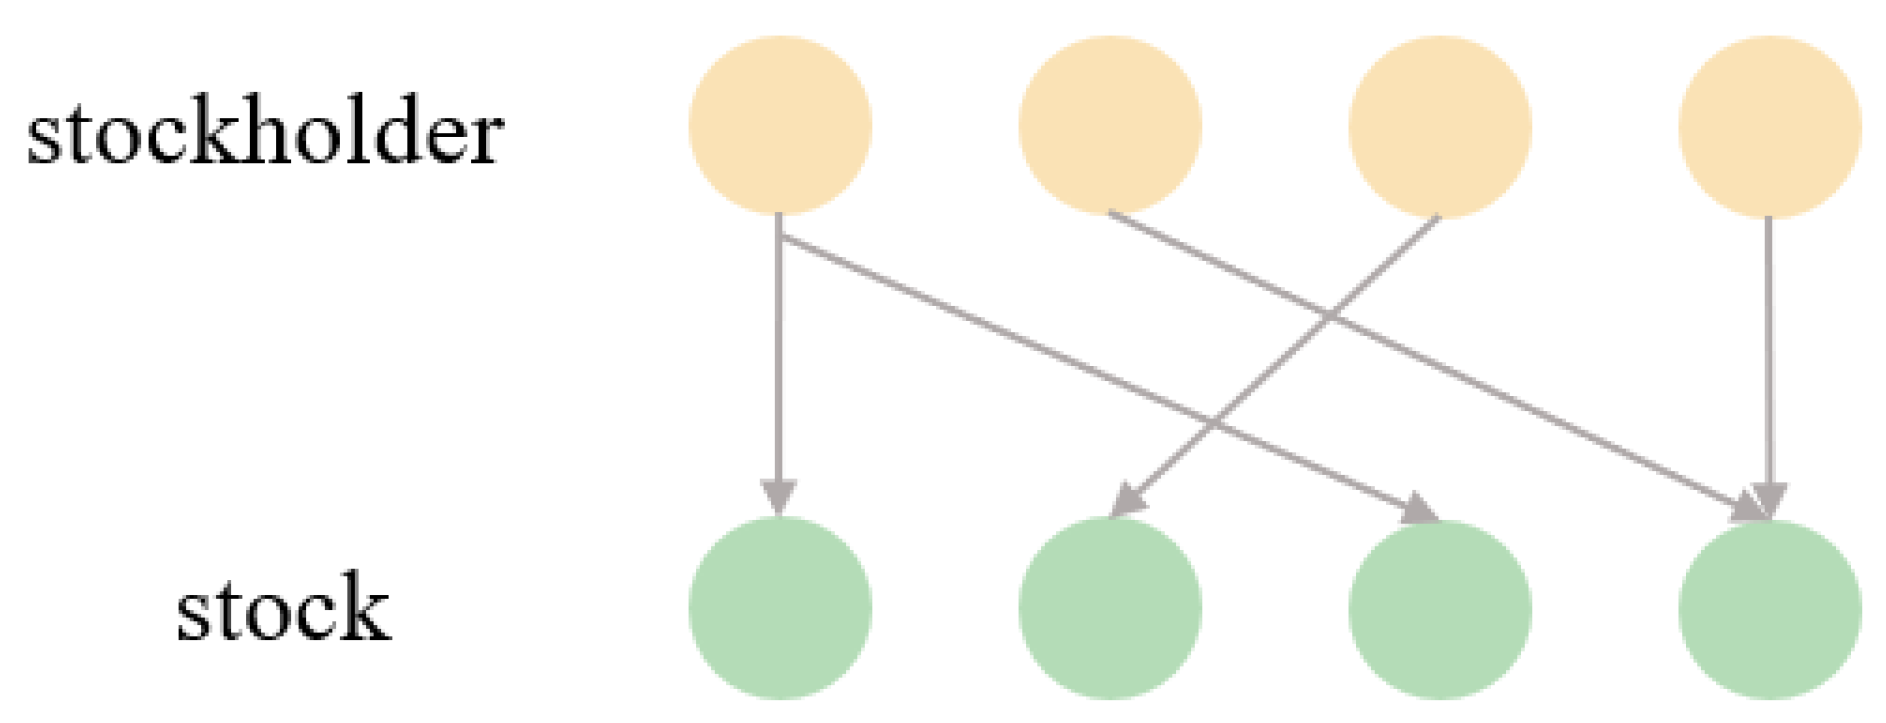
2.1. Shareholder-Stock Bipartite Network

A complex network can be regarded as a set of non-empty finite point V and bipartite relations E, where E is the edge set formed by the specific relations between nodes in V. For the shareholder-stock bipartite network, shareholder nodes and stock nodes, having different natures, can be regarded as two groups of different types. The connection between these two groups of different types of nodes represents the shareholding relationship of shareholders. As shown in Figure 1, if a shareholder holds a stock, an edge is created between the shareholder node and the stock node. There is no direct connection between the stock nodes and no direct connection between the shareholder nodes as well.
For a shareholder-stock bipartite network containing n shareholders and m stocks, we establish an investment matrix E = e i j , where 1 i n , 1 j m . If the shareholder node i holds stocks j, then e i j = 1 . On the contrary, e i j = 0 . That is, the shareholder-stock bipartite network is a 0-1 network, and the elements in the investment matrix E is either 0 or 1.

2.2. Statistical Validated Network Models

After obtaining the shareholder-stock bipartite network, we establish the connection between shareholders through some common characteristics of shareholders’ investment in stocks, so as to obtain a shareholder projected network. Similarly, we also establish the connection between stocks according to this characteristic statistically validated network model method. The process of a simple method to derive a projected network is displayed in Figure 2. In the figure, if two shareholder nodes connect to at least one same stock node in the shareholder-stock bipartite network, the two shareholder nodes will be connected in the shareholder projected network. However, this method is too simple and will cause a serious loss of information in the original bipartite network [9]. Therefore, we will refer to Michele Tumminello et al. [9] and introduce the method of a statistically validated network model to establish the projected network. Specifically, to obtain the projected network, a statistical test on each connection in the projected network is performed to verify whether the given link is consistent with the null hypothesis of a random connection between the nodes corresponding to the shareholder-stock bipartite network. The projected network obtained in this way retains the structural information of the original shareholder-stock bipartite network to a large extent.
First of all, we record the two different types of node sets in the bipartite network as set A and set B, where set A represents the node of projection and set B represents another type of node set. Take the shareholder-stock bipartite network to establish the shareholder projected network as an example. Set A represents the shareholder set and set B represents the stock set. Then, set B is divided into different subsets according to the degree of each node in set B, and the number of nodes in the subset is recorded as N B . Then, according to the connection relationship of the shareholder-stock bipartite network, the nodes in set A connecting different subsets of B are split to obtain the bipartite network divided according to the degree of set A. Through the analysis of sub-networks, the hypergeometric distribution is as follows:
H ( x | N B , k i , k j ) = k i x N B k i k j x N B k j
(where k i and k j are the degrees of nodes i and j in the sub-network), we can obtain the probability that each node pair in set A has x common neighbors. Based on this probability, we can perform statistical tests on node i and node j, and define the following P i j
P i j = 1 x = 0 k i j 1 H ( x | N B , k i , k j )
where k i j represents the number of neighbors that node i and node j have. The P i j value can be applied to determine whether there is a connection for statistical verification between a pair of nodes. Then, statistical tests are performed on all node pairs of set A in the bipartite network, and a statistical threshold is set to be S = 0.01 / N t to perform Bonferroni [27] correction, where N t = N A ( N A 1 ) / 2 , N A is the number of nodes of set A in the bipartite network. If P i j S , there is an edge connection between the node pairs; otherwise, there is no edge connection.
Bonferroni correction reduces the number of false positives to the minimum, but the test is too strict, resulting in a significant increase in the number of false negatives, which cannot ensure sufficient accuracy [27]. Especially when the number of nodes in set A is large or the edge overlap of set A and B in the bipartite network is low, Bonferroni correction will lead to too few links in the mapping network. Therefore, we use FDR [28] to correct all the calculated P values in the bipartite network. First, we arrange the P values in ascending order ( P 1 < P 2 < < P K < < P N t ) . The FDR correction method is used to find the maximum t m a x , starting from the maximum P value, controlling the inequality P i j t m a x S . FDR correction controls the false/true positive ratio to a certain range, which can better reduce the error rate. In this study, we used both Bonferroni correction and FDR correction.

2.3. Basic Topological Properties of Network

The network topology determines its function and affects its dynamic behavior. The basic topology of the network includes the average degree, aggregation coefficient, the degree distribution of nodes, etc. These statistics have different definitions and calculation methods according to the characteristics of network edge attributes (direction, weight). The real network topology is generally small world and scale-free [10]. Analyzing the topological properties of complex networks in the context of the stock market is helpful to study the functions of the network. We will calculate the average degree and aggregation coefficient of the shareholder projected network and stock projected network.

2.3.1. Average Degree

In an undirected network, we take k i to represent the degree of node i, that is, the number of edges directly connected by node i. The average degree of all nodes in the network is called the average degree of the network which is represented by < k > . The calculation formula of < k > is given as follows:
< k > = 2 M N
where N represents the number of nodes in the network and M represents the number of edges in the network.

2.3.2. Clustering Coefficient

The clustering coefficient is used to quantitatively describe the probability that the neighbors of a node are also neighbors of each other, whose calculation formula is given as follows:
C i = E i 1 2 k i ( k i 1 ) = 2 E i k i ( k i 1 ) = j k , k i , i j a i j a j k a k i k i ( k i 1 )
where E i represents the actual number of edges between k i neighbor nodes of node i. a i j indicates whether there is a connection between node i and node j. If there is a connection between the two nodes, a i j = 1 , otherwise a i j = 0 . The clustering coefficient C of a network is defined as the average of the clustering coefficients of all nodes in the network.
C = 1 N i = 1 N C i
Obviously 0 C 1 . The clustering coefficient of a network reflects the overall tightness of the network.

2.4. Community Division and Louvain Algorithm

A quantity called modularity was proposed by Newman et al. (2003) to measure the quality of community structure [20]. Modularity is calculated by the ratio of the edges in the community to all edges in the network, minus its expected value [29] when the degree of all nodes in the network is constant and all the connections are randomly generated. The calculation formula is as follows:
Q = 1 2 M i j [ e i j w i w j 2 M ] δ ( c i , c j )
where M is the number of network edges, and it is the sum of the weights of all connected edges in a weighted network; e i j is the element in the network connection matrix. If nodes i and j are connected, e i j = 1 , otherwise e i j = 0 . It represents the weight of the edges between nodes i and nodes j in a weighted network; w i is the degree of node i; c i represents a community containing node i; Function δ ( c i , c j ) indicates whether node i and node j belong to the same community. If you are in the same community δ = 1 . On the contrary, δ = 1 . Modularity describes a kind of “expectation”. If the sum of the weights of the internal edges of the community is higher than its expected value in the corresponding random network, the value of Q will be large and the effect of community division is also good.
The Louvain algorithm is a community division algorithm based on modularity. The basic idea is to traverse all neighborhood community tags for nodes in the network, and select community tags that maximize the modular increment. After maximizing the modularity, each community is regarded as a new node and repeated the process until the modularity is no longer increased [24]. Specifically, the algorithm is mainly divided into the modular optimization stage and the network aggregation stage. In the modular optimization stage, each node is considered a community label. Each node traverses all its neighbor nodes, tries to update its own community label to the community label of the neighbor node, and selects the community label with the largest modular increment Δ Q until all nodes cannot increase the modular degree by changing the community label. This is the first stage of the algorithm. At the end of the iteration, the local modular of the network reaches the maximum value. Then, in the network aggregation stage, we merge each community into a new node. The weight of the edges between any two new nodes is equal to the sum of the weights of all the edges between the two communities. In this way, we obtain a new network. Then, we repeat the iterative process of the modular optimization stage for the new network until the modularity is no longer increased. At this point, the division of community structure is complete. The modular increment Δ Q calculation method is as follows:
Δ Q = [ i n + 2 k i , i n 2 M ( t o t + k i 2 M ) 2 ] [ i n 2 M ( t o t 2 M ) 2 ( k i 2 M ) 2 ]
where i n represents the sum of connected edge weights in community C, t o t represents the sum of weights of edges associated with nodes in C, k i is the sum of weights of the associated edges of node i, k i , i n represents the sum of connecting edge weights from node i to all the nodes in community C, M is the number of network edges, and in a weighted network is the sum of all connecting edge weights.

2.5. Node Importance and PageRank Algorithm

In a network, different nodes play different roles to different extents, which can be reflected by node importance. There are many methods to measure the importance of nodes, such as nodal centrality [30], proximity centrality [31], PageRank algorithm [32], and so on. In this paper, we use the PageRank algorithm developed by Lawrence Page to rank the importance of nodes.
The PageRank algorithm was originally proposed for identifying the importance of web pages. It is based on the following two important assumptions: (1) The quantity hypothesis: if a page node receives a higher number of links from other nodes, the page is more important. (2) Quality assumption: a high-quality page will pass more weight to other pages through the link. So, the more important the page connected to page A is, the more important page A is. In the initial stage, the PageRank algorithm sets the same value for each node, then distributes each node’s current value evenly to the link connected to the node so that each link obtains the corresponding weight. After all nodes are allocated, we sum the link weights connected to each node to obtain a new PageRank score, and a round of PageRank calculation is completed. After several rounds of calculation, until the score stabilizes, the final value obtained by each node is obtained. The value of the node can be expressed as:
P a g e R a n k ( p i ) = 1 q N + q p j P a g e R a n k ( p j ) L ( p j )
where q ϵ [ 0 , 1 ] is the damping factor, generally q = 0.85 . Its meaning is the probability of randomly continuing to jump backward after reaching a node. L ( p i ) is the number of nodes p i point to other nodes, while N is the number of all nodes. After stabilization, the larger the PageRank (PR) value is, the more important the node is. The PageRank algorithm can be applied to any set of entities with cross-referencing properties, as well as nodes in complex networks.

3. Basic Analysis of Network Structure

3.1. Establishment of Shareholder-Stock Bipartite Network

This paper uses the data of all the stocks in the Shanghai A-share market and the corresponding top ten shareholders on 30 June 2021 (data source: Wind Information). Some of the original data are shown in Table 1. These data include 1993 stocks and 16,513 shareholders in total, of which 98.49% stocks have complete top ten shareholders, while the remaining 1.51% stocks have less than ten shareholders. Due to the large amount of data contained in 1993 stocks and its 16,513 large shareholders, the corresponding shareholder-stock bipartite network will also be complex. In order to better study the investment behavior of shareholders in the stock market, we will pretreat the stock and shareholder data to some extent. Specifically, for convenience, we numbered the 16,513 shareholder nodes from 1 to 16,513 in pinyin order, and then established a bipartite network based on the relationship between shareholders’ shares, resulting in a node size of 16,513 × 1993 shareholder-stock bipartite network.

3.2. Establishment of Projected Network

The shareholder-stock bipartite network contains two different types of nodes: shareholder nodes and stock nodes. After obtaining this network, we set shareholder nodes as set A and stock nodes as set B. When using the statistically validated network model to build the mapping network, we can choose to project in two different directions to obtain the shareholder projected network and the stock projected network, respectively. In this paper, we use Python to build a projected network and use Gephi to draw network relevant diagrams.

3.2.1. Shareholder Projected Network

First, by projecting to the direction of set A, we construct shareholder projected network. In the shareholder projected network, the connection between two shareholder nodes indicates that two shareholders have similar stock portfolios. The specific process of establishing the shareholder projected network is as follows: First, because the value range of the stock node degree in the shareholder-stock bipartite network is 3–10, we divide the set B into eight small sets which node degrees are 3, 4, 5, 6, 7, 8, 9, and 10, respectively. Then, according to the connection relationship in the shareholder-stock bipartite network, the corresponding shareholder nodes in each small set are selected, while the connection edges of shareholder nodes and stock nodes in the original bipartite network are retained. In this way, eight shareholder-stock bipartite sub-networks based on the stock node degree separation can be obtained. The shareholder-protected sub-network is established according to each bipartite sub-network. Finally, by combining all the obtained shareholder projected sub-networks, the shareholder projected network of the original shareholder-stock bipartite network is obtained. Specifically, regarding the acquisition of shareholder-protected sub-networks, we will discuss the following three situations:
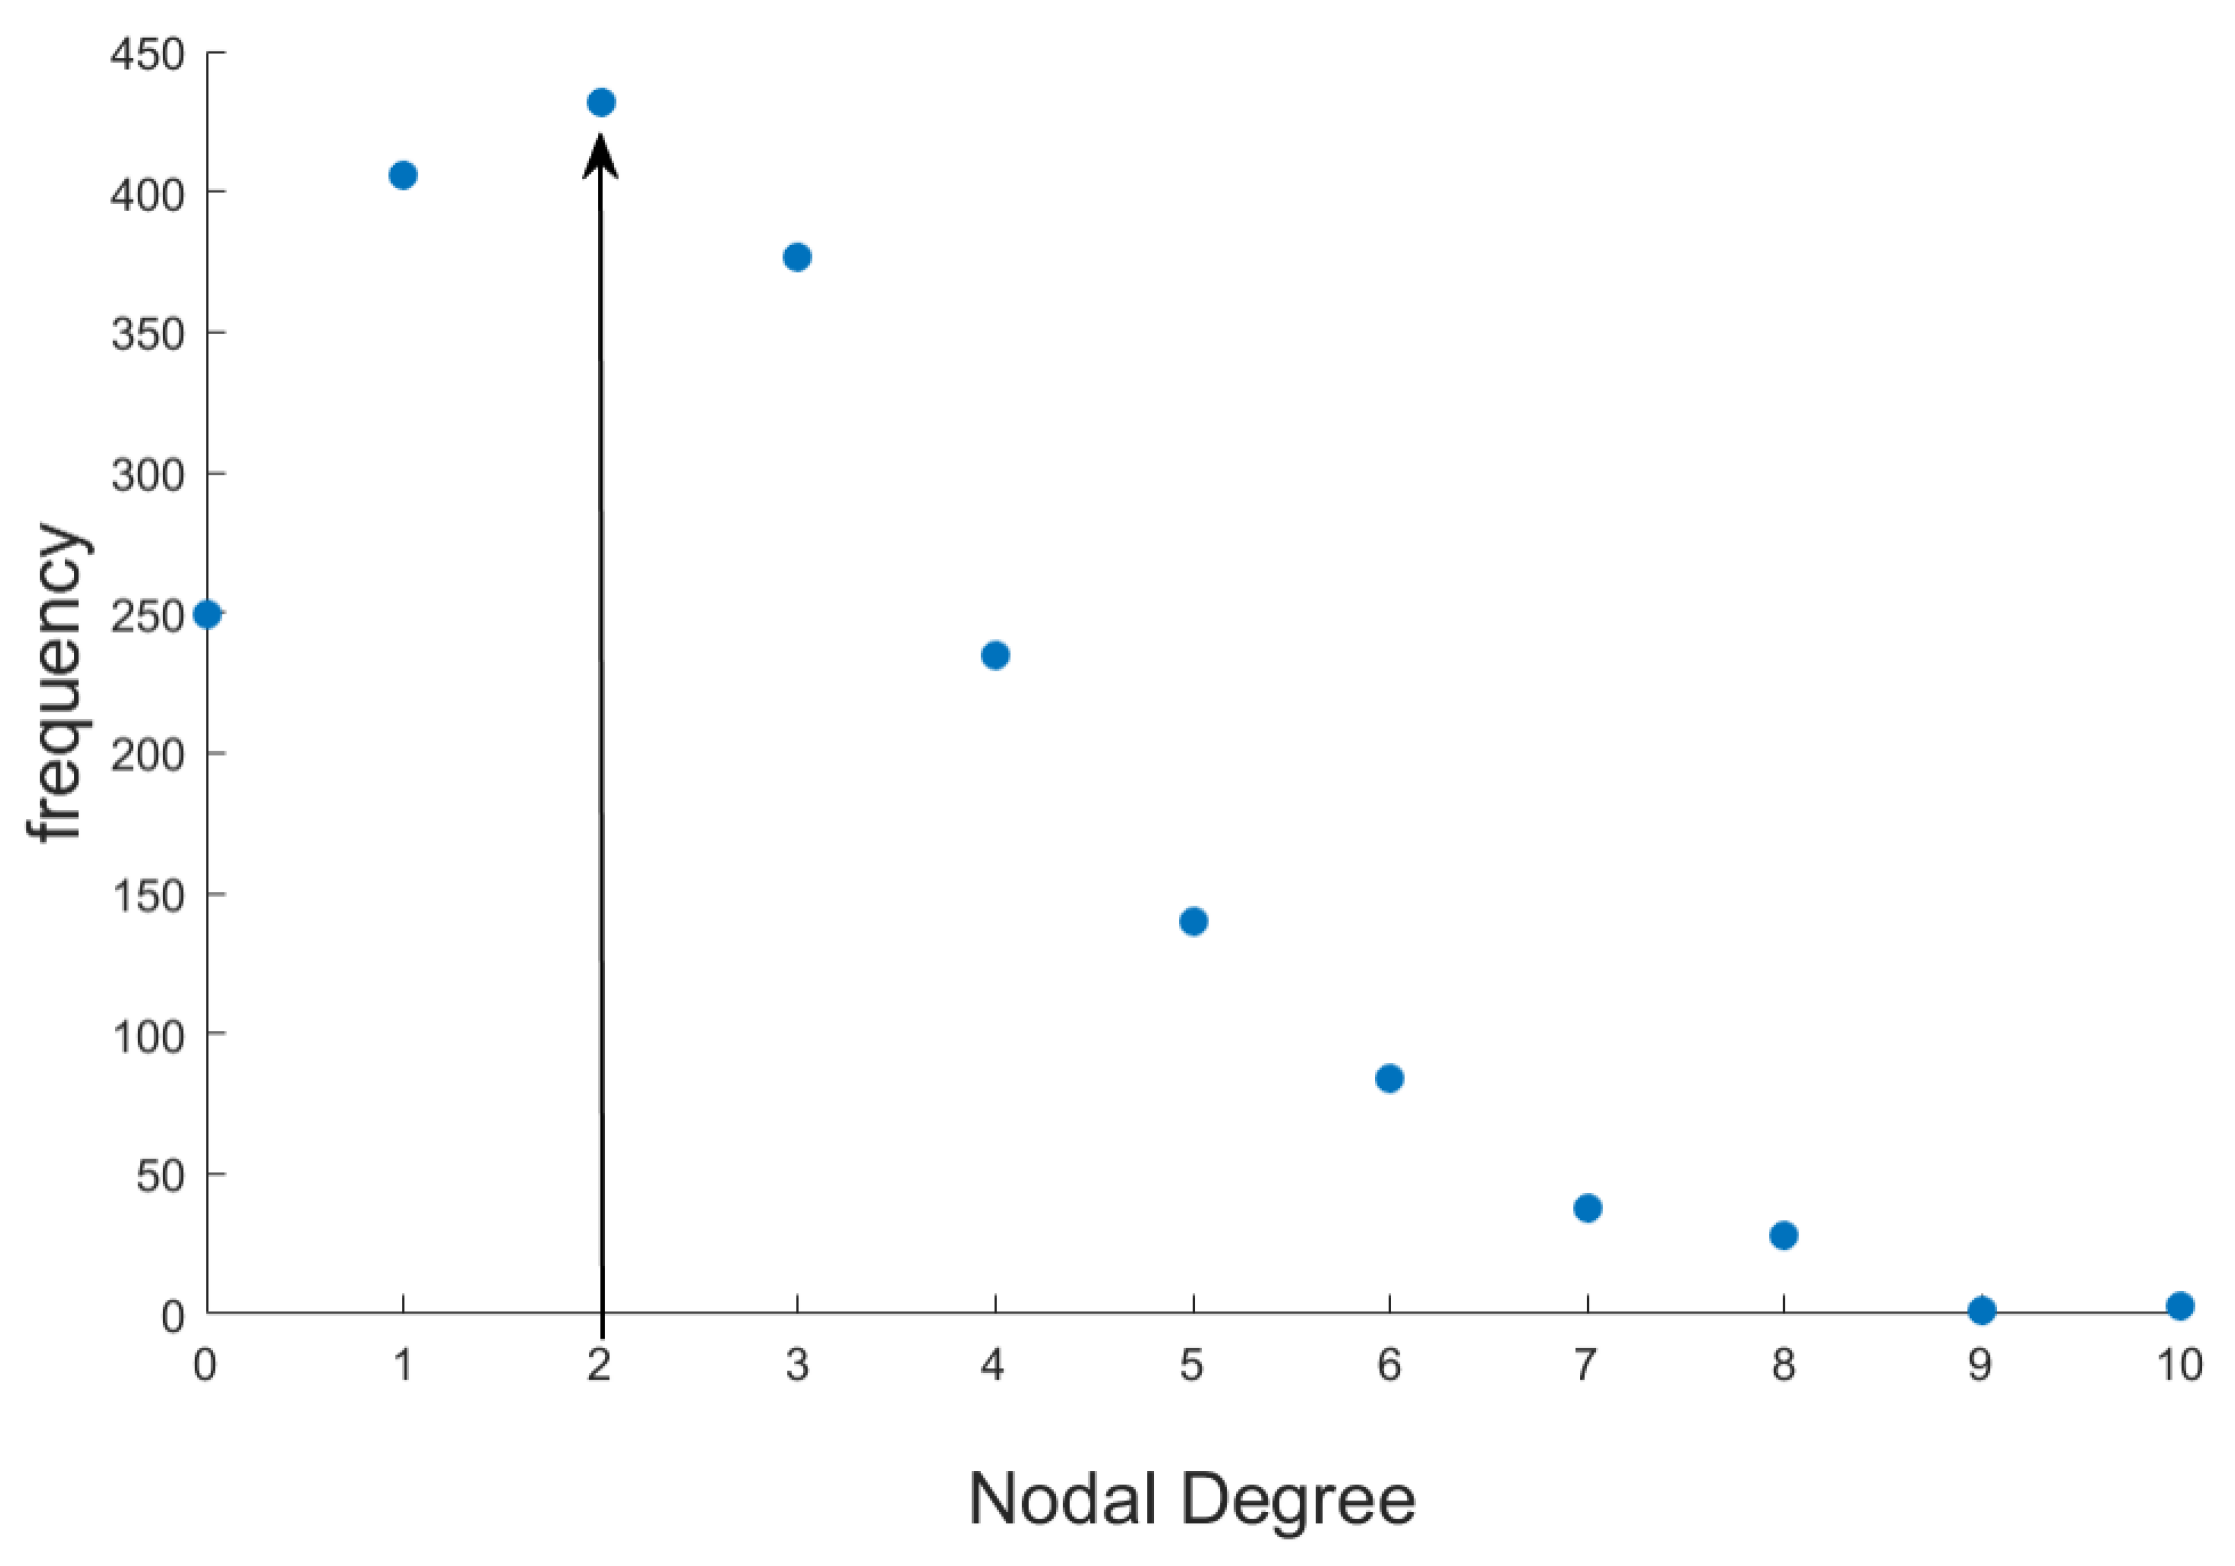
  • In the bipartite networks with stock node degrees of 3, 4, 5, 6, 7, and 8, we find that the degree of shareholders’ set nodes is 1, and these bipartite networks only contain one stock node, which leads to the sum of probability that any node in the shareholders’ set has x public neighbors calculated for i and j is 0, that is, probability x = 0 k i j 1 H ( x | N B , k i , k j ) is always 0, where k i j is the number of public neighbors between node pairs i and j; 0 x k i j 1 . Therefore, when these bipartite networks are projected, there is no connection between any node, and the resulting shareholder projected network does not contain connected edges, all of which are isolated shareholder nodes;
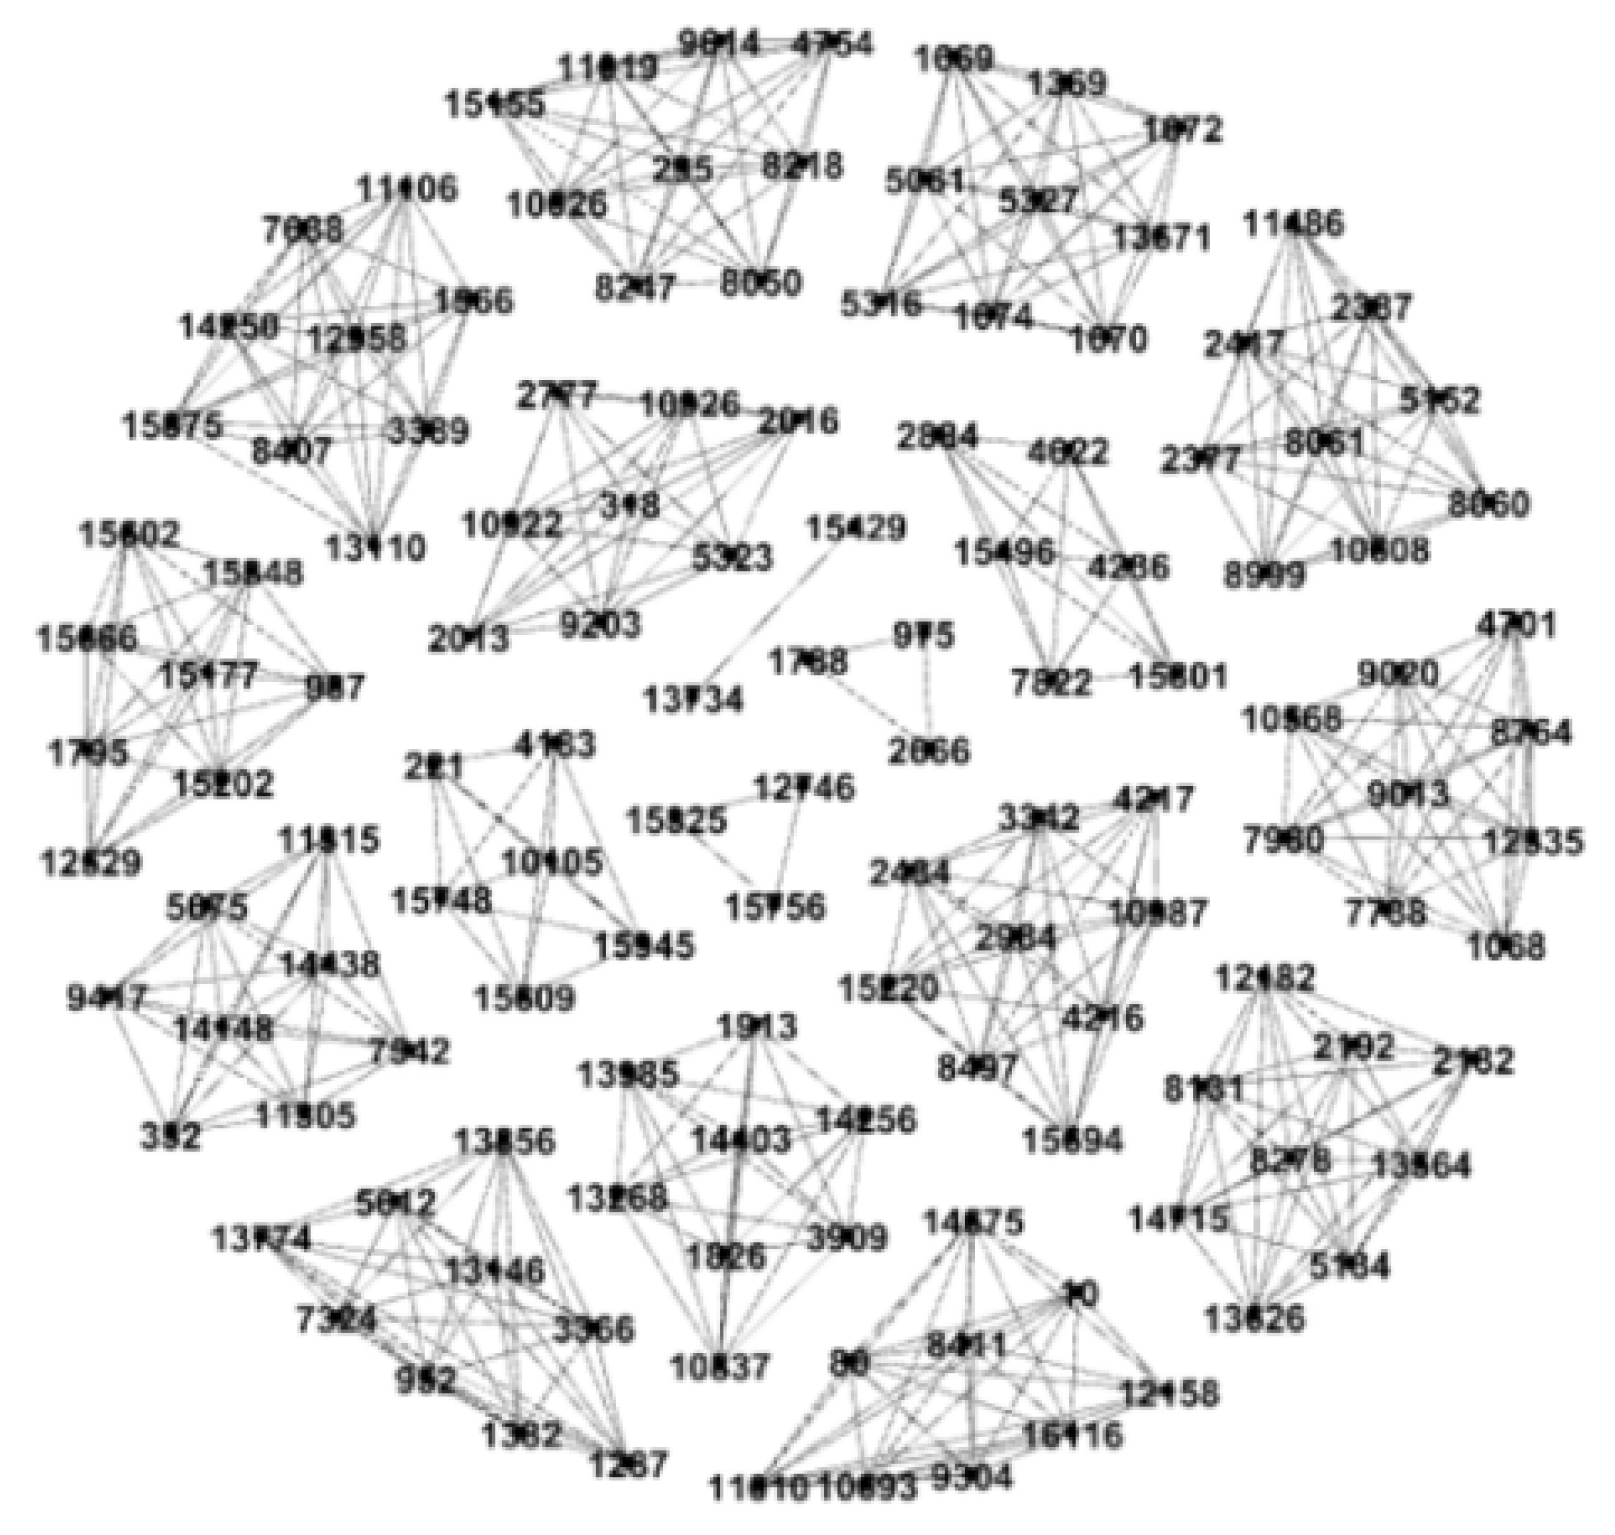
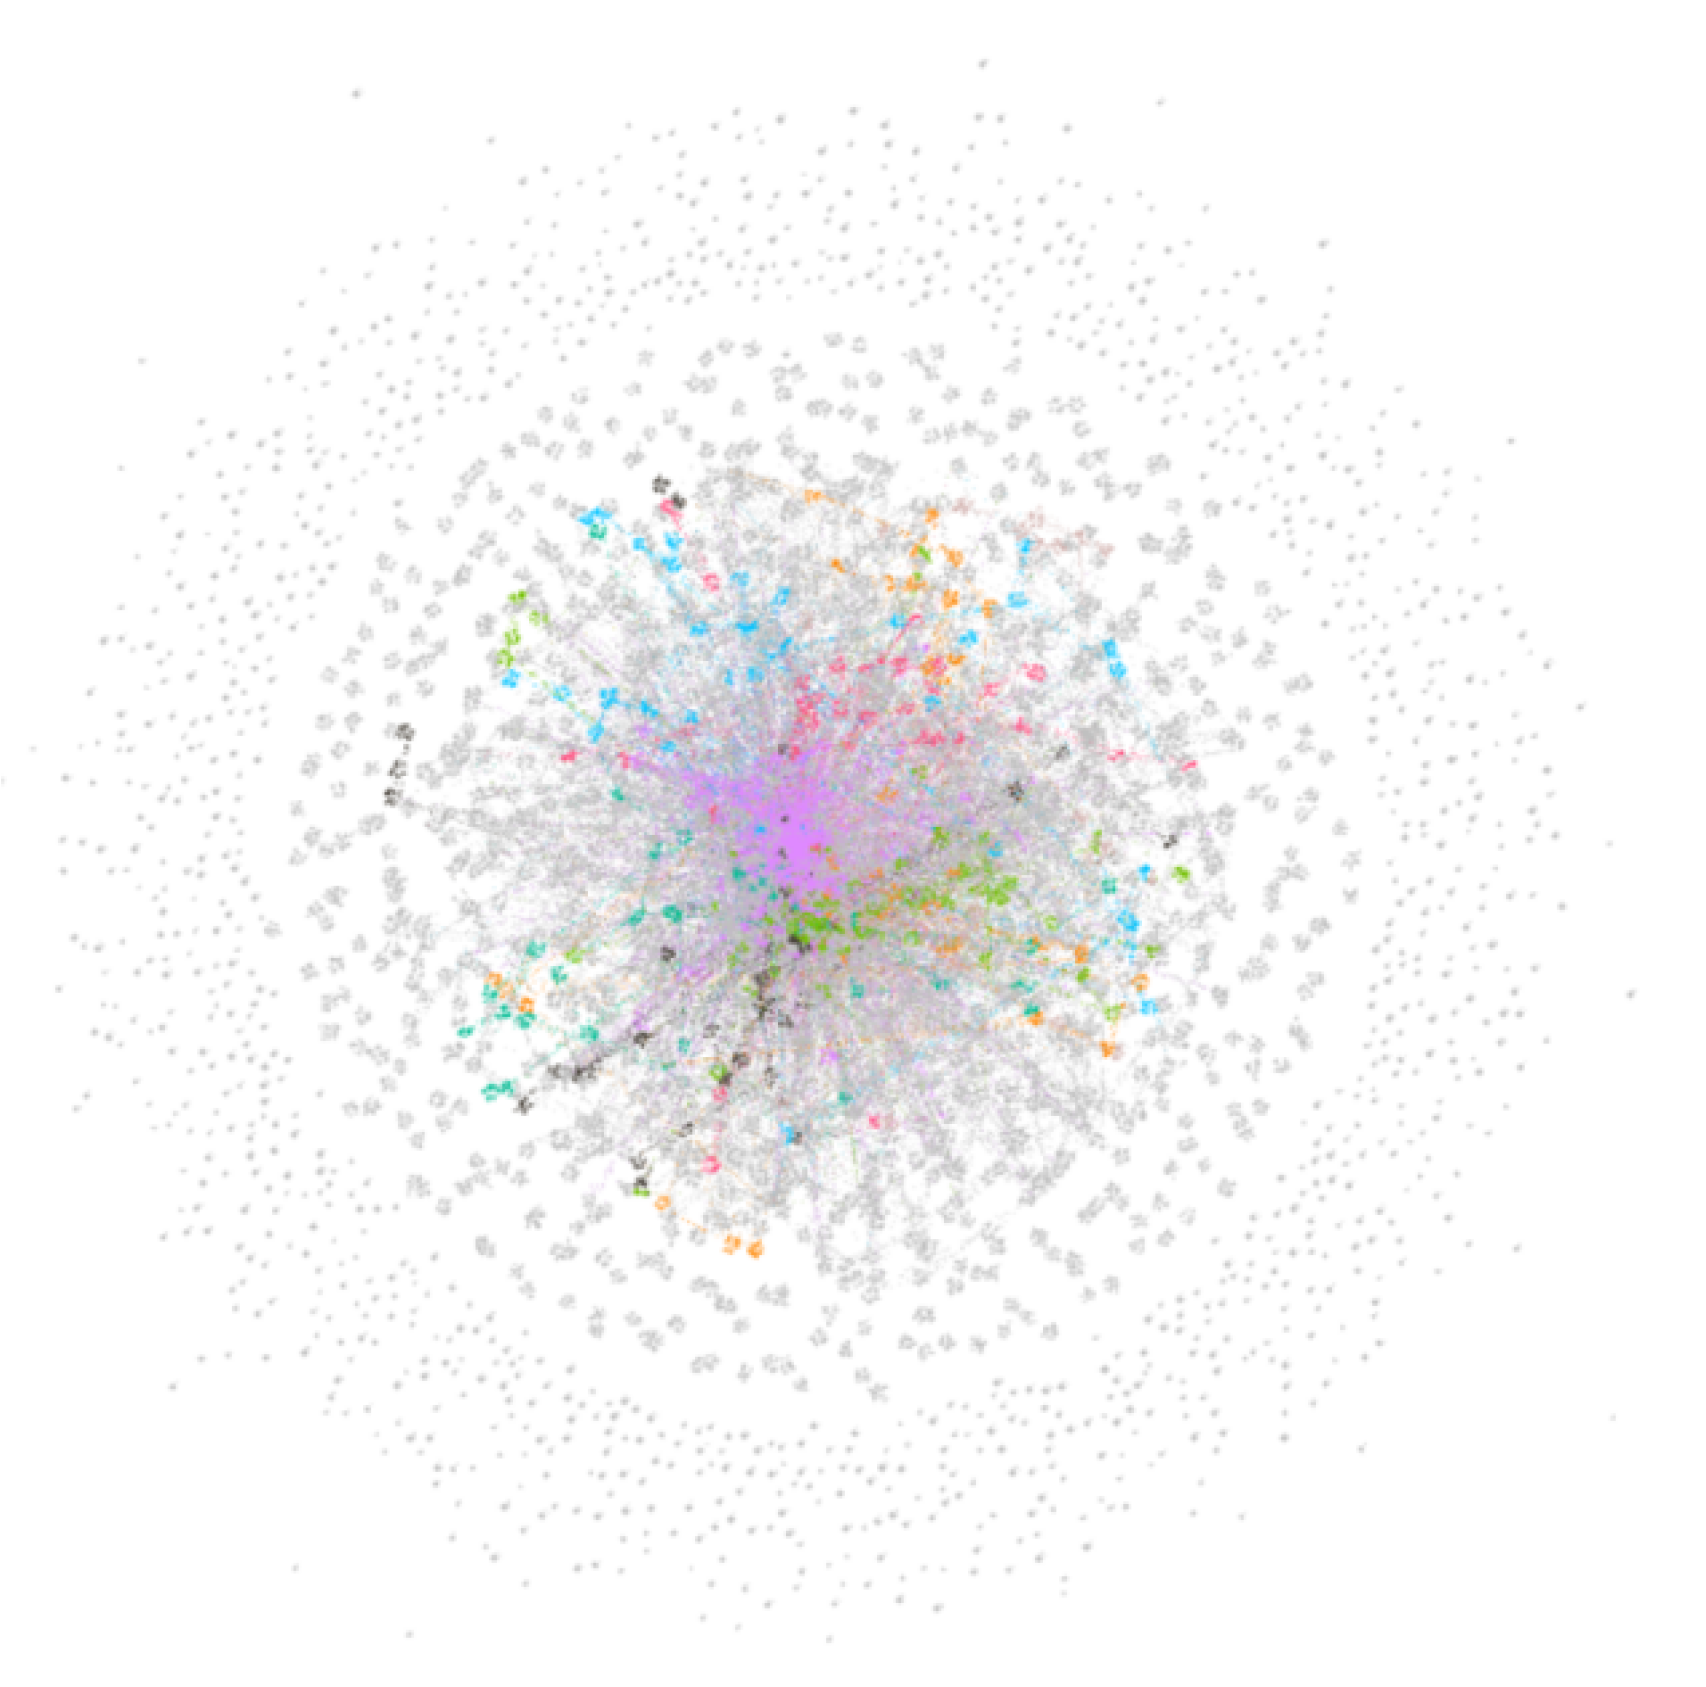
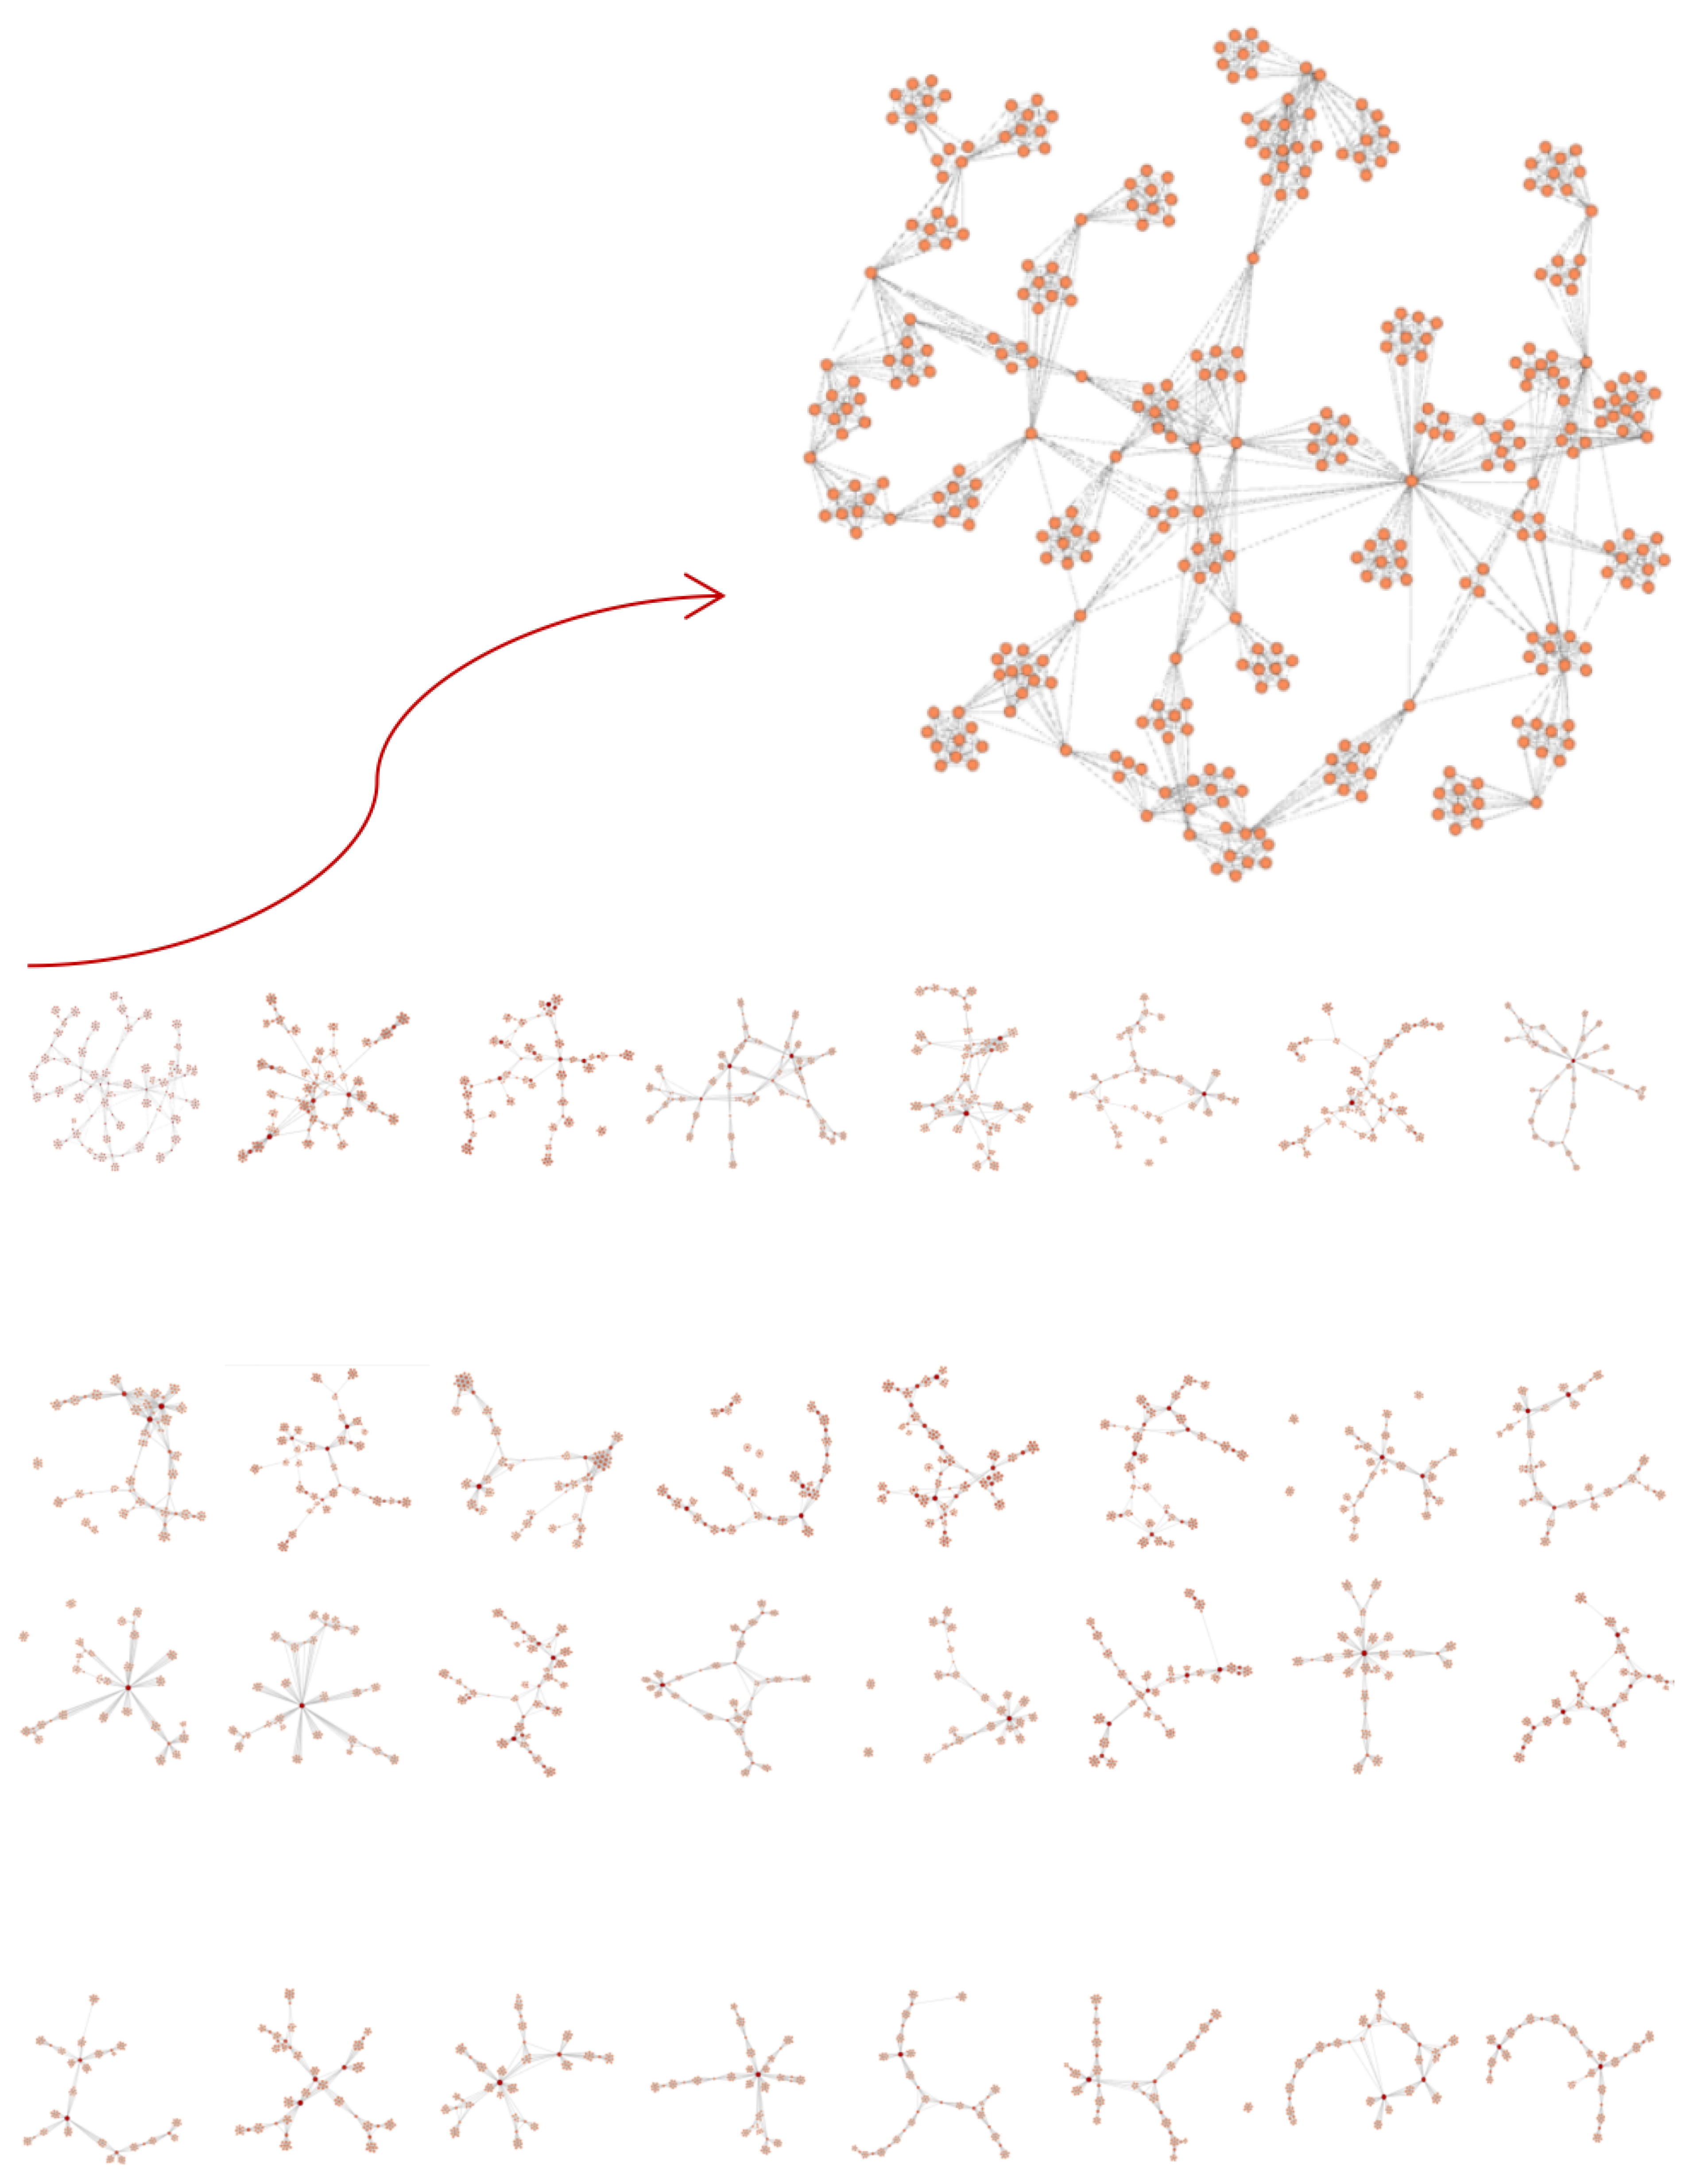
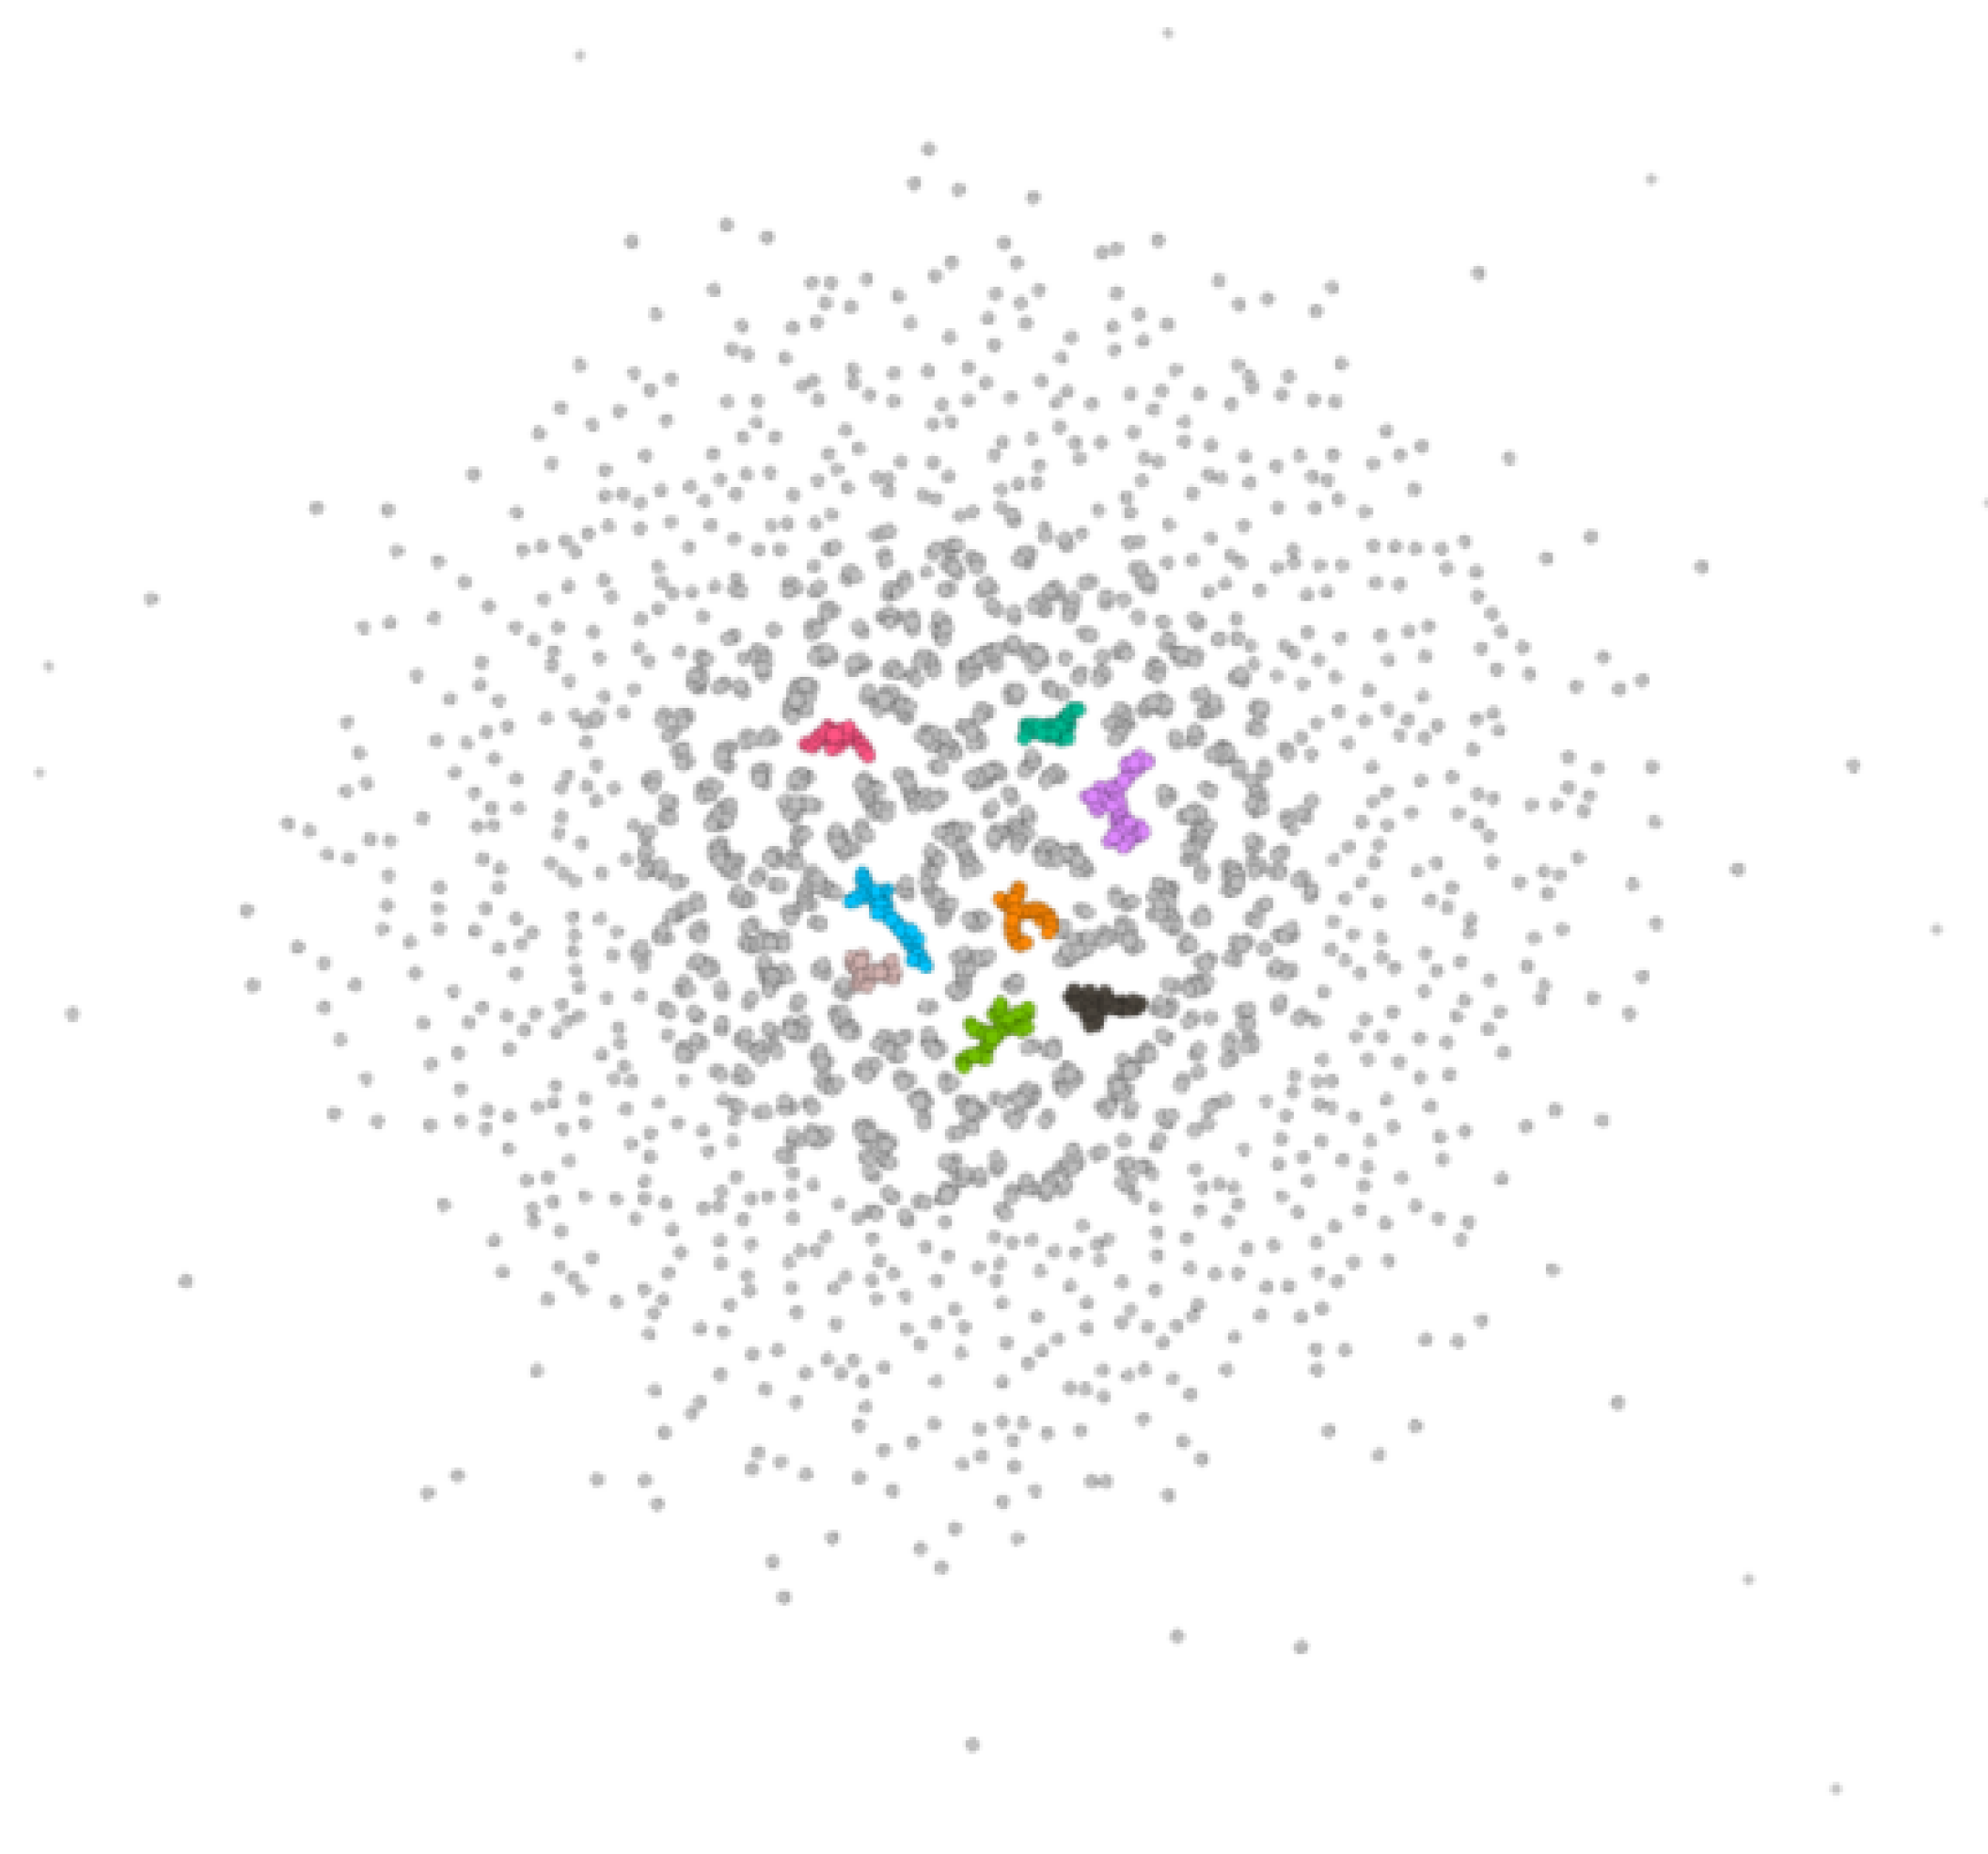
  • In the bipartite network with the stock node degree of 9, we traverse the node pairs of the shareholder set and calculate the corresponding P i j matrix according to the formula. We first adopted the Bonferroni correction and set the threshold value as S = 0.01 / N t . Where N t = N A ( N A 1 ) / 2 , N t = 135 . If P i j S , then there is a connection between node i and node j in the corresponding shareholder projected network. By comparing calculations, we found that under the Bonferroni correction, none of the P i j satisfies the threshold. We then correct it using the FDR method, and the results are shown in Figure 3;
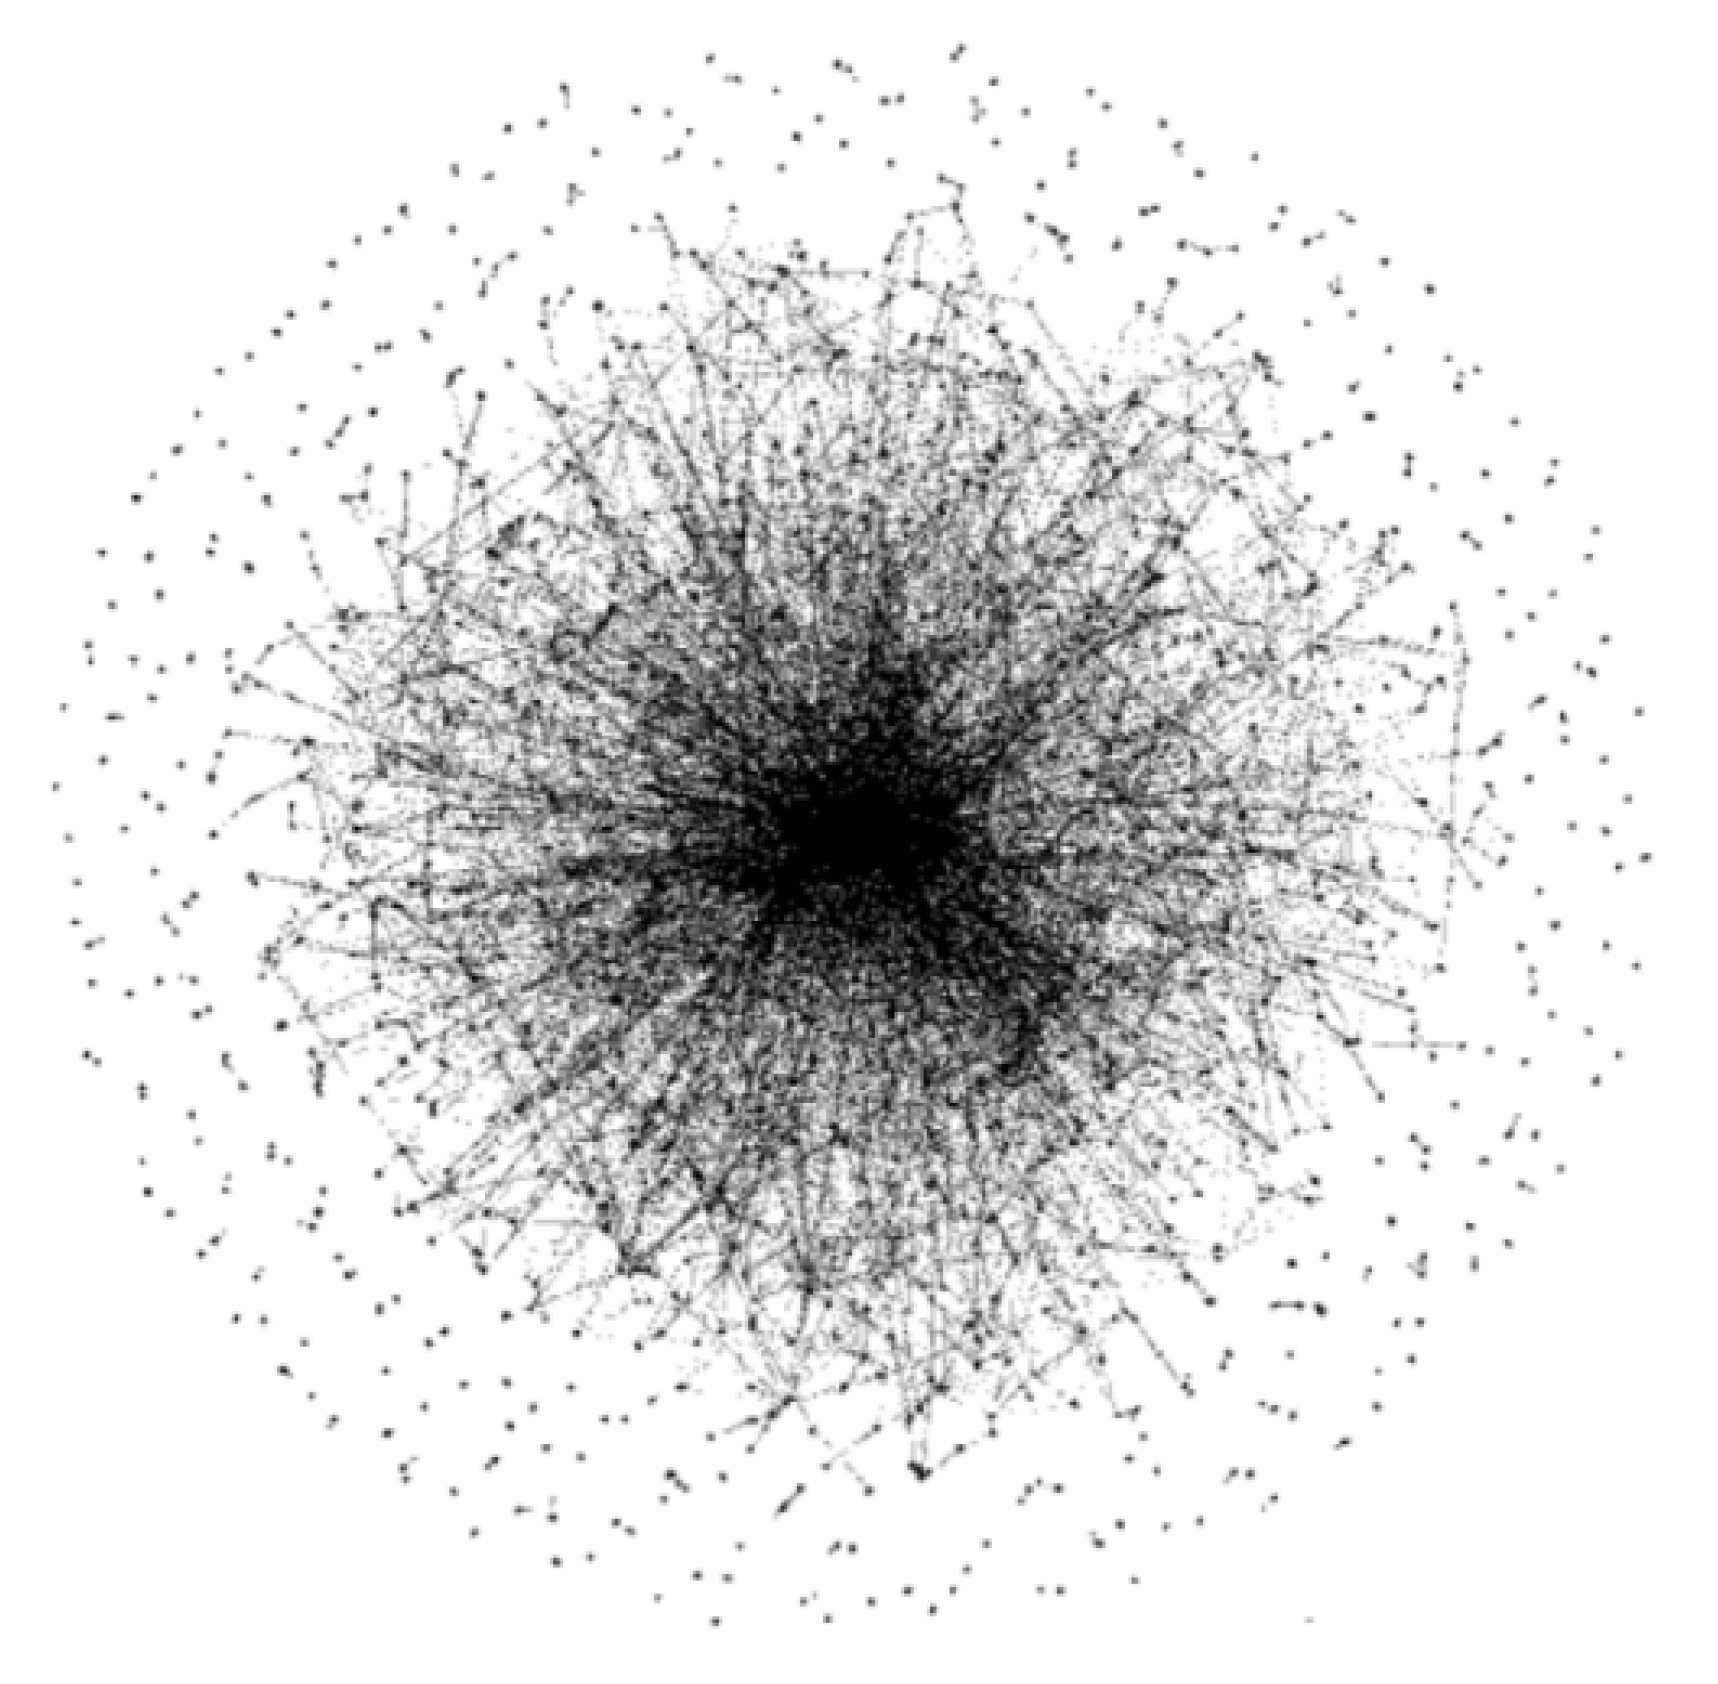
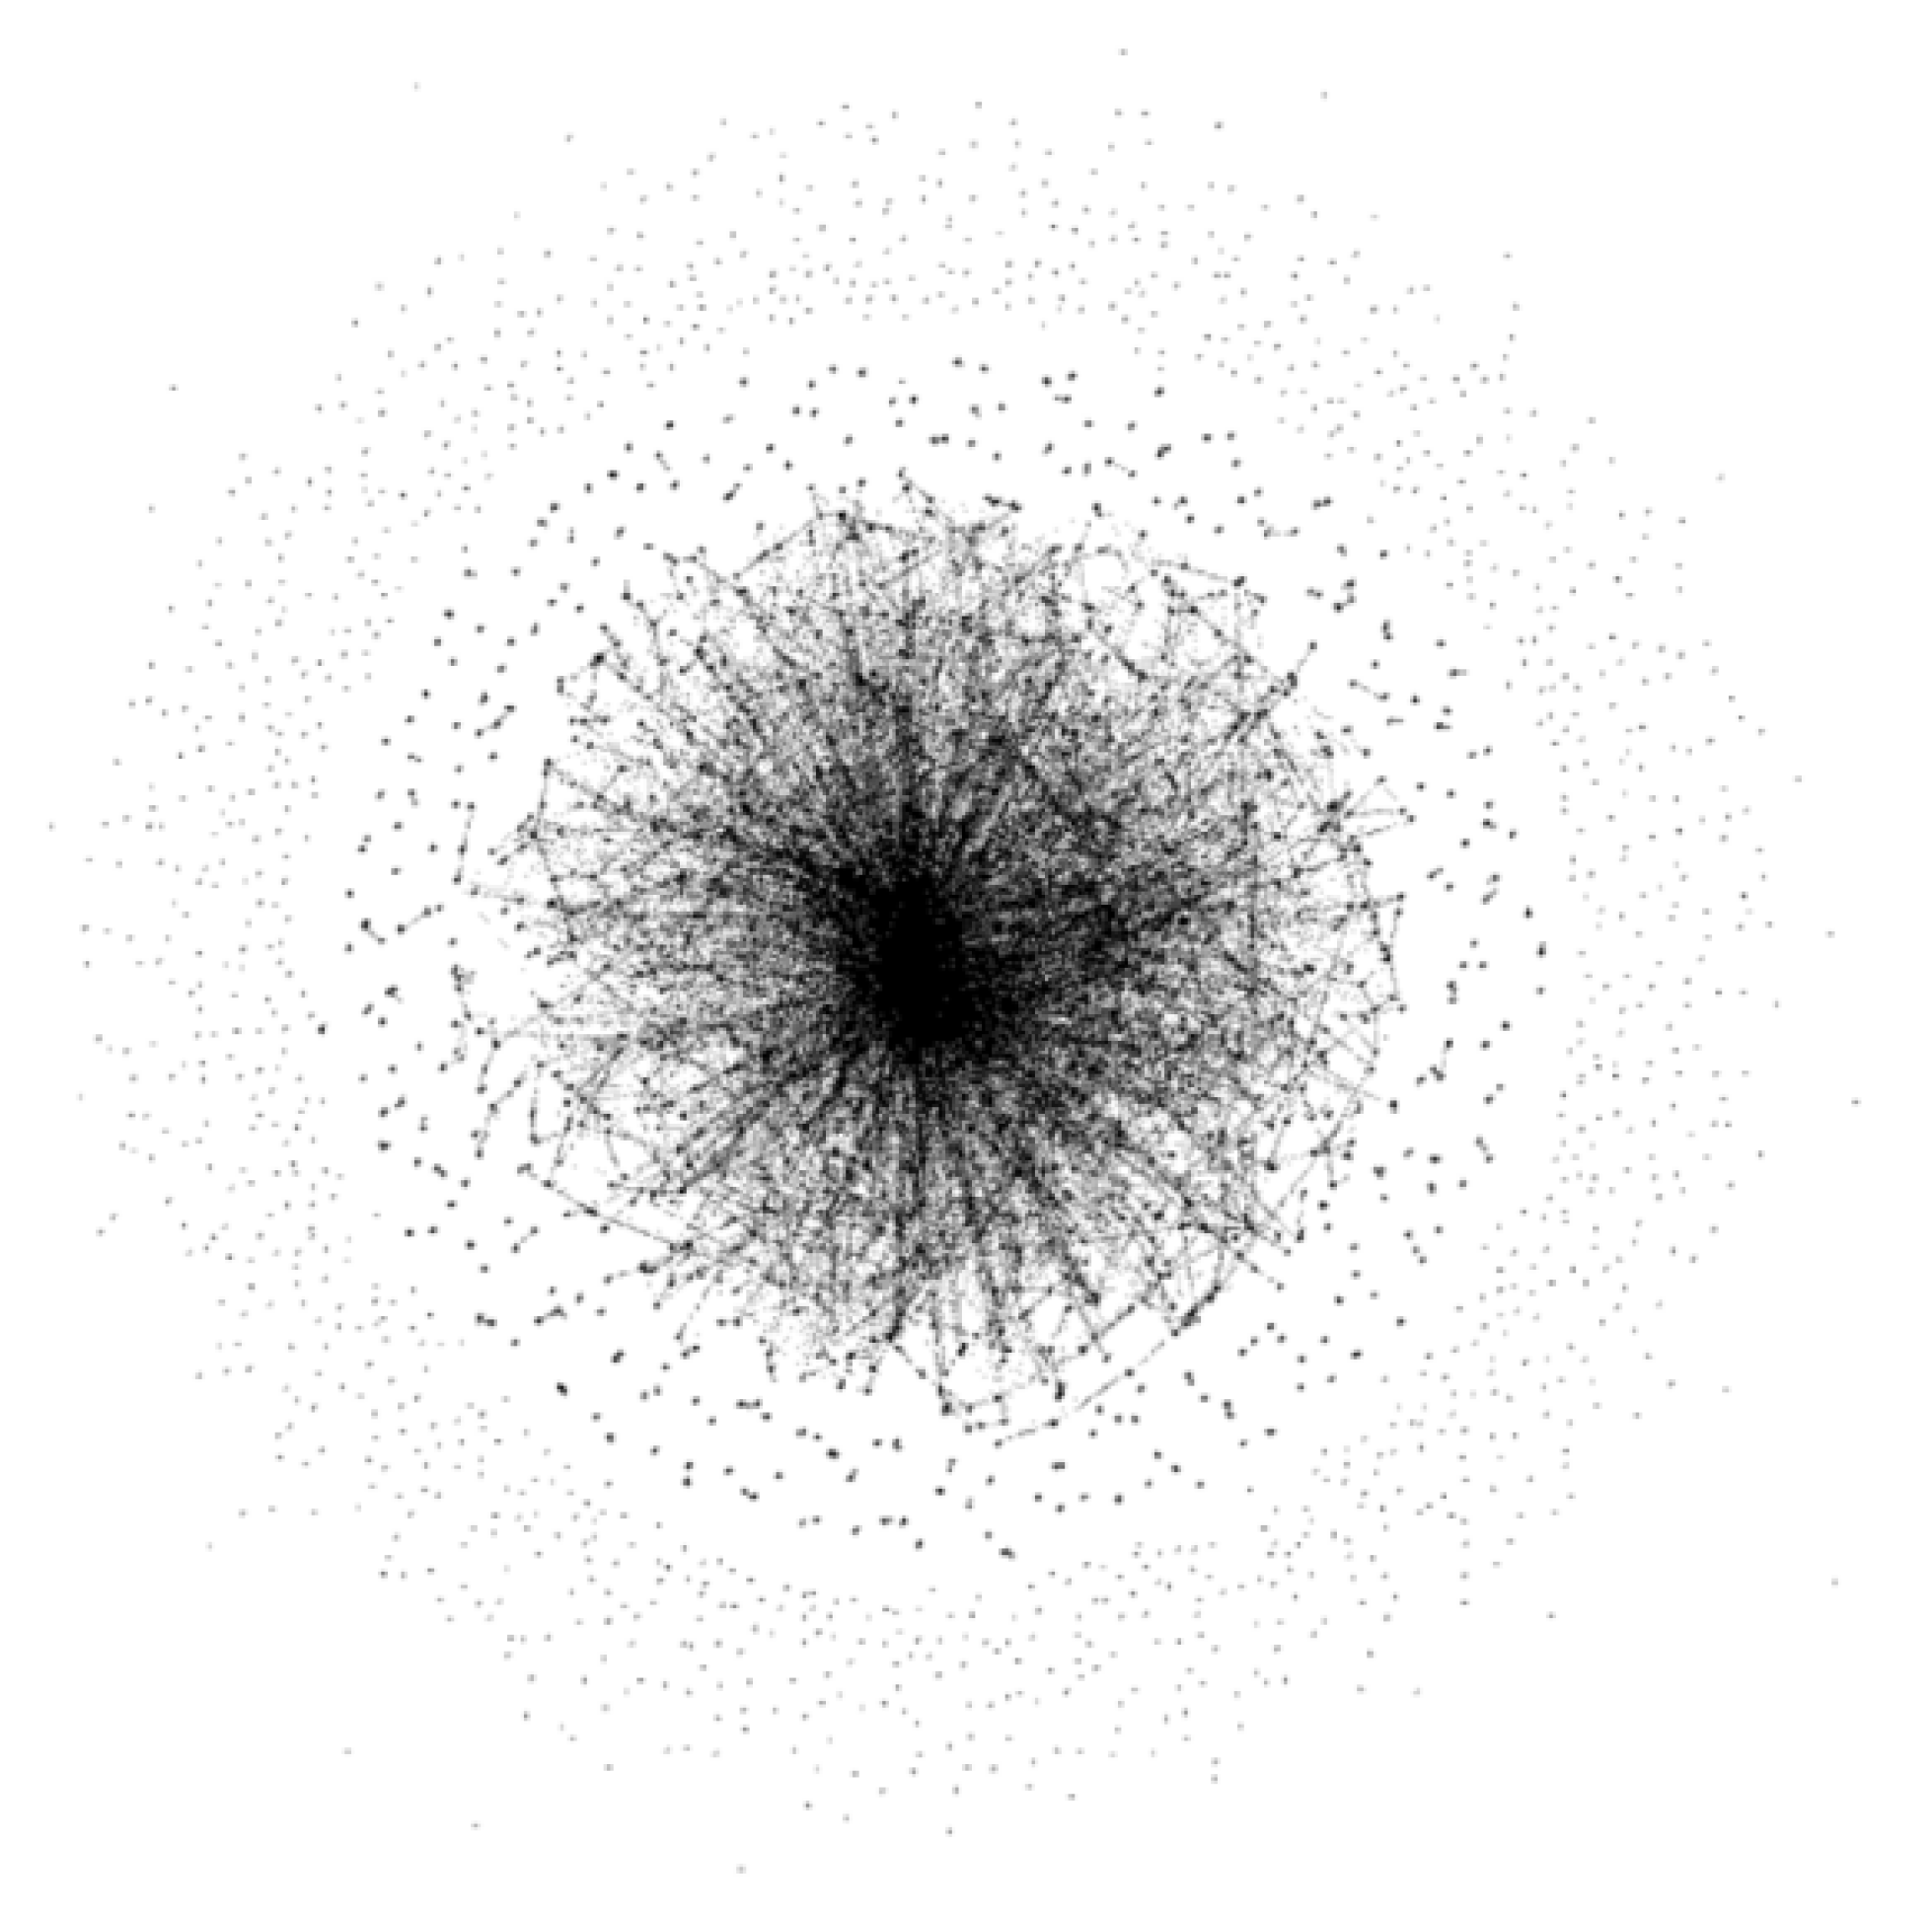
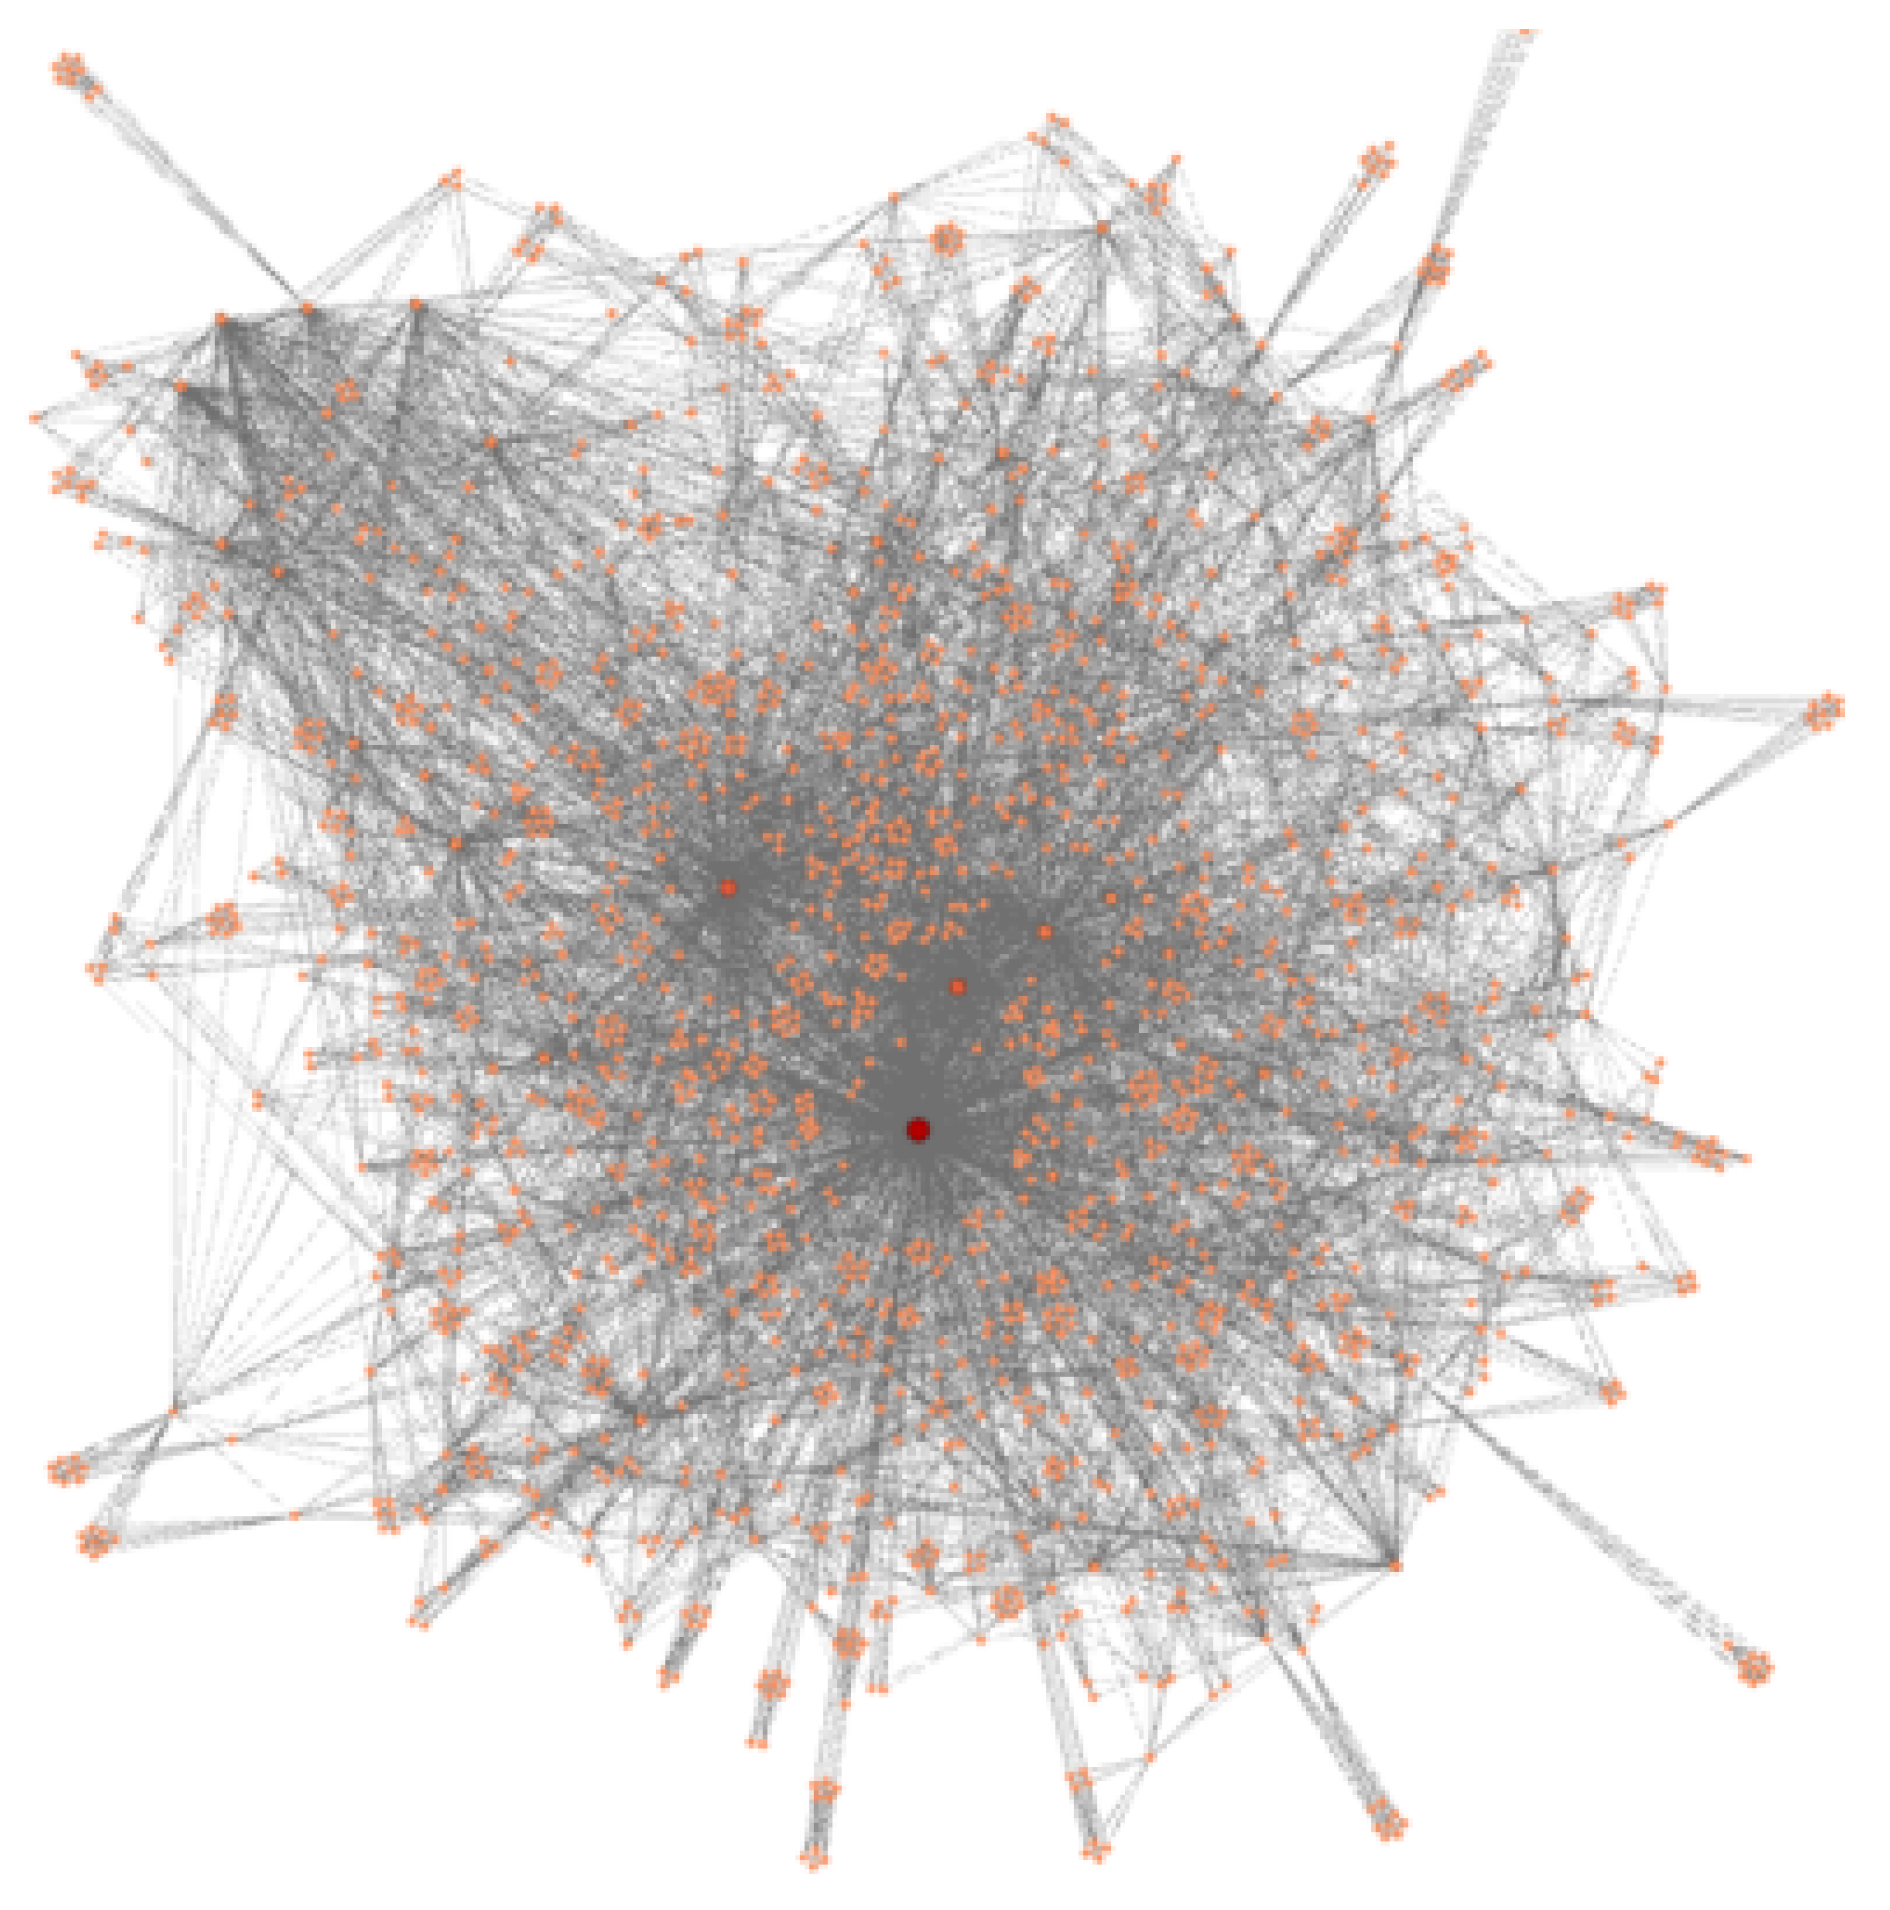
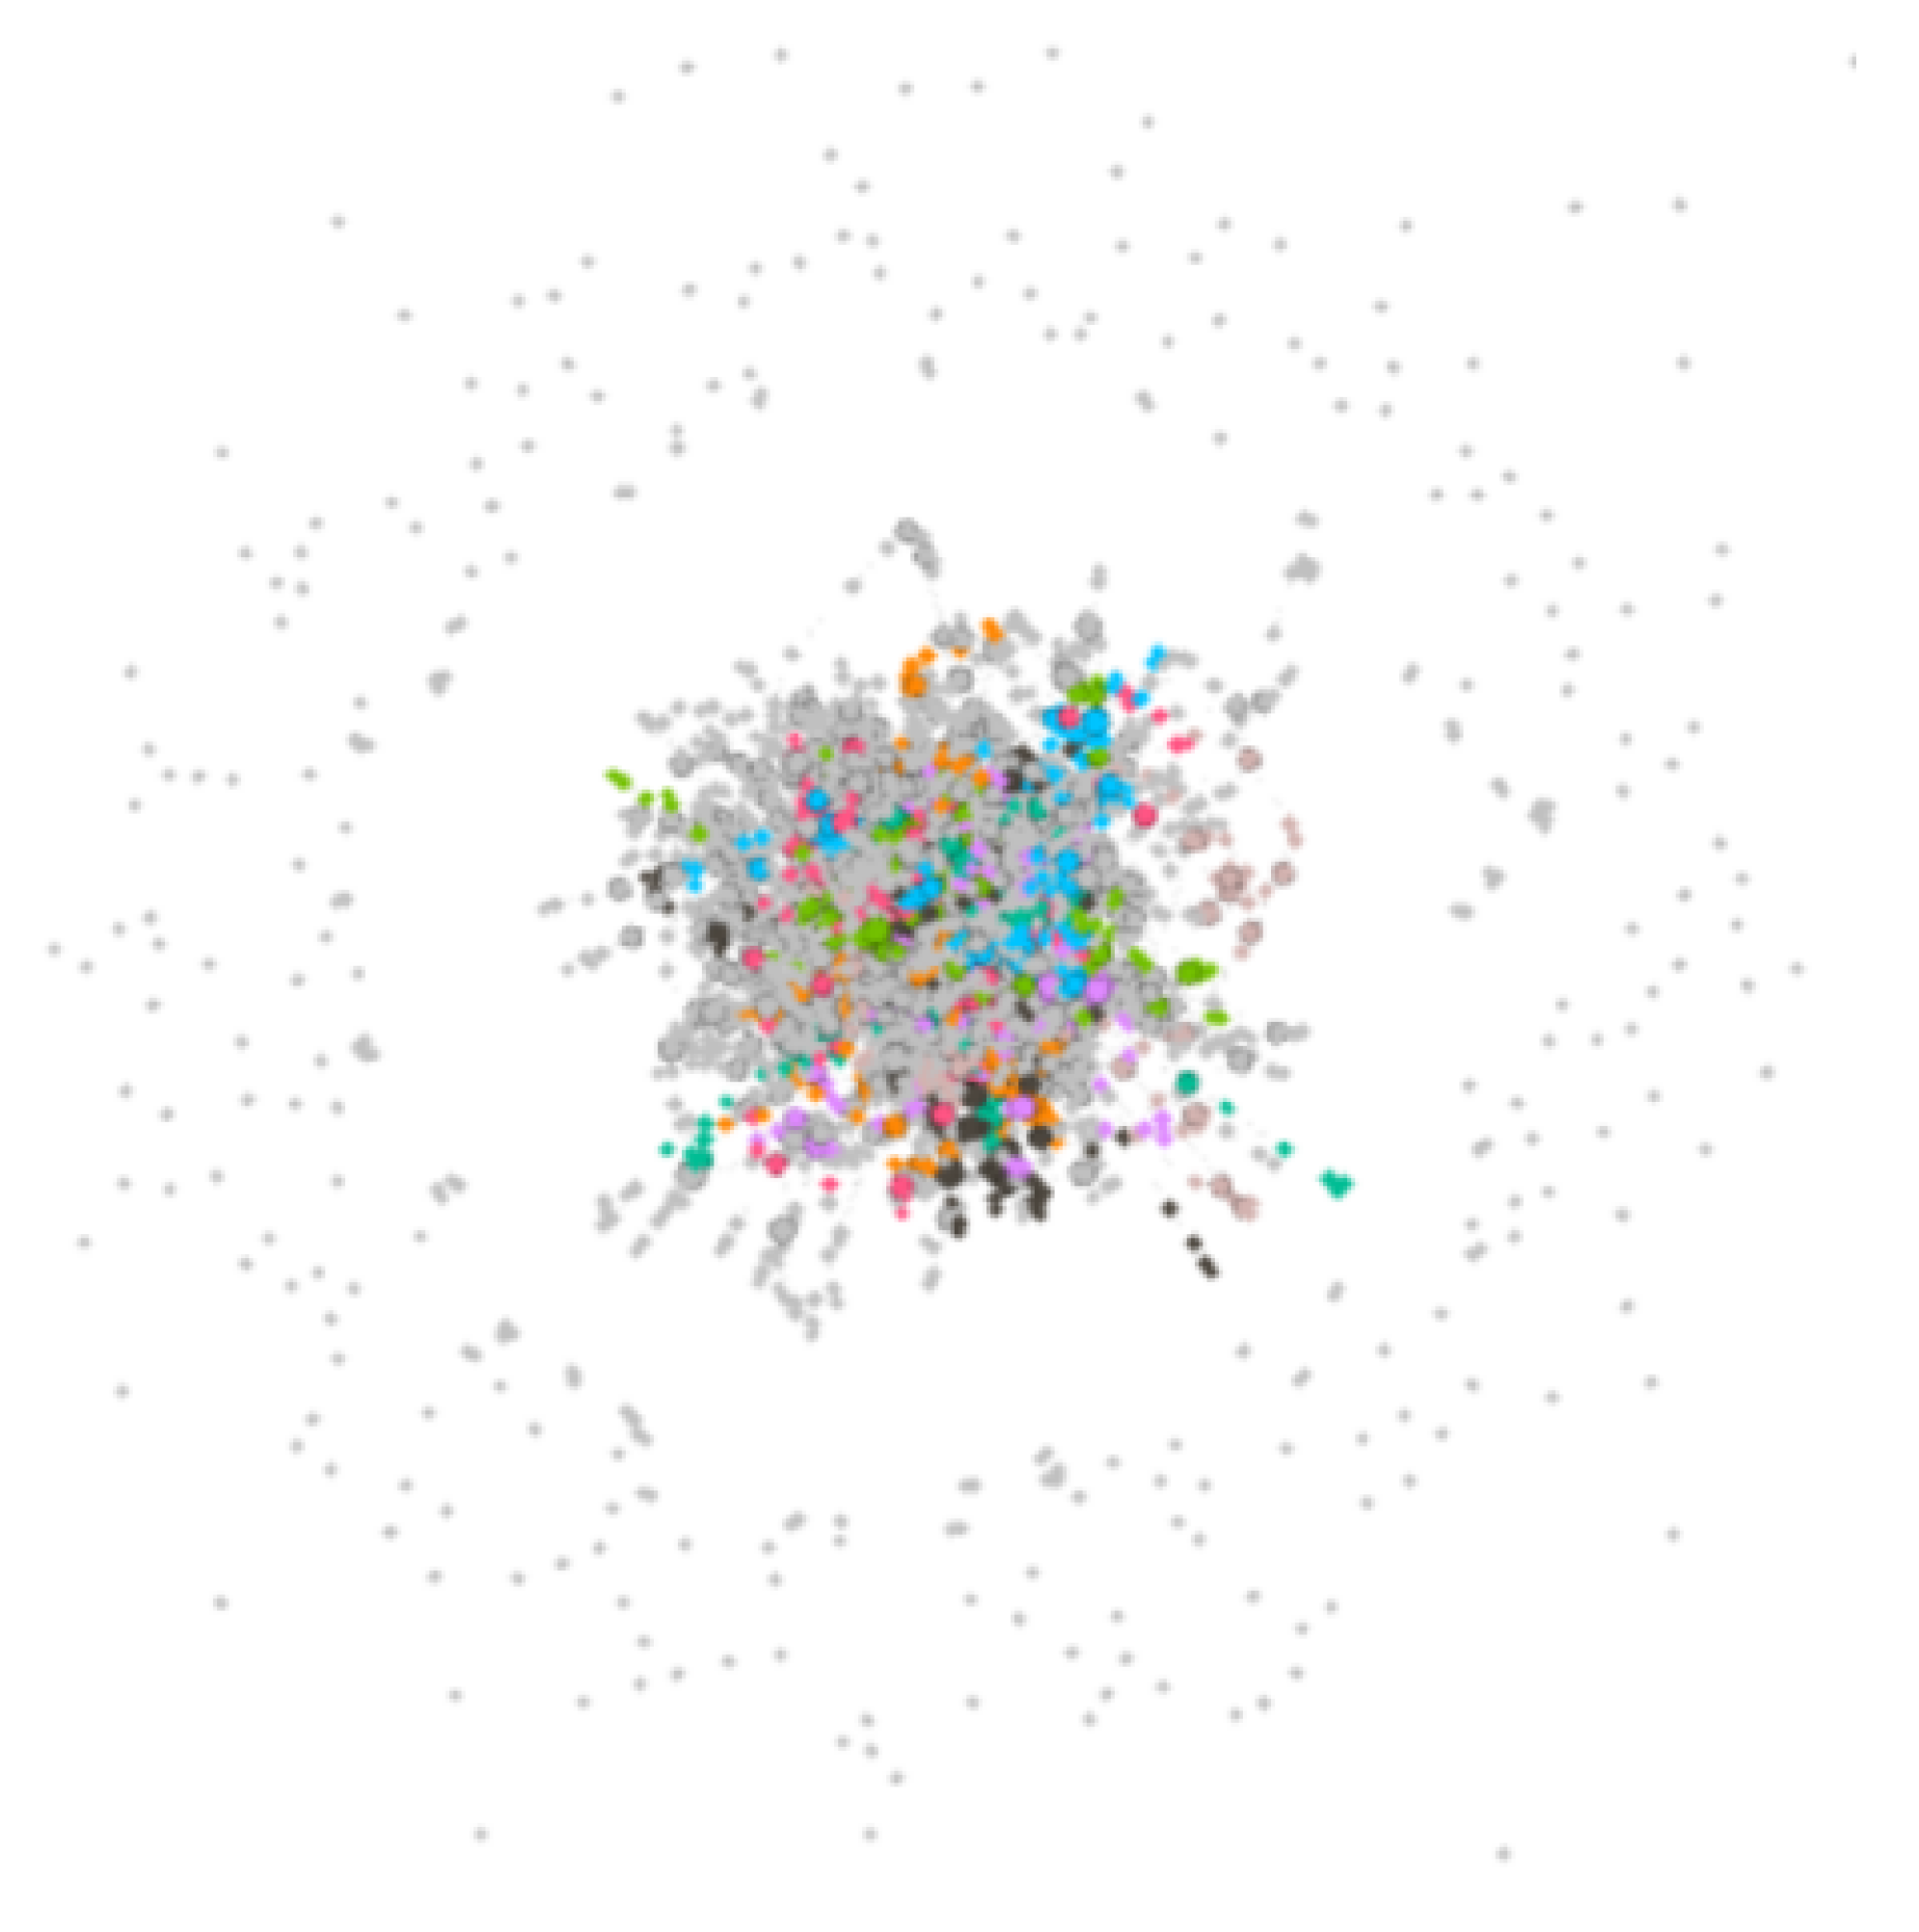
  • In the bipartite network with the stock node degree of 10, we also traverse the node pairs of the shareholder set to obtain the value corresponding to node i and node j. After FDR correction, the projected network with a node degree of 10 is obtained, as shown in Figure 4.
Finally, we obtain a total of 8 shareholder projected sub-networks. Among them, the shareholder projected sub-networks with stock node degrees of 3, 4, 5, 6, 7, and 8 are all isolated shareholder nodes. Only the shareholder projected networks with stock node degrees of 9 and 10 have connected edges. We combine these 8 shareholder projected sub-networks to obtain the total shareholder projected network corresponding to the original shareholder-stock bipartite network. The total shareholder projected network is shown in Figure 5.

3.2.2. Stock Projected Network

In addition to the stock projected network, we can also project the shareholder-stock bipartite network to the stock direction. In the stock projected network, the connection between nodes indicates that two stock nodes have similar shareholder allocation structures. Similarly, we use the statistically validated network model to build the stock projected network. First, we divide the shareholder nodes into 30 shareholder subsets according to the degree of shareholder nodes in the shareholder-stock bipartite network. Then, according to the edge connection in the shareholder-stock bipartite network, the stock node corresponding to the shareholder node in each shareholder set is selected, and the edge connection between the shareholder node and the stock node in the original bipartite network is retained. In this way, the corresponding 30 shareholder-stock bipartite sub-networks are obtained. The number of shareholder nodes and stock nodes in each bipartite network is shown in Table 2 below. It can be seen from the table that the number of shareholder nodes with a degree of 1 is the largest, reaching 13,958, and the total number of stocks they invest in is 1980, indicating that most large shareholders are major shareholders of one certain stock. In addition, as the degree of shareholder nodes increases, the number of shareholder nodes will become less and less, indicating that the number of large shareholders who invest more than one share at the same time is less and less.
Finally, according to each shareholder-stock bipartite sub-network, the stock-protected sub-networks are established. In a bipartite network, the establishment of the statistically validated network model is calculating the sum of the probabilities of each pair of nodes in the stock collection having x ( 0 x k i j 1 ) common neighbor by calculating the hypergeometric distribution. This is the calculation of the probability
x = 0 k i j 1 H ( x | N B , k i , k j ) ,
where k i j is the number of public neighbors between node pairs i and j. Then, P i j is calculated accordingly. Therefore, if the stock nodes i and j have common neighbor nodes and the number of common neighbor nodes is k i j > 1 , it is possible for nodes i and j to have connected edges. Therefore, by observing the above table, we find that the product of the number of shareholders and the corresponding shareholder degree in a bipartite network with more than 10 shareholder nodes is equal to the number of stocks, revealing that the number of common neighbor nodes connected by any stock node in these sub-networks is zero ( k i j = 0 ), which further indicates that there is no edge in the networks obtained by these bipartite network projects. Namely, there are all isolated stock nodes in the stock projected networks.
For the bipartite network with other shareholder degrees of 1 to 10, we, respectively, traverse each node pair of the stock set and calculate the corresponding P i j matrix according to the formula, after FDR correction, the corresponding stock projected network is obtained. Finally, the 30 stock projected networks are combined to obtain the stock projected network of the original bipartite network. The network is shown in Figure 6 below:

3.3. Analysis of The Overall Structure of Projected Networks

3.3.1. Shareholder Projected Network

First of all, as shown in Figure 7, we establish a frequency distribution map with 10 as the interval for the degree of nodes in the shareholder projected network and conduct regression analysis. It is found that the degree distribution of nodes presents a power-law distribution, which meets the scale-free characteristics of the network. We establish a model f ( x ) = a e b x to fit, where a = 2235 and b = 0.1315 . Then, we calculate the average degree and clustering coefficient of the network. The average degree is 4.124 and the clustering coefficient is 0.928. The network has a large clustering coefficient, meeting the characteristics of the small-world network.
From the degree distribution of nodes, we can see that there are nodes connected with many nodes in the network, that is, “hubs”. These “hubs” play a crucial role in the stability of the network. It is far from enough to only consider the node degree of the “hub” nodes. We will use the PageRank algorithm based on network centrality to calculate the PageRank (PR) values of all nodes in the shareholder projected network, so as to obtain the more critical node numbers. The results show that shareholder No. 11747 Hong Kong Securities Clearing Company Limited (Mainland Stock Connect) had the largest PR value, while shareholder No. 14756 China Securities Finance Co., Ltd. and shareholder No. 14927 Central Huijin Asset Management Co., Ltd., respectively, have the second and third PR values.

3.3.2. Stock Projected Network

First, we establish a frequency distribution diagram for the degree of nodes in the stock projected network. As shown in Figure 8, the degree of most nodes in the stock projected network is small, and the number of nodes with a degree less than or equal to 5 accounts for 92.3% of the total number of nodes; The maximum frequency occurs at the position where the node degree is 2, and the number of stock nodes with the stock degree of 2 accounts for 21.7% of the total number of nodes. Then, we calculate the average degree and clustering coefficient of the network, and the average degree is 2.545, the clustering coefficient is 0.132, and the aggregation of the stock projected network is small.

4. Community Structure of Projected Network

In the previous section, based on the established shareholder-stock bipartite network, we obtained shareholder projected network and stock projected network. Next, we will divide the two projected networks into communities, and analyze the community structure in depth, so as to explore the potential investment relationship and characteristics between stocks and their large shareholders.

4.1. Shareholder Projected Network

4.1.1. Community Division of Shareholder Projected Network

In the previous calculation, the clustering coefficient of the shareholder projected network is 0.928, which shows that the network shows more obvious aggregation characteristics. Next, we use the Louvain algorithm to divide the community of the shareholder projected network. We use Python to implement the Louvain algorithm. When the default resolution is 1, the shareholder projected network is divided into 604 communities, as shown in Figure 9. The communities with fewer nodes are gray, while the communities with more nodes are distinguished by various color markers. In the division results, there are 250 communities with only one isolated node, while the number of nodes in the largest community is 1784, accounting for about 10% of the total number of shareholder nodes.

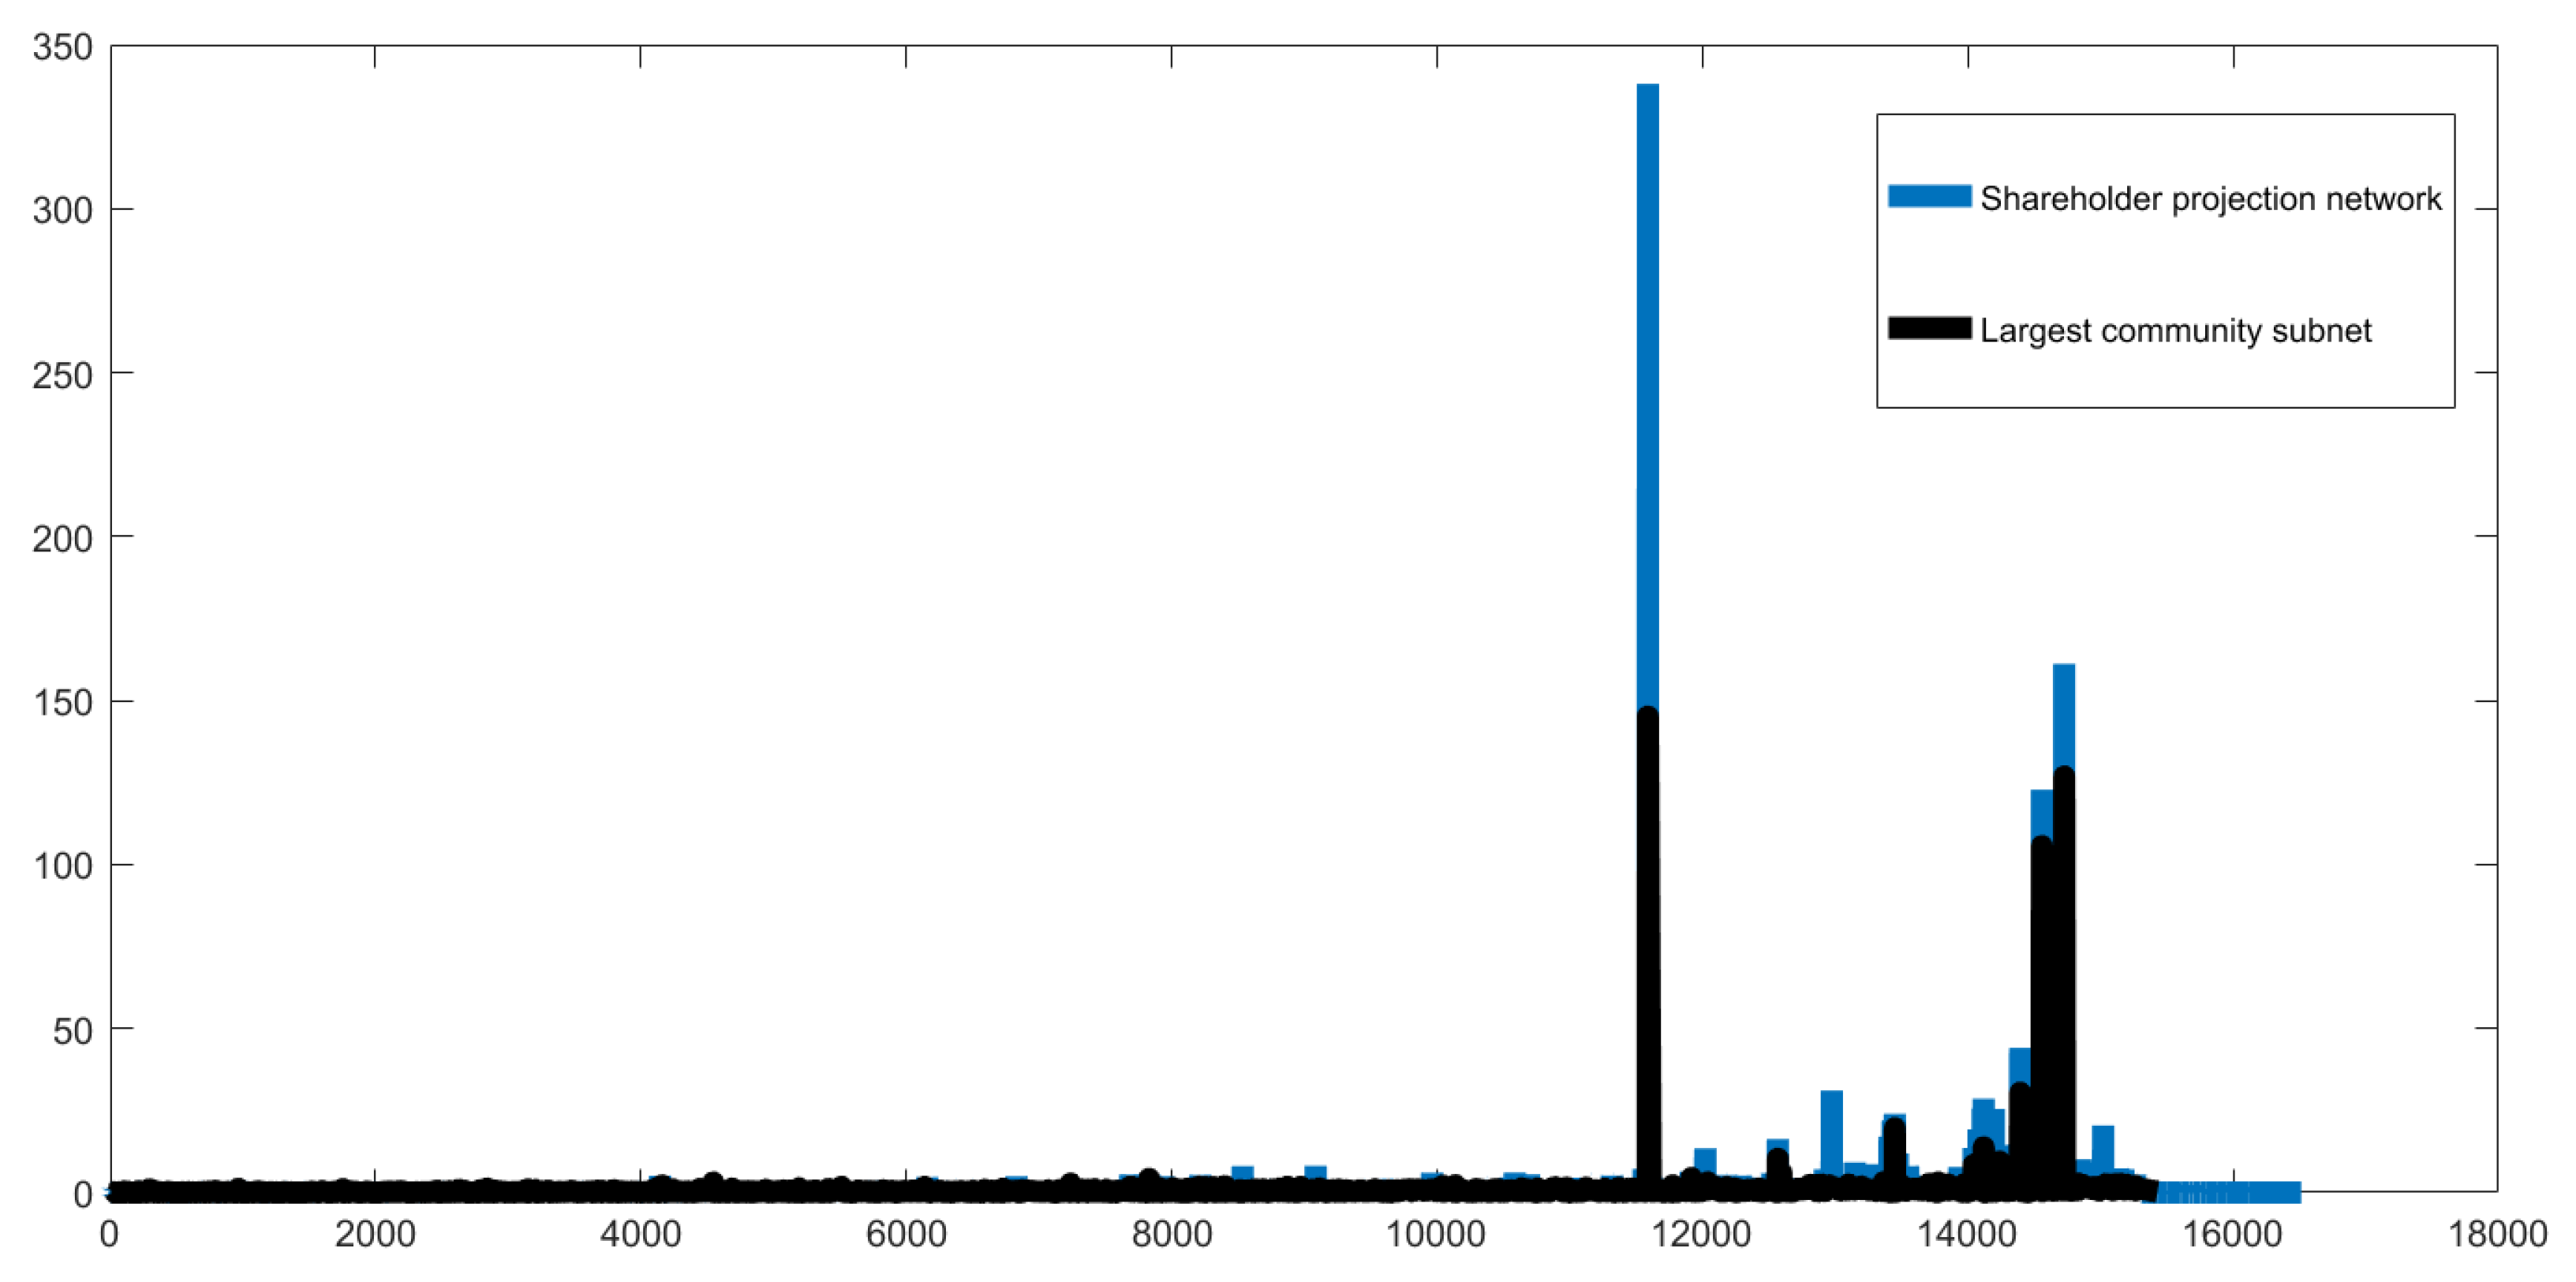
4.1.2. The Largest Community Sub-Network of Shareholder Projected Network

The largest community obtained from the community division of the shareholder projected network is located in the network center, with 1784 shareholder nodes. Next, we take out the largest community separately, remove the edges between the community and other communities, and only retain the connection within the community. In this way, the largest community sub-network is obtained and its structure will be analyzed (Figure 10).
First of all, we conduct regression analysis on the frequency distribution graph of node degrees in the largest community sub-network and find that the degrees of nodes follow a power-law distribution. At the same time, we also calculate the average degree and clustering coefficient of the network. The average degree is 12.796 and the clustering coefficient is 0.908. The network has the characteristics of a large clustering coefficient and a short average path. Through calculation, we find that the largest community still meets the characteristics of scale-free networks and small-world networks. Then, we use the PageRank algorithm to calculate the importance of network nodes in the largest community sub-network and compare the results with those of these nodes in the original shareholder projected network. The results are shown in Figure 11. The shareholders of Hong Kong Securities Clearing Co. (number 11747), China Securities Finance Co. (number 14756), and Central Huijin Asset Management Co. (number 14927) have high PR values. The results show that the ranking of all nodes in the largest community in the community sub-network is highly consistent with their ranking in the original network. Therefore, the largest community sub-network basically retains the basic properties of all nodes in the original shareholder projected network and maintains the structural characteristics of the network, which reflects the effectiveness of the Louvain algorithm in dividing communities in the shareholder projected network.

4.1.3. Community Structure Analysis of Shareholder Projected Network

According to the nature of the community structure, it is typical that the nodes within the community are relatively closely connected, while the connections between communities are relatively sparse. For each divided community, we will retain its internal nodes and connections and remove connections between different communities to form an independent community sub-network. Then, we will discuss all community sub-networks:
First, we establish a frequency chart for the interval of 10 nodes in all community sub-networks and conduct regression analysis. The established fitting model is f ( x ) = a e b x , where a = 296.1 , b = 0.1425 . The scatter plot and fitting curve of frequency are shown in Figure 12:
According to the regression results, it is found that the number of nodes in all communities presents a power law distribution. Then, we conduct statistical analysis on the number of nodes in all community sub-networks and draw the corresponding pie-shaped distribution chart according to the number of nodes in each community sub-network, as shown in Figure 13. The figure shows that 91.2% of the community sub-networks contain no more than 100 nodes, 5.5% of the community sub-networks have a number of nodes ranging in [100,200], and only 3.3% of the community sub-networks have more than 200 nodes.
Further, we calculate the proportion of the number of nodes in each community to the total number of nodes and define the community whose proportion is greater than 1% as a large-scale community. The proportion of communities less than or equal to 1% is named small-scale. According to this definition, all communities of the shareholder projected network are divided into two types: large-scale communities and small-scale communities. First, we analyze large-scale communities. A total of 33 large communities are obtained through community division. Figure 10 above already shows the largest community sub-network, while the remaining 32 large-scale community network diagrams are arranged from large to small by the number of nodes, as shown in Figure 14. The top sub-diagram shows an enlarged view of a community sub-network. We calculate the average degree and clustering coefficient of all large communities and draw their corresponding broken line chart with the number of nodes in the community which has been shown in Figure 15. The results of this figure show that with the increase in the number of nodes in the community, the average degree and clustering coefficient of nodes in the network will fluctuate to some extent, but the overall trend will decline with the increase in the number of nodes.
Finally, we calculate the average and variance of the number of nodes in all different types of communities, and the results are shown in Table 3. From Table 3, we can see that the average number of nodes in large-scale communities is 217.63, about 10 times the average number of nodes in all communities and about 20 times the average number of nodes in small-scale communities. The variance of the number of community nodes is the largest among all variances, which is also in line with expectations. The above calculation results show that the number of large-scale communities in the shareholder projected network is small. Most of the communities are small-scale and the scale of large-scale communities is far larger than that of small-scale communities. Therefore, only a small number of shareholders have similar portfolios of stocks, while most shareholders have different holdings of stocks.

4.2. Stock Projected Network

4.2.1. Community Division of Stock Projected Network

We also use the Louvain algorithm to divide the community of the stock projected network. When the resolution is 1, we divide the community of the stock projected network, as shown in Figure 16 below. The communities with fewer nodes are gray, while the communities with more nodes use various color tags to distinguish. A total of 317 communities were divided, including 249 communities with only one isolated node.

4.2.2. Community Structure Analysis of Stock Projected Network

Based on the above community division results, we conducted an in-depth analysis of 68 communities with multiple nodes. Based on each community, we obtain an independent sub-network by retaining the nodes and connections within the community and removing the connections between nodes in different communities. Then, we discuss these 68 community sub-networks.
By calculating the proportion of the number of nodes in each community in the total number of stock nodes, we find that there are 38 communities where the proportion of the number of stock nodes in the total number of stock nodes in the community sub-network is less than or equal to 1%, while there are 30 communities where the proportion is greater than 1%. Similarly, we define the former as a small-scale community and the latter as a large-scale community. Then, we conduct statistical analysis on these two types of communities.
First, we consider small-scale communities. By observing the sub-networks of different communities, we find that 29 of the 38 small-scale communities contain only two nodes and only one connecting edge. The average degree of this structure is 1, the clustering coefficient is 0, and there is no aggregation feature. In addition, for the remaining nine communities, we also calculate the average degree and clustering coefficient of each community, present the average degree and clustering coefficient results of all 38 small-scale communities in the right figure of Figure 17. It can be seen from the above results that the node clustering coefficient of small communities is 0 and the average degree of nodes is also small.
Then, we consider 30 large-scale communities. We calculate the average degree and clustering coefficient of nodes in each community. It is found that the clustering coefficient of large-scale communities is still low and the average degree is also small. The value is only slightly higher than the average degree and clustering coefficient of small communities (see the left figure of Figure 17 for specific results).
Finally, we calculate the proportion of the number of community nodes of two different types in the total number of stock nodes and the results are shown in Figure 18. One block of 18% represents the sum of the number of all small-scale community nodes in the total number of stock nodes, while each other block represents the proportion of the number of a large-scale community node in the total number of stock nodes. The figure shows that there is no significant difference in the number of nodes in all large-scale communities, and the number of nodes in each community is between 2% and 4% of the total number of stock nodes.
All the above results show that the number of large-scale communities in the stock projected network is very small. Most of the communities are small-scale communities, even lonely nodes. Even large-scale communities are relatively small. Therefore, the allocation of the top ten shareholders of most stocks is obviously different, or even completely different. Only a small part of the stocks will form several small sets, and each set contains only a small number of stocks. Their top ten shareholder allocation has certain similarities with each other.

4.2.3. Comparison between Stock Projected Network with Shareholder Node Degree 2 and Original Stock Projected Network

From the statistically validated network model, we can see that the stock projected network is composed of different projected sub-networks, and these projected networks are obtained from the projection of the shareholder-stock bipartite network with the same shareholder degree. Next, we will discuss the community structure of the stock projected network whose shareholder degree is 2 in Table 2 and compare it with the original stock projected network.
From the results in Section 3.2.2, we can obtain the stock protected sub-network with a shareholder degree of 2. Through calculation, we find that the stock projected sub-network contains 1800 stock nodes, 910 edges, and an average degree of 1.517, and the clustering coefficient is 0.01. The original stock projected network contains 1993 stock nodes, 2537 edges, an average degree of 2.545, and a clustering coefficient of 0.132. The results show that the stock projected sub-network with a shareholder node degree of 2 has most of the nodes of the original stock projected network, but the edges are less reserved. Therefore, most of the stocks have a shareholder whose node degree is 2, while there are more shareholders whose node degree is not 2.
Later, we also use the Louvain algorithm to divide the stock projected sub-network with a shareholder degree of 2 into communities. The resolution is still set to 1 and the network is divided into 315 communities, including 250 single-node communities. The results are shown in Figure 19. The communities with fewer nodes are gray, while the communities with more nodes are distinguished by various color tags. We first exclude the single-node communities and then calculate the proportion of the number of nodes in the remaining communities to the total stock nodes. There are 37 small communities with a proportion of the number of community stock nodes less than or equal to 1 % , and 29 large communities with a proportion of the number of stock nodes greater than 1 % .
We compare the community division results obtained above with those of the original stock projected network, as shown in Table 4. Among them, the stock projected sub-network with a shareholder degree of the number of 2 is divided into 315 communities, which is only two different from the original stock projected network. In addition, the numbers of single-node communities, small-scale communities, and large-scale communities are also very close, with a difference of 1. The similarity of community structure roughly indicates that the connection information contained in two projected networks is similar. This result shows that the shareholder-stock bipartite network with a shareholder degree of 2 can basically reflect the similarity of investment of the top ten shareholders of most stocks in the original shareholder-stock bipartite network. This phenomenon is also reasonable from the theoretical analysis because, in the original shareholder-stock bipartite network, the shareholder node degree of 1 means that there are no identical shareholders among the stocks invested by these shareholders. In such case, the stock projected sub-network cannot be obtained according to the bipartite network with shareholder node degree of 1. However, the number of shareholders with a node degree greater than 2 in the original shareholder-stock bipartite network is very small as a whole, so the scale of the stock-protected sub-network obtained is also quite small. A statistically validated network model is used to build the stock projected network by projecting and merging the bipartite networks with different shareholder degrees. Therefore, the stock projected sub-network obtained by the shareholder-stock bipartite network with shareholder degrees of 2 does have a strong structural similarity with the stock projected network obtained by the original shareholder-stock bipartite network. All the above conclusions also reflect the effectiveness of using a statistically validated network model to research the shareholder-stock bipartite network in this paper.

5. Conclusions

This paper establishes the shareholder-stock bipartite network based on the data of 1993 stocks in the Shanghai A-share market and 16,513 major shareholders holding these stocks on 30 June 2021 and analyzes the topology of the network to explore the structural characteristics of overlapping portfolios among different shareholders, as well as similar shareholder allocation structures between different stocks.
First, we used a statistically validated network model to establish the shareholder projected network and stock projected network on the basis of the shareholder-stock bipartite network, and analyzed the structural characteristics of those two projected networks. In the shareholder projected network, nearly two-thirds of the shareholder nodes were only connected with several other nodes to form a small isolated sub-network, and only nearly one-third of the shareholder nodes showed strong aggregation. This shows that most shareholders only hold overlapping stocks with a few other shareholders. The aggregation coefficient of the network was large and the degree of nodes shows the characteristics of power rate distribution, which meets the characteristics of scale-free networks and small-world networks. In addition, in the stock projected network, the connection between most nodes was relatively sparse, while the connection between only a small number of nodes was relatively tight. The average degree and clustering coefficient of the network were low, and the aggregation was small. The degree of most nodes in the network was small, and the highest frequency occurred when the node degree was 2. Therefore, the overlap of shareholder allocation among most stocks is low, and only a small number of stocks have the same shareholders.
Subsequently, we divided the shareholder projected network into 604 communities, including 250 communities formed by isolated nodes. In the shareholder projected network, the average degree and clustering coefficient of nodes in the largest community were both large, the average path of the network was short, and the degree distribution of nodes presents the characteristics of power distribution. The PR value ranking of all nodes of the largest community in the sub-network is highly consistent with that in the original network, reflecting the effectiveness of the community division method. In addition, the number of nodes in all communities of the shareholder projected network also showed a power-law distribution. According to whether the percentage of the number of nodes in the community to the total number of shareholder nodes was greater than 1%, we divided all communities into large-scale communities and small-scale communities. We found that the average degree and clustering coefficient of nodes all showed a downward trend with the increase in the number of nodes in the 33 community, although they will fluctuate to some extent. By comparing the average and variance of the number of nodes in all large-scale communities and small-scale communities, it was found that the number of large-scale communities is small. Most of the communities are small-scale and the scale of large-scale communities is far larger than that of small-scale communities. Therefore, only a small number of shareholders have similar portfolios of stocks, while most shareholders have different holdings of stocks.
Then, the stock projected network was divided into 317 communities, including 249 communities with only one isolated node. Similarly, according to whether the percentage of the number of nodes in the community to the total number of stock nodes was greater than 1%, we divided the communities of the stock projected network into large-scale communities and small-scale communities. In addition to the community composed of a single isolated node, there were 30 large-scale communities and 38 small-scale communities in the remaining 68 communities. In the community division results of the stock projected network, the clustering coefficients and average degree of large-scale communities and small-scale communities were all low. Compared to small-scale communities, the clustering coefficient of large-scale communities is slightly higher. Then, the total number of nodes of large-scale communities and small-scale communities was compared and analyzed. The results show that the number of large-scale communities in the stock projected network is very small. Most of the communities are small-scale communities, even with lonely nodes. Even for large-scale communities, their scale is still relatively small, and the number of nodes in each community is between 2% and 4% of the total number of stock nodes. Therefore, the allocation of the top ten shareholders of most stocks is obviously different, or even completely different. Only a small number of stocks will form several small sets, and each set contains only a few stocks whose top ten shareholders have certain similarities with each other.
Finally, we separately analyzed the stock projected sub-network obtained from the bipartite network with a shareholder degree of 2 in the shareholder-stock bipartite network. By comparing the community division result of the stock projected sub-network with that of the original stock projected network, we found that they are very close. Such a result shows that the stock projected network obtained from the shareholder-stock bipartite network with a shareholder degree of 2 has a strong structural similarity with the stock projected network obtained from the original shareholder-stock bipartite network, which is also in line with the theoretical analysis that the shareholder-stock bipartite network with a shareholder degree of 2 can basically reflect the similarity of the structure of the top ten shareholders of most stocks in the original shareholder-stock bipartite network. Thus, the effectiveness of the statistically validated network model and community division method in the research of shareholder-stock bipartite networks is further confirmed.
In the future, if more data in other markets are available, we will try to compare the network structure of different markets to determine whether there are any commonalities or differences in the way shareholders allocate their portfolios. Moreover, we will conduct further research to explore how the network structure affects corporate governance and the quality of decision-making. In addition, it will be valuable to explore the dynamics of the shareholder-stock bipartite network by analyzing the formation and dissolution of communities and identifying key drivers of network evolution. In the follow-up study, more methods, such as longitudinal analysis and multi-layer network analysis, will be applied to study the implications of the network structure of the shareholder-stock bipartite network for financial regulation, including identifying potential areas of systemic risk and designing regulatory interventions to mitigate these risks.

Author Contributions

Methodology, R.L.; Software, R.L.; Formal analysis, Y.H.; Resources, Y.H.; Writing—original draft, R.L.; Writing—review & editing, Y.H. All authors have read and agreed to the published version of the manuscript.

Funding

This work was supported by the Innovation and Entrepreneurship Project for College Students of Beijing Forestry University(X202110022198).

Data Availability Statement

Wind Information.

Conflicts of Interest

The authors declare no conflict of interest.

References

  1. Onnela, J.P.; Chakraborti, A.; Kaski, K.; Kertesz, J. Dynamic asset trees and Black Monday. Phys. A Stat. Mech. Appl. 2003, 324, 247–252. [Google Scholar] [CrossRef] [Green Version]
  2. Brida, J.G.; Risso, W.A. Multidimensional minimal spanning tree: The Dow Jones case. Phys. A Stat. Mech. Appl. 2008, 387, 5205–5210. [Google Scholar] [CrossRef]
  3. Huang, W.Q.; Zhuang, X.T.; Yao, S. A network analysis of the Chi nese stock market. Phys. A Stat. Mech. Appl. 2009, 388, 2956–2964. [Google Scholar] [CrossRef]
  4. Classerman, P.; Young, H.P. How likely is contagion in financial networks? J. Bank. Financ. 2015, 50, 383–399. [Google Scholar] [CrossRef] [Green Version]
  5. Newman, M.E.J. The structure of scientific collaboration networks. Proc. Natl. Acad. Sci. USA 2015, 98, 404–409. [Google Scholar] [CrossRef]
  6. Watts, D.J.; Strogatz, S.H. Collective dynamics of ’small-world’ networks. Nature 1998, 393, 440–442. [Google Scholar] [CrossRef]
  7. Huang, Y.; Liu, T.; Lien, D. Portfolio homogeneity and systemic risk of financial networks. J. Empir. Financ. 2023, 70, 248–275. [Google Scholar] [CrossRef]
  8. Huang, Y.; Liu, T. Diversification and Systemic Risk of Networks Holding Common Assets. Comput. Econ. 2023, 61, 341–388. [Google Scholar] [CrossRef]
  9. Tumminello, M.; Micciche, S.; Lillo, F.; Piilo, J.; Mantegna, R.M. Statistically Validated Networks in Bipartite Complex Systems. PLoS ONE 2011, 6, e17994. [Google Scholar] [CrossRef] [Green Version]
  10. Huang, W.Q.; Zhuang, X.T.; Yao, S. Analysis of Topological Properties and Cluster Structure of China’s Stock Association Network. Manag. Sci. 2008, 21, 94–103. [Google Scholar]
  11. Girvan, M.; Newman, M.E.J. Community structure in social and biological networks. Proc. Natl. Acad. Sci. USA 2002, 99, 7821–7826. [Google Scholar] [CrossRef] [Green Version]
  12. Newman, M.E.J. Fast algorithm for detecting community structure in networks. Phys. Rev. E 2004, 69, 066133. [Google Scholar] [CrossRef] [PubMed] [Green Version]
  13. Cheng, X.Q.; Ren, F.X.; Zhou, S.; Hu, M.B. Triangular clustering in document networks. New J. Phys. 2009, 11, 1–11. [Google Scholar] [CrossRef]
  14. Luo, Z.; Ding, F.; Jiang, X.; Shi, J.L. New progress on community detection in complex networks. J. Natl. Univ. Def. Technol. 2011, 33, 47–52. [Google Scholar]
  15. Derry, J.; Mangravite, L.; Suver, C.; Furia, M.; Henderson, D.; Schildwachter, X.; Izant, J.; Sieberts, S.; Kellen, M.; Friend, S. Developing predictive molecular maps of human disease through community-based modeling. Nat. Prec. 2011, 44, 30–127. [Google Scholar] [CrossRef]
  16. Papadopoulos, S.; Kompatsiaris, Y.; Vakali, A.; Spyridonos, P. Community detection in social media. Data Min. Knowl. Discov. 2012, 24, 515–554. [Google Scholar] [CrossRef]
  17. Bedi, P.; Sharma, C. Community detection in social networks. Wiley Interdiscip. Rev. Data Min. Knowl. Discov. 2016, 6, 115–135. [Google Scholar] [CrossRef]
  18. Johnson, N.F.; Zheng, M.; Vorobyeva, Y.; Gabriel, A.; Qi, H.; Velásquez, N.; Manrique, P.; Johnson, D.; Restrepo, E.; Song, C.; et al. New online ecology of adversarial aggregates: ISIS and beyond. Science 2016, 352, 1459–1463. [Google Scholar] [CrossRef] [Green Version]
  19. Newman, M.E.J.; Girvan, M. Finding and evaluating community structure in networks. Phys. Rev. E 2004, 69, 026113. [Google Scholar] [CrossRef] [Green Version]
  20. Duch, J.; Arenas, A. Community detection in complex networks using extremal optimization. Phys. Rev. E 2005, 72, 1–4. [Google Scholar] [CrossRef] [Green Version]
  21. Agarwal, G.; Kempe, D. Modularity-maximizing graph communities via mathematical programming. Eur. Phys. J. B 2008, 66, 409–418. [Google Scholar] [CrossRef] [Green Version]
  22. Fortunato, S.; Barthelemy, M. Resolution limit in community detection. Proc. Natl. Acad. Sci. USA 2007, 104, 36–41. [Google Scholar] [CrossRef] [Green Version]
  23. Rosvall, M.; Bergstrom, C.T. An information-theoretic framework for resolving community structure in complex networks. Proc. Natl. Acad. Sci. USA 2007, 104, 7327–7331. [Google Scholar] [CrossRef] [Green Version]
  24. Ruan, J.H.; Zhang, W.X. Identifying network communities with a high resolution. Phys. Rev. E 2008, 77, 1–14. [Google Scholar] [CrossRef] [Green Version]
  25. Li, Z.; Zhang, S.; Wang, R.S.; Zhang, X.S.; Chen, L. Quantitative function for community detection. Phys. Rev. E 2008, 77, 1–9. [Google Scholar] [CrossRef]
  26. Blondel, V.D.; Guillaume, J.L.; Lambiotte, R. Lefebvre, E. Fast unfolding of communities in large networks. J. Stat. Mech. Theory Exp. 2008, 2008, P10008. [Google Scholar] [CrossRef] [Green Version]
  27. Miller, R.G. Simultaneous Statistical Inference, 3rd ed.; Springer: New York, NY, USA, 1981; Volume 10, pp. 415–416. [Google Scholar]
  28. Benjamini, Y.; Hochberg, Y. Controlling the false discovery rate: A practical and powerful approach to multiple testing. J. R. Stat. Soc. B 1995, 57, 289–300. [Google Scholar] [CrossRef]
  29. Huang, Y.; Chen, F. Community Structure and Systemic Risk of Bank Correlation Networks Based on the U.S. Financial Crisis in 2008. Algorithms 2021, 14, 162. [Google Scholar] [CrossRef]
  30. Bonacich, P.F. Factoring and Weighting Approaches to Status Scores and Clique Identification. J. Math. Sociol. 1972, 2, 113–120. [Google Scholar] [CrossRef]
  31. Kitsak, M.; Gallos, L.K.; Havlin, S.; Liljeros, F.; Muchnik, L.; Stanley, H.E.; Makse, H.A. Identification of influential spreaders in complex networks. Nat. Phys. 2010, 6, 888–893. [Google Scholar] [CrossRef] [Green Version]
  32. Brin, S.; Page, L. The anatomy of a large-scale hypertextual web search engine. ScienceDirect 1998, 30, 107–117. [Google Scholar] [CrossRef]
Figure 1. Graphical representation of a shareholder-stock bipartite network.
Mathematics 11 01545 g001
Figure 2. Graphical representation of a simple shareholder projected network.
Mathematics 11 01545 g002
Figure 3. Shareholder projected sub-network of bipartite sub-network with stock node degree of 9 s.
Mathematics 11 01545 g003
Figure 4. Shareholder projected sub-network of bipartite sub-network with stock node degree of 10 s.
Mathematics 11 01545 g004
Figure 5. Total shareholder projected network obtained from the original shareholder-stock bipartite network.
Mathematics 11 01545 g005
Figure 6. Total stock projected network obtained from the original shareholder-stock bipartite network.
Mathematics 11 01545 g006
Figure 7. The frequency distribution diagram of node degree and the fitting curve of shareholder projected network.
Mathematics 11 01545 g007
Figure 8. Scatter graph of node degree frequency of stock projected network.
Mathematics 11 01545 g008
Figure 9. The result of community structure division of shareholder projected network.
Mathematics 11 01545 g009
Figure 10. Sub-network of the largest community.
Mathematics 11 01545 g010
Figure 11. Comparison of PR value of all nodes in the largest community sub-network with those in the original shareholder projected network.
Mathematics 11 01545 g011
Figure 12. The frequency distribution diagram of node number of all communities and the fitting curve.
Mathematics 11 01545 g012
Figure 13. Insert two pictures side by side.
Mathematics 11 01545 g013
Figure 14. Sub-network of the other large-scale communities except the largest community.
Mathematics 11 01545 g014
Figure 15. Change of average degree and clustering coefficient with number of nodes in large-scale communities.
Mathematics 11 01545 g015
Figure 16. Community structure division of stock projected network.
Mathematics 11 01545 g016
Figure 17. Comparison of average degree and agglomeration coefficient of large-scale and small-scale communities.
Mathematics 11 01545 g017
Figure 18. Proportion of nodes in large-scale and small-scale communities.
Mathematics 11 01545 g018
Figure 19. Community division results of stock projected network with shareholder node degree of 2.
Mathematics 11 01545 g019
Table 1. Original data of some stocks and their ten major shareholders.
Stock Name (Code)Ten Major Shareholders
SPD Bank 1 (600,000.SH)Shanghai International Group Co., Ltd.
China Mobile Group Guangdong Co., Ltd.
Fude Life Insurance Co., Ltd.—Traditional
Fude Life Insurance Co., Ltd.—capital
Shanghai SDIC Asset Management Co., Ltd.
Fude Life Insurance Co., Ltd.—Universal H
China Securities Finance Co., Ltd.
Shanghai Guoxin Investment Development Co., Ltd.
Hong Kong Central Clearing Co., Ltd. (Lugutong)
Central Huijin Asset Management Co., Ltd.
Huaneng International (600,011.SH)Huaneng International Power Development Company
Hong Kong Central Clearing (Agent) Co., Ltd.
China Huaneng Group Co., Ltd.
Hebei Construction Investment Group Co., Ltd.
China Huaneng Group Hong Kong Co., Ltd.
China Securities Finance Co., Ltd.
Jiangsu Guoxin Group Co., Ltd.
Liaoning Energy Investment (Group) Co., Ltd.
Fujian Investment and Development Group Co., Ltd.
Dalian Construction Investment Group Co., Ltd.
1 SPD Bank is the abbreviation of Shanghai Pudong Development Bank.
Table 2. The size of shareholder-stock bipartite sub-network divided by the degree of shareholder nodes.
Shareholder Node DegreeNumber of ShareholdersCorresponding Number of Stocks
113,9581980
29411203
3248602
495340
574317
650265
724141
81395
917138
10984
11444
12782
13565
14570
15230
16464
17117
18236
23246
24124
26126
27254
29258
30130
37137
42284
1051105
1341134
1371137
4661466
Table 3. Statistical analysis of different types of community sets.
CommunityMean of the Number of NodesVariance of the Number of Nodes
AL 125.776490078023.064282
EM 222.860690522901.25091
DM 3217.63636362103.807163
DI 411.58421053632.8744875
1 AL means all communities. 2 EM means all communities except the largest. 3 DM means all large-scale community. 4 DI means all small-scale community.
Table 4. Comparison of the numbers of communities.
A 1B 2
Total317318
Single Node249251
Small-scale communities3836
Large-scale communities3031
1 Stock projected network. 2 projected network of stock investment with shareholder degree of 2.
Disclaimer/Publisher’s Note: The statements, opinions and data contained in all publications are solely those of the individual author(s) and contributor(s) and not of MDPI and/or the editor(s). MDPI and/or the editor(s) disclaim responsibility for any injury to people or property resulting from any ideas, methods, instructions or products referred to in the content.

