Article

Fuzzy Method Based on the Removal Effects of Criteria (MEREC) for Determining Objective Weights in Multi-Criteria Decision-Making Problems

by
Mohamad Shahiir Saidin
1,
Lai Soon Lee
1,2,*,
Siti Mahani Marjugi
1,
Muhammad Zaini Ahmad
3 and
Hsin-Vonn Seow
4
1
Department of Mathematics and Statistics, Faculty of Science, Universiti Putra Malaysia, Serdang 43400, Selangor, Malaysia
2
Laboratory of Computational Statistics and Operations Research, Institute for Mathematical Research, Universiti Putra Malaysia, Serdang 43400, Selangor, Malaysia
3
Institute of Engineering Mathematics, Universiti Malaysia Perlis, Pauh Putra Main Campus, Arau 02600, Perlis, Malaysia
4
Nottingham University Business School, Faculty of Arts and Social Sciences, University of Nottingham Malaysia, Semenyih 43500, Selangor, Malaysia
*
Author to whom correspondence should be addressed.
Mathematics 2023, 11(6), 1544; https://doi.org/10.3390/math11061544
Submission received: 15 February 2023 / Revised: 18 March 2023 / Accepted: 21 March 2023 / Published: 22 March 2023
(This article belongs to the Special Issue Multi-Criteria Decision Making Methods and Their Applications)

Abstract

:
In multi-criteria decision-making (MCDM) research, the criteria weights are crucial components that significantly impact the results. Many researchers have proposed numerous methods to establish the weights of the criterion. This paper provides a modified technique, the fuzzy method based on the removal effects of criteria (MEREC) by modifying the normalization technique and enhancing the logarithm function used to assess the entire performance of alternatives in the weighting process. Since MCDM problems intrinsically are ambiguous or complex, fuzzy theory is used to interpret the linguistic phrases into triangular fuzzy numbers. The comparative analyses were conducted through the case study of staff performance appraisal at a Malaysian academic institution and the simulation-based study is used to validate the effectiveness and stability of the presented method. The results of the fuzzy MEREC are compared with those from a few different objective weighting techniques based on the correlation coefficients, outlier tests and central processing unit (CPU) time. The results of the comparative analyses demonstrate that fuzzy MEREC weights are verified as the correlation coefficient values are consistent throughout the study. Furthermore, the simulation-based study demonstrates that even in the presence of outliers in the collection of alternatives, fuzzy MEREC is able to offer consistent weights for the criterion. The fuzzy MEREC also requires less CPU time compared to the existing MEREC techniques. Hence, the modified method is a suitable alternative and efficient for computing the objective criteria weights in the MCDM problems.

1. Introduction

Multi-criteria decision-making (MCDM) is a well-known multidisciplinary field in operations research. Terms such as multi-attribute decision making (MADM) and multi-objective decision making (MODM) have been used to describe the classification of MCDM [1]. The most frequently used terminologies are MADM and MCDM, both of which belong to the same class model. MODM problems often deal with the issues of selecting an optimal solution from a group of practical solutions, while considering numerous objectives and several constraints, parameters, and variables. Approaches to solving MODM problems frequently involve solving linear and nonlinear programming models. Additionally, MCDM or MADM concentrates on problems with discrete decision spaces, where the numbers of alternative decisions and attributes are fixed [2,3,4,5,6]. The study of this paper is primarily concerned with this subset of MCDM.
The necessity of evaluating a finite number of alternatives while considering multiple and contradictory qualities might arise in practical situations [7,8,9,10]. In this case, the supplementary information of decision makers is gathered, together with the crucial data, and merged into a decision matrix. The decision matrix includes assessments of several options depending on the criteria that are utilized to choose one or more alternatives for the final ranking, screening, and selection [7].
There are numerous proposed MCDM techniques and algorithms that have been applied in various problems. Sawik et al. [11] proposed combining simulation and optimization to deal with the automated parcel locker (APL) network. Concerning this matter, the multiple criteria simulation–optimization model, which examines the evolution of the population, e-shoppers, APL users, and parcel demand, is based on agent-based modeling, which can determine the number and position of APLs. Another study proposed by Dönmez et al. [12] assesses the effectiveness of the most widely used multi-objective programming scalarization techniques in the literature when applied to the aircraft sequencing and scheduling problem (ASSP). These techniques include the weighted sum approach, weighted goal programming, the ϵ -constraint method, the elastic constraint method, weighted Tchebycheff, and augmented weighted Tchebycheff. The presented methods could provide more effective air traffic control in terminal maneuvering regions when numerous objectives need to be optimized.
A methodology was developed by Lad et al. [13] for prioritizing the bridges to improve their resilience for bridge resilience assessment. The methodology is divided into three phases: (i) determine criteria importance through intercriteria correlation (CRITIC) technique to compute the criteria weights, (ii) evaluate the prioritization of each bridge using five techniques, including the technique for order of preference by similarity to the ideal solution, VIKOR (Vise Kriterijumska Optimizacija I Kompromisno Resenje), additive ratio assessment, complex proportional assessment and multi-objective optimisation method by ratio analysis, and (iii) integrate the results of all five techniques using CRITIC and the weighted sum method. In the first phase, the determination of criteria importance is related to the study of this paper. A number of techniques have been developed to find criteria weights. These techniques can be divided into three groups: subjective, objective, and hybrid weighting approaches. The method presented in this paper could potentially be applied to the methodology of bridge resilience assessment, as it falls into the same category as the CRITIC technique, which is a form of the objective weighting technique. In this matter, the components that required by presented objective weighting technique are the elements of decision matrix generated from the evaluation of alternatives based on specified criteria.
In a recent 2021 study, a novel objective weighting technique called MEREC (method based on the removal effects of criteria) was proposed to determine the criteria weights [14]. In order to determine the weights, this method takes advantage of changes in each alternative’s performance for each criterion. The criterion with more variants is given higher weight [15]. In order to determine criteria weights, the method considers how each criterion’s removal will affect the performance of the alternatives overall. When removing a criterion significantly affects the overall performance of the alternatives, it is given more weight. However, this method only focuses on the crisp evaluation in which the data of the decision matrix are in the form of numerical values. The decision makers always find it difficult to measure the alternative due to the fact that the evaluation process is carried out in a variety of situations, where it is challenging to exactly assess performance ratings and weights. Decision makers also tend to make strong predictions for qualitative forecasting but struggle with quantitative problem solving. The utilized logarithmic function is a little more complicated than necessary, which increases the time needed to finish the evaluation process and also requires a revision.
Thus, this study enhances the previous weighting method by applying the fuzzy set theory to the evaluation process. This theory is applied in this situation because decision makers must deal with human judgment variability during the evaluation process. This occurs, for example, when evaluating qualitative attributes, such as character, teamwork and innovation typically described in uncertainty and with subjective information. Therefore, it is evident that using a fuzzy technique will help to tackle this issue. This study improves the previous algorithms by modifying the normalization technique and presenting the enhanced logarithm function to measure the overall performance of alternatives.
In order to investigate the method computationally and make comparisons with various other methods of objective weighting, a numerical example is employed. Additionally, by comparing the results of the fuzzy MEREC with those of the previous techniques, a simulation-based study was performed to conduct a more thorough comparison. The normal distribution is used to provide symmetrical data for the analysis. The outlier test is deployed to exhibit the stability of the fuzzy MEREC results in determining the criteria weights for the simulation results. The findings of the comparative analysis indicate that the weights generated by the fuzzy MEREC are comparable to other objective weighting methods. Furthermore, the analysis shows that the fuzzy MEREC may provide consistent weights for the criteria, even when there are outliers in the set of alternatives.
The remainder of this paper is organized as follows. Section 2 discusses a few related works. The studies on the use of objective weighting methods and their current reviews are covered in Section 3. Fuzzy MEREC is presented in detail in Section 4. Using computational analysis, Section 5 investigates the proposed methodology by presenting the findings of a comparison between the fuzzy MEREC and other objective weighting techniques (MEREC, entropy, and statistical variance) using an MCDM problem. Results from the simulation-based analysis are presented, where they are used to assess the stability, accuracy, and reliability of the findings produced by fuzzy MEREC. Finally, conclusions are discussed in Section 6.

2. Related Works

2.1. MCDM Methods

MCDM techniques have been used to assess, choose, and rank a variety of criteria [16]. The MCDM technique is a qualitative evaluation that places a strong emphasis on the subjective nature of criteria. Information about the chosen criteria and the preferred criteria must be provided [17]. Due to resource constraints, MCDM enables decision makers to identify the components of the variables that produce the ideal operating environment [18]. Due to its efficacy in solving decision-related problems, this methodology has been used in a wide range of sectors. Numerous improvements have been made to the approach in recent years.
In the literature, many MCDM methodologies and procedures have been proposed. AHP (analytic hierarchy process), PROMETHEE (Preference Ranking Organization Method for Enrichment of Evaluations), VIKOR, WASPAS (Weighted Aggregated Sum Product Assessment), WSM (weighted sum model), TOPSIS (Technique for Order of Preference by Similarity to Ideal Solution), EDAS (Evaluation based on Distance from Average Solution), BWM (best–worst method), COPRAS (complex proportional assessment), and ELECTRE (Elimination Et Choix Traduisant la Realité) are a few of the well-known MCDM techniques that have been employed by numerous scholars across various fields of study [19,20,21,22,23,24].
Among the other MCDM techniques that have been the focus of researchers recently are the multi-granularity computing method and the graph method. In their work to deal with practical risk-based uncertain group decision making issues, Zhang et al. [25] extended the idea of multigranulation decision–theoretic rough sets into the hesitant fuzzy linguistic environment within the two-universe model. Due to excessive information fusion rules and the instability of the information analysis mechanisms, the methods from granular computing (GrC) generally lack sufficient semantic interpretations for multi-attribute group decision making (MAGDM). So, Zhang et al. [26] used a standard GrC framework called multigranulation probabilistic models to improve the semantics of GrC-based MAGDM techniques. Three-way decisions (3WD) have been intensively researched in addressing realistic MADM due to their capabilities in reducing decision risks with the addition of the non-commitment option. Since the existing 3WD model cannot effectively deal with the MADM issue with an incomplete high-order fuzzy information system, Zhang et al. [27] concentrated on the study of a feasible MAGDM approach based on the multi-granularity 3WD paradigm under an incomplete Pythagorean fuzzy environment.
It is essential to provide corresponding information analysis tools for MADM in dual hesitant fuzzy (DHF) information systems. This is because in the real world, dual hesitant fuzzy sets (DHFSs) serve as an important mechanism for measuring hesitant and imprecise information that are significant elements of information depicting the MADM. Furthermore, when expressing correlations between attributes via edges between vertices in fuzzy information systems, the idea of fuzzy graphs (FGs) performs well, providing the ability to address correlational MADM problems. Thus, Bai et al. [28] used this opportunity to explore FGs in the DHF environment, and further studied effective ways to deal with difficult MADM circumstances. Linguistic quantization is a crucial component of decision making, and numerous techniques as well as areas of study are directed to minimize the semantic loss linguistic quantization produces. In addition, the directed graph (digraph) is a data structure that has a high degree of universality and scalability, allowing the model to be applied to various areas of group decision making. To prevent linguistic quantization, Fu et al. [29] proposed using a group decision-making method based on a digraph, and conducting decision analysis in the direction of hesitant fuzzy sets using the weight of the digraph.
When using MCDM approaches, there are typically four steps involved in the evaluation process: (i) identifying the alternatives and criteria pertinent to the issue, (ii) calculating the weight of each criterion, (iii) assessing the alternatives’ performance in relation to the criteria function, and (iv) measure the alternatives depending on their overall performance relative to all criteria [30,31]. The second step, (ii), is the main subject of this paper.

2.2. Weight Determination Methods

2.2.1. Subjective Weight

Most researchers utilize criteria weight when tackling MCDM issues. According to Baker et al. [32], assigning weights to each criterion has benefits and drawbacks. The benefit is that decision makers can explain the relative weightage of the criteria. Applying various weightages based on various viewpoints can help people comprehend the potential power of the solution. Weighting has the drawback of being constrained by the knowledge and potential bias of those doing the weighting itself. The decision makers also have difficulty maintaining consistency when performing evaluations, as it depends on their perception. Although the criteria weight is optional for alternative selection methods, it can assist in making complex selections because all criteria are unlikely to have the same importance value.
Theoretically, each criterion is distinctive in having a certain significance and importance. For instance, when selecting employees, the knowledge, abilities, and competences criteria may be heavily weighted. Although the other criteria are also important when selecting employees, in this case, the former criteria are more significant than the others. Humans naturally provide a variety of opinions during the review process. Due to this situation, researchers have introduced and generalized various mathematical techniques for determining the weight of a criteria. The techniques for obtaining criteria weights are varied. According to recent studies, subjective, objective, and hybrid weighting methods are the three categories into which these techniques can be classified [33,34,35,36].
The decision-makers’ assessments and preferences are the sole basis for determining the subjective weights [37,38,39]. In general, the term “subjective weighting” refers to the action of allocating subjective preferences to the decision criteria that are established depending by the decision-makers’ perception, knowledge and technical skills [40]. The weighted least square method, eigenvector method, AHP method, direct ranking, Delphi method, pairwise comparisons, point allocation, and SMART (Simple Multi-attribute Ranking Technique) are frequently used to measure subjective weight [15,41,42,43,44]. The principal weakness in these techniques is that they progressively lose their effectiveness once the number of criteria increases, meaning that decision makers have to use their thoughts to describe their preferences, and having additional criteria makes these decisions less precise [31].

2.2.2. Objective Weight

The determination of criteria weights in objective weighting approaches is not influenced by the decision-makers’ preferences [15,45]. Using a decision matrix, objective weighting methods produce criteria weights through a particular computing technique. Since objective weight is based on a quantitative evaluation, its accuracy is undeniable, and using it is practical and reliable. It is also generally agreed that using subjective weight can be helpful in everyday situations. This is because challenges with decision making always include the utilization of vague and ambiguous information that are based on human judgments. However, the objective weight is preferred when a credible subjective weight cannot be determined, or the decision-makers’ preferences significantly impact the outcomes [40,46]. Additionally, employing the objective weight can help circumvent some constraints of subjective weighting [39]. Numerous researchers have suggested objective weighting techniques, such as the entropy method, linear goal-programming technique, statistical variance method, standard deviation method, SECA (Simultaneous Evaluation of Criteria and Alternatives), and CRITIC (Criteria Importance Through Inter-criteria Correlation) [15,47,48,49,50,51].
One of the objective weighting techniques that are frequently employed in MCDM situations is Shannon’s entropy. It is a generic measure of informational uncertainty developed using the probabilistic model [52]. For assessing the relative intensity of distinct criteria that exhibit the ordinary intrinsic information given to the decision makers, Shannon’s entropy is best suited [53]. Shannon developed a basic explanation of entropy measure in information theory after Shannon and Weaver [54] proposed this idea for the first time in communication theory [55]. Numerous fields, including mathematics [56], spectrum analysis [57] and economics, have used this idea [58].
In addition, several researchers have of late employed the statistical variance method as an objective weighting method. Rao and Patel [49] suggested this technique for the problem of material selection. The statistical variance concept of determining the criteria weight is significantly easier to understand than the entropy technique because it requires less computation [59]. The studies by Singh and Kumar [60], Mahapatara et al. [61], and Mohanty and Mahapatra [62] all attest to its integrity.

2.2.3. Hybrid Weight

Considering the significance of subjective and objective weights, some researchers have blended and integrated both to establish a hybrid weighting technique. The hybrid methods could deliver more precise weights since they consider both the perceptions of the decision makers and the information from the decision matrix [63,64,65,66]. The decision-makers’ preferences and judgments must be used in all discussed ways to assess the importance of each criterion’s weight. Each approach has pros and cons and can be effective in various circumstances.

3. Preliminaries

3.1. Fuzzy Sets

Definition 1
([67]). Let M = { z 1 , z 2 , , z n } represent a set of finite discourses. A membership function μ M ( z i ) describes a fuzzy set M defined on Z as
M = { ( z i , μ M ( z i ) ) : μ M ( z i ) [ 0 , 1 ] ; z i Z } ,
where the function value μ M ( z i ) is referred to as the degree of membership of z i to M in Z.
Definition 2
([67,68]). a ˜ = ( k , l , m ) is a representation of a triangular fuzzy number (TFN) and illustrated in Figure 1. The μ a ˜ ( z ) membership function of a TFN a ˜ has the following definition:
μ a ˜ ( z ) = 0 , i f z < k , z k l k , i f k z < l , m z m l , i f l z m , 0 , i f z > m .
Definition 3
([69]). The following definitions apply to the TFN’s arithmetic operations, Φ ˜ = ( ϕ 1 , ϕ 2 , ϕ 3 ) and Ψ ˜ = ( ψ 1 , ψ 2 , ψ 3 ) , when k is a positive real number:
  • Addition: Φ ˜ ( + ) Ψ ˜ = ( ϕ 1 + ψ 1 , ϕ 2 + ψ 2 , ϕ 3 + ψ 3 ) .
  • Subtraction: Φ ˜ ( ) Ψ ˜ = ( ϕ 1 ψ 3 , ϕ 2 ψ 2 , ϕ 3 ψ 1 ) .
  • Multiplication:
    Φ ˜ ( × ) Ψ ˜ = ( min ( ϕ 1 ψ 1 , ϕ 1 ψ 3 , ϕ 3 ψ 1 , ϕ 3 ψ 3 ) , ϕ 2 ψ 2 , max ( ϕ 1 ψ 1 , ϕ 1 ψ 3 , ϕ 3 ψ 1 , ϕ 3 ψ 3 ) ) ,
    c ( × ) ϕ = ( c × ϕ 1 , c × ϕ 2 , c × ϕ 3 ) .
  • Division:
    Φ ˜ ( ÷ ) Ψ ˜ = ( min ( ϕ 1 / ψ 1 , ϕ 1 / ψ 3 , ϕ 3 / ψ 1 , ϕ 3 / ψ 3 ) , ϕ 2 / ψ 2 , max ( ϕ 1 / ψ 1 , ϕ 1 / ψ 3 , ϕ 3 / ψ 1 , ϕ 3 / ψ 3 ) ) .

3.2. Reviews of the Logarithmic Function

In information theory, Shannon and Weaver [70] were the first to establish the concept of a divergence measure. The said measure is a logarithmic function and defined as follows. Suppose that Δ n = { P = ( p 1 , p 2 , , p n ) : p i 0 , i = 1 , 2 , , n ; i = 1 n p i = 1 } , n 2 is a collection of n-complete probability distributions. The definition of entropy for any probability distribution P = ( p 1 , p 2 , , p n ) Δ n is
H ( P ) = i = 1 n p i log ( p i ) .
Following this, Kullback and Leibler [71] expanded on this idea to determine the divergence measure of P = ( p 1 , p 2 , , p n ) Δ n from Q = ( q 1 , q 2 , , q n ) Δ n as
K L ( P : Q ) = i = 1 n p i log p i q i .
Kullback [72] then came up with the following proposal for the symmetric divergence measure:
K ( P : Q ) = K L ( P : Q ) + K L ( Q : P ) = i = 1 n ( p i q i ) log p i q i .
This motivated Bhandari et al. [73] to propose the following fuzzy divergence measure of fuzzy set A F S ( X ) from fuzzy set B F S ( X ) :
I ( A , B ) = i = 1 n μ A ( x i ) log μ A ( x i ) μ B ( x i ) + ( 1 μ A ( x i ) ) log 1 μ A ( x i ) 1 μ B ( x i ) .
The second part of Equation (6) contains the logarithmic function for the measure of two sets. Inspired by that, the method presented in this study will focus on the single set, where the following logarithmic function will be used for the computations in the next section:
f ( r ) = ln ( 1 r ) ,
where r is the normalized value of the decision matrix such that r [ 0 , 1 ) and f ( r ) is the logarithmic function that is used to measure the overall performance of the alternatives.

4. The Fuzzy MEREC

The criteria weights in an MCDM problem are presented in this section using an improved approach called the fuzzy MEREC method. The fuzzy MEREC employs the removal effect of each criterion on the alternatives’ performance to determine the criteria weights, just like the original MEREC. The criteria with more significant effects on the performance will be given more weight. An enhanced logarithm function is used to determine the performance of the alternatives in this study. To assess the impacts of every criterion removal, the measure of absolute deviation is also employed, which shows the changes between the overall performance of an alternative and its performance when a criterion is removed. The details of the fuzzy MEREC method for calculating objective weights are as follows:
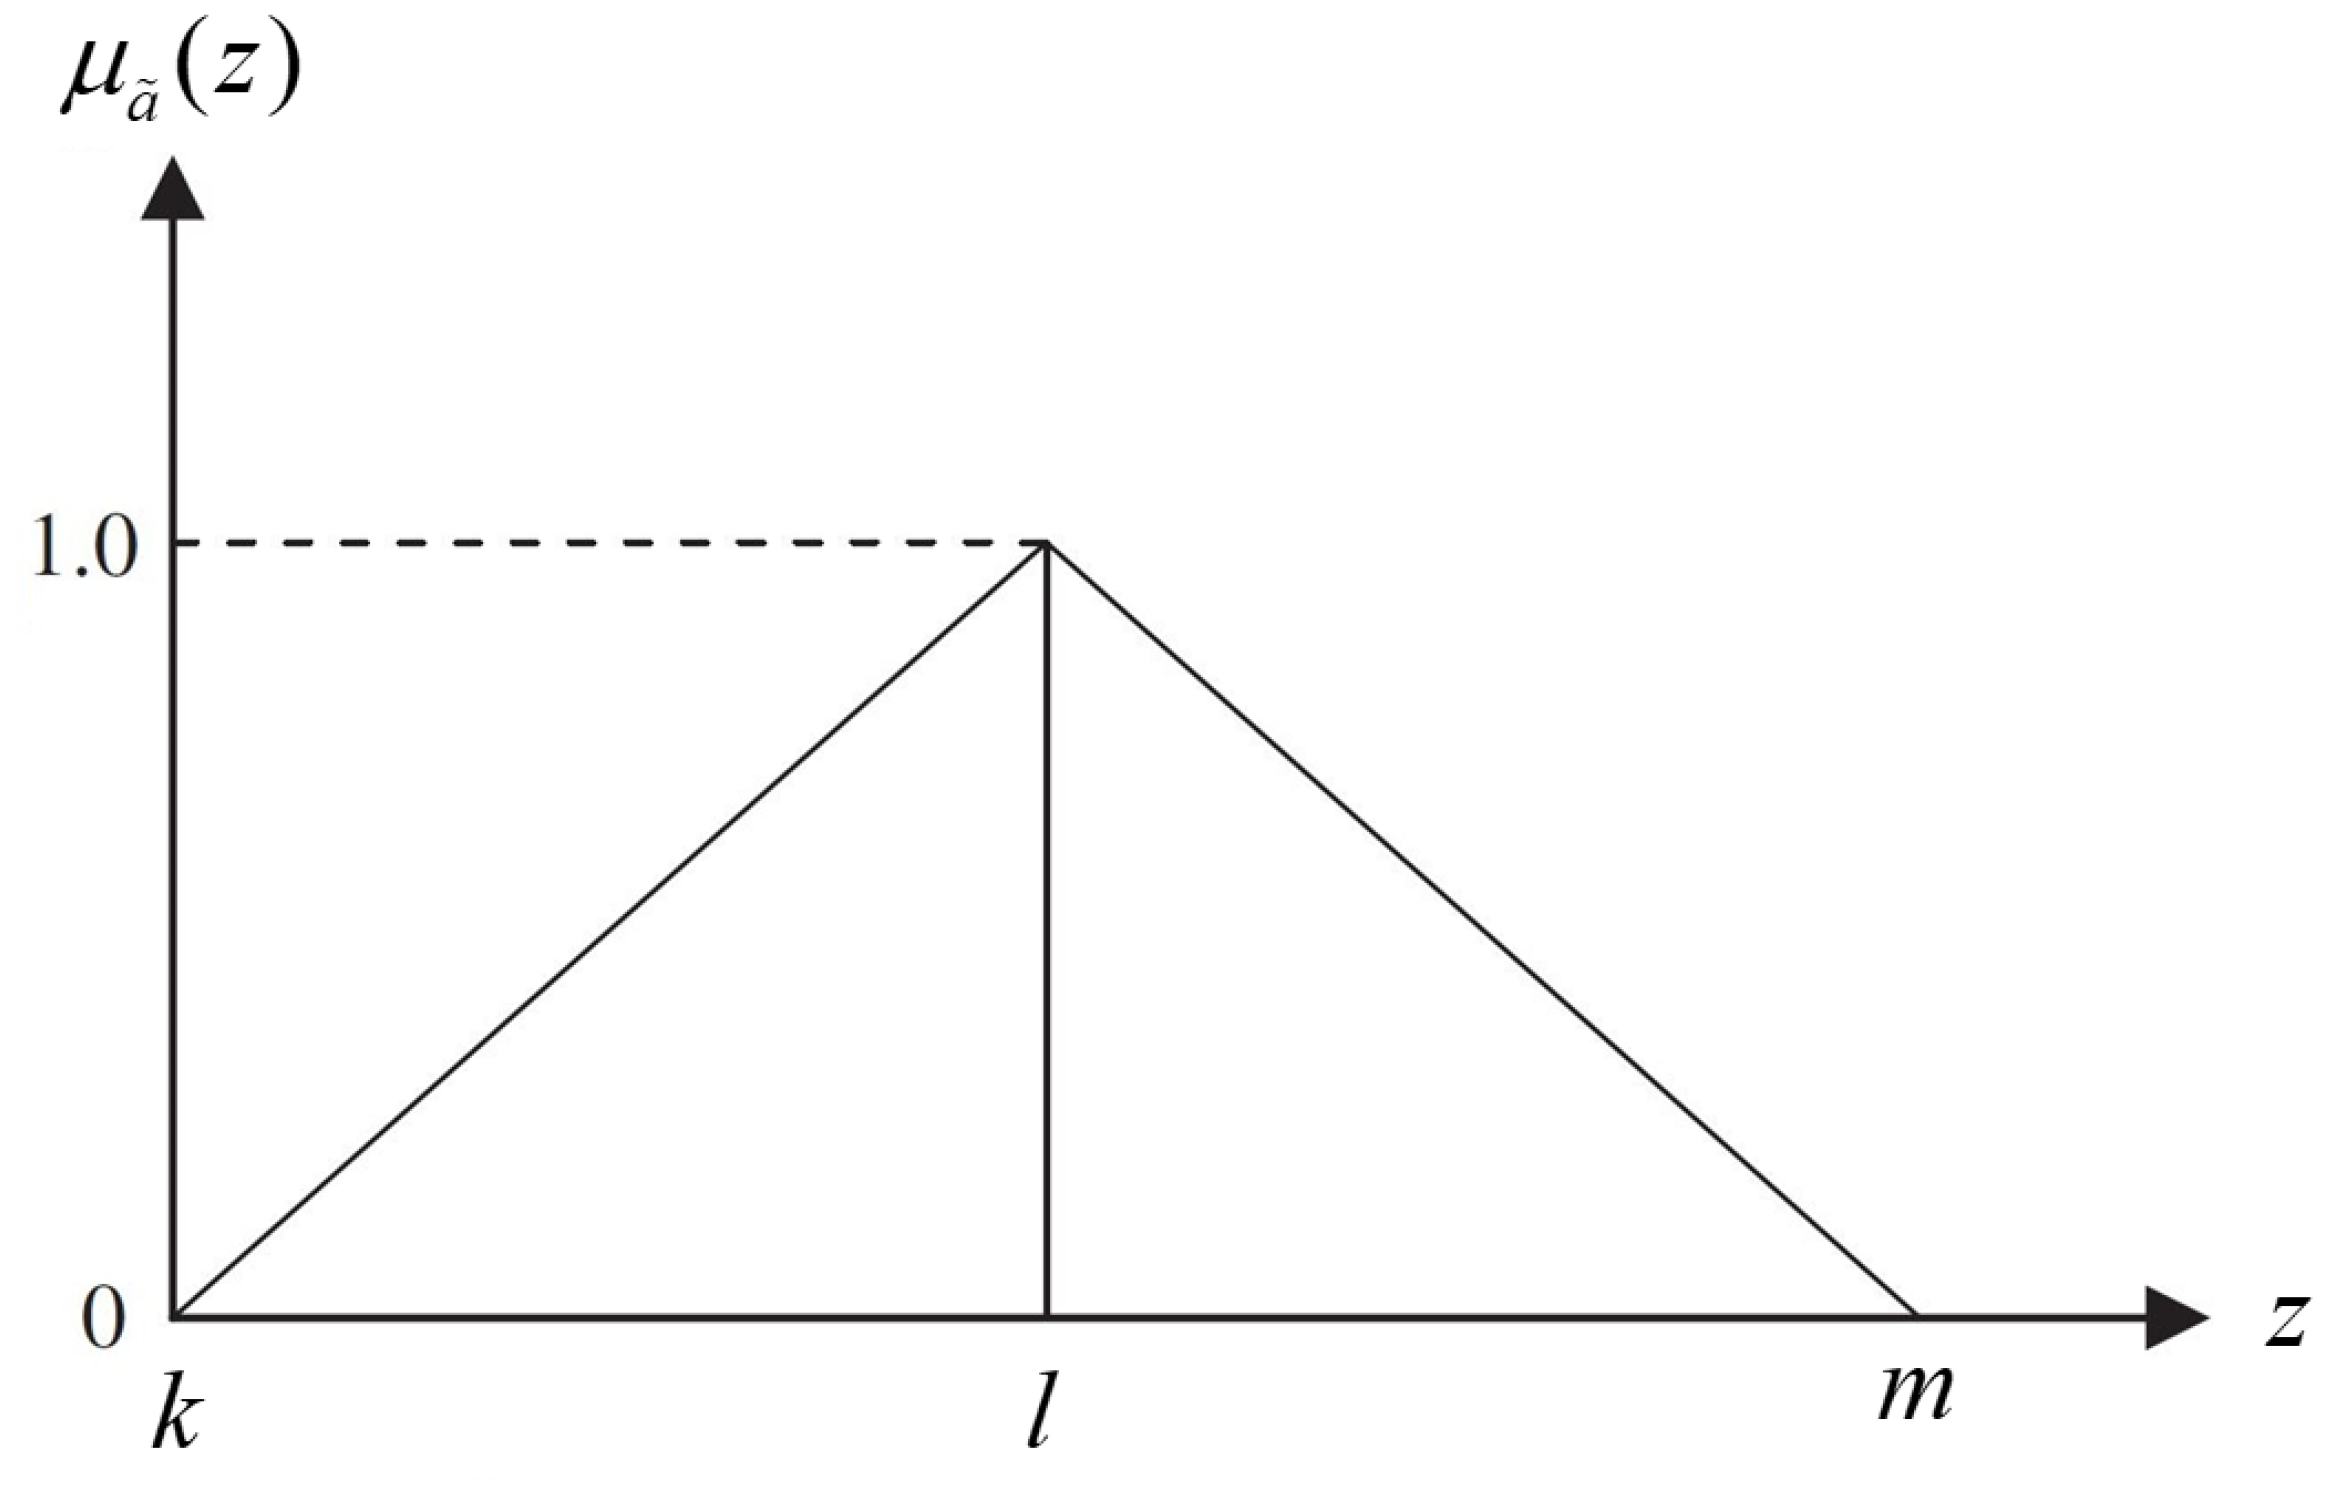
Step 1: Construct a fuzzy decision matrix F ˜ = ξ ˜ i j k ( u ) m × n .
The decision makers, E = { E 1 , E 2 , , E k } , will provide the realistic evaluations of the alternative A = { A 1 , A 2 , , A m } for criterion C = { C 1 , C 2 , , C n } , which is represented by fuzzy numbers ξ ˜ i j ( u ) = f i j , g i j , h i j , ( i = 1 ( 1 ) m ; j = 1 ( 1 ) n ) in Table 1. These are obtained from linguistic variables and illustrated as follows:
F ˜ = C 1 C 2 C 3 A 1 A 2 A m ξ ˜ 11 ( u ) ξ ˜ 12 ( u ) ξ ˜ 1 n ( u ) ξ ˜ 21 ( u ) ξ ˜ 22 ( u ) ξ ˜ 2 n ( u ) ξ ˜ m 1 ( u ) ξ ˜ m 2 ( u ) ξ ˜ m n ( u )
for E u ( u = 1 ( 1 ) k ) .
Step 2: Aggregate the fuzzy evaluations of alternatives via the equations provided:
ξ ˜ i j = 1 k ξ ˜ i j ( 1 ) ( + ) ξ ˜ i j ( 2 ) ( + ) ( + ) ξ ˜ i j ( k ) , i = 1 ( 1 ) m ; j = 1 ( 1 ) n .
It is important to note that each expert’s preference in this study is taken to be equal because they all possess an equivalent level of expertise.
Step 3: Normalize the fuzzy decision matrix.
Normalization attempts to reduce the disparity between the magnitude of attributes and dimensions, with the normalized value falling within [0, 1]. As a result, the technical issues caused by various measurement components can be removed [74,75]. If the MCDM problems contain non-beneficial criteria, normalization is also required to ensure that they are comparable to the beneficial criteria. The normalization of the initial data associated with each criterion is computed by dividing it by the magnitude of the most prevalent criterion. The component of a normalized decision matrix r ˜ i j k produced by the TFN ξ ˜ i j ( u ) = f i j , g i j , h i j is provided by [76]
r ˜ i j = f i j h j max , g i j h j max , h i j h j max , i = 1 ( 1 ) m ; j = 1 ( 1 ) n , for benefit criteria , and
r ˜ i j = f j min h i j , f j min g i j , f j min f i j , i = 1 ( 1 ) m ; j = 1 ( 1 ) n , for cos t criteria .
Step 4: Defuzzify the fuzzy decision matrix.
The decision matrix component is in the TFN form. To run the model, the fuzzy numbers must be properly defuzzified to provide crisp values. The process of defuzzification converts fuzzy values again into crisp values. Distinct defuzzification techniques lead to various formulas or processes, which produce various defuzzified values that might help produce various ranking outcomes [77,78]. The mean of the maxima, the graded mean integration representation (GMIR), the center of mass and the centroid methods are a few of the defuzzification techniques that are accessible [78,79]. In this study, the crisp value, Crisp ( a ˜ ) for TFN a ˜ = ( a 1 , a 2 , a 3 ) was determined using the GMIR value, defined as follows:
C r i s p ( a ˜ ) = a 1 + 4 a 2 + a 3 6 .
Step 5: Determine the alternatives’ overall performance.
In this step, the enhanced logarithm function is employed to calculate the overall performances of the alternatives. It is derived from a non-linear function pioneered by Shannon and Weaver [70] and variants have been researched [71,72,73]. The computation is performed using the following equation:
S i = 1 n j = 1 n ln ( 1 r i j ) , i = 1 ( 1 ) m .
Step 6: Determine the alternatives’ performance by eliminating each criterion.
Similar to the preceding step, this step also uses the logarithm function. The performance of the alternatives is determined based on removing each criterion separately in this step as opposed to Step 5. Since there are m sets of performances and n criteria, let S i j indicate the overall performance of ith alternative to the elimination of the jth criterion. The computation of this step is made using the following equation:
S i j = 1 n k = 1 , k j n ln ( 1 r i j ) , i = 1 ( 1 ) m ; j = 1 ( 1 ) n .
Step 7: Calculate the aggregate of the absolute deviations.
Based on the values generated from Steps 5 and 6, the calculation of the elimination effect of the jth criterion is performed in this step. Let d j represent the result of eliminating the jth criterion. The following formula can be used to determine the values of d j :
d j = i = 1 m | S i j S i | .
Step 8: Identify the final criteria weights.
In this step, the elimination effects, d j from Step 7 are used to determine each criterion’s objective weight. The weight of the jth criterion is denoted by the symbol w j . For the purpose of calculation w j , the following equation is applied:
w j = d j k = 1 n d k .

5. Numerical Experiments

In this section, the fuzzy MEREC results are validated and shown to be consistent with those of existing objective weighting techniques through comparative analysis. The simulation-based study is also included to assess the constancy of the fuzzy MEREC results. The evaluation of the criteria weights and the statistical tests were carried out using Microsoft Visual C++ and Microsoft Excel software, respectively. Among numerous techniques in the literature, only three existing objective weighting techniques were selected to calculate the criteria weights and conduct the analysis. The first weighting technique is the original MEREC since this paper focused on its modifications and improvements that could be suggested. The other two weighting techniques are selected among the well-known methods in MCDM: entropy and statistical variance.

5.1. Comparative Case Study

The data from the staff performance appraisal case study at a Malaysian academic institution are compared to analyze and verify the effectiveness of the method presented in this study. Table 2 displays the information, consisting of 15 alternatives and 13 sub-criteria grouped into 4 main criteria.
The weights assigned to each sub-criteria by each technique are displayed in Table 3 along with the associated Pearson correlation coefficients ( r ) . These weights are also graphically shown in Figure 2. The r values in Table 3 show the relationship between fuzzy MEREC results and those of the other techniques considered.
Consider a correlation coefficient value involving two variables that is greater than 0.4. For this situation, it is concluded that they have a moderate relationship, and a significant association exists if the number is greater than 0.6 [80]. The values of r displayed in Table 3 show that the fuzzy MEREC weights correlate highly with the MEREC, entropy, and statistical variance weights. It indicates that the fuzzy MEREC can be used as an alternative technique for determining the criteria weights since its weights differ slightly from the weights of other methods. Figure 2 demonstrates that the trend of fuzzy MEREC in differing criteria weights is comparable to the other approaches taken into account in the comparative analysis. It is noted that entropy and statistical variance are the well-known methods in MCDM problems, and their results are very close to each other as in Figure 2. It is also seen that the criteria weights of the fuzzy MEREC are more likely to follow the trend of the entropy and statistical variance methods. Hence, the results from the fuzzy MEREC can be used to create the criteria weights in MCDM problems that are credible and dependable.

5.2. Simulation-Based Analysis

The stability of the fuzzy MEREC approach is examined in this sub-section utilizing simulation-based analysis. In order to evaluate the fuzzy MEREC technique’s efficiency against that of the MEREC, entropy, and statistical variance approaches, a variety of decision matrices were generated. This analysis has two categories: the validation of the method presented in this study and the selection of the most effective method out of all the ones being compared through an outlier test. The presented method is validated by finding the correlation coefficients between the fuzzy MEREC and the existing methods similar to the previous part. For the outlier test, the consistency of the criteria weights is examined in the presence of outliers in the data set of alternatives. Concerning this test, several data elements are modified into other values that differ significantly from the original. After performing the algorithms, the weights obtained are compared with the original weights for the fuzzy MEREC and the three existing methods. The four types of generated decision matrices are given as follows:
  • Category S: 50 alternatives and 10 sub-criteria classified into three main criteria;
  • Category M: 100 alternatives and 15 sub-criteria classified into four main criteria;
  • Category L: 200 alternatives and 20 sub-criteria classified into four main criteria;
  • Category XL: 400 alternatives and 25 sub-criteria classified into five main criteria.
For the simulation, a decision matrix is created twenty times for each case (twenty sets in each case). The matrix values exhibit a normal distribution with a mean of 5 and a standard deviation of 1. These obtained decision matrices are used to obtain criteria weights for the fuzzy MEREC and other techniques. The average criteria weights established by the fuzzy MEREC and the other approaches taken into account for the generated category S, M, L and XL decision matrices as well as the associated Pearson correlation coefficients ( r ) are displayed in Table 4, Table 5, Table 6 and Table 7 and Table 8, respectively.
Based on Table 8 and Figure 3, since all the values of the correlation coefficient between the fuzzy MEREC and the three existing methods across all categories are higher than 0.8, it is clear that there is a significant relationship between the results. Additionally, as mentioned earlier, the fuzzy MEREC is the modified method of the MEREC. Hence, a more detailed comparison of those two approaches can be made based on the results. It is shown that the correlation coefficient values between the fuzzy MEREC and the two well-known methods, entropy and statistical variance are higher than the correlation coefficient values between the MEREC and the similar compared methods for all four categories. Hence, this part supports the observation that the presented fuzzy MEREC is better than the previous MEREC. Hence, similar to the earlier sub-section, weights for the criteria in MCDM problems can be determined using the results from the fuzzy MEREC; these are regarded as credible and reliable.
To understand the fuzzy MEREC behavior more thoroughly, an outlier test is performed, in which several data elements are modified into values that differ significantly from the original values in each category. After modifying several data elements, the algorithms for obtaining the weights are performed. The weights obtained are compared with the original weights for the fuzzy MEREC and the three existing methods. While the weights do not differ significantly from what they were, it shows that the method is better than the others. Table 9 shows the results of correlation coefficient values of criteria weights between the original data and modified data with 2%, 6%, and 12% outliers for each category, respectively.
The results show that the correlation coefficient values between the original data and modified data of fuzzy MEREC are the highest for all the categories compared to other methods. It is observed that the criteria weights of the fuzzy MEREC are mainly unchanged from their initial values. The existence of outliers is not good for any data in MCDM problems, as it can affect the final results. Since the criteria weights of the fuzzy MEREC are the least affected by the existence of the outliers, then the fuzzy MEREC is the most effective technique of all those that were compared. In other words, the criteria weights for the fuzzy MEREC method are consistent when there are outliers in the data set. The results of fuzzy MEREC are compared with the existing MEREC, and there is improvement over the latter one. The CPU time, or the amount of time a CPU was used for the operational assessment procedure, as in Table 10, was used as a comparison. It can be concluded that the fuzzy MEREC is more effective because it requires less CPU time than the existing MEREC. Hence, the fuzzy MEREC method would be preferable when dealing with the objective weight of criteria in various MCDM problems.

6. Conclusions

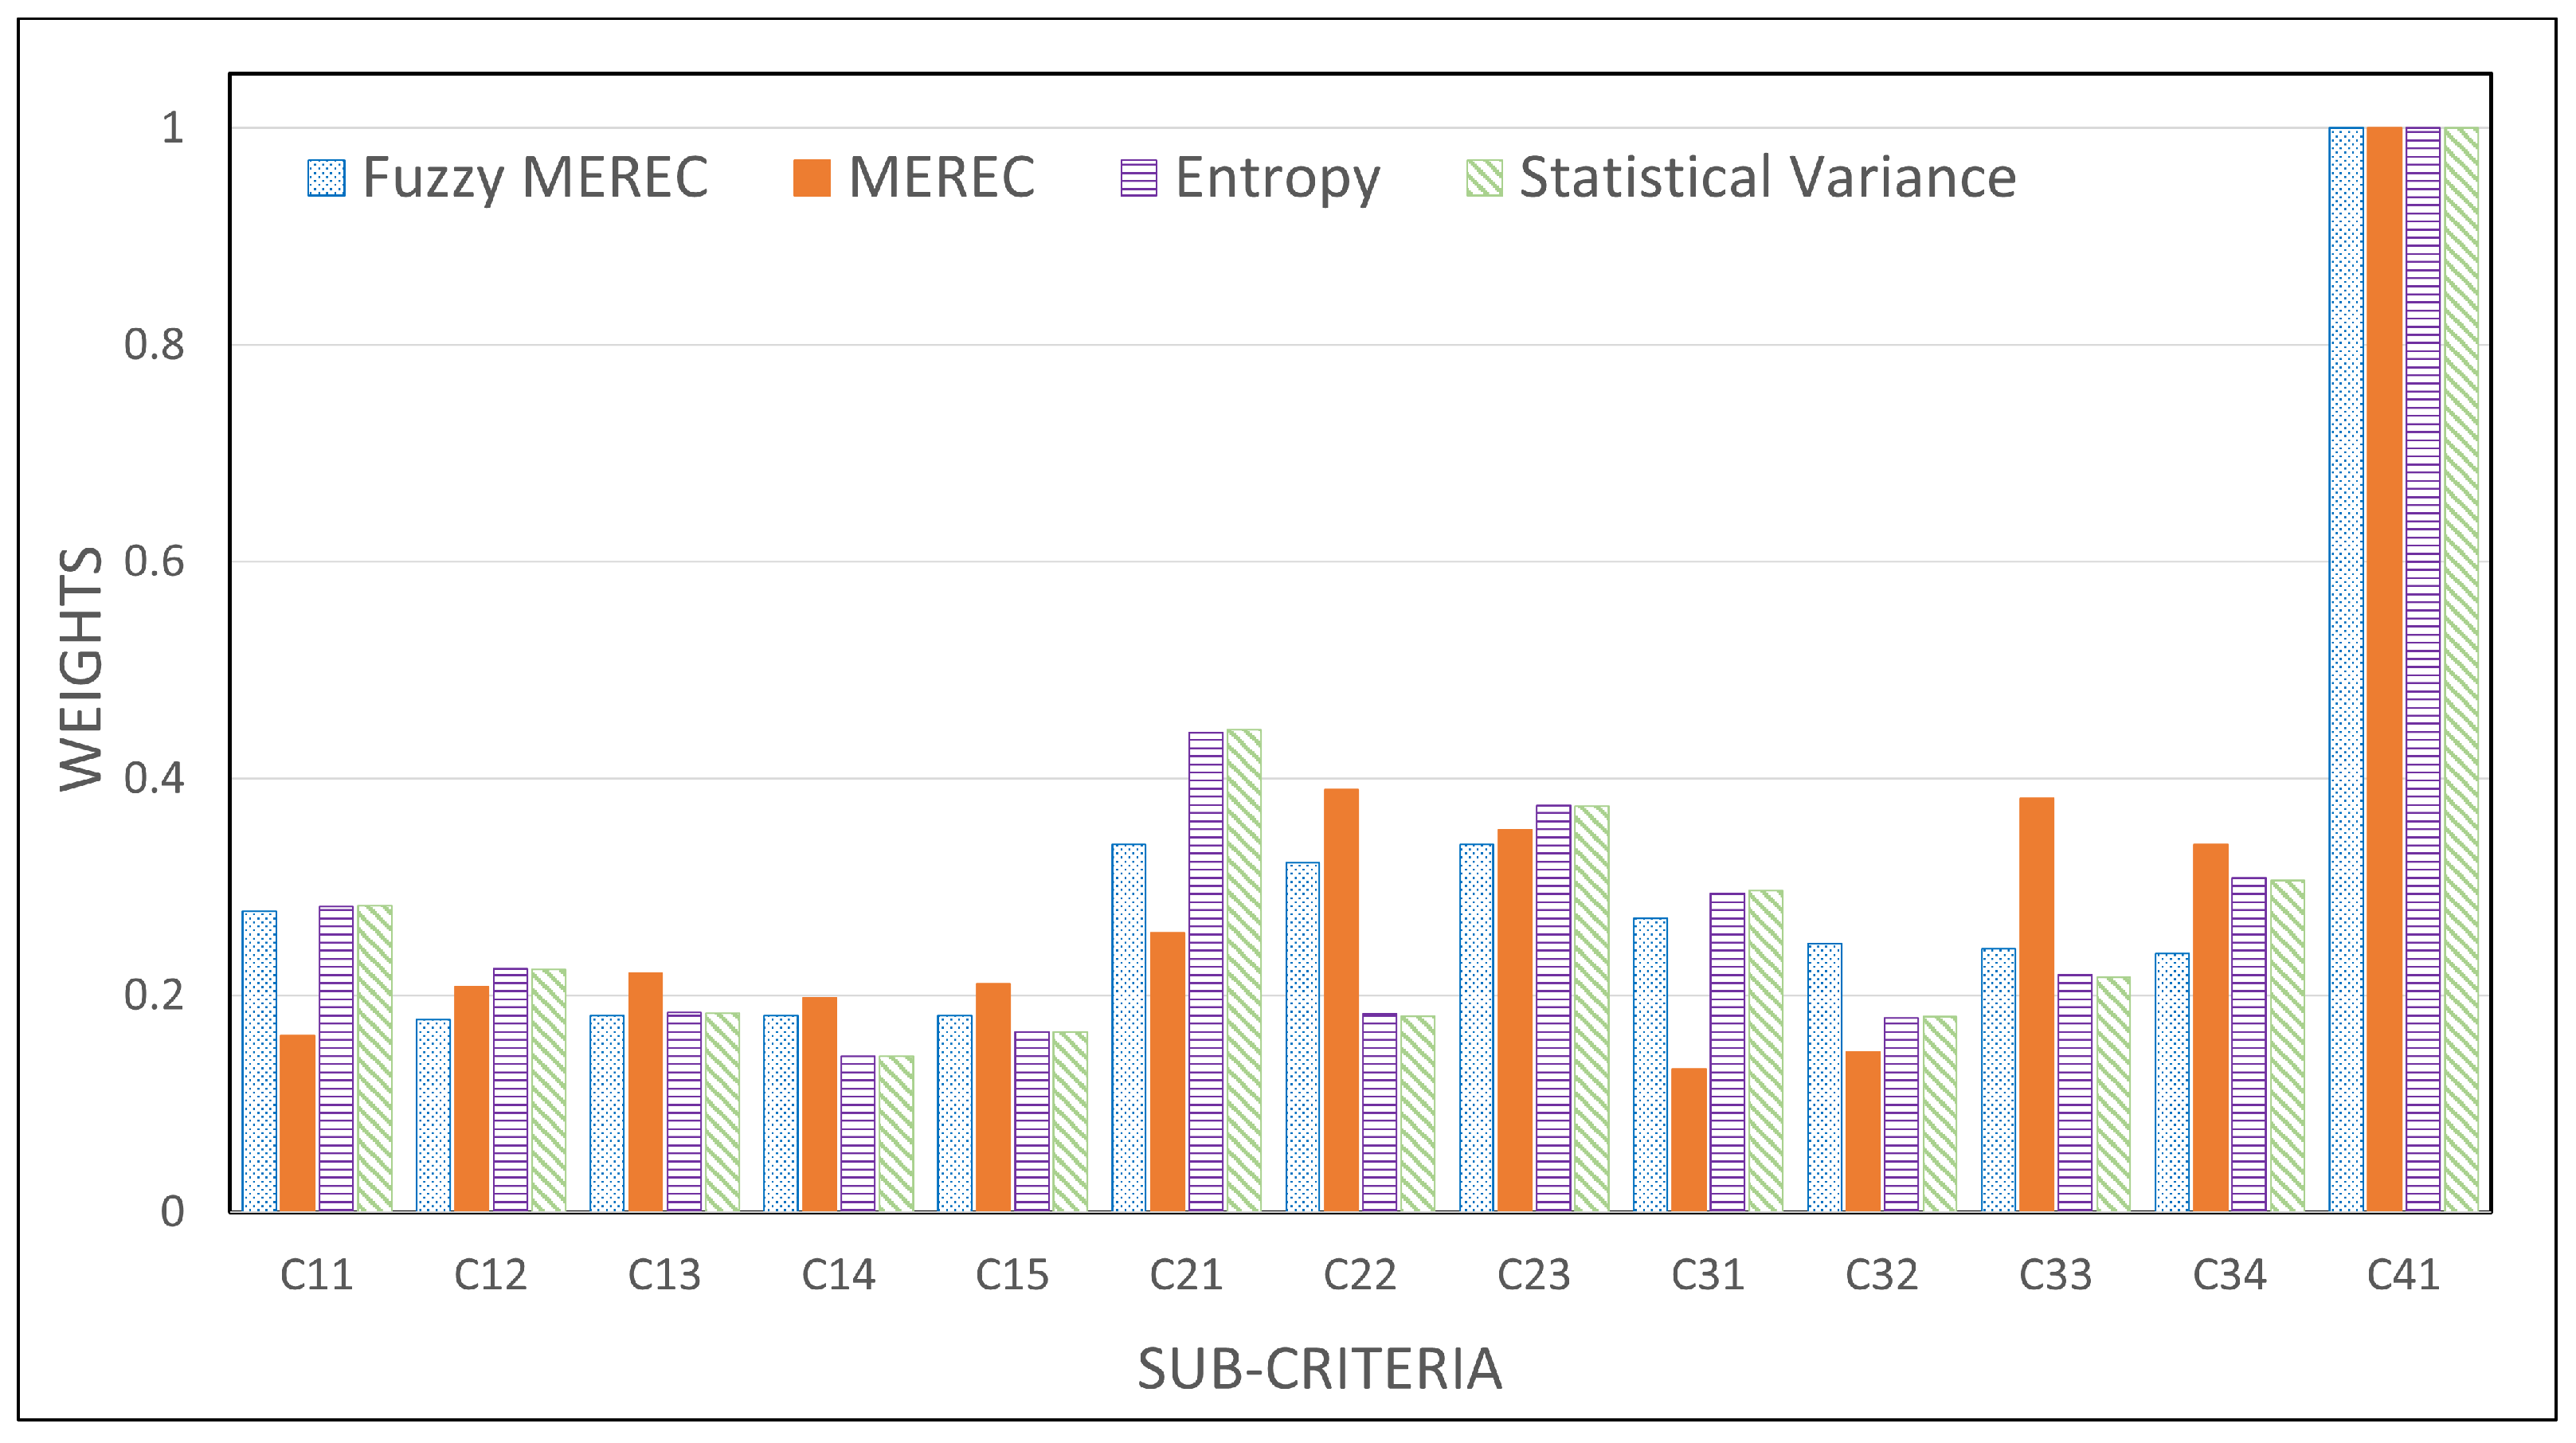
In a MCDM process, determining the criteria weights is essential. Subjective and objective weighting methods are frequently distinguished in research. The subjective weights of criteria are established based on the direct judgments and views of decision makers. Objective criteria weights are supported by the starting date specified in the decision matrices. The authors concentrate on objective weighting techniques in this work. This study introduced the fuzzy MEREC, a modified objective weighting mechanism. The results of this study are compatible with existing objective weighting techniques, even though there are modifications on the procedure of weighting criteria from a new perspective.
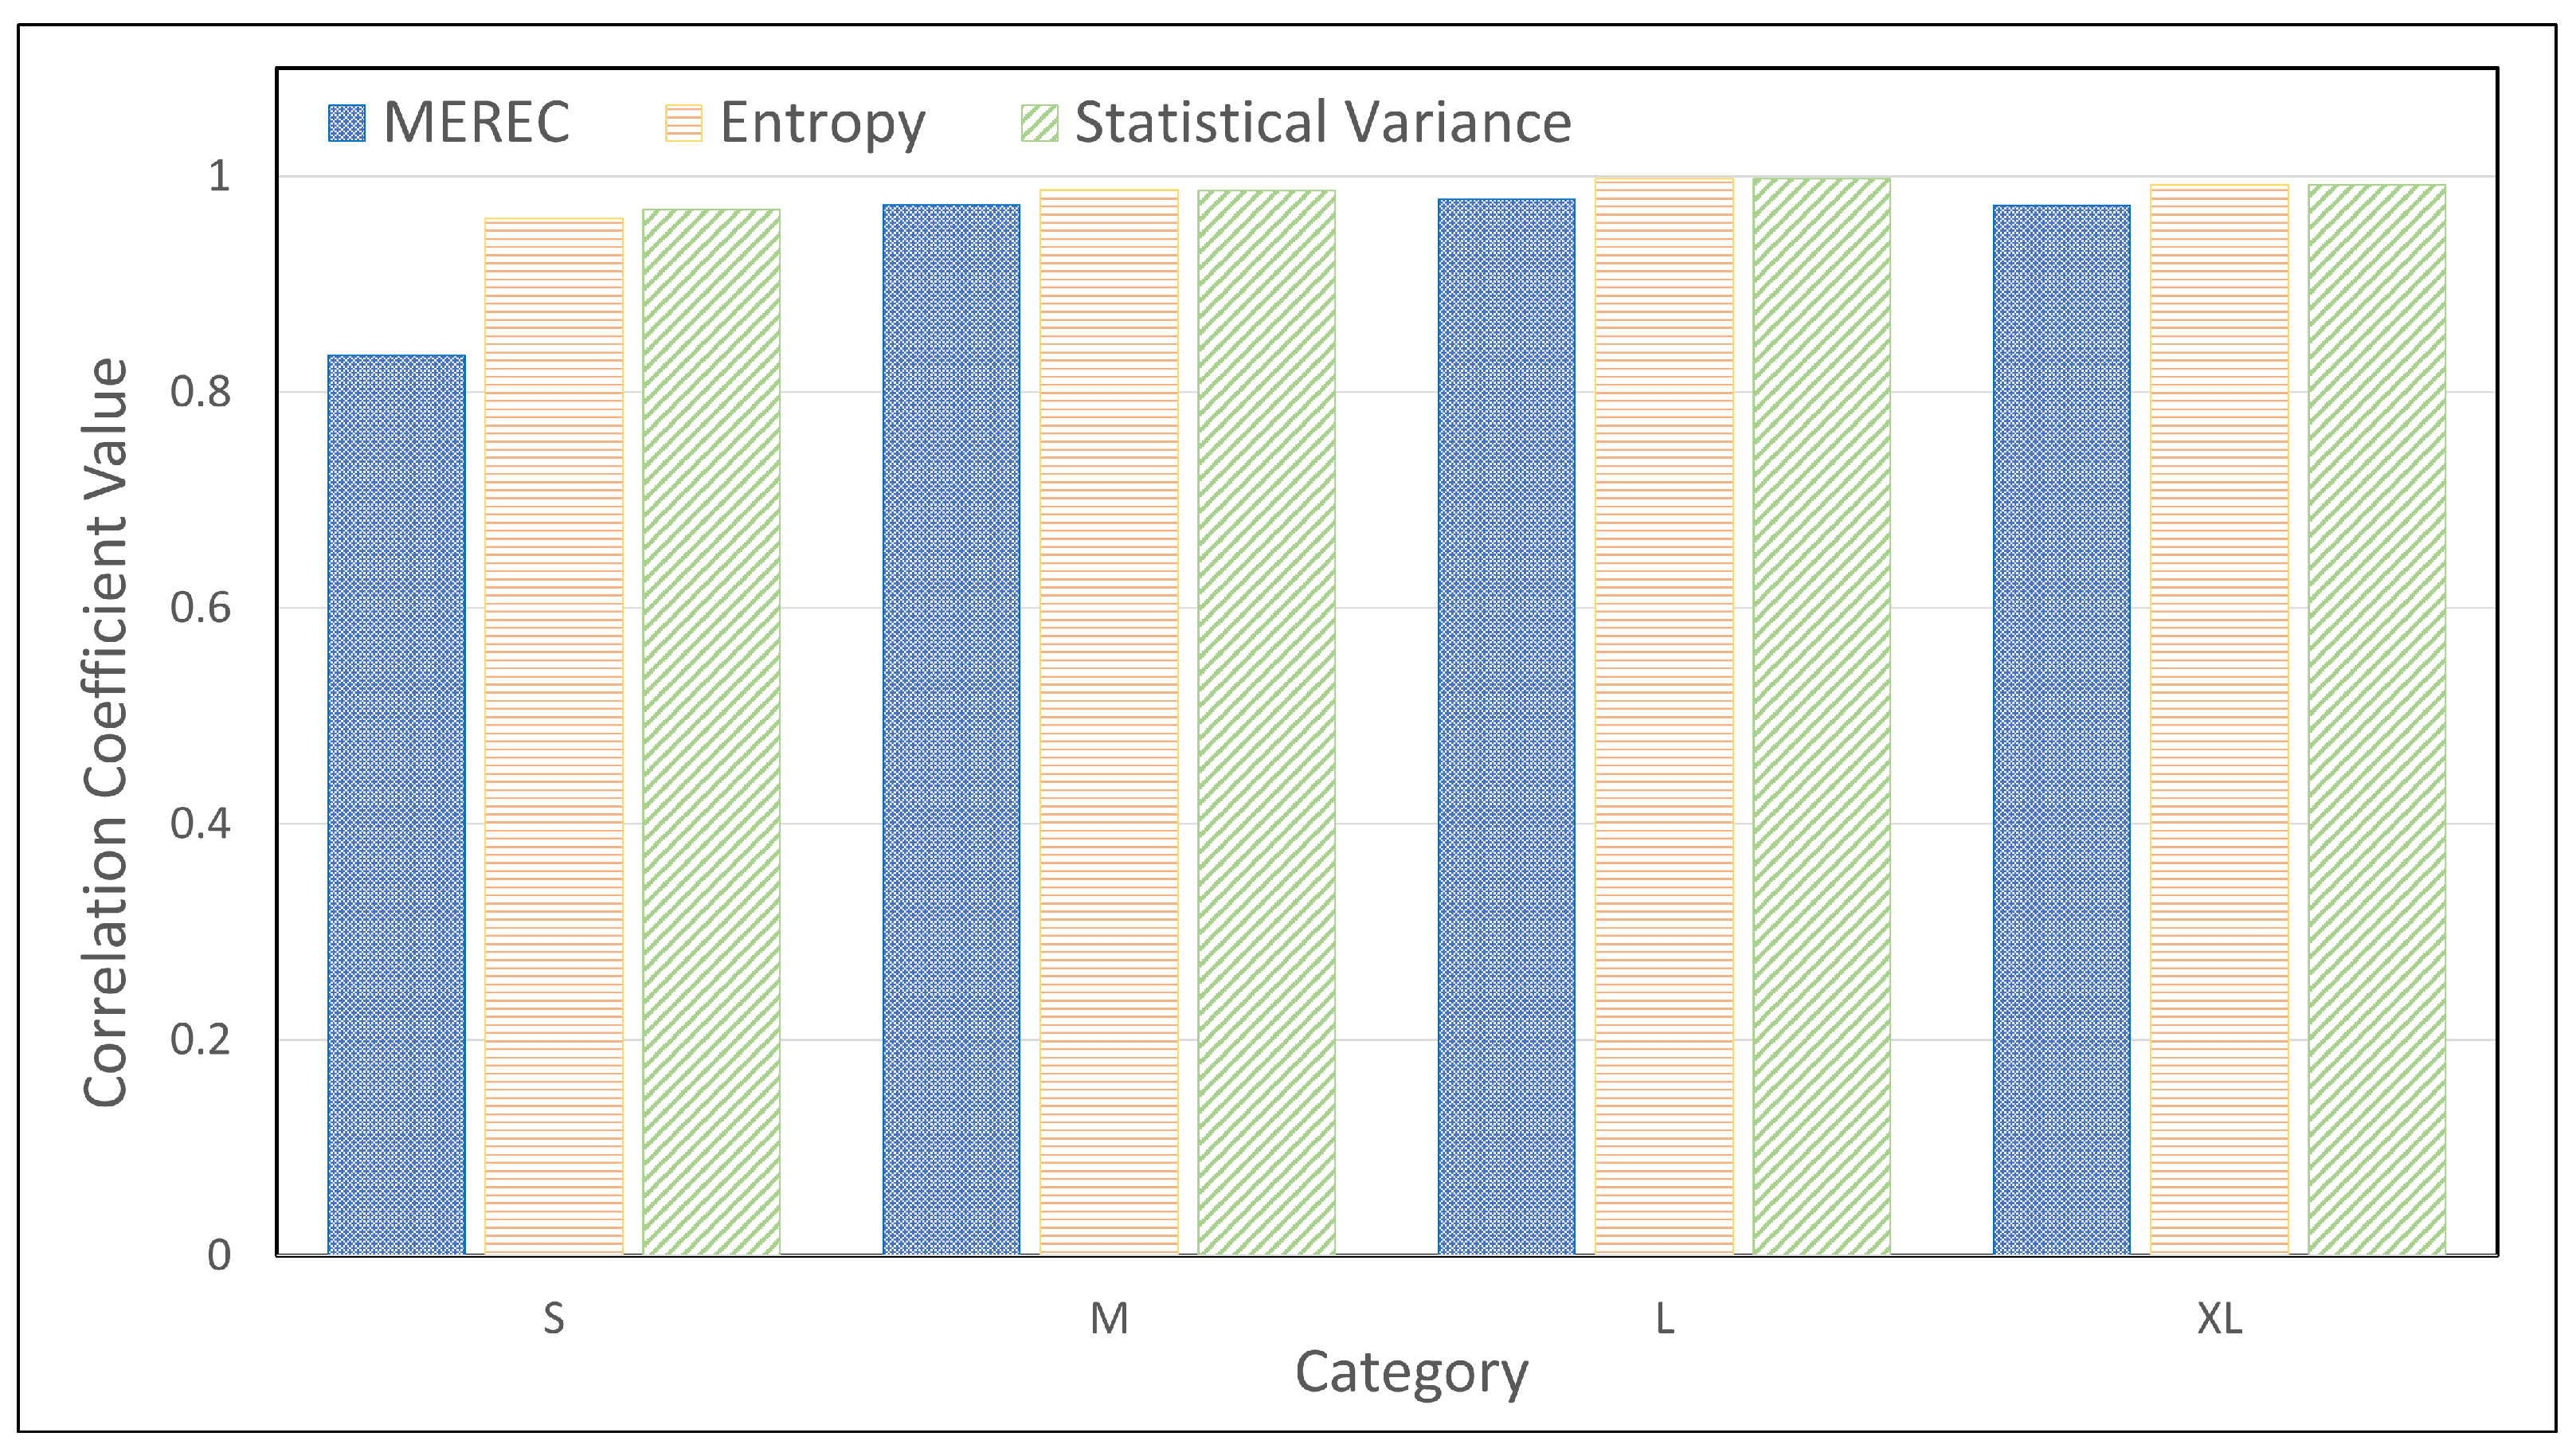
A numerical example is employed to compare the results of the fuzzy MEREC approach with the MEREC, entropy, and statistical variance methods. Correlation coefficient values between the results demonstrated that the criteria weights of the fuzzy MEREC are more likely to follow the trend of the entropy and statistical variance methods. Since the results of fuzzy MEREC are compatible with the existing objective weighting techniques, a simulation-based study was conducted by generating MCDM issues using data that largely follow a normal distribution (symmetric distribution). Based on the gathered data, two different types of analyses are performed. First, a comparison is made to validate the fuzzy-MEREC results. Second, the stability of the results is then examined by the outlier test. The simulation-based analysis demonstrates that as the size of the problem rises, the correlation between the fuzzy MEREC and the results of other techniques also increases. Therefore, the fuzzy MEREC behaves similarly to the other approaches in varied situations. However, the selection of the most effective method out of all the ones being compared is to be made through the outlier test. Based on the test, it is observed that the criteria weights of the fuzzy MEREC are the least affected by the outliers’ existence. In other words, the fuzzy MEREC weights are mainly stable and consistent when there are outliers in the data set. Therefore, the fuzzy MEREC is the most effective and appropriate technique of all those that were compared for calculating objective criteria weights and is regarded as credible and dependable.
The fuzzy MEREC weight is determined in large part by the performance measure function. An enhanced logarithmic function is employed to assess the various alternatives’ performance. In this paper, the authors also applied the defuzzification process to transform the fuzzy numbers to crisp values. The limitation of this study is that if the defuzzification procedure is neglected, there will be some inaccuracies in the performance values. This could be the subject of future study. This could also concentrate on integrating fuzzy MEREC with other subjective and objective weighting techniques, such as entropy, WEBIRA (weight balancing indicator ranks accordance), IDOCRIW (integrated determination of objective criteria weights), SWARA (stepwise weight assessment ratio analysis), and ACW (adaptive criteria weights), together with other expert evaluation techniques. Applying the modified approach to real-world issues, including constructing transportation systems, choosing financial products, supplier selection, and the problem of choosing a transportation mode, could also be considered.

Author Contributions

Conceptualization, M.S.S., L.S.L., S.M.M. and M.Z.A.; methodology, M.S.S., L.S.L., S.M.M. and M.Z.A.; validation, M.S.S., L.S.L. and H.-V.S.; formal analysis, M.S.S., L.S.L. and M.Z.A.; investigation, M.S.S. and L.S.L.; resources, M.S.S.; data curation, M.S.S.; writing—original draft preparation, M.S.S.; writing—review and editing, L.S.L., S.M.M., M.Z.A. and H.-V.S.; visualization, M.S.S.; supervision, L.S.L., S.M.M. and M.Z.A. All authors have read and agreed to the published version of the manuscript.

Funding

This research received no external funding.

Institutional Review Board Statement

Not applicable.

Informed Consent Statement

Not applicable.

Data Availability Statement

Not applicable.

Conflicts of Interest

The authors declare no conflict of interest.

Abbreviations

The following abbreviations are used in this manuscript:
MCDMMulti-Criteria Decision Making
MERECMethod based on the Removal Effects of Criteria
MADMMulti-Attribute Decision Making
MODMMulti-Objective Decision Making
APLAutomated Parcel Locker
AHPAnalytic Hierarchy Process
ASSPAircraft Sequencing and Scheduling Problem
PROMETHEEPreference Ranking Organization Method for Enrichment of Evaluations
VIKORVise Kriterijumska Optimizacija I Kompromisno Resenje
WASPASWeighted Aggregated Sum Product Assessment
WSMWeighted Sum Model
TOPSISTechnique for Order of Preference by Similarity to Ideal Solution
EDASEvaluation based on Distance from Average Solution
BWMBest–Worst Method
COPRASComplex Proportional Assessment
ELECTREElimination Et Choix Traduisant la Realité
GrCGranular Computing
MAGDMMulti-Attribute Group Decision Making
3WDThree-Way Decisions
DHFDual Hesitant Fuzzy
DHFSsDual Hesitant Fuzzy Sets
FGsFuzzy Graphs
SMARTSimple Multi-Attribute Ranking Technique
SECASimultaneous Evaluation of Criteria and Alternatives
CRITICCriteria Importance Through Inter-criteria Correlation
TFNTriangular Fuzzy Number
GMIRGraded Mean Integration Representation
WEBIRAWeight Balancing Indicator Ranks Accordance
IDOCRIWIntegrated Determination of Objective Criteria Weights
SWARAStepwise Weight Assessment Ratio Analysis
ACWAdaptive Criteria Weights

References

  1. Abdulgader, F.S.; Eid, R.; Daneshvar Rouyendegh, B. Development of decision support model for selecting a maintenance plan using a fuzzy MCDM approach: A theoretical framework. Appl. Comput. Intell. Soft Comput. 2018, 2018, 9346945. [Google Scholar] [CrossRef]
  2. Triantaphyllou, E. Multi-criteria decision making methods. In Multi-Criteria Decision Making Methods: A Comparative Study; Springer: Boston, MA, USA, 2000; pp. 5–21. [Google Scholar]
  3. Samanlioglu, F.; Burnaz, A.N.; Diş, B.; Tabaş, M.D.; Adıgüzel, M. An Integrated fuzzy best-worst-TOPSIS method for evaluation of hotel website and digital solutions provider firms. Adv. Fuzzy Syst. 2020, 2020, 8852223. [Google Scholar] [CrossRef]
  4. Irvanizam, I.; Usman, T.; Iqbal, M.; Iskandar, T.; Marzuki, M. An extended fuzzy TODIM approach for multiple-attribute decision-making with dual-connection numbers. Adv. Fuzzy Syst. 2020, 2020, 6190149. [Google Scholar] [CrossRef]
  5. Muangman, J.; Krootsong, K.; Polrong, P.; Yukunthorn, W.; Udomsap, W. Fuzzy multicriteria decision-making for ranking intercrop in rubber plantations under social, economic, and environmental criteria. Adv. Fuzzy Syst. 2020, 2020, 6508590. [Google Scholar] [CrossRef]
  6. Zapolskytė, S.; Burinskienė, M.; Trépanier, M. Evaluation criteria of smart city mobility system using MCDM method. Balt. J. Road Bridge Eng. 2020, 15, 196–224. [Google Scholar] [CrossRef]
  7. Kahraman, C. Fuzzy Multi-Criteria Decision Making: Theory and Applications with Recent Developments; Springer Science & Business Media: Berlin/Heidelberg, Germany, 2008; Volume 16. [Google Scholar]
  8. Ueasin, N. Decision-making on public transportation services based on the socio-economic, psychological, and environmental concern factors. Open Transp. J. 2020, 14, 22–31. [Google Scholar] [CrossRef]
  9. Zagorskas, J.; Turskis, Z. Location preferences of new pedestrian bridges based on multi-criteria decision-making and GIS-based estimation. Balt. J. Road Bridge Eng. 2020, 15, 158–181. [Google Scholar] [CrossRef]
  10. Alakas, H.M.; Gur, S.; Ozcan, E.; Eren, T. Ranking of sustainability criteria for industrial symbiosis applications based on ANP. J. Environ. Eng. Landsc. Manag. 2020, 28, 192–201. [Google Scholar] [CrossRef]
  11. Sawik, B.; Serrano-Hernandez, A.; Muro, A.; Faulin, J. Multi-Criteria Simulation-Optimization Analysis of Usage of Automated Parcel Lockers: A Practical Approach. Mathematics 2022, 10, 4423. [Google Scholar] [CrossRef]
  12. Dönmez, K. Evaluation of the performance of the multi-objective scalarization methods for the aircraft sequencing and scheduling problem using multi-criteria decision-making. Aircr. Eng. Aerosp. Technol. 2023, 95, 501–511. [Google Scholar] [CrossRef]
  13. Lad, V.; Patel, D.; Chauhan, K.; Patel, K. Prioritisation of bridge for improving its resilience using multi-criteria decision-making techniques. Eng. Constr. Archit. Manag. 2023. ahead of print. [Google Scholar] [CrossRef]
  14. Keshavarz-Ghorabaee, M.; Amiri, M.; Zavadskas, E.K.; Turskis, Z.; Antucheviciene, J. Determination of objective weights using a new method based on the removal effects of criteria (MEREC). Symmetry 2021, 13, 525. [Google Scholar] [CrossRef]
  15. Zardari, N.H.; Ahmed, K.; Shirazi, S.M.; Yusop, Z.B. Weighting Methods and Their Effects on Multi-Criteria Decision Making Model Outcomes in Water Resources Management; Springer: Cham, Switzerland, 2015. [Google Scholar]
  16. Chang, Y.H.; Yeh, C.H.; Chang, Y.W. A new method selection approach for fuzzy group multicriteria decision making. Appl. Soft Comput. 2013, 13, 2179–2187. [Google Scholar] [CrossRef]
  17. Torfi, F.; Farahani, R.Z.; Rezapour, S. Fuzzy AHP to determine the relative weights of evaluation criteria and Fuzzy TOPSIS to rank the alternatives. Appl. Soft Comput. 2010, 10, 520–528. [Google Scholar] [CrossRef]
  18. Adriyendi. Multi-attribute decision making using simple additive weighting and weighted product in food choice. Int. J. Inf. Eng. Electron. Bus. 2015, 6, 8–14. [Google Scholar] [CrossRef] [Green Version]
  19. Tian, C.; Peng, J.; Zhang, W.; Zhang, S.; Wang, J. Tourism environmental impact assessment based on improved AHP and picture fuzzy PROMETHEE II methods. Technol. Econ. Dev. Econ. 2020, 26, 355–378. [Google Scholar] [CrossRef]
  20. Mi, X.; Liao, H.; Liao, Y.; Lin, Q.; Lev, B.; Al-Barakati, A. Green suppler selection by an integrated method with stochastic acceptability analysis and MULTIMOORA. Technol. Econ. Dev. Econ. 2020, 26, 549–572. [Google Scholar] [CrossRef]
  21. Lin, P.P.; Li, D.F.; Jiang, B.Q.; Yu, G.F.; Wei, A.P. Evaluating the comprehensive impacts of tourism in Hainan by intergrating input-output model with MCDM methods. Technol. Econ. Dev. Econ. 2020, 26, 989–1029. [Google Scholar] [CrossRef]
  22. Ban, A.I.; Ban, O.I.; Bogdan, V.; Popa, D.C.S.; Tuse, D. Performance evaluation model of Romanian manufacturing listed companies by fuzzy AHP and TOPSIS. Technol. Econ. Dev. Econ. 2020, 26, 808–836. [Google Scholar] [CrossRef]
  23. He, T.; Wei, G.; Lu, J.; Wu, J.; Wei, C.; Guo, Y. A novel EDAS based method for multiple attribute group decision making with pythagorean 2-tuple linguistic information. Technol. Econ. Dev. Econ. 2020, 26, 1125–1138. [Google Scholar] [CrossRef]
  24. Tabatabaei, M.H.; Amiri, M.; Ghahremanloo, M.; Keshavarz-Ghorabaee, M.; Zavadskas, E.K.; Antucheviciene, J. Hierarchical decision-making using a new mathematical model based on the best-worst method. Int. J. Comput. Commun. Control 2020, 14, 710–725. [Google Scholar] [CrossRef] [Green Version]
  25. Zhang, C.; Li, D.; Liang, J. Multi-granularity three-way decisions with adjustable hesitant fuzzy linguistic multigranulation decision-theoretic rough sets over two universes. Inf. Sci. 2020, 507, 665–683. [Google Scholar] [CrossRef]
  26. Zhang, C.; Li, D.; Liang, J.; Wang, B. MAGDM-oriented dual hesitant fuzzy multigranulation probabilistic models based on MULTIMOORA. Int. J. Mach. Learn. Cybern. 2021, 12, 1219–1241. [Google Scholar] [CrossRef]
  27. Zhang, C.; Ding, J.; Zhan, J.; Li, D. Incomplete three-way multi-attribute group decision making based on adjustable multigranulation Pythagorean fuzzy probabilistic rough sets. Int. J. Approx. Reason. 2022, 147, 40–59. [Google Scholar] [CrossRef]
  28. Bai, W.; Ding, J.; Zhang, C. Dual hesitant fuzzy graphs with applications to multi-attribute decision making. Int. J. Cogn. Comput. Eng. 2020, 1, 18–26. [Google Scholar] [CrossRef]
  29. Fu, Y.; Cai, R.; Yu, B. Group decision-making method with directed graph under linguistic environment. Int. J. Mach. Learn. Cybern. 2022, 13, 3329–3340. [Google Scholar] [CrossRef]
  30. Roszkowska, E. Rank ordering criteria weighting methods–a comparative overview. Optimum. Stud. Ekon. 2013, 5, 14–33. [Google Scholar] [CrossRef]
  31. Alfares, H.K.; Duffuaa, S.O. Simulation-based evaluation of criteria rank-weighting methods in multi-criteria decision-making. Int. J. Inf. Technol. Decis. Mak. 2016, 15, 43–61. [Google Scholar] [CrossRef] [Green Version]
  32. Baker, D.; Bridges, D.; Hunter, R.; Johnson, G.; Krupa, J.; Murphy, J.; Sorenson, K. Guidebook to Decision Making Methods; US Department of Energy: Washington, DC, USA, 2002.
  33. Mahmoody Vanolya, N.; Jelokhani-Niaraki, M. The use of subjective–objective weights in GIS-based multi-criteria decision analysis for flood hazard assessment: A case study in Mazandaran, Iran. GeoJournal 2021, 86, 379–398. [Google Scholar] [CrossRef]
  34. Zhang, R.; Zhao, B.; Xing, Y.; Bai, K. A novel multicriteria decision-making approach with unknown weight information under q-rung orthopair fuzzy environment. Int. J. Intell. Syst. 2021, 36, 7309–7339. [Google Scholar] [CrossRef]
  35. Yuan, J.; Li, Y.; Luo, X.; Li, L.; Zhang, Z.; Li, C. Regional integrated energy system schemes selection based on risk expectation and Mahalanobis-Taguchi system. J. Intell. Fuzzy Syst. 2021, 40, 10333–10350. [Google Scholar]
  36. Zhao, H.; Li, B.; Lu, H.; Wang, X.; Li, H.; Guo, S.; Xue, W.; Wang, Y. Economy-environment-energy performance evaluation of CCHP microgrid system: A hybrid multi-criteria decision-making method. Energy 2022, 240, 122830. [Google Scholar]
  37. Wang, T.C.; Lee, H.D. Developing a fuzzy TOPSIS approach based on subjective weights and objective weights. Expert Syst. Appl. 2009, 36, 8980–8985. [Google Scholar]
  38. Lotfi, F.H.; Fallahnejad, R. Imprecise Shannon’s entropy and multi attribute decision making. Entropy 2010, 12, 53–62. [Google Scholar]
  39. Md Saad, R.; Ahmad, M.Z.; Abu, M.S.; Jusoh, M.S. Hamming distance method with subjective and objective weights for personnel selection. Sci. World J. 2014, 2014, 865495. [Google Scholar]
  40. Deng, H.; Yeh, C.H.; Willis, R.J. Inter-company comparison using modified TOPSIS with objective weights. Comput. Oper. Res. 2000, 27, 963–973. [Google Scholar]
  41. Chu, A.; Kalaba, R.; Spingarn, K. A comparison of two methods for determining the weights of belonging to fuzzy sets. J. Optim. Theory Appl. 1979, 27, 531–538. [Google Scholar]
  42. Saaty, T.L. A scaling method for priorities in hierarchical structures. J. Math. Psychol. 1977, 15, 234–281. [Google Scholar]
  43. Hwang, C.L.; Lin, M.J. Group Decision Making Under Multiple Criteria: Methods and Applications; Springer Science & Business Media: Berlin/Heidelberg, Germany, 2012; Volume 281. [Google Scholar]
  44. Liu, Y.; Eckert, C.M.; Earl, C. A review of fuzzy AHP methods for decision-making with subjective judgements. Expert Syst. Appl. 2020, 161, 113738. [Google Scholar]
  45. Zahari, N.I.N.; Abdullah, M.L. Evaluation of sustainable development indicators with fuzzy TOPSIS based on subjective and objective weights. IIUM Eng. J. 2012, 13, 13–25. [Google Scholar] [CrossRef]
  46. Cavallaro, F.; Zavadskas, E.K.; Raslanas, S. Evaluation of combined heat and power (CHP) systems using fuzzy shannon entropy and fuzzy TOPSIS. Sustainability 2016, 8, 556. [Google Scholar]
  47. Mukhametzyanov, I. Specific character of objective methods for determining weights of criteria in MCDM problems: Entropy, CRITIC and SD. Decis. Making Appl. Manag. Eng. 2021, 4, 76–105. [Google Scholar]
  48. Gass, S.I. The setting of weights in linear goal-programming problems. Comput. Oper. Res. 1987, 14, 227–229. [Google Scholar]
  49. Rao, R.; Patel, B. A subjective and objective integrated multiple attribute decision making method for material selection. Mater. Des. 2010, 31, 4738–4747. [Google Scholar]
  50. Keshavarz-Ghorabaee, M.; Govindan, K.; Amiri, M.; Zavadskas, E.K.; Antuchevičienė, J. An integrated type-2 fuzzy decision model based on WASPAS and SECA for evaluation of sustainable manufacturing strategies. J. Environ. Eng. Landsc. Manag. 2019, 27, 187–200. [Google Scholar]
  51. Mohamadghasemi, A.; Hadi-Vencheh, A.; Hosseinzadeh Lotfi, F. The multiobjective stochastic CRITIC–TOPSIS approach for solving the shipboard crane selection problem. Int. J. Intell. Syst. 2020, 35, 1570–1598. [Google Scholar]
  52. Wang, T.C.; Lee, H.D.; Chang, M.C.S. A fuzzy TOPSIS approach with entropy measure for decision-making problem. In Proceedings of the 2007 IEEE International Conference on Industrial Engineering and Engineering Management, Singapore, 2–4 December 2007; IEEE: Piscataway, NJ, USA, 2007; pp. 124–128. [Google Scholar]
  53. Zeleny, M. Multiple Criteria Decision Making Kyoto 1975; Springer Science & Business Media: Berlin/Heidelberg, Germany, 2012; Volume 123. [Google Scholar]
  54. Shannon, C.E.; Weaver, W. The Mathematical Theory of Communication; University of Illinois Press: Urbana, IL, USA, 1949; Volume 117. [Google Scholar]
  55. Muley, A.; Bajaj, V. A comparative FMADM method used to solve real life problem. Int. J. Mach. Intell. 2010, 2, 35–39. [Google Scholar]
  56. Kosko, B. Fuzzy entropy and conditioning. Inf. Sci. 1986, 40, 165–174. [Google Scholar]
  57. Ulrych, T.; Jensen, O. Cross-spectral analysis using maximum entropy. Geophysics 1974, 39, 353–354. [Google Scholar]
  58. Golan, A.; Judge, G.; Miller, D. Maximum Entropy Econometrics, Robust Estimation with Limited; John Wiley: Hoboken, NJ, USA, 1996. [Google Scholar]
  59. Rao, R.V.; Patel, B.K.; Parnichkun, M. Industrial robot selection using a novel decision making method considering objective and subjective preferences. Robot. Auton. Syst. 2011, 59, 367–375. [Google Scholar]
  60. Singh, H.; Kumar, R. Selection of material for bicycle chain in Indian scenario using MADM approach. In Proceedings of the World Congress on Engineering, London, UK, 4–6 July 2012; Volume 3, pp. 1377–1381. [Google Scholar]
  61. Mahapatara, S.S.; Sharma, S.; Parappagoudar, M. A novel multi-criteria decision making approach for selection of reverse manufacturing alternative. Int. J. Serv. Oper. Manag. 2013, 15, 176–195. [Google Scholar]
  62. Mohanty, P.P.; Mahapatra, S. A compromise solution by VIKOR method for ergonomically designed product with optimal set of design characteristics. Procedia Mater. Sci. 2014, 6, 633–640. [Google Scholar]
  63. Delice, E.K.; Can, G.F. A new approach for ergonomic risk assessment integrating KEMIRA, best–worst and MCDM methods. Soft Comput. 2020, 24, 15093–15110. [Google Scholar]
  64. Du, Y.W.; Gao, K. Ecological security evaluation of marine ranching with AHP-entropy-based TOPSIS: A case study of Yantai, China. Mar. Policy 2020, 122, 104223. [Google Scholar]
  65. Du, Y.; Zheng, Y.; Wu, G.; Tang, Y. Decision-making method of heavy-duty machine tool remanufacturing based on AHP-entropy weight and extension theory. J. Clean. Prod. 2020, 252, 119607. [Google Scholar]
  66. Liu, S.; Hu, Y.; Zhang, X.; Li, Y.; Liu, L. Blockchain service provider selection based on an integrated BWM-Entropy-TOPSIS method under an intuitionistic fuzzy environment. IEEE Access 2020, 8, 104148–104164. [Google Scholar]
  67. Zadeh, L.A. The concept of a linguistic variable and its application to approximate reasoning-I. Inf. Sci. 1975, 8, 199–249. [Google Scholar]
  68. Awasthi, A.; Chauhan, S.S.; Omrani, H. Application of fuzzy TOPSIS in evaluating sustainable transportation systems. Expert Syst. Appl. 2011, 38, 12270–12280. [Google Scholar]
  69. Nagoor Gani, A.; Mohamed Assarudeen, S.N. A new operation on triangular fuzzy number for solving fuzzy linear programming problem. Appl. Math. Sci. 2012, 6, 525–532. [Google Scholar]
  70. Shannon, E.; Weaver, W. The mathematical theory of communication. Bell Syst. Tech. J. 1948, 27, 379–423. [Google Scholar]
  71. Kullback, S.; Leibler, R.A. On information and sufficiency. Ann. Math. Stat. 1951, 22, 79–86. [Google Scholar]
  72. Kullback, S. Information theory and statistics. Courier corporation. Image analysis. Compos. Sci. Technol. 1968, 59, 543–545. [Google Scholar]
  73. Bhandari, D.; Pal, N.R.; Majumder, D.D. Fuzzy divergence, probability measure of fuzzy events and image thresholding. Pattern Recognit. Lett. 1992, 13, 857–867. [Google Scholar]
  74. Sarraf, A.Z.; Mohaghar, A.; Bazargani, H. Developing TOPSIS method using statistical normalization for selecting knowledge management strategies. J. Ind. Eng. Manag. 2013, 6, 860–875. [Google Scholar]
  75. Chen, P. Effects of normalization on the entropy-based TOPSIS method. Expert Syst. Appl. 2019, 136, 33–41. [Google Scholar]
  76. Han, H.; Trimi, S. A fuzzy TOPSIS method for performance evaluation of reverse logistics in social commerce platforms. Expert Syst. Appl. 2018, 103, 133–145. [Google Scholar]
  77. Matawale, C.R.; Datta, S.; Mahapatra, S.S. Supplier selection in agile supply chain: Application potential of FMLMCDM approach in comparison with fuzzy-TOPSIS and fuzzy-MOORA. Benchmarking Int. J. 2016, 23, 2027–2060. [Google Scholar]
  78. Sakthivel, G.; Ikua, B.W. Failure mode and effect analysis using fuzzy analytic hierarchy process and GRA TOPSIS in manufacturing industry. Int. J. Product. Qual. Manag. 2017, 22, 466–484. [Google Scholar]
  79. Zhao, H.; Guo, S. External benefit evaluation of renewable energy power in China for sustainability. Sustainability 2015, 7, 4783–4805. [Google Scholar]
  80. Walters, S.J. Quality of Life Outcomes in Clinical Trials and Health-Care Evaluation: A Practical Guide to Analysis and Interpretation; John Wiley & Sons: Hoboken, NJ, USA, 2009. [Google Scholar]
Figure 1. TFN with membership function.
Mathematics 11 01544 g001
Figure 2. The sub-criteria weights for each technique.
Mathematics 11 01544 g002
Figure 3. The graphical display of correlation coefficients in all four categories.
Mathematics 11 01544 g003
Table 1. Linguistic terms used and their fuzzy numbers.
Linguistics TermsFuzzy Numbers
Terrible (T) ( 0 , 0 , 1 )
Medium Terrible (MT) ( 0 , 1 , 2 )
Very Poor (VP) ( 1 , 2 , 3 )
Poor (P) ( 2 , 3 , 4 )
Medium Fair (MF) ( 3 , 4 , 5 )
Fair (F) ( 4 , 5 , 6 )
Medium Good (MG) ( 5 , 6 , 7 )
Good (G) ( 6 , 7 , 8 )
Very Good (VG) ( 7 , 8 , 9 )
Medium Excellent (ME) ( 8 , 9 , 10 )
Excellent (E) ( 9 , 10 , 10 )
Table 2. Assessments of staff performance against the sub-criteria.
C 11 C 12 C 13 C 14 C 15 C 21 C 22 C 23 C 31 C 32 C 33 C 34 C 41
A 1 MEVGVGVGVGMEMEMEMEMEMEMEVG
A 2 EVGMEMEMEMEMEMEMEMEMEVGVG
A 3 MEMEMEMEMEMEMEMEMEMEMEMEVG
A 4 EMEMEMEMEMEMEEEEEEME
A 5 EMEMEMEVGMEMEMEEMEMEMEME
A 6 MEVGMEMEMEMEMEMEMEMEMEMEVG
A 7 EMEMEMEMEMEMEMEMEMEMEMEME
A 8 EMEMEMEMEMEMEMEEEEMEVG
A 9 EMEMEMEMEMEMEMEEMEMEEME
A 10 EMEMEMEMEMEMEMEMEMEMEMEME
A 11 MEMEMEMEMEMEMEMEMEMEMEMEVG
A 12 EMEVGVGMEMEMEMEMEMEMEMEME
A 13 MEMEMEMEMEMEMEMEMEMEMEMEME
A 14 EMEMEMEMEEMEMEMEMEMEMEE
A 15 MEMEMEMEMEMEMEMEMEMEVGVGVG
Table 3. The sub-criteria weights and correlation coefficients for each technique.
EntropyStatistical VarianceMERECFuzzy MEREC
w 11 0.2820.2820.1630.277
w 12 0.2240.2240.2080.178
w 13 0.1840.1840.2210.182
w 14 0.1440.1440.1980.182
w 15 0.1660.1660.2110.182
w 21 0.4420.4450.2580.339
w 22 0.1830.1810.3900.322
w 23 0.3750.3740.3530.339
w 31 0.2940.2970.1320.271
w 32 0.1790.1800.1480.248
w 33 0.2190.2170.3810.243
w 34 0.3080.3060.3390.239
w 41 1.0001.0001.0001.000
r0.9620.9610.927
Table 4. The average sub-criteria weights and correlation coefficients for each technique related to category S.
EntropyStatistical VarianceMERECFuzzy MEREC
w 11 0.3250.3250.3320.330
w 12 0.3410.3400.3410.343
w 13 0.3340.3340.3270.328
w 21 0.3230.3230.3150.331
w 22 0.3450.3430.3680.337
w 23 0.3330.3340.3170.332
w 31 0.2500.2520.2240.255
w 32 0.2410.2420.2300.250
w 33 0.2380.2400.2410.254
w 34 0.2700.2660.3050.242
Table 5. The average sub-criteria weights and correlation coefficients for each technique related to category M.
EntropyStatistical VarianceMERECFuzzy MEREC
w 11 0.1880.1880.1870.200
w 12 0.1970.1970.1960.202
w 13 0.2100.2100.2130.195
w 14 0.1950.1970.1830.204
w 15 0.2100.2080.2210.200
w 21 0.3390.3380.3470.335
w 22 0.3380.3420.3020.326
w 23 0.3230.3210.3510.339
w 31 0.2520.2510.2630.251
w 32 0.2430.2440.2440.253
w 33 0.2540.2550.2420.246
w 34 0.2510.2500.2510.250
w 41 0.3300.3320.3120.324
w 42 0.3280.3290.3390.336
w 43 0.3410.3390.3490.340
Table 6. The average sub-criteria weights and correlation coefficients for each technique related to category L.
EntropyStatistical VarianceMERECFuzzy MEREC
w 11 0.1680.1670.1740.166
w 12 0.1630.1640.1510.169
w 13 0.1690.1690.1720.163
w 14 0.1670.1660.1840.168
w 15 0.1660.1660.1670.168
w 16 0.1670.1680.1520.166
w 21 0.2570.2580.2420.251
w 22 0.2450.2450.2530.247
w 23 0.2450.2440.2490.245
w 24 0.2540.2530.2560.258
w 31 0.1400.1400.1380.142
w 32 0.1420.1420.1340.145
w 33 0.1390.1390.1430.139
w 34 0.1420.1430.1290.142
w 35 0.1470.1470.1630.146
w 36 0.1500.1500.1370.143
w 37 0.1400.1400.1560.144
w 41 0.3270.3270.3500.329
w 42 0.3310.3310.3020.342
w 43 0.3420.3410.3480.330
Table 7. The average sub-criteria weights and correlation coefficients for each technique related to category XL.
EntropyStatistical VarianceMERECFuzzy MEREC
w 11 0.1660.1670.1580.170
w 12 0.1680.1680.1550.166
w 13 0.1680.1680.1730.163
w 14 0.1690.1680.1690.174
w 15 0.1620.1630.1540.163
w 16 0.1670.1670.1910.164
w 21 0.2480.2480.2460.257
w 22 0.2520.2520.2330.248
w 23 0.2510.2510.2540.250
w 24 0.2490.2490.2670.246
w 31 0.1420.1420.1350.145
w 32 0.1410.1400.1600.144
w 33 0.1430.1430.1300.142
w 34 0.1440.1440.1580.141
w 35 0.1470.1470.1430.142
w 36 0.1420.1420.1460.137
w 37 0.1410.1410.1300.149
w 41 0.2530.2540.2310.235
w 42 0.2450.2450.2580.254
w 43 0.2490.2480.2510.257
w 44 0.2530.2530.2600.254
w 51 0.2450.2460.2580.255
w 52 0.2460.2460.2330.242
w 53 0.2530.2530.2580.254
w 54 0.2550.2540.2520.250
Table 8. The correlation coefficients for each technique related to category S, M, L and XL.
CategoryMethodEntropyStatistical VarianceMERECFuzzy MEREC
SEntropy1.000
Statistical Variance0.9991.000
MEREC0.9340.9221.000
Fuzzy MEREC0.9610.9690.8341.000
MEntropy1.000
Statistical Variance0.9991.000
MEREC0.9700.9641.000
Fuzzy MEREC0.9870.9860.9741.000
LEntropy1.000
Statistical Variance0.9991.000
MEREC0.9830.9821.000
Fuzzy MEREC0.9970.9970.9781.000
XLEntropy1.000
Statistical Variance0.9991.000
MEREC0.9710.9701.000
Fuzzy MEREC0.9920.9920.9731.000
Table 9. Correlation coefficient values of criteria weights between original data and modified data with 2%, 6%, and 12% outliers respectively for category S, M, and L.
CategoryMethodsCorrelation Coefficient Values
with 2% Outlierswith 6% Outlierswith 12% Outliers
SEntropy0.9983581980.9933355680.988032446
Statistical Variance0.9992940770.9967116790.993499016
MEREC0.8471631490.8477954910.849045085
Fuzzy MEREC0.9999985990.9999862760.999937175
MEntropy0.9995921190.9983407960.997011060
Statistical Variance0.9997809700.9989718100.997952302
MEREC0.9673075460.9671901600.966634652
Fuzzy MEREC0.9999998710.9999987380.999994272
LEntropy0.9998740770.9995026730.999117432
Statistical Variance0.9999330300.9996945310.999403844
MEREC0.9826858660.9827264650.982680325
Fuzzy MEREC0.9999999070.9999990970.999995898
XLEntropy0.9998953780.9995810700.999248434
Statistical Variance0.9999465170.9997529580.999511542
MEREC0.9724135820.9725092550.972514598
Fuzzy MEREC0.9999999680.9999996910.999998594
Table 10. Average CPU time of the weighting techniques related to category S, M, L and XL.
CategoryAverage CPU Time (ms)
MERECFuzzy MEREC
S31.2515.63
M78.1346.88
L234.38109.38
XL578.13296.88
Disclaimer/Publisher’s Note: The statements, opinions and data contained in all publications are solely those of the individual author(s) and contributor(s) and not of MDPI and/or the editor(s). MDPI and/or the editor(s) disclaim responsibility for any injury to people or property resulting from any ideas, methods, instructions or products referred to in the content.

