Article

An Adapted Multi-Objective Genetic Algorithm for Healthcare Supplier Selection Decision

by
Marwa F. Mohamed
1,
Mohamed Meselhy Eltoukhy
1,2,
Khalil Al Ruqeishi
3,* and
Ahmad Salah
4,5
1
Department of Computer Science, Faculty of Computers and Informatics, Suez Canal University, Ismailia 41522, Egypt
2
Department of Information Technology, College of Computing and Information Technology at Khulais, University of Jeddah, Jeddah 21959, Saudi Arabia
3
Mathematical and Physical Sciences Department, College of Arts and Sciences, University of Nizwa, P.O. Box 33, Nizwa 616, Oman
4
Information Technology Department, College of Computing and Information Science, University of Technology and Applied Sciences, P.O. Box 75, Nizwa 612, Oman
5
Department of Computer Science, College of Computers and Informatics, Zagazig University, Sharkia 44519, Egypt
*
Author to whom correspondence should be addressed.
Mathematics 2023, 11(6), 1537; https://doi.org/10.3390/math11061537
Submission received: 1 February 2023 / Revised: 12 February 2023 / Accepted: 14 February 2023 / Published: 22 March 2023
(This article belongs to the Section Mathematics and Computer Science)

Abstract

:
With the advancement of information technology and economic globalization, the problem of supplier selection is gaining in popularity. The impact of supplier selection decisions made were quick and noteworthy on the healthcare profitability and total cost of medical equipment. Thus, there is an urgent need for decision support systems that address the optimal healthcare supplier selection problem, as this problem is addressed by a limited number of studies. Those studies addressed this problem mathematically or by using meta-heuristics methods. The focus of this work is to advance the meta-heuristics methods by considering more objectives rather than the utilized objectives. In this context, the optimal supplier selection problem for healthcare equipment was formulated as a mathematical model to expose the required objectives and constraints for the sake of searching for the optimal suppliers. Subsequently, the problem is realized as a multi-objective problem, with the help of this proposed model. The model has three minimization objectives: (1) transportation cost; (2) delivery time; and (3) the number of damaged items. The proposed system includes realistic constraints such as device quality, usability, and service quality. The model also takes into account capacity limits for each supplier. Next, it is proposed to adapt the well-known non-dominated sorting genetic algorithm (NSGA)-III algorithm to choose the optimal suppliers. The results of the adapted NSGA-III have been compared with several heuristic algorithms and two meta-heuristic algorithms (i.e., particle swarm optimization and NSGA-II). The obtained results show that the adapted NSGA-III outperformed the methods of comparison.

1. Introduction

Logistics services are currently a major driver of economic growth and competitiveness for both governments and businesses [1]. Logistics is the process of combining two or more processes in order to plan, execute and/or efficiently organize the movement of goods and products from their origin to their final destination [2]. Transportation, inventory, warehousing, shipping handling, and packaging are all part of logistics. The use of logistics leads to better project management and reduces cost and risk. Recently, there has been much controversy surrounding the use of practices and strategies in logistics and supply chain management in healthcare [3].
Healthcare is one of the most important services provided by the government and institutions. Its goals include maximizing health benefits and physical participation, minimizing health risks, expanding patient options, meeting resources and boundaries, and being fair and equitable [4]. Healthcare logistics includes the process of handling physical goods (such as medicine, medical-surgical products, medical equipment, sterile items, food, etc.), and receiving goods within a hospital for delivery at patient care sites. Hospitals’ internal supply chains are complex, such as supplying expensive products and medical devices used in operating rooms, tracking inventory due to urgent need for treatment, unexpected demand for medical supplies, storing many different types of supplies in multiple storage rooms throughout the hospital, and other challenges that are facing logistics managers [5]. The use of high-performance logistics addresses these challenges and provides high-quality, safe patient care in addition to increasing efficiency and reducing costs. As a result, it pays to have good hospital logistics processes in place to manage supplies and deliver them to patient care units.
Today in the healthcare environment, it is hard to generate low-cost, high-quality items without satisfied vendors. As a result, selecting and maintaining a competent group of vendors, suppliers, or service providers, is one of the most crucial purchasing decisions [6]. A vendor is a company that sells little amounts of goods and services to other companies or individuals. They can stock a variety of things that they sell to a variety of consumers who subsequently resell or utilize the items for personal use [7]. The vendor selection (VS) problem is discussed in many research studies. For example, in [8], the authors have developed methods that are tested on a construction company in Indonesia. They proposed using the fuzzy ELECTRE (Elimination Et Choix Traduisant la Realité) method to solve PT Wijaya Karya’s cement vendor selection problem. In [9], the authors introduced the cloud vendor selector (CVS), a new decision-making framework, for selecting cloud vendors that address the challenges of arbitrary criteria weighting and poor uncertainty management.
A supplier is a company that sells large amounts of goods and services to other companies. Suppliers might either make their own products or buy them from a manufacturer. Their purpose is to sell specialized commodities to other firms, such as merchants, so that the goods may be resold [7]. Several studies addressed the optimal supplier selection problem. For example, in [10], a fuzzy model of the supplier selection problem for multiple products is described, in which the overall objective function is improved by applying the piece-wise linear membership function (PLMF) for specific criteria. Debnatha et al. suggested a sustainable supplier selection procedure for healthcare testing facilities using an integrated multi-criteria decision-making (MCDM) framework that combines weighted aggregated sum product assessment (WASPA) and stepwise weight assessment ratio analysis (SWARA) [11].
The selection of a service provider is a classic multi-criteria decision issue. The goal is to choose a small number of appropriate providers from a pool of candidates to provide services [12]. For example, the work proposed in [13] proposed a healthcare logistics service provider selection approach using a novel weighted density-based hierarchical cluster analysis with the integration of the analytic hierarchy process (AHP). The work proposed in [2] used (multiple objective optimizations on the basis of ratio analysis plus full multiplicative form) MULTIMOORA and fuzzy best–worst method (FBWM) to create a decision support system (DSS) model for choosing a logistics service provider in the machine manufacturing business. Vendor, supplier, and provider selection are the same problem with different perspectives. Thus, in the remaining sections, we will refer to these concepts as supplier selection.
Working with a solid group of suppliers is critical to the success of the healthcare industry. By choosing the right suppliers and involving them in strategic supply management operations, it is possible to save material prices and product development time by 20% while enhancing material quality by 20% [14] as well. It is obvious that the supplier selection process affects the success of the healthcare industry as a whole. Two questions are particularly important when choosing suppliers. The first question is what criteria should be employed (e.g., delivery time, cost, technical capability, performance history, and repair service). The second question is what are the methodologies that may be applied to compare suppliers? [6]. One of the most efficient methods is a multi-objective decision-making process where decision-makers must balance the competing objectives [15]. Meta-heuristics algorithms are one of the primary ways to face these challenges. NSGA-III is currently considered one of the most powerful multi-objective meta-heuristic optimization algorithms [16].
The problem statement of this work can be defined as selecting the optimal supplier selection for healthcare. The healthcare institution needs to select a number of suppliers among a wide list of suppliers to achieve three goals: (1) reducing the transportation cost, (2) reducing delivery time, and (3) reducing the number of damaged items. Thus, the problem of selecting the best suppliers for achieving these three objectives can be framed as an optimization problem.
The motivations of this work are two-fold. First, this work is motivated by the limited studies that utilized the meta-heuristics methods to address the optimal provider selection problem in the healthcare industry. Second, the lack of utilizing the NSGA-III algorithm in the optimal provider selection problem motivated this work, as NSGA-III successfully outperformed other meta-heuristics methods in several domains. In other words, the selection of NSGA-III is linked to its superior performance on many and multi-objective problems. In this context, a multi-objective optimizations mathematical model is proposed, as well as adapted NSGA-III methods to present a support system that addresses the problem at hand. In addition, it is proposed to use objectives related to the healthcare domain such as item damage rate, cost, and quality levels. The main contributions of this work can be summarized as follows:
  • To our knowledge, this is the first work to utilize the NSGA-III method to address the optimal supplier selection problem for healthcare. Considering a set of three minimization objectives is suggested.
  • Evaluating the proposed method to study the effects of several factors, e.g., population size and the number of generations on the obtained solutions is recommended.
  • The proposed method is compared against several heuristics and meta-heuristics, where the obtained results show that the proposed adapted NSGA-III model outperformed the other methods of comparison. For instance, the proposed method found a solution that is better than the best solution found by any heuristic by 12% for one instance of the used dataset.
The rest of the paper is organized as follows. Section 2 discusses the related work. Section 3 presents the problem definition. Section 4 presents the proposed adapted NSGA-III method. Evaluation of the proposed method is presented in Section 5. Finally, the paper is concluded in Section 6.

2. Related Work

One of the most important responsibilities of buying management in a supply chain is supplier selection. Choosing the proper suppliers lowers purchasing costs while increasing company competitiveness as well. Recently, a variety of strategies have been created to fulfill the requirements of the supplier selection process. Although numerous classifications exist in the literature for models designed for supplier selection, this article focuses on meta-heuristic approaches.
The work proposed in [17] determined the underlying buying configuration that focused on supplier selection and supply quantity allocation issues. To analyze the product part configuration and construct the supplier assessment and quantity allocation model, a genetic algorithm (GA)-based technique was presented. The work proposed in [18] developed a multi-objective mathematical model for built-to-order supply chain challenges that incorporate supplier selection, product assembly, and the supply chain logistic distribution system to fulfill market expectations. The multi-objective optimization issue was efficiently solved using a GA. The work proposed in [19] presented a multi-objective nonlinear programming model for joint pricing, lot sizing, and supplier selection using a non-dominated sorting GA (i.e., NSGA-II). In [20], the authors proposed constructing and solving a multi-objective optimization problem for supplier selection and product line design using NSGA–II as well.
The work proposed in [21] provided an integer-programming model that takes into account the multi-buyer group optimization in a network of buyers and suppliers. The GA is used to examine the suggested multi-product and multi-buyer supplier selection model, which aims to maximize two objective functions at the same time. Buyers employed linguistic factors to assess suppliers in the suggested ranking model. From the perspective of purchasers, a fuzzy analytic hierarchy process (AHP) ranking model was employed to rank each product of each supplier. The authors proposed a model based on the network optimization issue to avoid exceeding the restrictions of production capacity as well as demand limitations. Finally, a GA was developed to obtain an appropriate solution that considers both the model’s cost and quality objectives.
The work proposed in [22] provides a novel hybrid technique for supplier selection that combines ant colony optimization (ACO) and GA. The authors introduced a multi-objective linear programming model for supplier selection considering the objectives of product quality, pricing, delivery capability, and innovation ability. In addition, they applied the technique for order of preference by similarity to ideal solution (TOPSIS) to simplify the multi-objective into a single entity. The work proposed in [23] utilized a hybrid meta-heuristic technique of GA and ACO to find a potential optimum solution (a more effective delivery route with fewer iterations) to a milk-run delivery problem in lean supply chain management.
A multi-objective availability-redundancy allocation optimization model for a hyper-system is presented in [24]. Series-parallel subsystems with multi-failure and multi-state components make up the systems’ structure. The components may be acquired from a variety of vendors depending on pricing and discounts. The goal of the model is to determine the best quantity and kind of subsystem components for all systems from each supplier, as well as the degree of technical and organizational activities. The suggested model uses four multi-objective meta-heuristics: NSGA-II, NSGA-III, non-dominated ranking genetic algorithm (NRGA), and multi-objective evolutionary algorithm based on decomposition (MOEA/D). The NSGA-III and MOEA/D algorithms have a superior performance in solving the supplied model.
Table 1 summarizes the main studies which addressed the provider selection problem. From this discussion, one can conclude that there is no previous work addressing the problem of supplier selection problem in healthcare using the meta-heuristics methods. Of note, there are only two research works that addressed the same problem but used mathematical models rather than meta-heuristics [12,13]. In addition, the dominant GA used in finding the optimal supplier selection problem is NSGA-II with one exception, the work proposed in [24]. The performance of NSGA-III is better than NSGA-II when the number of objectives is more than two. Thus, using NSGA-III is more suitable for the problem of optimal supplier selection, as it has many objectives.

3. Problem Definition and Mathematical Model

Selecting an appropriate supplier is one of the most significant steps in logistic healthcare management, which encompasses all operations beginning with raw material procurement and is a vital process impacting subsequent stages. The selection of acceptable suppliers is a difficult task since it necessitates several assessment constraints and objectives. This paper focuses on the selection of the optimal suppliers based on a number of constraints and objectives. It assigns a number of M devices to a set of P suppliers, where P j represents the jth supplier, j [ 1 , N ] , and  P j P . Likewise, D is a set of devices, where D i j represents the ith device offered by supplier j. Table 2 summarizes the main symbols that are used in the proposed model.
In [13], the authors collected a set of surveys and questionnaires gathered by the researchers from healthcare manufacturers. Then, they proposed a scientific evaluation index of the logistic suppliers which is created empirically based on the following factors: lead time, damage rate, transportation cost, manufacturing cost, administration cost, device quality, delivery reliability, service quality, and technical skills. In this paper, we selected the first five factors (i.e., lead time, damage rate, transportation cost, manufacturing cost, and administration cost) as the main objectives of the proposed method, due to their importance. The other factors suggested in [13] are used as constraints in the proposed model.

3.1. The Proposed Model’s Constraints

The model has four constraints. The first constraint, as shown in Equation (1), represents the device quality D Q i j offered by the supplier j which is greater than or equal to the healthcare institution’s device quality threshold D Q c o n i . The second constraint, as shown in Equation (2), represents the device usability D U i j offered by the supplier j is greater than or equal to the healthcare institution usability threshold D U c o n i . The third constraint, as shown in Equation (3), represents the service quality S Q i j which is the supplier’s capability to achieve healthcare institution’s requirements and anticipate future requests. Finally, Equation (4) represents the fourth constraint; it represents the number of devices that can be offered by one supplier, where this number cannot exceed the M a x L i m i t . Every supplier has M a x L i m i t devices that can be sold to the healthcare institution.
D Q i j D Q c o n i
D U i j D U c o n i
S Q i j S Q c o n i
i = 1 M D i j M a x L i m i t

3.2. The Proposed Model’s Objectives

The main three objectives of the proposed model are minimizing the cost f ( c ) , the delivery time f ( t ) , and the number of damaged items f ( d ) . The cost objective is defined in Equations (5) and (6); the equation includes transportation, manufacturing, and administration costs. The transportation cost T C i j is the cost of transportation. The manufacturing cost M C i j is the cost associated with the production process. Finally, the administration management cost A C i j represents the administrative management expenses. The second objective, f ( t ) , is represented in Equation (7); it represents the lead time from placing an order until the order is received by the healthcare institution. The third objective, f ( d ) , is denoted in Equation (8), which represents the number of damaged items during storing the received medical devices.
C t o l i = T C i j + M C i j + A C i j
m i n f ( c ) = j = 1 n i = 1 M C t o l i
m i n f ( t ) = j = 1 n i = 1 M T i j
m i n f ( d ) = j = 1 n i = 1 M D I t e m i j

4. The Proposed Model

In this paper, it is recommended to utilize the logistic supplier selection method (LSSM) that is used to select the best set of n suppliers out of N available suppliers to provide a set of M devices. 
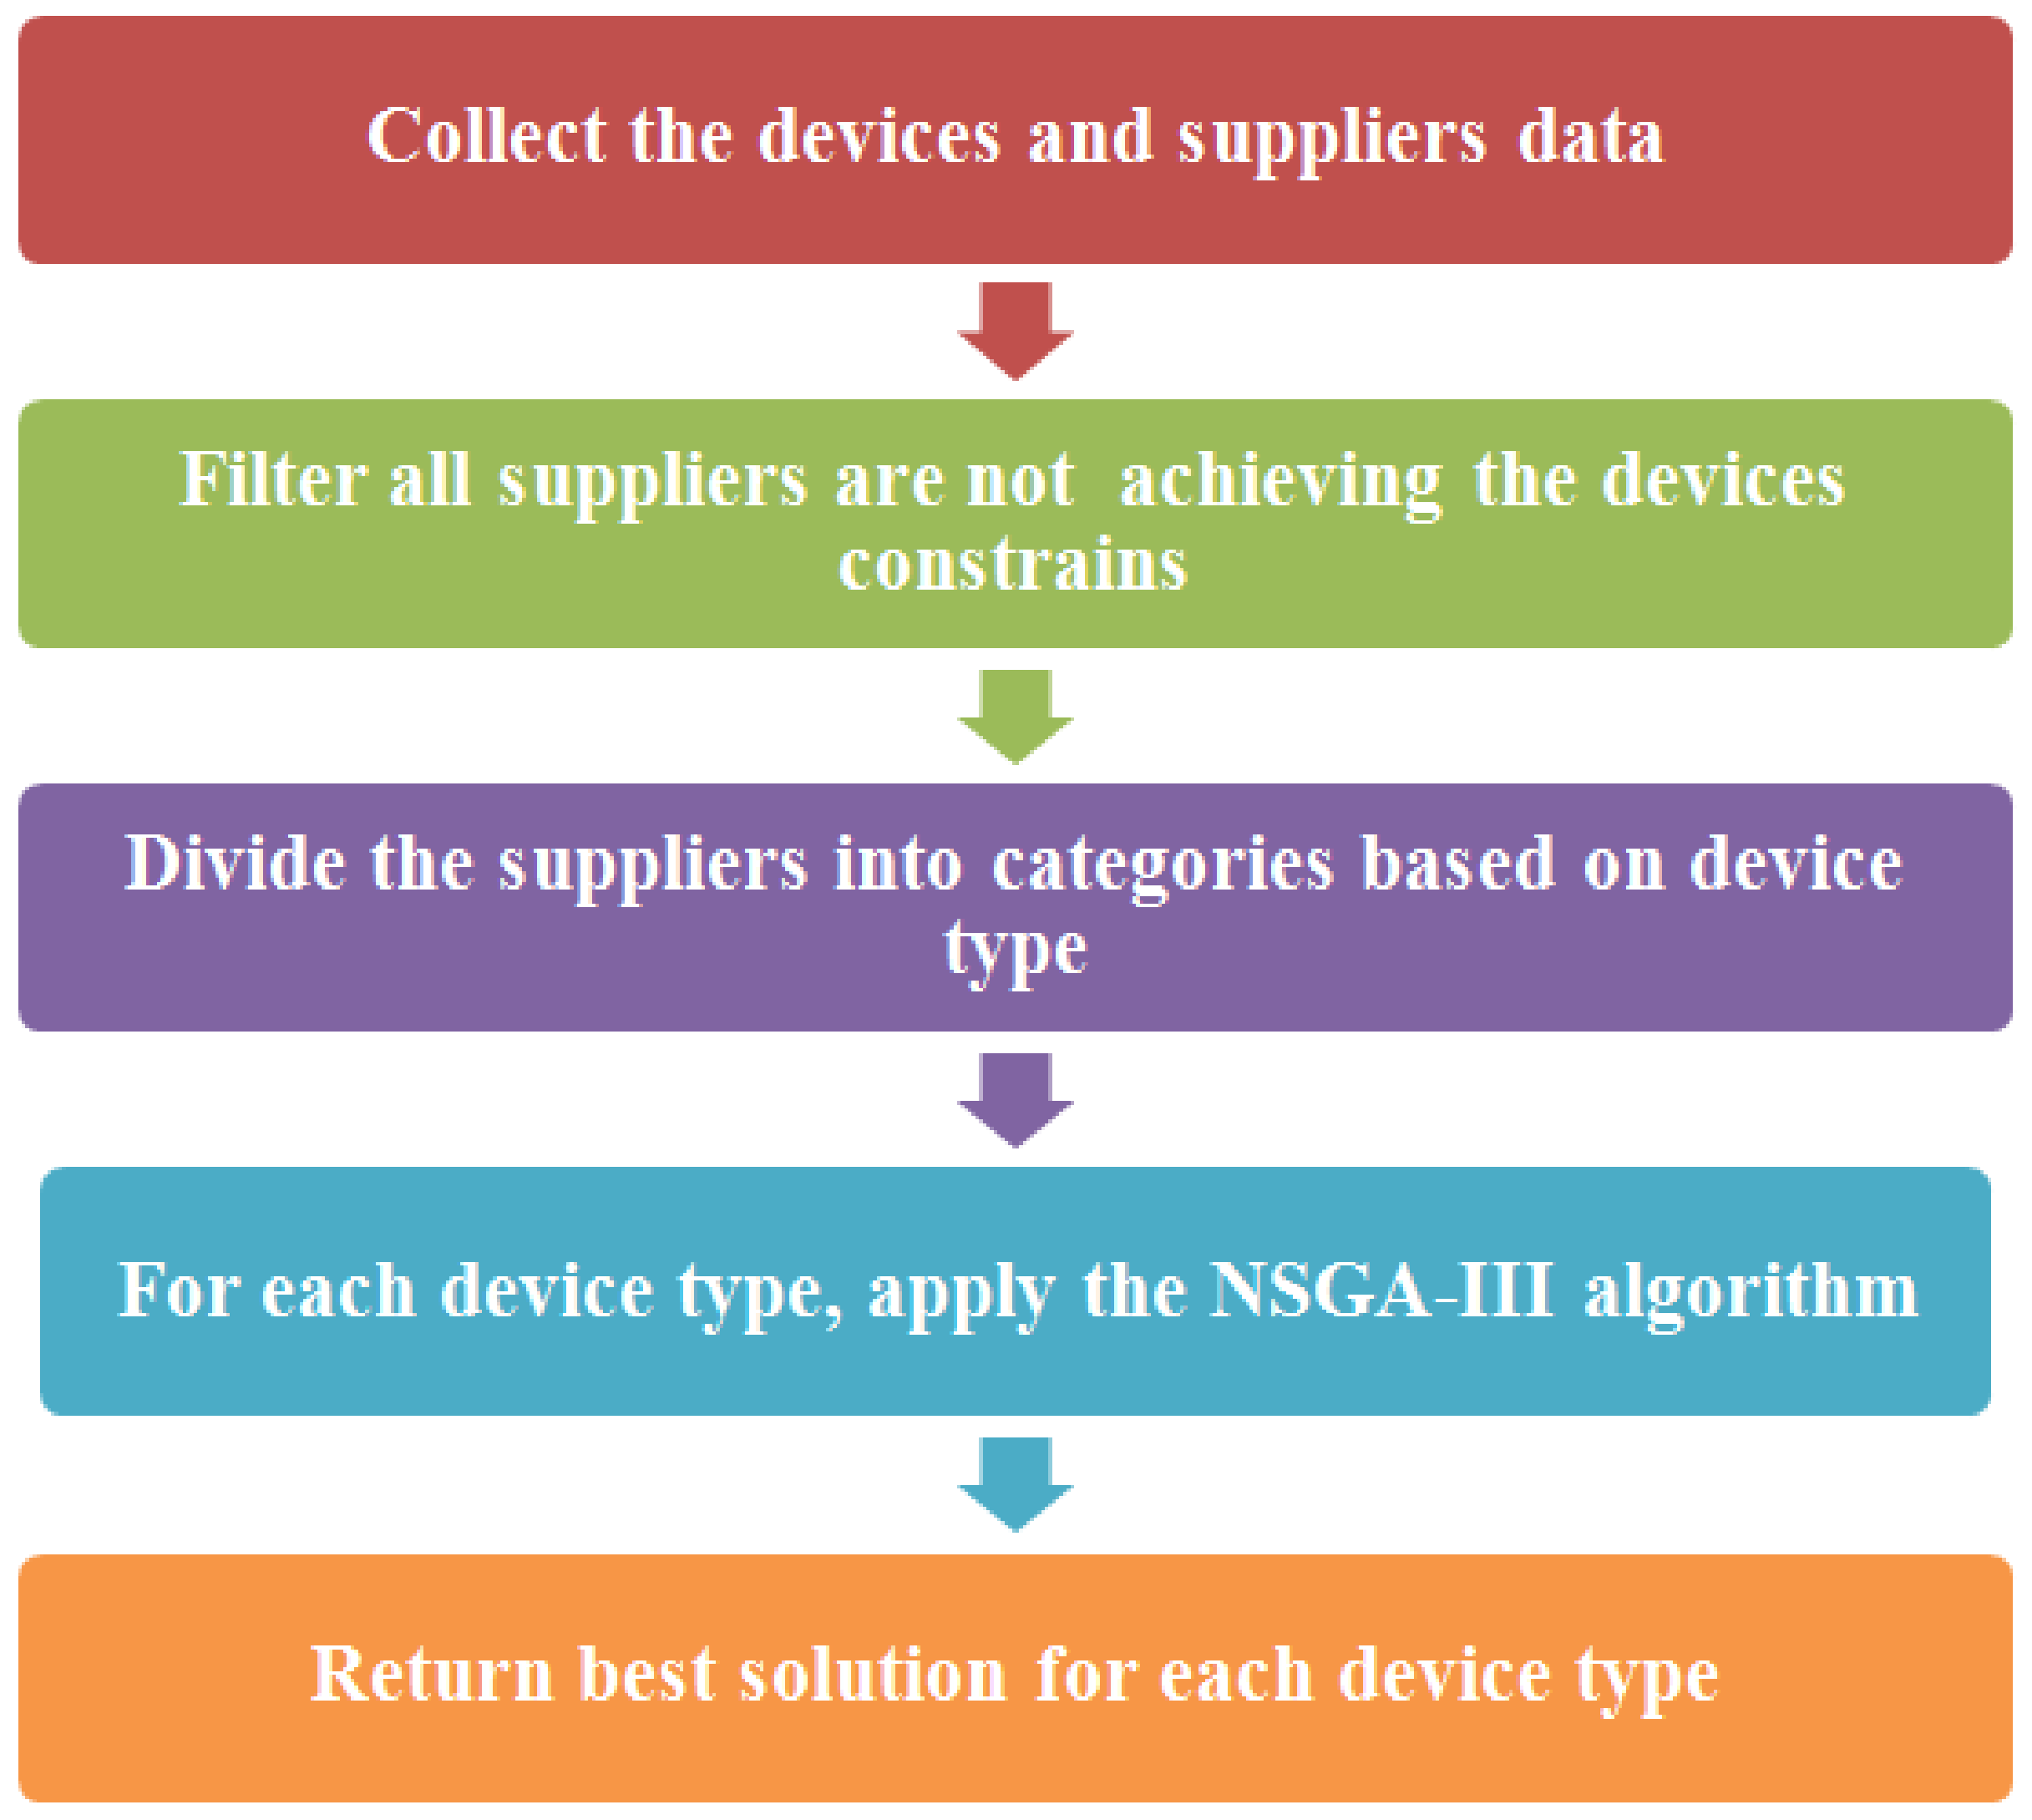
Figure 1 depicts the steps of the proposed method. In Figure 1, first, the data about the devices and the suppliers’ requests are collected. Second, all suppliers’ requests which do not fulfill the constraints of the device (constraints 1 to 3) are removed from the search space. Third, it is assumed that the healthcare institution requires three different types of devices, namely, D 1 , D 2 , and  D 3 and the counterpart quantities are M 1 = 1000 , M 2 = 1200 , and  M 3 = 1400 , respectively. The proposed model divides this problem into three problems, one problem for each device type, and then each problem is solved separately. Fourth, for each device type problem, applying the adapted NSGA-III algorithm is suggested. The NSGA-III implementation is described in detail in [25]. The NSGA-III was utilized where the integer sampling, half uniform crossover, and polynomial mutation parameters are set as proposed in [26]. Finally, for each device type problem, the model returns the best set of suppliers n.

4.1. Solution Construction

In the beginning, the solutions/individuals of the GA are constructed randomly. Each solution is represented as a one-dimensional array; its length is m, where m equals the number of devices M devised by M a x L i m i t . The 1D array, i.e., the solution, values represent the supplier number/ID. These values determine which supplier offers the device. The array values are in [ 0 , N 1 ] , where N is the number of suppliers. One supplier can offer at most [ M a x l i m i t ] devices. Thus, a supplier j appears once in the solution. However, one device type is offered by n suppliers, where n is the selected suppliers.
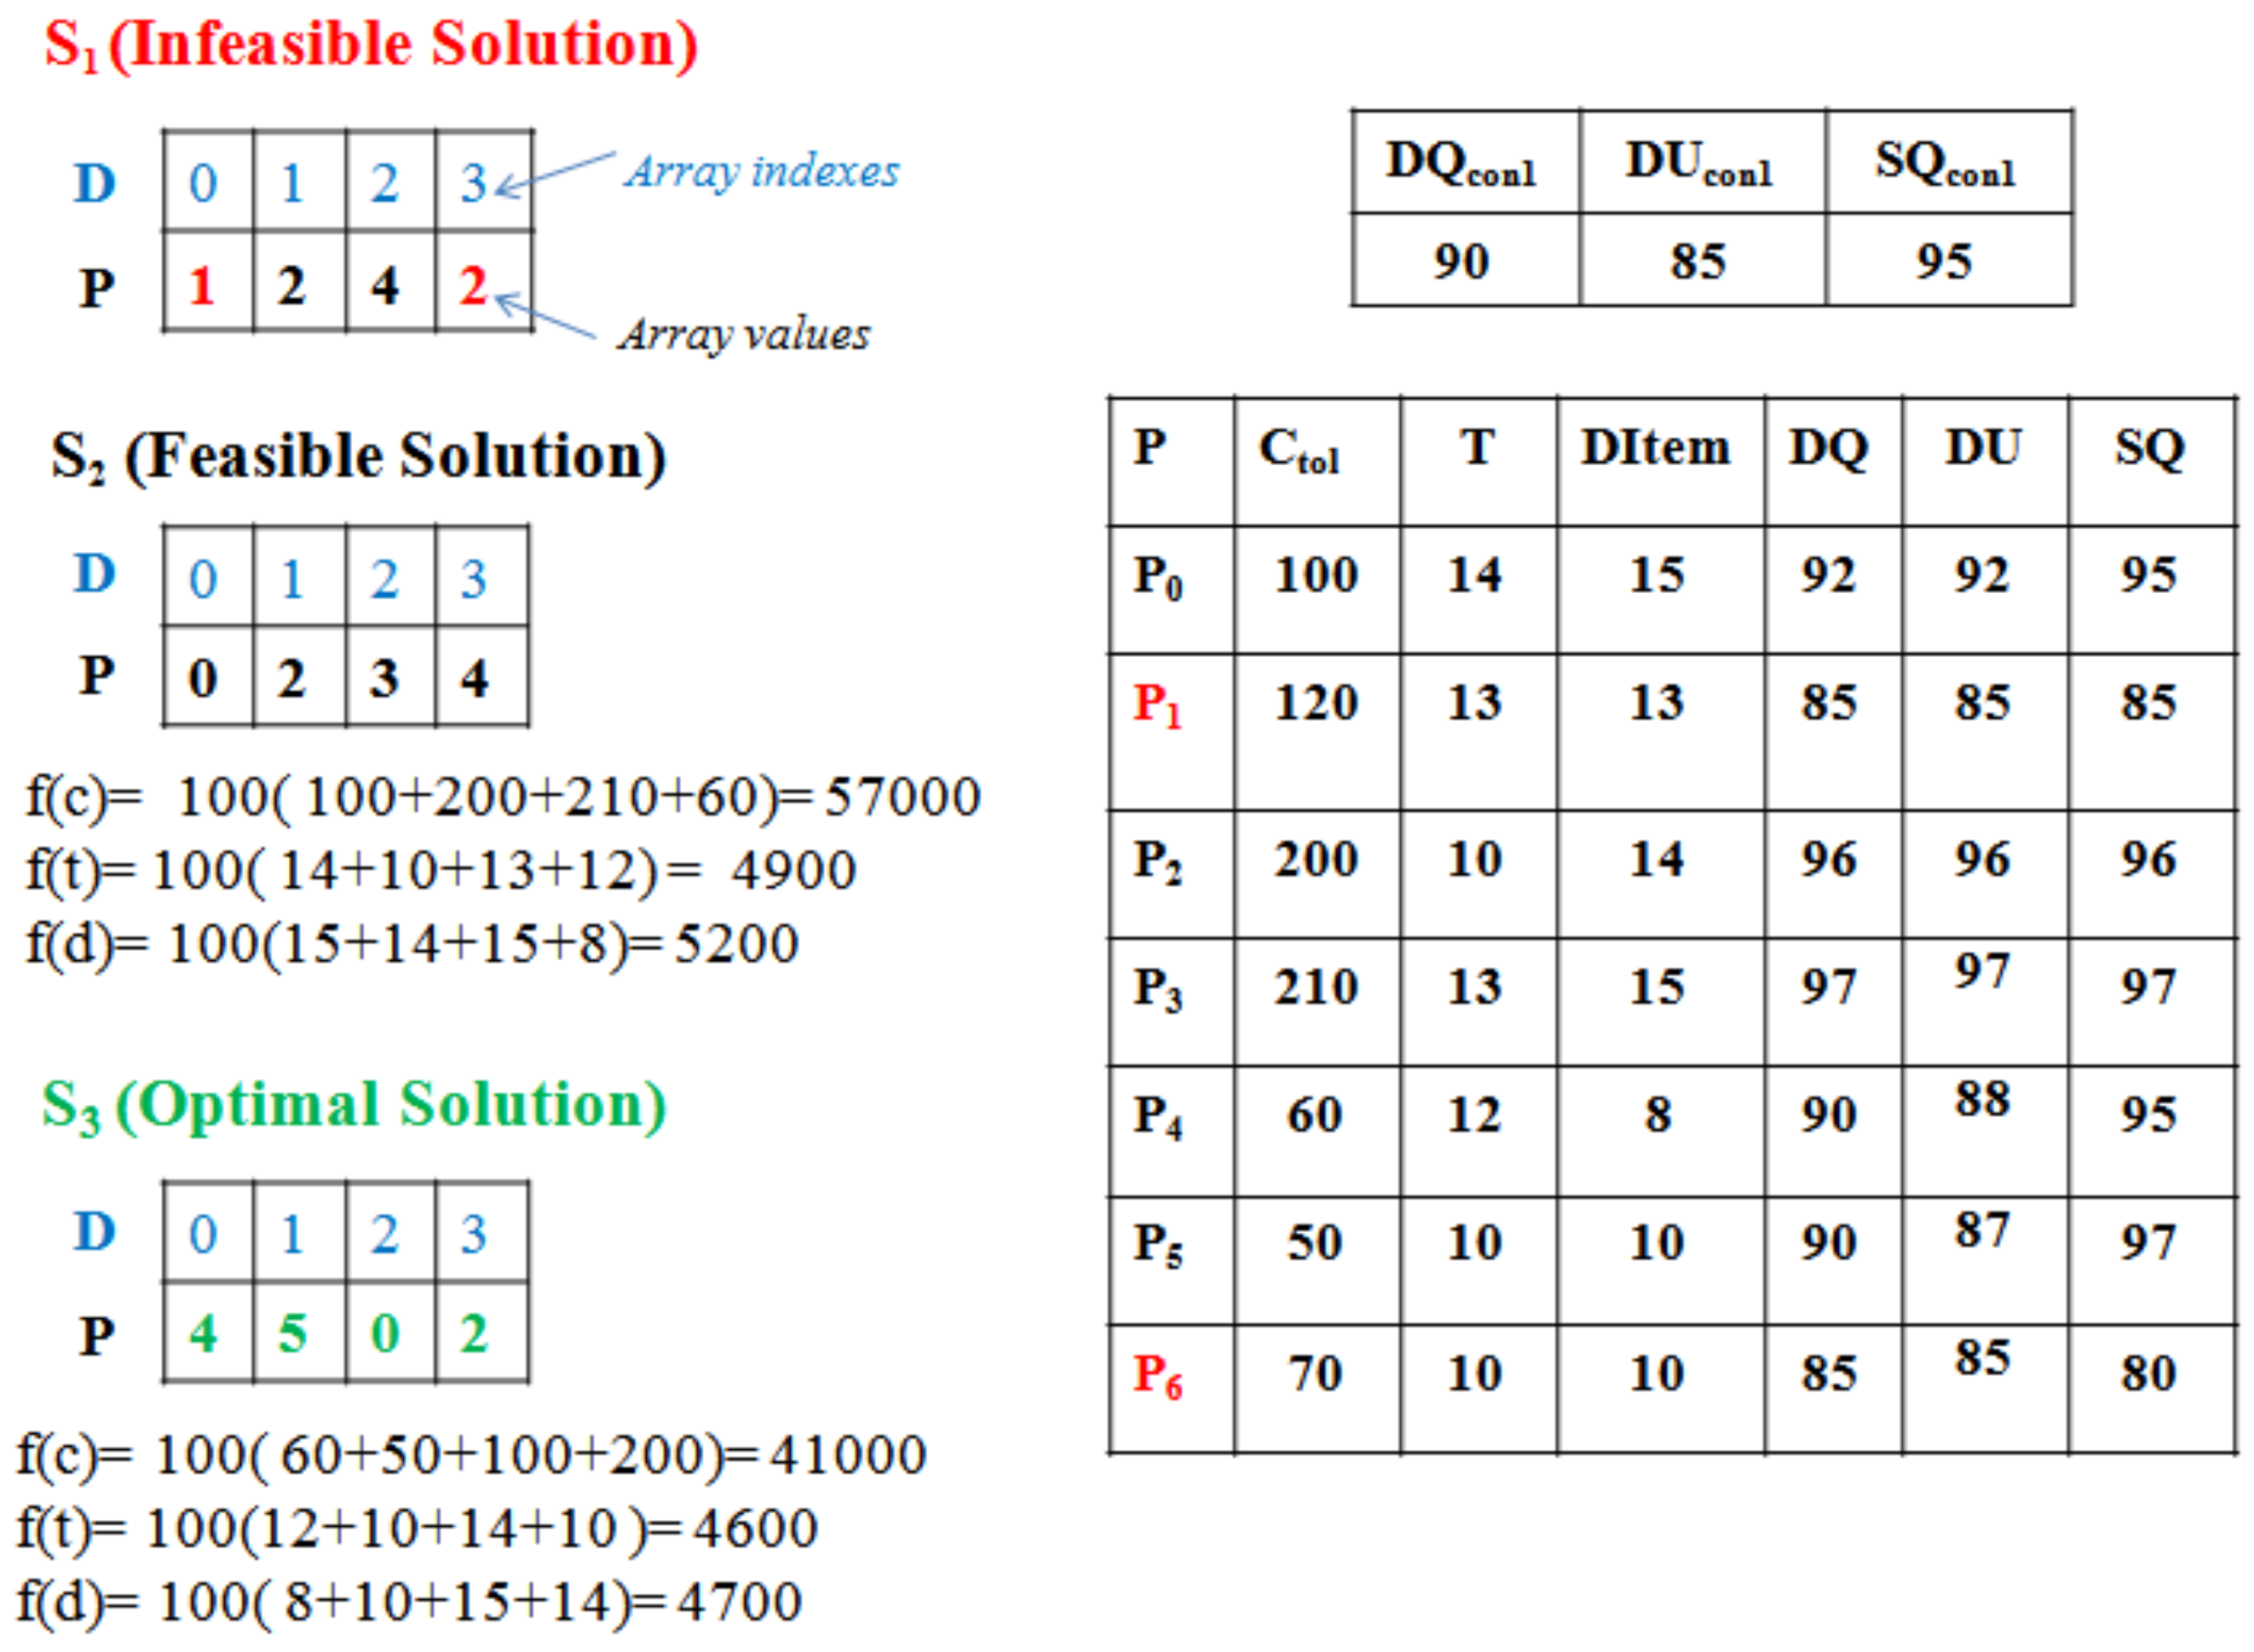
An example of the proposed model is depicted in Figure 2. Assume that there is one device type D 1 , and its constraints are as follows: device quality D Q c o n 1 = 90 , device usability D U c o n 1 = 85 , and service quality S Q c o n 1 = 95 , and there are seven available suppliers P 0 to P 6 . The number of the required D 1 devices is M = 400 , and the number of M a x L i m i t for each supplier is 100 devices. Thus, the solution should include the best 400 / 100 = 4 suppliers from the available seven suppliers; n = 4 and N = 7 . S 1 represents an infeasible solution; this is because the P 1 is not fulfilled the device constraints D Q 11 < 90 and S Q 11 < 95 . Moreover, the third supplier, P 2 is selected twice; thus, it offered a number of devices more than M a x L i m i t , 200 > 100. The second solution (i.e., S 2 ) represents a feasible solution because S 2 achieves all constraints and each supplier is selected once; but, S 2 is not the best solution. The third solution (i.e., S 3 ) represents the best solution, because it achieves the minimum cost f ( c ) , delivery time f ( t ) , and the number of damaged items f ( d ) . A discussion on how f ( c ) , f ( t ) , and  f ( d ) are evaluated in detail, will follow in the next subsection.

4.2. Population Updating and Repairing

The NSGA-III starts working on randomly generated solutions, and these solutions may or may not be met the problem constraints. Therefore, the solutions repair Algorithm 1 should be devised to convert an infeasible solution into a feasible solution through the proposed steps as follows. First, Algorithm 1 detects which suppliers do not fulfill the M a x L i m i t constraint and then deletes this supplier from the current solution. Second, Algorithm 1 selects the valid suppliers who provide the minimum cost. Of note, the other model constraints (e.g., D Q , D U , and  S Q ) have been filtered before the NSGA-III algorithm starts as explained in Figure 1.
Algorithm 1 Repair solution algorithm
Mathematics 11 01537 i001
Algorithm 2 aims to evaluate the objective functions, it evaluates the total cost, time, and the number of damaged items. For example, in Figure 2, the total cost f ( c ) of S 3 is 41,000, the total time f ( t ) is 4600, and the number of damaged items f ( d ) is 4700.
Algorithm 2 Evaluating objective functions algorithm
Mathematics 11 01537 i002

4.3. The Proposed Algorithm Complexity Analysis

Each iteration consists of two steps; the first step is to evaluate the objective functions of the generated solution. As listed in Algorithm 2, the algorithm consists of a single loop. Thus, its complexity is O ( m ) , where m is the length of the solution. The second step is to repair the generated infeasible solution. As listed in Algorithm 1, it consists of one nested loop. The outer loop checks whether the selected supplier is feasible or infeasible, and its complexity is O ( m ) . While the inner loop searches for the feasible supplier which has the lowest cost (SelectMinCost function). The worst-case for the SelectMinCost function is O ( N ) . Thus, the complexity of the repair algorithm is O ( m × N ) .

4.4. Setup

To validate the proposed model and measure its performance, we proposed applying four experiments. The proposed model is developed by using the Python Scripting language, where the pymoo library [26] is used to implement the adapted NSGA-III, NSGA-II, and particle swarm optimization (PSO) methods. The experiments are run on a PC with Intel ( R ) Core(TM) i7-6500U with 8GB of main memory. These experiments are divided into two categories as follows. The first category (i.e., Experiment 1): The proposed adapted NSGA-III algorithm has been compared to two meta-heuristic methods, namely, NSGA-II and PSO [27], and two heuristics, namely, First-Fit, and Best-Fit [28]. The best method of those aforementioned methods is decided based on Equation (9).
P e r f o r m a n c e ( P ) = w 1 × f ( c ) + w 2 × f ( t ) + w 3 × f ( d )
where weight w 1 = 0.4, and w 2 = w 3 = 0.3 
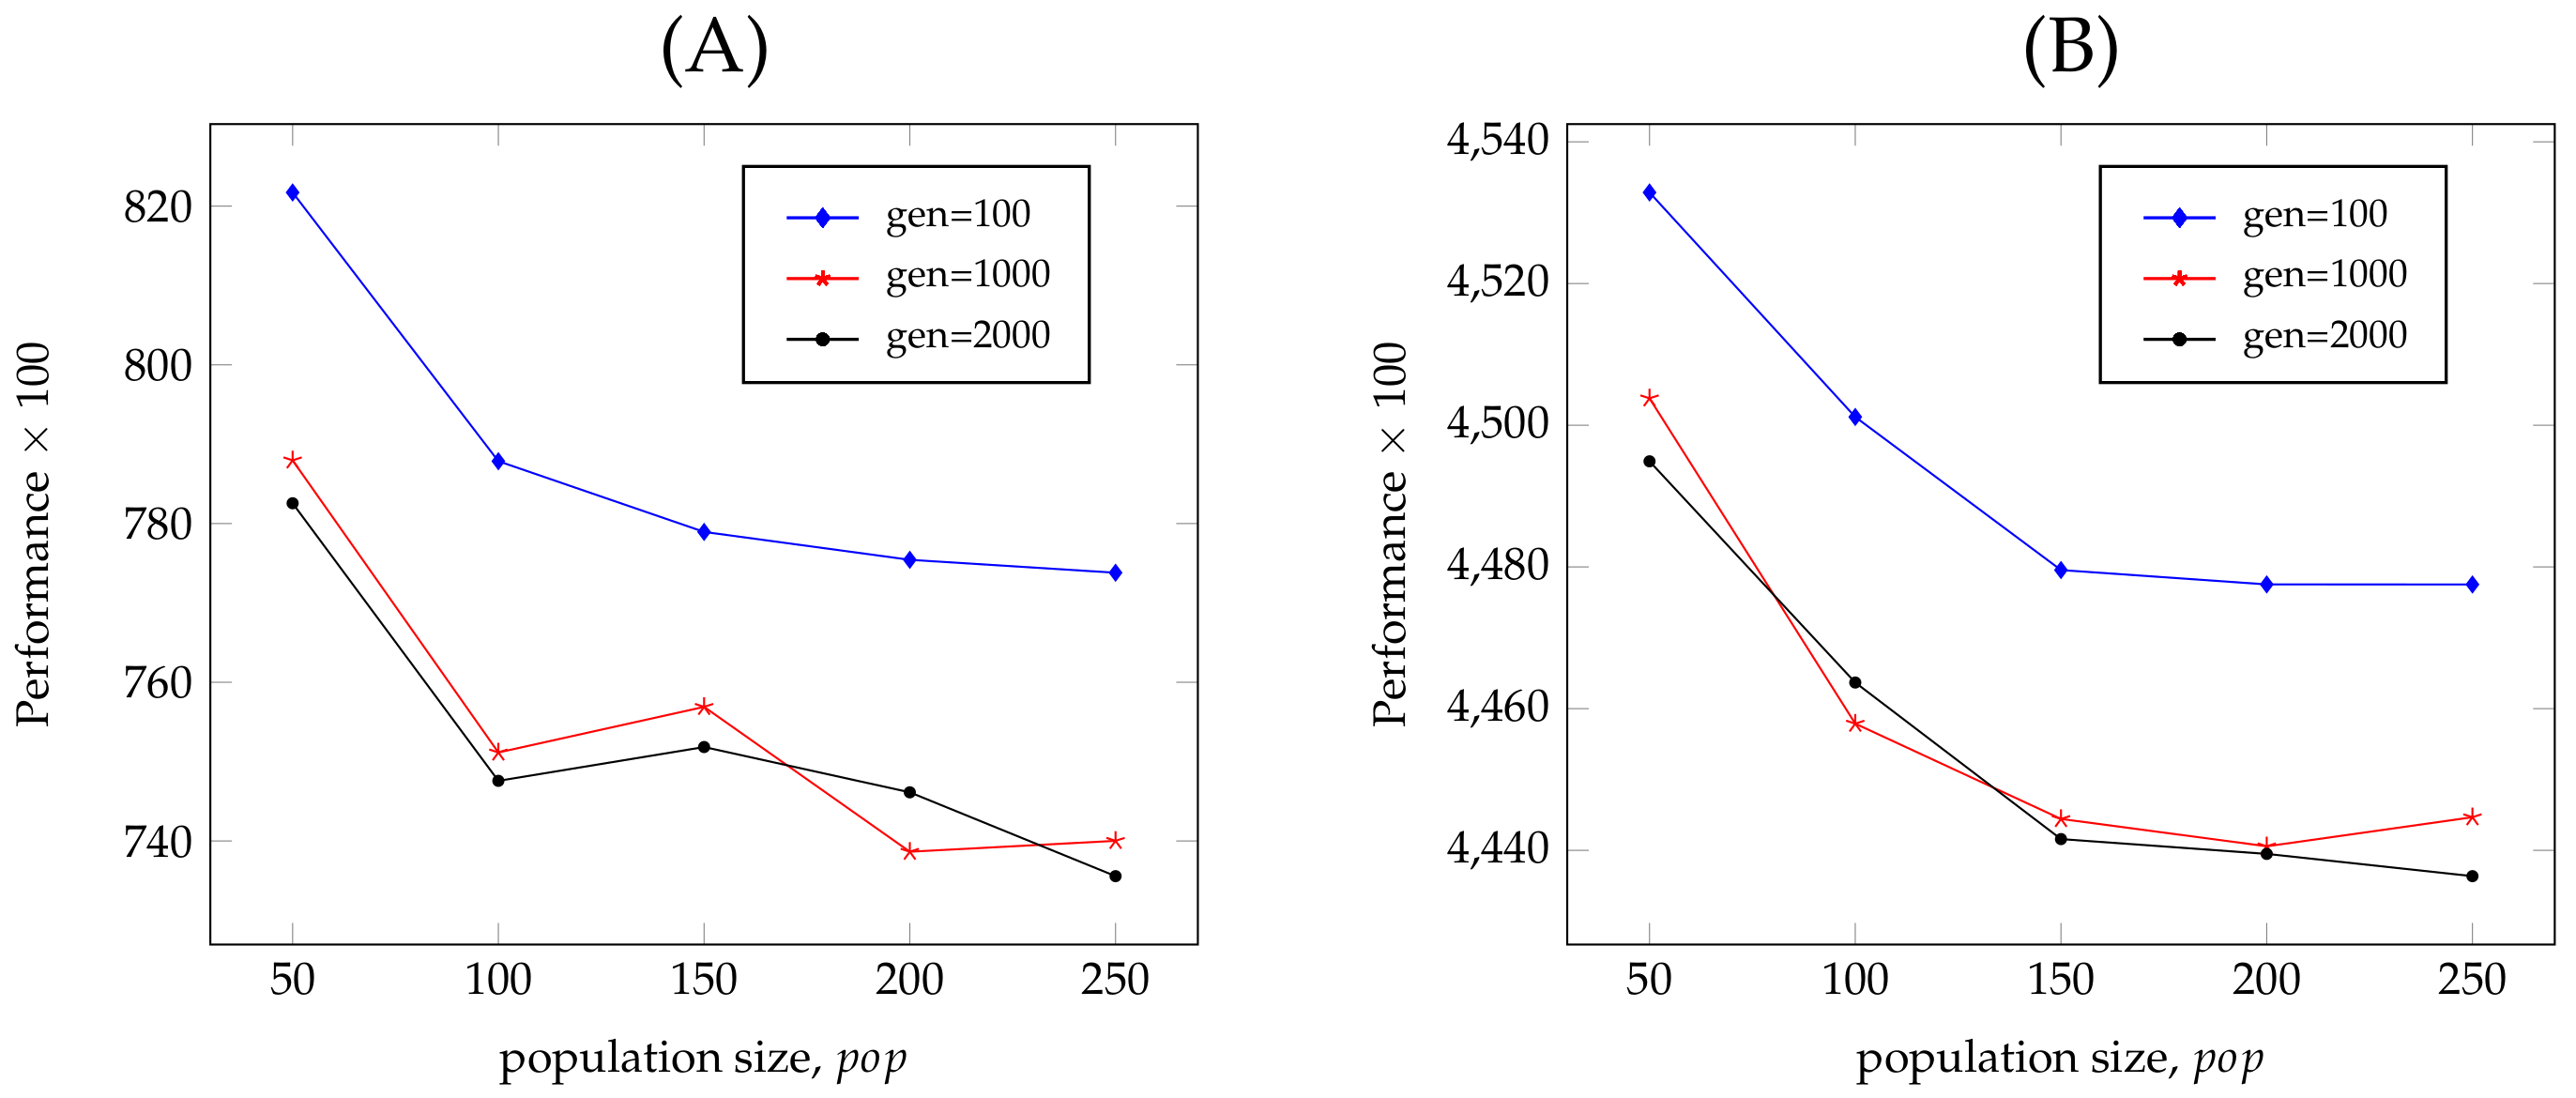
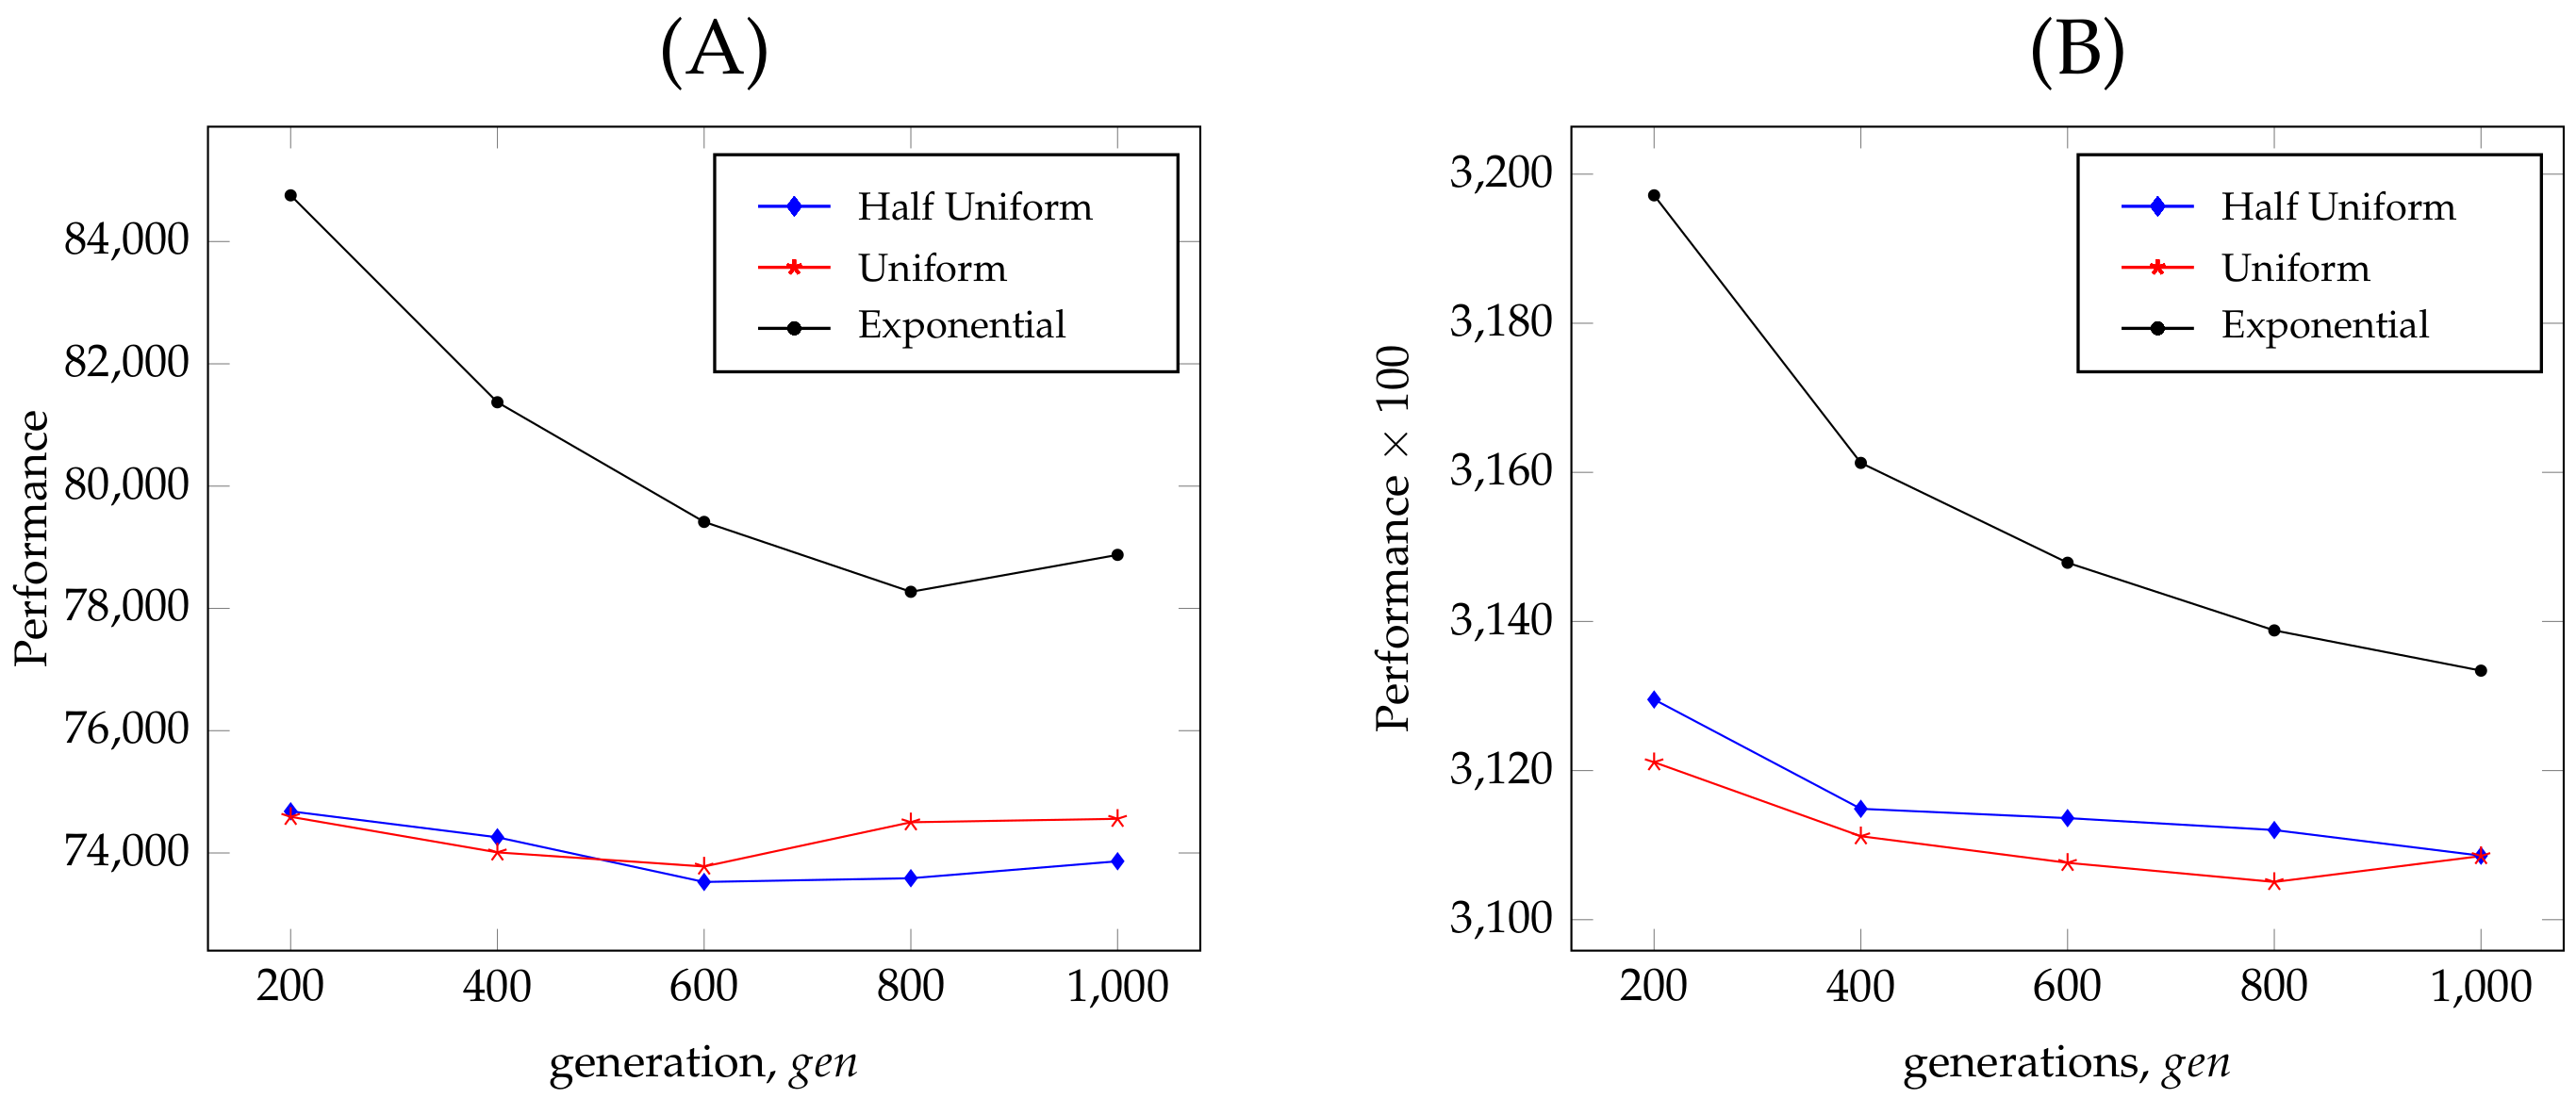
. The second category (Experiments 2, 3, and 4): Those experiments examine the relationship between the proposed adapted NSGA-III method’s parameters (e.g., number of populations ( p o p ), number of generations ( g e n ), N, M, and M a x L i m i t ) and the overall performance P.

5. Results and Discussion

5.1. Dataset

To validate the model, a suppliers’ dataset was randomly generated. The range of this random data is based on the index data of the candidate logistics suppliers supported in [13]. The dataset for five different types of suppliers and five types of devices was produced. Each type has a different cost, time, and rate of damaged items. Table 3 lists the suppliers’ specifications in detail.

5.2. Study the Performance of NSGA-III and Comparative Methods

In this experiment, the efficiency of the proposed adapted NSGA-III method for the problem of healthcare supplier selection was examined. Five different types of suppliers are used to evaluate the proposed model and find the best solutions; those five types were denoted as t 1 , t 2 , t 3 , t 4 , and t 5 . The model parameters which are used in this experiment are the number of devices M = 12,000, the number of suppliers N = 4000 , M a x L i m i t = 100 , p o p = 200 , and g e n = 3000 . Table 4 compares the experimental results of the proposed method with the other two heuristics and two meta-heuristic algorithms. The results in bold in Table 4 reflect the best solutions in terms of the objective functions and the overall performance denoted by Equation (9). As listed in Table 4, NSGA-III yields the best performance for the five types of suppliers with minimum values for the objectives. For the overall performance denoted by Equation (9), the proposed method’s values are lower than other methods of comparison. For instance, the proposed method found a solution that is better than the best solution found by any heuristic by 12% for t 1 .
The Best-Fit heuristic is intentionally choosing the best solution based on only one objective (cost, time, or the number of damaged items). While the meta-heuristic finds the best solution in terms of all objectives. Thus, the Best-Fit heuristic managed to achieve the best results for only one objective at a time, based on the implemented objective. However, the Best-Fit heuristic’s overall performance is poor relative to the meta-heuristic methods, based on the overall performance denoted by Equation (9). For instance, the Best-Fit heuristic on the cost objective (i.e., Best-Fit Cost row in Table 4) achieved the minimum cost value. This is because the “Best-Fit Cost” selects the suppliers based on cost. On the other hand, the “Best-Fit Cost” results for the other two objectives and the overall performance were very poor. The result of the First-Fit heuristic is the worst performance compared to the other algorithms. Because the First-Fit algorithm selects the first n valid suppliers. For the meta-heuristic methods, the PSO achieved the worst results, whereas the NSGA-II method was slightly better than the PSO.

5.3. The Effect of g e n vs. p o p on the Proposed Method’s Performance

In this experiment, it is demonstrated how the values of populations p o p and g e n participate in the search for the best solution in the search space influence the outcome. In addition, the behavior of the proposed NSGA-III algorithm is explored as the number of generations g e n changes. The proposed model’s parameters are used in this experiment are the number of devices M =12,000, the number of suppliers N = 4000 , and M a x L i m i t = 100 . For a varied number of generations g e n (i.e., 100, 1000, and 2000), the performance are plotted against the number of population for the suppliers types t 1 and t 4 in Figure 3. In general, the higher the p o p and g e n levels, the better performance of the proposed method. This makes sense since as the numbers of p o p and g e n increase, the NSGA-III searches in a larger search space for the optimum solution with the best performance.

5.4. The Effect of the Crossover Parameter on the Proposed Method’s Performance

In this experiment, the effect of using different crossover methods is studied against a different number of generations. In other words, this experiment outlines how using different crossover methods affects the search for the optimal solution. In addition, the behavior of the proposed NSGA-III algorithm is explored as the number of generations g e n changes. The proposed model’s parameters used in this experiment are the number of devices M = 12,000, the number of suppliers N = 4000, M a x L i m i t = 100 , and p o p = 200 . For the crossover parameter (i.e., uniform, half uniform, and exponential) [26], the performance is plotted against the number of generations for the suppliers types t 1 and t 3 in Figure 4. The proposed model achieves the best results using the half-uniform and uniform crossover relative to the exponential crossover.

5.5. The Effect of N vs. M a x L i m i t on the Proposed Method’s Performance

In this experiment, it is demonstrated how the value of M a x L i m i t participate in the search for the best solution in the search space influences the outcome. In addition, the behavior of the proposed NSGA-III algorithm is explored as the number of suppliers rises. The model parameters which are used in this experiment are the number of devices M = 12,000, the number of population p o p = 200 , and g e n = 2000 . For a number of varied suppliers N (i.e., 500, 3000, and 6000), the performance is plotted against M a x L i m i t for the supplier types t 2 and t 5 in Figure 5. In general, an increase in the number of suppliers N leads to an increase in the overall performance. This is because an increase in the number of suppliers leads to an increase in competition, an increase in the number of offers available to healthcare organizations, and thus an increase in performance. However, this increase requires more time to search for the best offers. In addition, the increase in the maximum number of devices provided by suppliers M a x L i m i t generally leads to better performance, because this allows the healthcare organization to purchase a larger quantity of devices from the suppliers that have the best offers.

5.6. The Effect of M vs. M a x L i m i t on the Performance

In this experiment, it is demonstrated how the value of M a x L i m i t participate in the search for the best solution in the search space influences the outcome. In addition, the behavior of the proposed NSGA-III algorithm is explored as the number of devices rises. The model parameters which are used in this experiment are the number of suppliers N = 4000, the number of population p o p = 200 , and g e n = 2000 . For a varied number of devices M (i.e., 6000, 12,000, and 30,000), the performance is measured against different values for the M a x L i m i t parameter (i.e., 100, 200, 300, 400, and 500) for the supplier type t 3 . The results of this experiment are listed in Table 5.
In general, the higher the M values, the lower the performance. This can be justified by the fact that an increase in the number of devices M leads to an increase in the cost, time, and number of damaged items. In addition, the increase in the maximum number of devices provided by suppliers M a x L i m i t generally leads to better performance. This is because this increase in the M a x L i m i t parameter allows the healthcare organization to purchase a larger quantity of devices from the suppliers that have the best offers.

6. Conclusions

In this paper, an adaptive NSGA-III is proposed to address the problem of healthcare supplier selection which is framed as a multi-objective optimization problem. The framed optimization problem includes three minimization objectives, namely, cost, time, and the number of damaged items; these three objectives are among the most important factors for any healthcare organization. Thus, a mathematical model is proposed to formulate the optimization problem’s objectives and constraints. Then, we proposed generating a dataset to evaluate the proposed method. The proposed dataset consists of five different supplier types and five different types of medical equipment. Then, the proposed method is thoroughly evaluated and compared against two heuristics (i.e., First-Fit and Best-Fit) and two meta-heuristics, namely, PSO, and NSGA-II on the proposed dataset. The experimental results outlined that the proposed adapted NSGA-III has the best performance relative to the methods of comparison. For instance, the proposed method found a solution that is better than the best solution found by any heuristic by 12% for the t 1 instance. The future direction includes extending the number of objectives to include other important healthcare factors such as the quality of the ordered equipment.

Author Contributions

Conceptualization, M.M.E.; Methodology, M.F.M. and A.S.; Software, M.F.M.; Validation, M.M.E.; Investigation, K.A.R.; Resources, M.M.E. and K.A.R.; Data curation, M.F.M.; Writing—original draft, M.F.M. and A.S.; Writing—review editing, M.M.E., K.A.R. and A.S.; Supervision, A.S.; Funding acquisition, K.A.R. All authors have read and agreed to the published version of the manuscript.

Funding

This research received no external funding.

Data Availability Statement

Not Applicable.

Conflicts of Interest

The authors declare no conflict of interest.

References

  1. Song, Y.; Yu, F.R.; Zhou, L.; Yang, X.; He, Z. Applications of the Internet of things (IoT) in smart logistics: A comprehensive survey. IEEE Internet Things J. 2020, 8, 4250–4274. [Google Scholar] [CrossRef]
  2. Sarabi, E.P.; Darestani, S.A. Developing a decision support system for logistics service provider selection employing fuzzy Multimoora & BWM in mining equipment manufacturing. Appl. Soft Comput. 2021, 98, 106849. [Google Scholar]
  3. Kritchanchai, D.; Hoeur, S.; Engelseth, P. Develop a strategy for improving healthcare logistics performance. In Supply Chain Forum: An International Journal; Taylor & Francis: New York, NY, USA, 2018; Volume 19, pp. 55–69. [Google Scholar]
  4. Singh, S.; Verma, R.; Koul, S. A data-driven approach to shared decision-making in a healthcare environment. Opsearch 2022, 59, 732–746. [Google Scholar] [CrossRef]
  5. Moons, K.; Waeyenbergh, G.; Pintelon, L. Measuring the logistics performance of internal hospital supply chains—A literature study. Omega 2019, 82, 205–217. [Google Scholar] [CrossRef]
  6. Deshmukh, A.J.; Chaudhari, A.A. A review for supplier selection criteria and methods. In Technology Systems and Management; Springer: Berlin/Heidelberg, Germany, 2011; pp. 283–291. [Google Scholar]
  7. Indeed Editorial Team. Vendors vs. Suppliers: What’s the Difference? Available online: https://www.indeed.com/career-advice/career-development/vendors-vs-suppliers (accessed on 15 April 2021).
  8. Komsiyah, S.; Wongso, R.; Pratiwi, S.W. Applications of the fuzzy ELECTRE method for decision support systems of cement vendor selection. Procedia Comput. Sci. 2019, 157, 479–488. [Google Scholar] [CrossRef]
  9. Krishankumar, R.; Ravichran, K.S.; Tyagi, S.K. Solving cloud vendor selection problem using intuitionistic fuzzy decision framework. Neural Comput. Appl. 2020, 32, 589–602. [Google Scholar] [CrossRef]
  10. Davari, S.; Zarandi, M.F.; Turksen, I.B. Supplier Selection in a multi-item/multi-supplier environment. In Proceedings of the NAFIPS 2008-2008 Annual Meeting of the North American Fuzzy Information Processing Society, New York, NY, USA, 19–22 May 2008; pp. 1–5. [Google Scholar]
  11. Debnath, B.; Bari, A.M.; Haq, M.M.; de Jesus Pacheco, D.A.; Khan, M.A. An integrated stepwise weight assessment ratio analysis and weighted aggregated sum product assessment framework for sustainable supplier selection in the healthcare supply chains. Supply Chain. Anal. 2023, 1, 100001. [Google Scholar] [CrossRef]
  12. Han, X. A D-VIKOR method for medicine provider selection. In Proceedings of the 2014 Seventh International Joint Conference on Computational Sciences and Optimization, Beijing, China, 16 October 2014. [Google Scholar]
  13. Tu, L.; Lv, Y.; Zhang, Y.; Cao, X. Logistics service provider selection decision making for healthcare industry based on a novel weighted density-based hierarchical clustering. Adv. Eng. Inform. 2021, 48, 101301. [Google Scholar] [CrossRef]
  14. Saputro, T.E.; Figueira, G.; Almada-Lobo, B. A comprehensive framework and literature review of supplier selection under different purchasing strategies. Comput. Ind. Eng. 2022, 167, 108010. [Google Scholar] [CrossRef]
  15. Kabir, G. Third Party Logistic Service Provider Selection Using Fuzzy Ahp and Topsis Method. Int. J. Qual. Res. 2012, 6, 71–79. [Google Scholar]
  16. Liu, Q.; Liu, X.; Wu, J.; Li, Y. An improved NSGA-III algorithm using genetic K-Means clustering algorithm. IEEE Access 2019, 7, 185239–185249. [Google Scholar] [CrossRef]
  17. Che, Z.H.; Wang, H.S. Supplier Selection and Supply Quantity Allocation of Common and Non-Common Parts with Multiple Criteria Under Multiple Products. Comput. Ind. Eng. 2008, 55, 110–133. [Google Scholar] [CrossRef]
  18. Che, Z.H.; Chiang, C.J. A Modified Pareto Genetic Algorithm for Multi-Objective Build-To-Order Supply Chain Planning with Product Assembly. Adv. Eng. Softw. 2010, 41, 1011–1022. [Google Scholar] [CrossRef]
  19. Rezaei, J.; Davoodi, M. Multi-objective models for lot-sizing with supplier selection. Int. J. Prod. Econ. 2011, 130, 77–86. [Google Scholar] [CrossRef]
  20. Deng, S.; Aydin, R.; Kwong, C.K.; Huang, Y. Integrated product line design and supplier selection: A multi-objective optimization paradigm. Comput. Ind. Eng. 2014, 70, 150–158. [Google Scholar] [CrossRef]
  21. Sajedinejad, A.; Chaharsooghi, S.K. Multi-criteria supplier selection decisions in supply chain networks: A multi-objective optimization approach. Ind. Eng. Manag. Syst. 2018, 17, 392–406. [Google Scholar] [CrossRef]
  22. Luan, J.; Yao, Z.; Zhao, F.; Song, X. A novel method to solve supplier selection problem: Hybrid algorithm of genetic algorithm and ant colony optimization. Math. Comput. Simul. 2019, 156, 294–309. [Google Scholar] [CrossRef]
  23. Hfeda, M.; March, F.; Dao, T.M. Optimization of milk-run delivery issue in lean supply chain management by genetic algorithm and hybridization of genetic algorithm with ant colony optimization: An automobile industry case study. J. Manag. Eng. Integr. 2017, 10, 90–99. [Google Scholar]
  24. Zaretalab, A.; Sharifi, M.; Guilani, P.P.; Taghipour, S.; Niaki, S.T.A. A multi-objective model for optimizing the redundancy allocation, component supplier selection, and reliable activities for multi-state systems. Reliab. Eng. Syst. Saf. 2022, 222, 108394. [Google Scholar] [CrossRef]
  25. Blank, J.; Deb, K.; Roy, P.C. Investigating the normalization procedure of nsga-iii. In Evolutionary Multi-Criterion Optimization; Deb, K., Goodman, E., Coello, C.A.C., Klamroth, K., Miettinen, K., Mostaghim, S., Reed, P., Eds.; Springer International Publishing: Cham, Switzerland, 2019; pp. 229–240. [Google Scholar]
  26. Blank, J.; Deb, K. Pymoo: Multi-Objective Optimization in Python. IEEE Access 2020, 8, 89497–89509. [Google Scholar] [CrossRef]
  27. Kennedy, J.; Eberhart, R. Particle swarm optimization. In Proceedings of the ICNN’95—International Conference on Neural Networks, Perth, WA, Australia, 27 November 1995–1 December 1995; Volume 4, pp. 1942–1948. [Google Scholar]
  28. Gigerenzer, G.; Gaissmaier, W. Heuristic decision making. Annu. Rev. Psychol. 2011, 62, 451–482. [Google Scholar] [CrossRef] [PubMed] [Green Version]
Figure 1. The proposed LSSM’s block-diagram.
Mathematics 11 01537 g001
Figure 2. Example of three solutions (infeasible, feasible, and optimal solution) of the proposed model.
Mathematics 11 01537 g002
Figure 3. The performance of NSGA-III vs. different p o p for different g e n for (A) t 1 and (B) t 4 .
Mathematics 11 01537 g003
Figure 4. The performance of NSGA-III vs. a different number of generations for different crossover parameters for (A) t1 and (B) t3.
Mathematics 11 01537 g004
Figure 5. The performance of NSGA-III vs. different M a x L i m i t for different N for (A) t 2 and (B) t 5 .
Mathematics 11 01537 g005
Table 1. A summary of the related work.
Ref.Utilized MethodConsidered Objectives
[17]GAMinimizing purchase cost, transportation cost, and assembling cost
[19]multi-objective nonlinear programming modelMinimizing cost, and maximize quality and service level
[20]NSGA–IIMaximizing profit, quality, and  performance
[21]integer-programming modelMaximizing product quality and minimizing pricing
[22]Ant Colony OptimizationMaximizing product quality, delivery capability, and innovation ability
Table 2. Summary of the symbols that are used in the proposed model.
NTotal Number of suppliers
nNumber of selected suppliers, where n is a subset of N
P j Suppliers with index j
MNumber of Devices
D i j Device with index i offered by supplier j
T C i j Transportation cost of device i offered by supplier j
M C i j Manufacturing cost of device i offered by supplier j
A C i j Administration cost of device i offered by supplier j
C t o l i Cost of device i = T C i j + M C i j + A C i j
T i j Lead time of device i offered by supplier j
D I t e m i j Damaged items of device i type that may be occurred by supplier j
D Q i j Device quality of device i offered by supplier j
D Q c o n i Device quality constraints
D U i j Device usability of device i offered by supplier j
D U c o n i Device usability constraints
S Q i j Service quality of device i offered by supplier j
S Q c o n i Service quality of device i offered by supplier j
M a x L i m i t Max. limit of the devices allowed to offer by one supplier
mThe solution length, where m = M / M a x L i m i t
Table 3. Specification of providers’ data for five different devices types.
SupplierDeviceCost ($)Time (Days)Damaged Items (%)
type-11random (5, 15)random (10, 20)random (25, 30)
type-22random (20, 30)random (20, 30)random (20, 25)
type-33random (40, 50)random (30, 40)random (15, 20)
type-44random (60, 70)random (40, 50)random (10, 15)
type-55random (80, 90)random (50, 60)random (5, 10)
Table 4. The performance of NSGA-III vs. comparative models.
sModelsCost ($)Time (Days)DItems (Items)P
t 1 First-Fit121,400.0185,800.03292.0105,287.0
Best-Fit Cost60,000.0187,300.03297.081,179.1
Best-Fit Time119,400.0120,000.03318.084,755.0
Best-Fit DItems120,600.0184,100.03000.0104,370.0
NSGA-III68,350 ± 1343.5142,800 ± 1979.93107 ± 1771,112.1 ± 1126.3
NSGA-II62,950 ± 919.2161,850 ± 8697.43196 ± 38.274,693.8 ± 2230.1
PSO80,100 ± 2262.7139,300 ± 848.53285 ± 4.274,815.5 ± 651.8
t 2 First-Fit304,000.0294,100.02692.0210,637.0
Best-Fit Cost240,000.0295,800.02712.0185,553.0
Best-Fit Time185,553.0240,000.02710.0196,013.0
Best-Fit DItems298,000.0300,600.02400.0210,100.0
NSGA-III250,600 ± 4949.7254,000 ± 6222.52508.5 ± 12177,192.55 ± 109.5
NSGA-II242,200 ± 424.3271,900 ± 63642617 ± 2.8179,235.1 ± 1738.6
PSO257,300 ± 989.9257,700 ± 424.32663.5 ± 6.4181,029.05 ± 266.8
t 3 First-Fit541,600.0423,500.02092.0344,317.6
Best-Fit Cost480,000.0419,900.02049.0318,584.7
Best-Fit Time541,800.0360,000.02088.0325,346.4
Best-Fit DItems545,700.0422,300.01800.0345,510.0
NSGA-III487,000 ± 424.3378,450 ± 3464.81885 ± 19.8308,900.5 ± 1,203.2
NSGA-II481,800 ± 141.4396,650 ± 1343.51978.5 ± 3.5312,308.55 ± 347.5
PSO495,950 ± 70.7378,750 ± 212.12059.5 ± 30.4312,622.85 ± 82.8
t 4 First-Fit774,300.0535,100.01501.0470,700.3
Best-Fit Cost720,000.0543,000.01494.0451,348.2
Best-Fit Time783,200.0480,000.01494.0457,728.2
Best-Fit DItems782,000.0542,600.01200.0475,940.0
NSGA-III730,850 ± 3040.6495,600 ± 4101.21312.0 ± 0441,413.6 ± 14.1
NSGA-II724,950 ± 3889.1505,850 ± 7990.31438 ± 8.5442,166.4 ± 838.9
PSO740,050 ± 2616.3498,700 ± 3111.31469 ± 25.5446,070.7 ± 105.5
t 5 First-Fit1,021,400.0660,500.0911.0606,983.3
Best-Fit Cost960,000.0660,300.0887.0582,356.1
Best-Fit Time1,018,200.0600,000.0870.0587,541.0
Best-Fit DItems1,022,000.0663,300.0600.0607,970.0
NSGA-III969,700 ± 3111.3619,250 ± 6010.4719.5 ± 30.4573,870.85 ± 549.5
NSGA-II971,050 ± 12,657.2623,950 ± 19,162.6828 ± 24575,853.4 ± 678.7
PSO977,150 ± 70.7620,550 ± 919.2894 ± 24577,293.2 ± 296.8
Table 5. The performance of NSGA-III vs. different M a x L i m i t for different M for t 3 .
MaxLimit M = 6000 M = 12,000M = 30,000
100153,340.80304,594.50787,387.90
200152,434.20306,681.60775,024.20
300150,492.60304,128.90769,417.50
400150,636.00304,868.40765,692.40
500150,277.50304,594.50765,299.50
Disclaimer/Publisher’s Note: The statements, opinions and data contained in all publications are solely those of the individual author(s) and contributor(s) and not of MDPI and/or the editor(s). MDPI and/or the editor(s) disclaim responsibility for any injury to people or property resulting from any ideas, methods, instructions or products referred to in the content.

