Article

Facilitating Conditions as the Biggest Factor Influencing Elementary School Teachers’ Usage Behavior of Dynamic Mathematics Software in China

1
School of Mathematics and Statistics, Hunan Normal University, Changsha 410081, China
2
School of Mathematical Sciences, Beijing Normal University, Beijing 100875, China
*
Author to whom correspondence should be addressed.
Mathematics 2023, 11(6), 1536; https://doi.org/10.3390/math11061536
Submission received: 6 February 2023 / Revised: 10 March 2023 / Accepted: 20 March 2023 / Published: 22 March 2023

Abstract

:
Dynamic mathematics software, such as GeoGebra, is one of the most important teaching and learning media. This kind of software can help teachers teach mathematics, especially geometry, at the elementary school level. However, the use of dynamic mathematics software of elementary school teachers is still very limited so far. This study analyzed the factors influencing elementary school teachers’ usage behavior of dynamic mathematics software. Four independent variables, namely performance expectancy (PE), effort expectancy (EE), social influence (SI), and facilitating conditions (FC) from the united theory of acceptance and use of technology (UTAUT), were used to understand elementary school teachers’ usage behavior of dynamic mathematics software. A questionnaire survey was conducted in the Hunan and Guangdong provinces of China. Two hundred and sixty-six elementary school mathematics teachers provided valid questionnaire data. The partial least squares structural equation modeling (PLS-SEM) approach was used to analyze the data. The results showed that facilitating conditions and effort expectancy significantly affect elementary school teachers’ usage behavior of dynamic mathematics software, and facilitating conditions were the biggest factor that affected user behavior. The moderating effects of gender, major, and training on all relationships in the dynamic mathematics software usage conceptual model were not significant. This study contributes by developing a model and providing new knowledge to elementary school principals and the government about factors that can increase the adoption of dynamic mathematics software.

1. Introduction

Dynamic mathematics software including GeoGebra, Desmos, Netpad, Cabri, and Geometer’s sketchpad were used as some of the most effective teaching and learning media in mathematics [1,2,3]. It is particularly suitable for teaching and learning geometry and algebra [4,5,6]. Dynamic mathematics software is often used to manipulate and construct, as well as test hypotheses [7]. Initially, this kind of software is produced to replace manual drawing on several mathematical topics [8,9]. In the process of time, dynamic mathematics software provides many opportunities for mathematics teaching and learning. Recently, this kind of software became increasingly popular at the secondary school level [10,11,12,13,14,15,16,17].
Dynamic mathematics software can also be an effective teaching and learning medium for elementary school teachers and students. As one of the main topics at the elementary school level [18,19], geometry is taught to mainly understand the knowledge and measurement of the geometry figures, and the position and movement of the geometry figures [20] (p. 27). Dynamic mathematics software enables students to understand more about various shapes and their properties [21,22]. Additionally, it allows them to analyze the characteristics and relationships between plane figures [18]. The eventual goal of learning geometry is to improve problem-solving, high-order thinking, and collaboration skills [23,24]. Dynamic mathematics software is regarded as a type of alternative teaching and learning media compared to the traditional media, which can promote students’ conceptual understanding and improve their problem-solving skills at the K-12 level [25,26,27,28]. Furthermore, the development of this type of software, such as GeoGebra, continues to support mathematics teaching and learning activities at the elementary school [18,29,30], secondary school [10,11,31], and even university levels [32,33].
Previous studies analyzed the effects of dynamic mathematics software on mathematics teaching and learning [27,34,35]. However, limited research analyzed elementary school mathematics teachers’ perspectives on the use of dynamic mathematics software [36]. In order to determine factors that positively affect elementary school teachers’ usage behavior of dynamic mathematics software, the following two research questions were investigated:
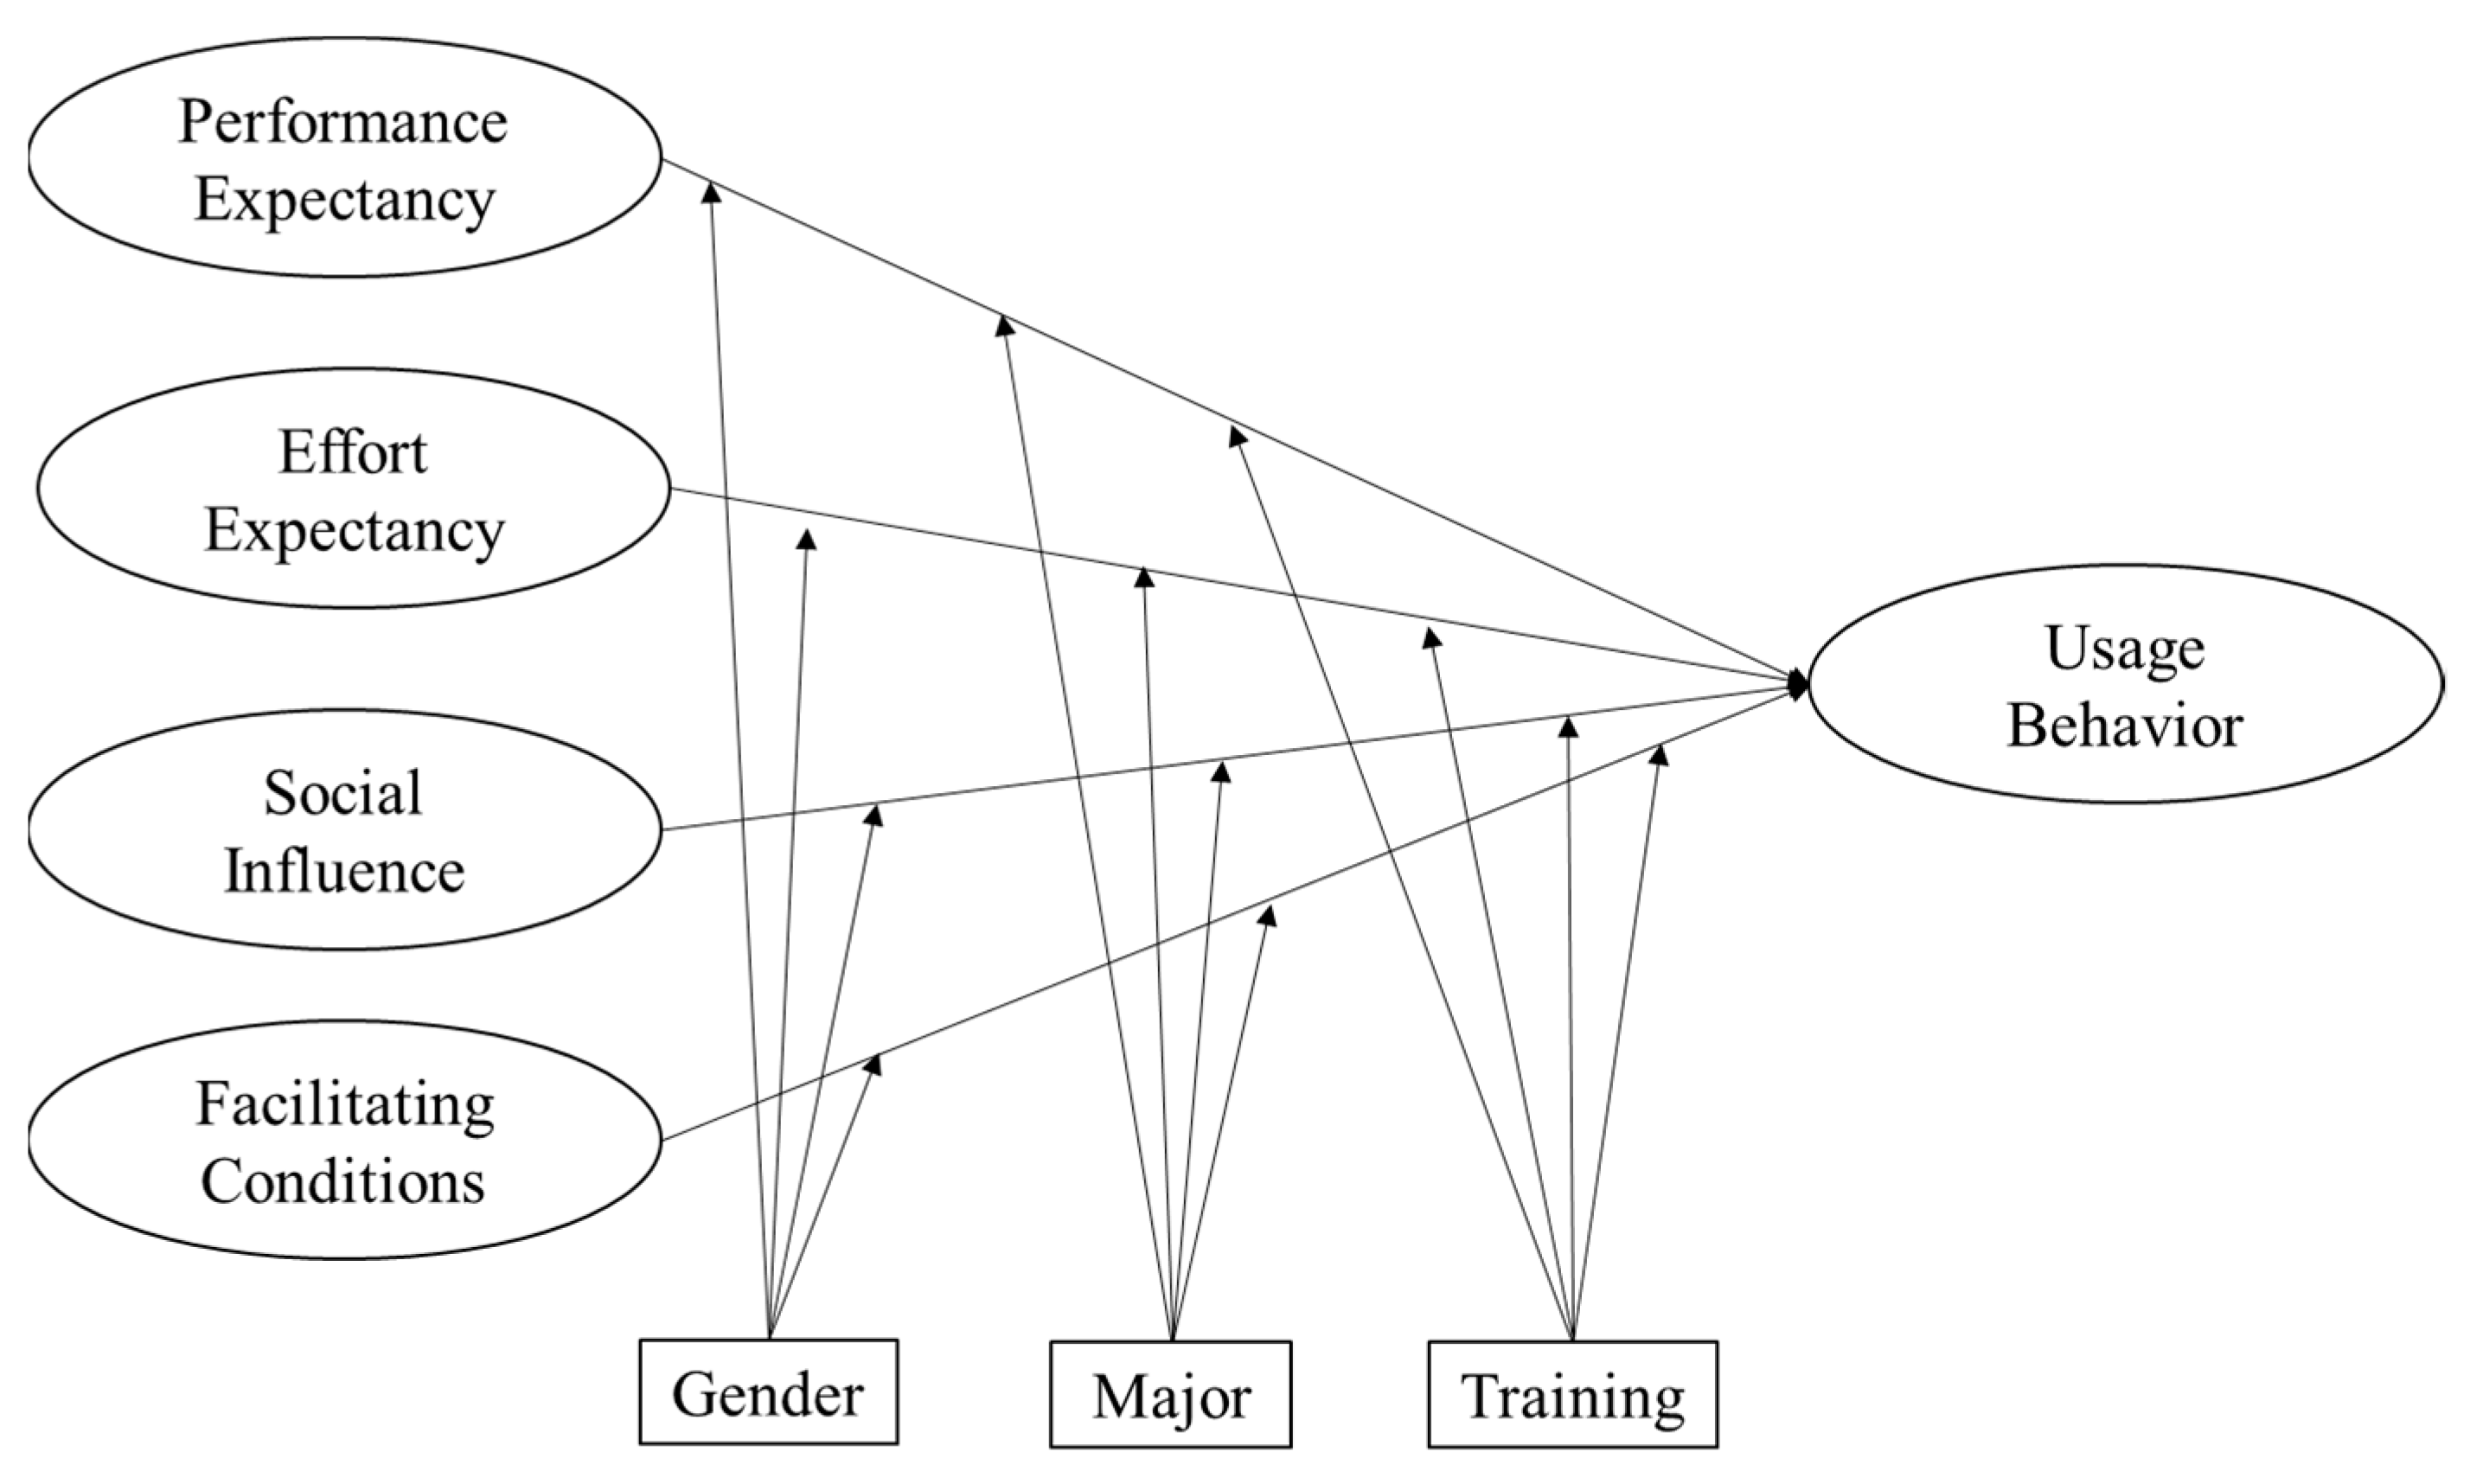
  • What factors positively affect elementary school teachers’ usage behavior of dynamic mathematics software based on the unified theory of acceptance and use of technology (UTAUT)?
  • Does gender, major, or training moderate the relationships between performance expectancy, effort expectancy, social influence, facilitating conditions, and elementary school teachers’ usage behavior of dynamic mathematics software?

2. Literature Review and Hypothesis Development

2.1. Dynamic Mathematics Software at the Elementary School Level

Some dynamic mathematics software, such as GeoGebra (https://www.geogebra.org, accessed on 1 February 2023), Desmos (https://www.desmos.com, accessed on 1 February 2023), and Netpad (https://www.netpad.net.cn, accessed on 1 February 2023), which can be downloaded freely, are suitable software used at the elementary school level. This type of software is regarded as an effective teaching and learning medium to promote students’ conceptual understanding and improve their problem-solving skills. Dynamic mathematics software can be used on algebraic materials, fractions, numbers, probability, and data analysis at an elementary school level [37]. Researchers even developed some microgames for elementary school teaching and learning based on dynamic mathematics software platforms [38,39]. The Chinese government took many measures to promote the use of information technology by teachers at the K-12 level [40,41,42,43]. However, the use of dynamic mathematics software at the elementary school level is still very limited. Further study may need to examine the factors that positively affect elementary school teachers’ usage behavior of dynamic mathematics software.

2.2. UTAUT and Adoption of Dynamic Mathematics Software

The unified theory of acceptance and use of technology (UTAUT) developed by Venkatesh et al. [44,45] integrates eight models and theories of individual acceptance to predict people’s behavioral intention (BI) and usage behavior (UB) of new technologies. According to the UTAUT, the behavioral intention and usage behavior may be affected by performance expectancy, effort expectancy, social influence, or facilitating conditions. Previous studies showed that the UTAUT provides a strong theoretical framework to analyze people’s adoption of technology. The model was adopted in several contexts such as hospitality [46], automotive [47], education [48], medicine [49], and shopping [50]. It is known that the UTAUT is more widely used to examine the behavioral intention or usage behavior than the original technology acceptance model (TAM) [51,52]. The model is more complete and can explain more of the variance in the dependent variables. Therefore, this study adopts the UTAUT to explore the factors influencing elementary school teachers’ usage behavior of dynamic mathematics software.
The first construct is performance expectancy (PE), which is defined as “the degree to which an individual believes that using the system will help him or her to attain gains in job performance” [44] (p. 447). This construct can be referred to as perceived usefulness in the TAM model [51,52,53,54]. In the context of this study, performance expectancy is regarded as the teachers’ beliefs that dynamic mathematics software can improve teaching quality at the elementary school level. Several studies showed that performance expectancy can positively affect the user’s adoption of new technology [48,55,56]. Therefore, this study has an initial hypothesis that performance expectancy positively affects elementary school teachers’ usage behavior of dynamic mathematics software.
The second construct is effort expectancy (EE), which can be interpreted as “the degree of ease associated with the use of the system” [44] (p. 450). This construct is known as a vital factor and significantly affects the users’ adoption of new technology [48,57]. In this context, the adoption of dynamic mathematics software is affected by its ease to use for elementary school teachers. Teachers in China may have limited time to study instructional media that are difficult to operate because they have various tasks to perform. Therefore, effort expectancy may significantly affect elementary school teachers’ usage behavior of dynamic mathematics software.
UTAUT also has a construct called social influence (SI), which can also be called subjective norms or social factors in the technology acceptance model [54]. This construct is defined as “the degree to which an individual perceives that important others believe he or she should use the new system” [44] (p. 451). Several studies showed that social influence greatly affects someone to adopt new tools [48,58,59]. In this context, social influence is defined as the school leaders, colleagues, and students who believe that elementary school mathematics teachers need to use dynamic mathematics software to teach mathematics.
The last independent variable construct is facilitating conditions (FC), which can also be interpreted as behavioral control [60]. This construct is interpreted as “the degree to which an individual believes that an organizational and technical infrastructure exists to support use of the system” [44] (p. 453). Several studies showed that facilitating conditions significantly affect people to adopt new technology [39,61,62]. In this context, facilitating conditions are defined as hardware and software facilities of the classroom, curriculum resources related to dynamic mathematics software, and on-time professional support when elementary school teachers have trouble in using dynamic mathematics software.
Furthermore, usage behavior (UB), which is also known as actual use, refers to people’s behavior to adopt new technology [44,54]. It may be positively affected by four independent variable constructs in the UTAUT. In this study, elementary school teachers’ usage behavior of dynamic mathematics software is the dependent variable. There is an initial hypothesis that four independent variables including performance expectancy, effort expectancy, social influence, and facilitating conditions positively affect usage behavior. The dynamic mathematics software usage conceptual model is shown in Figure 1.
The following is the initial hypothesis that will be tested in this study.
H1. 
Performance expectancy affects elementary school teachers’ usage behavior of dynamic mathematics software.
H2. 
Effort expectancy affects elementary school teachers’ usage behavior of dynamic mathematics software.
H3. 
Social influence affects elementary school teachers’ usage behavior of dynamic mathematics software.
H4. 
Facilitating conditions affect elementary school teachers’ usage behavior of dynamic mathematics software.
In accordance with Venkatesh et al.’s suggestion [44], this study also analyzed the moderating effects of gender, major, and training on the relationships between performance expectancy, effort expectancy, social influence, facilitating conditions, and elementary school teachers’ usage behavior of dynamic mathematics software. Several studies showed that moderator variables are not always effective in influencing someone to adopt new technologies [63,64,65].
Gender is predicted to affect people’s adoption of new technology [66,67]. In the educational context, the use of computer technology-based teaching and learning media is usually more mastered by male teachers [68,69]. In the context of social influence, women are more sensitive to responses from the environment than men [70]. It is, therefore, believed that the gender factor will affect all relationships in the dynamic mathematics software usage conceptual model.
H5. 
Gender moderates the relationships between performance expectancy, effort expectancy, social influence, facilitating conditions, and elementary school teachers’ usage behavior of dynamic mathematics software.
Additionally, this study assumes that the major is a moderating factor of performance expectancy, effort expectancy, social influence, and facilitating conditions on teachers’ usage behavior of dynamic mathematics software. The education of preservice mathematics teachers tends to focus on pedagogical, mathematical, and technological knowledge [71,72,73,74,75]. Teachers who graduated from a mathematics-related major are supposed to understand the importance of dynamic mathematics software. Therefore, this study predicts that major moderates the relationships between the independent variables and teachers’ usage behavior of dynamic mathematics software. This produced the initial hypothesis:
H6. 
Major moderates the relationships between performance expectancy, effort expectancy, social influence, facilitating conditions, and elementary school teachers’ usage behavior of dynamic mathematics software.
Training which can change people’s perceptions is regarded as the final moderator variable [76,77,78]. In China, this variable may serve as one of the opportunities given to teachers every semester to improve their technological pedagogical content knowledge (TPACK), or their preservice TPACK course. This study believes that teachers who have attended training possess various perceptions of using dynamic mathematics software in class. Furthermore, those who take part in the training will find this type of software easy to operate. The school has a team that is ready to help teachers when they have difficulty operating dynamic mathematics software. Therefore, this training may affect all relationships in the dynamic mathematics software usage conceptual model.
H7. 
Training moderates the relationships between performance expectancy, effort expectancy, social influence, facilitating conditions, and elementary school teachers’ usage behavior of dynamic mathematics software.

3. Methodology

This study used a quantitative approach to explore factors that positively affect elementary school teachers’ usage behavior of dynamic mathematics software. It also examined the moderating effects of gender, major, and training on all relationships in the dynamic mathematics software usage conceptual model. Five constructs, namely performance expectancy, effort expectancy, social influence, facilitating conditions, and usage behavior in the instrument, were adopted from the UTAUT [44]. Based on the dynamic mathematics software usage conceptual model, the data were collected by a self-designed questionnaire. Two hundred and sixty-six elementary school mathematics teachers in the Hunan and Guangdong provinces of China provided valid questionnaire data. The partial least squares structural equation modeling (PLS-SEM) approach was used to analyze these data.

3.1. Instrument and Data Collection

We tried to develop an instrument to explore factors influencing elementary school teachers’ usage behavior of dynamic mathematics software. In order to determine the indicators of each construct in the instrument and the feasibility of the questionnaire, some papers were reviewed firstly, and then, two pilot studies were conducted in early August of 2022. Since this study focused on dynamic mathematics software, several task-technology-fit items were used to measure performance expectancy, such as “Dynamic mathematics software helps elementary school students to understand the relationships between geometry figures”. This was different from the other studies, which typically used some more general items such as “I would find the system useful in my job” [44]. The initial inspiration came from the work of Pittalis [79], which used three constructs, namely visualization processes, reasoning processes, and construction processes, to characterize the performance of dynamic geometry software. Another four constructs, namely algebra thinking, function thinking, stochastic thinking, and statistics thinking, were added, since dynamic mathematics software such as GeoGebra can be used in almost any field of mathematics teaching. A total of 21 items were used to measure the performance expectancy of dynamic mathematics software at first. However, the results of pilot studies showed that it was not necessary to use so many items and some of them were not suitable. Therefore, only six items remained. Some items revised from the literature were not suitable for the other constructs. For example, “My interaction with dynamic mathematics software is clear and understandable” was not suitable for measuring effort expectancy. Therefore, these items were deleted or replaced. After the pilot studies, the remaining questionnaire items were consulted with three professors and three other researchers for the assessment of content validity. The final questionnaire was obtained after being revised due to suggestions for improvement (Appendix A). All 18 measurement items used a 5-point Likert scale ranging from strongly disagree (1 point) to strongly agree (5 point). The 0–1 coding scheme was used for gender (male: 0, female: 1), major (non-math: 0, math: 1), and training on dynamic mathematics software (no: 0, yes: 1). People’s experience was divided into three groups including teaching less than 5 years, between 6 and 15 years, and over 15 years.
The questionnaire was produced by using the Wenjuanxing application. The link of the electronic questionnaire was sent to the target group, elementary school mathematics teachers, via school leaders, teaching research group leaders, and master teachers in late August of 2022. Respondents did not need to provide names and identities, since their data were anonymous. Data were collected using convenient sampling techniques to reach a total of 284 elementary school mathematics teachers in the Hunan and Guangdong provinces, which, respectively, represent the Central and Eastern regions of China. In the questionnaire, we provided information that this study aimed to determine factors that affect elementary school teachers’ usage behavior of dynamic mathematics software. We also announced that this study was voluntary. All data that were collected were used only for this study.
A total of 266 elementary school mathematics teachers (71 males and 195 females) provided valid data. There were 255 and 11 respondents with undergraduate and master’s degrees, respectively. Two-thirds of respondents (179) graduated with a mathematics-related major, and about one-third of them (87) graduated with a non-mathematics major. More than 70% of respondents (193) had more than five years of teaching experience. A total of 204 and 62 respondents worked in cities and villages, respectively. More than 70% of respondents (194) did not experience systematic training on dynamic mathematics software. Table 1 shows the demographics of the respondents in more detail. The average time for completing the questionnaire was 7 min, indicating that these sample teachers took the questionnaire seriously.

3.2. Data Analysis

The quantitative data were analyzed using SPSS 26 and SmartPLS 4. Firstly, SPSS 26 was used for data clearing and descriptive analysis. Then, the Shapiro–Wilk test was carried out to determine the normality of the data. Finally, SmartPLS 4 was used to explore the factors influencing elementary school teachers’ usage behavior of dynamic mathematics and the moderate effect of gender, major, and training on each relationship in the model. SmartPLS is a popular software for the partial least squares structural equation modeling (PLS-SEM) in e-learning research [80]. When the distribution of the sample is non-normal and the sample size is small [81,82], PLS-SEM is considered as a more appropriate SEM approach than the traditional covariance-based structural equation modeling (CB-SEM) approach [48,83]. In this study, the sample data were not of a normal distribution, and the sample size was relatively small, but it was sufficient for PLS-SEM. According to Hair et al. [84] (p. 420), the minimum sample size is ten times the maximum number of paths aiming at any construct in the outer and inner models. In this study, the maximum number of paths were 6, which was from the performance expectancy construct. This showed the minimum sample size was 60 respondents. There were 266 respondents in this study, which met the sample size criteria in PLS-SEM. Hair et al. [82,85,86] emphasized that the two stages of PLS-SEM include measurement model evaluation and structural model evaluation. PLS-SEM algorithm, bootstrapping, and blindfolding procedures were carried out to obtain the results of measurement model evaluation and structural model evaluation. Bootstrap multigroup analysis procedure was carried out to obtain the results of the moderating effect analysis.

4. Results

The results were divided into three parts. Firstly, the measurement model evaluation shows indicator reliability, internal consistency reliability, convergent validity, and discriminant validity. Secondly, the structural model evaluation showed the overall goodness-of-fit of the model, the result of examining collinearity, the sizes and significance of the path coefficients, the coefficient of determination (R2), the effect size (f2), and the model’s predictive relevance (Q2). Finally, partial least squares multi-group analysis (PLS-MGA) showed the results of the moderating effect analysis of gender, major, and training on all relationships in the dynamic mathematics software usage conceptual model.

4.1. Measurement Model Evaluation

A reflective measurement model evaluation was carried out to observe the results of the reliability and validity test. It is better if the indicator loading is not less than 0.708 [82], (p. 775, [86]). The lowest loading was owned by PE1 of 0.840. In addition, all t-statistics of the outer loadings were larger than 2.58 with a significance level of 0.01, which means the measurement model had a good indicator reliability. The measurement model had a good internal consistency reliability when the values of Cronbach alpha and composite reliability (CR) (ρA) of all constructs exceeded 0.7 [82]. The lowest value of Cronbach alpha was owned by FC of 0.894, while that of the CR was owned by EE of 0.899. The lowest value of average variance extracted (AVE) was owned by PE of 0.797, which was larger than the critical value of 0.5 [82]. Therefore, the measurement model had a good convergent validity.
Some research papers considered a VIF (variance inflation factor) >10 as an indicator of multicollinearity [87], but some chose a more conservative threshold of 5 or even 3 [81,82]. All VIF values in Table 2 were less than 10, and most of them were less than 5. Therefore, the measurement model did not have serious multicollinearity problems.
Furthermore, discriminant validity was tested with the Fornell–Larcker criteria [88]. The square root of AVEs should be greater than the interconstruct correlation coefficients. The bolded square root of AVEs on the diagonal in Table 3 was higher compared to the correlation coefficients, indicating that the measurement model had a good discriminant validity.
The Fornell–Larcker criterion is better equipped with the heterotrait-monotrait ratio (HTMT) of correlations test results [82], (p. 776, [86]). The biggest HTMT value was 0.795 (Table 4), which failed to exceed the limit of 0.85, indicating that the measurement model had undoubted discriminant validity [82].
Indicator reliability, internal consistency reliability, convergent validity, and discriminant validity were tested and presented so far, and all data were good. This means the measurement model evaluation was satisfactory, the next step was structural model evaluation.

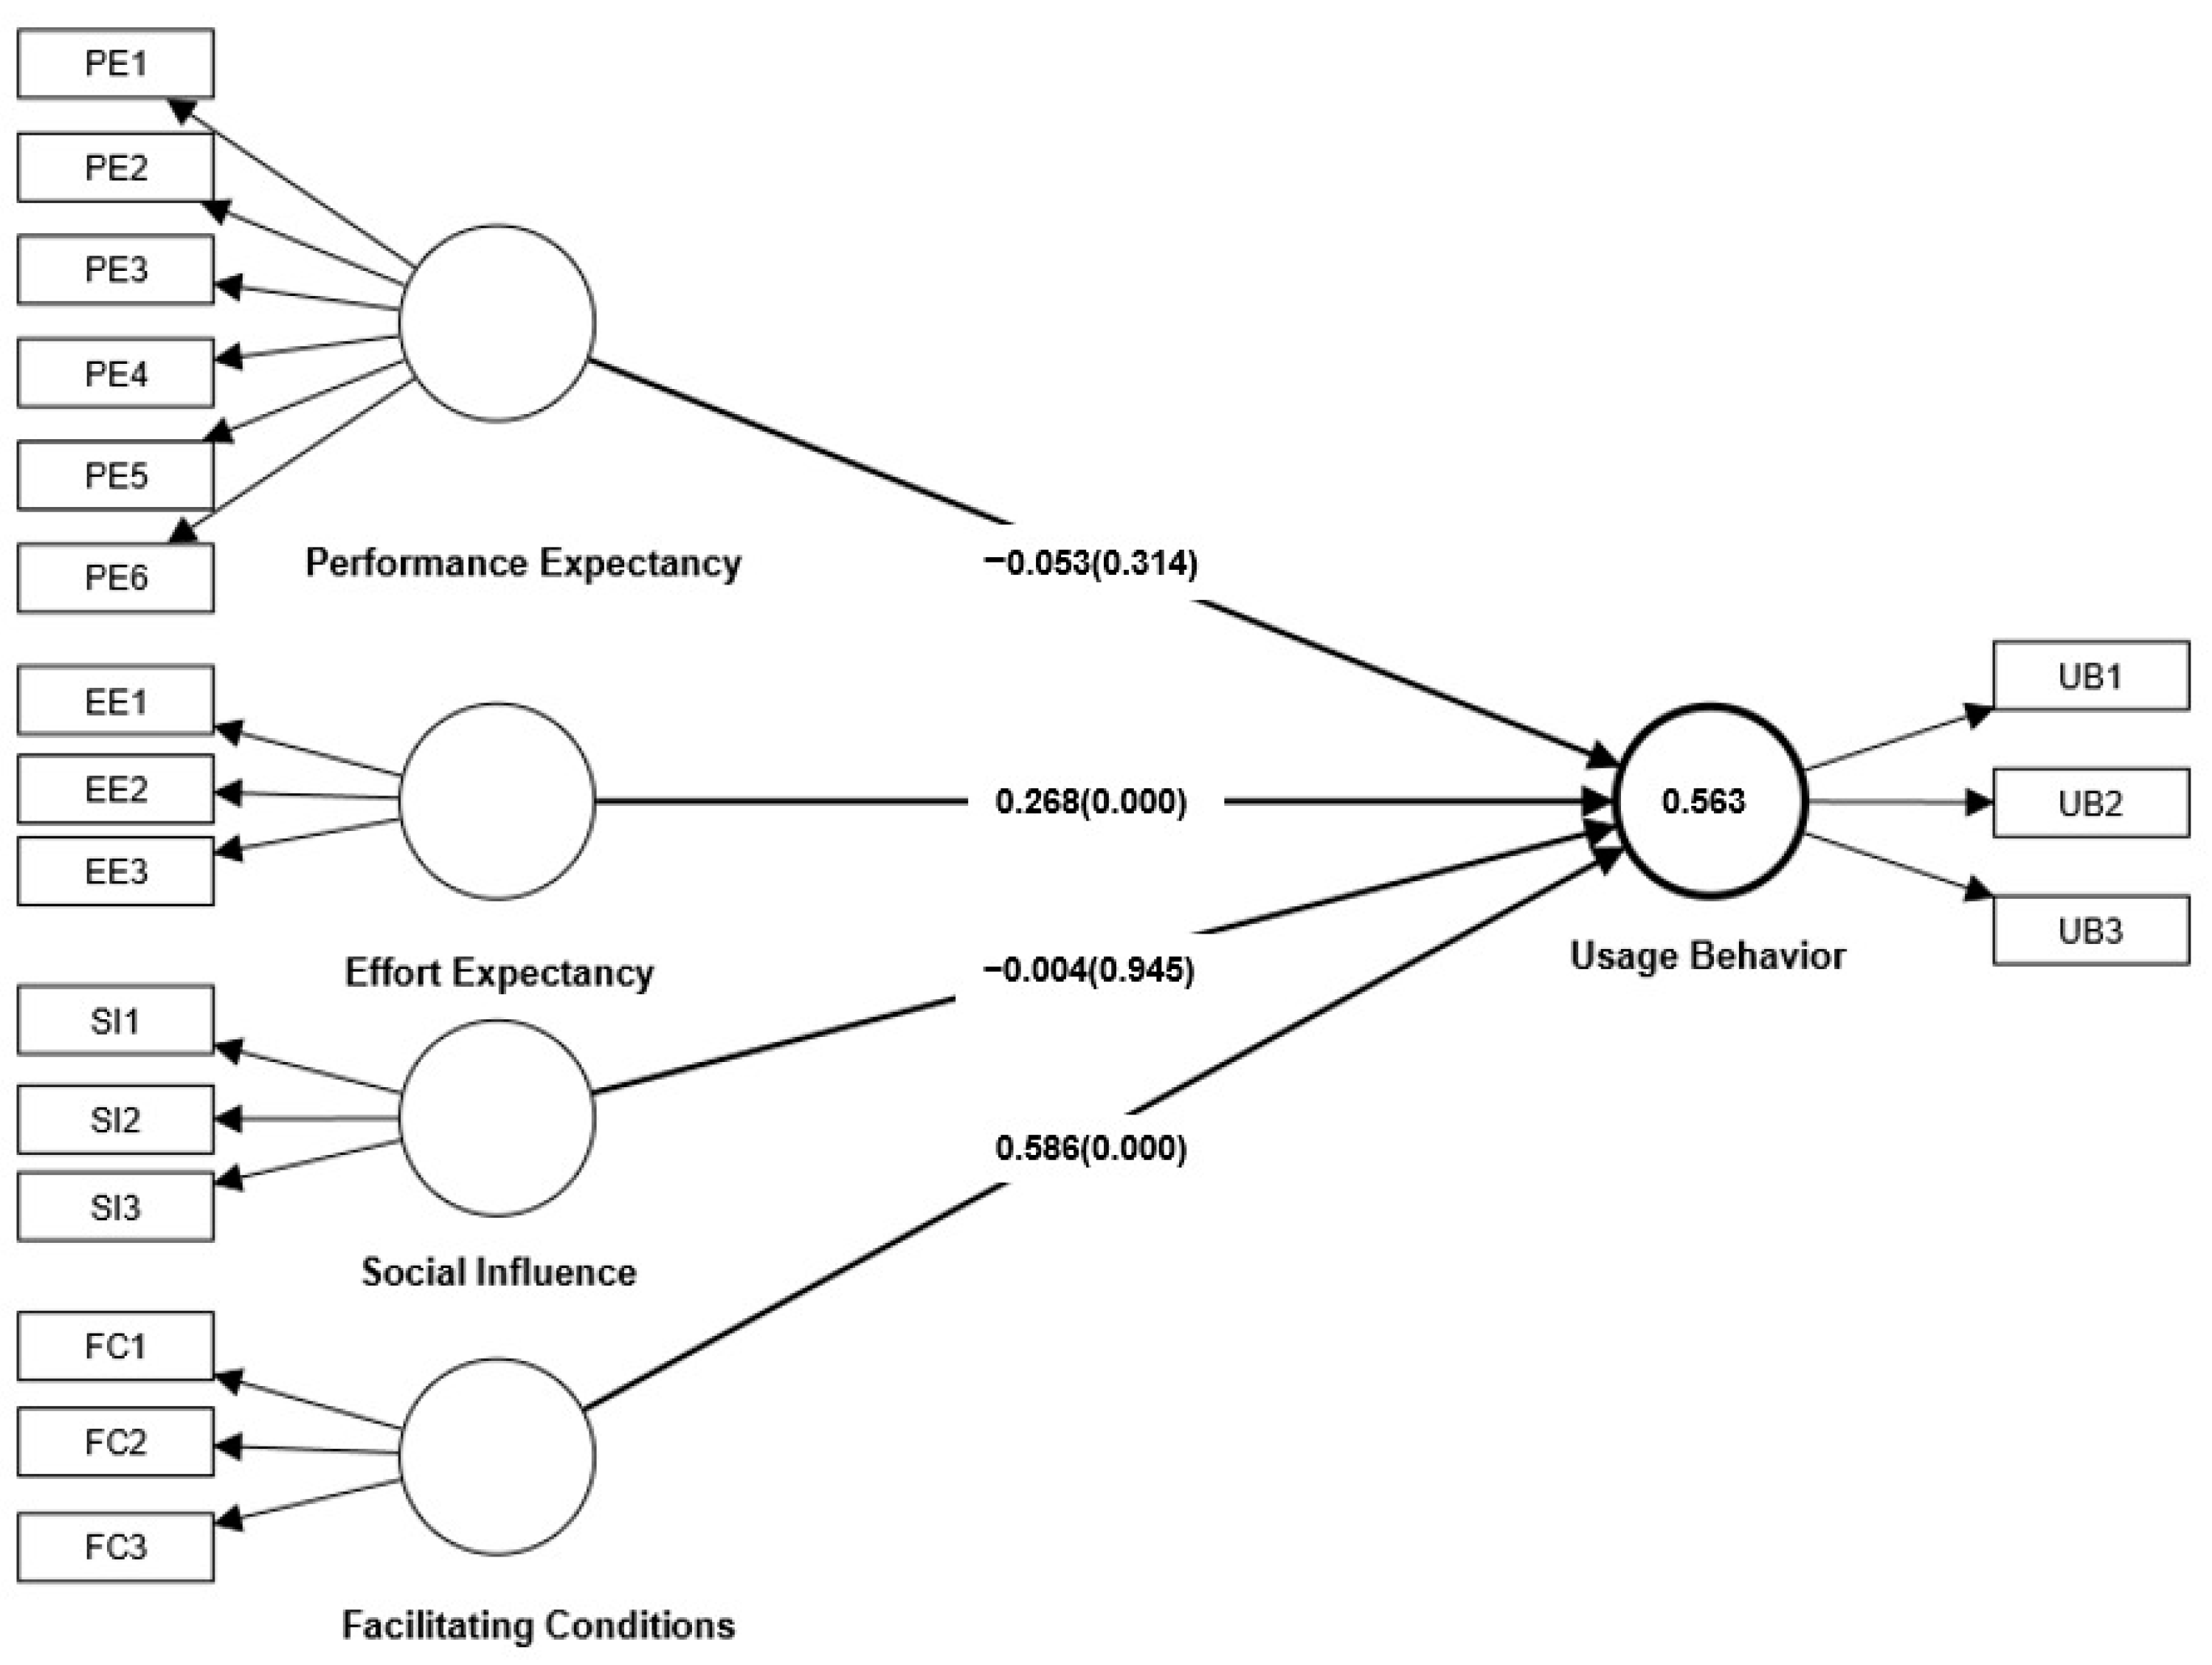
4.2. Structural Model Evaluation

According to Hair et al. [85], the steps for assessing the structural model are: (1) examine collinearity, (2) evaluate the size and significance of the structural path relationships, (3) assess the R2, (4) examine the effect size f2, and (5) evaluate the predictive relevance based on Q2. However, Henseler et al. [89] suggested that “the overall goodness-of-fit (GoF) of the model should be the starting point of model assessment” (p. 9). SRMR (standardized root mean square residual) and NFI (normed fit index) values are commonly used to evaluate the suitability and robustness of the model [90,91].
The overall model has a good fit when SRMR is below 0.08 [89]. Additionally, the model has a good fit when the NFI value is above 0.90 [89], but a value of a little bit lower than 0.90 is also acceptable [92]. The SRMR value was 0.059 < 0.08, and the NFI value was 0.867, which was close to 0.9. Therefore, this study had a good empirical model.
The bootstrap technique with 5000 samples was used to observe the path coefficients, t-statistics, p-value, and effect size in each relationship (Table 5). Figure 2 shows the final model with a determination coefficient value (R2), path coefficients, and p values.
Performance expectancy (PE) insignificantly affected elementary school teachers’ usage behavior (UB) of dynamic mathematics software (β = −0.053, p = 0.314 > 0.05, f2 = 0.003). Meanwhile, effort expectancy (EE) significantly affected elementary school teachers’ usage behavior of dynamic mathematics software (β = 0.268, p = 0.000 < 0.05, f2 = 0.100). This showed that elementary school teachers can teach mathematics when they felt the use of dynamic mathematics software was easy and did not require a lot of effort. Social influence (SI) insignificantly affected elementary school teachers’ usage behavior of dynamic mathematics software (β = −0.004, p = 0.945 > 0.05, f2 = 0.000). This result showed the environment and people’s opinions at school did not effectively make teachers use dynamic mathematics software. Finally, facilitating conditions (FC) greatly affected elementary school teachers’ usage behavior of dynamic mathematics software (β = 0.586, p = 0.000 < 0.05, f2 = 0.506). It can be concluded that facilitating conditions are the strongest influential factor for elementary school teachers’ usage behavior of dynamic mathematics software. This factor was determined by the hardware and software facilities of the classroom, curriculum resources related to dynamic mathematics software, and on-time professional support when they had trouble in using dynamic mathematics software.
In this empirical model, the value of the determination coefficient (R2) was 0.563. This means that the model explained more than 50% of factors influencing elementary school teachers to use dynamic mathematics software. Meanwhile, the other 43.7% of factors were affected by those factors outside of this model. Hair et al. [86] (p. 780) emphasized that the value of the determination coefficient (R2) always needs to be interpreted in the context of the study being conducted. As a guideline, R2 values of 0.75, 0.50, and 0.25 can be considered substantial, moderate, and weak, respectively. Therefore, the value of the determination coefficient (R2) of this empirical model can be included in the moderate-level category.
The effect size f2 values of 0.02, 0.15, and 0.35, respectively, represent small, medium, and large effects of an independent variable [86] (p. 780). Facilitating conditions had a large effect size of 0.506 and effort expectancy had a small effect size of 0.100 on elementary school teachers’ usage behavior of dynamic mathematics software. However, performance expectancy and social influence had no effect. The Q2 value of the usage behavior was 0.461, which was obtained by using the blindfolding procedure with the cross-validated redundancy approach for an omission distance D = 8. According to Hair et al. [82], the Q2 values larger than zero are meaningful. The values higher than 0, 0.25, and 0.50, respectively, depict small, medium, and large predictive accuracy of the PLS path model. Since the Q2 value of 0.461 was larger than 0.25 and smaller than 0.50, the model had a medium predictive power, or predictive relevance, when predicting the factors influencing elementary school teachers’ usage behavior of dynamic mathematics software.

4.3. Multi-Group Analysis

Multi-group analysis is a process for examining separate groups of respondents to determine if there are differences in the model parameters between the groups [93]. This study explored whether there were moderating effects between two groups of gender, major, and training. Partial least squares multi-group analysis (PLS-MGA) is included in the nonparametric significance test in the SmartPLS 4. The results of the bootstrap multigroup analysis showed that all relationships had a p-value greater than 0.05 (Table 6, Table 7 and Table 8), which suggested that different gender or major of elementary school teachers did not have an influence on any relationship in the model. Furthermore, training on dynamic mathematics software also failed to affect any relationship at the significant level of 0.05.

5. Discussion

Dynamic mathematics software is a type of computer software that facilitates users being able to create and dynamically manipulate mathematical objects. It can support the creation of meaningful learning environments that allows for problem solving and supports creativity. This kind of software can be regarded as an inseparable part of mathematics teaching and learning at the K-12 level. However, there are still very few teachers who use this kind of software to teach mathematics at the elementary school level. Therefore, this study analyzed the factors that affect elementary school teachers’ usage behavior of dynamic mathematics software.
The results showed that facilitating conditions and effort expectancy were the main factors influencing elementary school teachers to use dynamic mathematics software, which were different from other studies in the educational context [94,95]. Additionally, facilitating conditions were the determinant factor that greatly affected user behavior. The following paragraphs will explain each hypothesis.
In this study, performance expectancy insignificantly affected elementary school teachers’ usage behavior of dynamic mathematics software. This result is unique because other studies showed that performance expectancy was usually the main or significant factor in the use of technology [96,97]. Therefore, teachers were not concerned about whether dynamic mathematics software will help them when teaching at elementary school. They had more confidence in their skills and could make any teaching and learning media effective as well as fun for children.
Effort expectancy significantly affected elementary school teachers’ usage behavior of dynamic mathematics software. Previous studies showed that desire and willingness to use new technology were affected by effort expectancy [55].The majority of the teachers in this study lacked training in using dynamic mathematics software. Therefore, the ease of use affected their usage behavior.
It is interesting that social influence insignificantly affected elementary school teachers’ usage behavior of dynamic mathematics software. Other studies showed that social influence significantly affected female teachers’ use of new technology [66].The majority of the teachers in this study had rich teaching experience. They understood the learning models and approaches that suit their classes, and they were not affected by others so easily.
Furthermore, facilitating conditions greatly affected elementary school teachers’ usage behavior of dynamic mathematics software. Teachers considered that they would be happy to use the software to teach when there were adequate facilities at school. This result is consistent with Wong’s study [98], which discovered that facilitating conditions were the dominating factor influencing Hong Kong elementary teachers’ behavioral intentions to adopt educational technology. Facilitating conditions tended to increase the use of new technology in schools.
At first, some demographic factors, such as gender, major and training, were supposed to have moderating effects on the path relationships in the model. This was because some studies showed that male teachers usually perform better than women teachers when using educational technology [68,69]. Those teachers who graduated from a mathematics-related major were predicted to be good at using dynamic mathematics software since they may have had the opportunity to learn the course of mathematics education technologies. Those teachers who experienced systematic training also should feel more useful and easier when using dynamic mathematics software. The multi-group analysis between the two groups of gender, major, and training showed that they all failed to moderate the relationships between the independent variables and dependent variable at the significant level of 0.05. However, major will moderate the path relationship between effort expectancy and usage behavior (β = −0.203, p = 0.099), and training will moderate the path relationships between performance expectancy and usage behavior (β = 0.255, p = 0.054), and between social influence and usage behavior (β = −0.274, p = 0.061) at the significant level of 0.1. The results are consistent with some similar studies. For example, the work of Aldekheel et al. [63] showed that gender, age, and tablet PC experience had non-significant moderating effects on high school teachers’ information technology adoption. Koh et al. [99,100] also found that teachers’ age and gender did not have any influence on their constructivist-oriented technological pedagogical content knowledge. Even so, it was not meeting people’s intuition. We estimated the results of multi-group analysis may have been influenced by the fact that more than 70% of respondents did not experience systematic training on dynamic mathematics software, and more than 70% of respondents had more than five years of teaching experience. This meant that some of them did not have an opportunity to learn dynamic mathematics software, even though they graduated from a mathematics-related major. Some of them may forget how to use this kind of software effectively because of the lack of practices. This finding is consistent with the work of Koh et al. [100], which found that primary school teachers and those with more teaching experience tended to be less confident of their constructivist-oriented technological pedagogical content knowledge.

6. Implications

6.1. Theoretical Implications

Based on the united theory of acceptance and use of technology (UTAUT), this study developed a conceptual model to determine the factors that positively affect elementary school teachers’ usage behavior of dynamic mathematics software. This model had an explanatory power of more than 50%, which provides a good theoretical framework. There was no analysis of the adoption of dynamic mathematics software in Asian schools so far. Therefore, this theoretical framework contributes to determining the factors affecting elementary school teachers’ usage behavior of dynamic mathematics software. It may be used for exploring the influencing factors of the adoption of other technology-based teaching and learning media at the K-12 level. It can also be a foundation for future study to discover more factors that affect teachers to adopt dynamic mathematics software.

6.2. Practical Implications

This study showed that effort expectancy and facilitating conditions positively affect elementary school teachers’ usage behavior of dynamic mathematics software, while facilitating conditions were the biggest influential factor. It may be concluded that the affordance of dynamic mathematics software was not elementary school teachers’ priority. Elementary school mathematics teachers may be reluctant to use dynamic mathematics software with a lack of facilitating conditions. We suggest that schools should provide hardware and software facilities for teachers using dynamic mathematics software in each classroom. It is also important to provide rich curriculum resources related to dynamic mathematics software [101]. Expert teachers in using dynamic mathematics software are needed in every school. They should have abilities to provide technological, pedagogical, and content knowledge support when the other teachers have trouble in using dynamic mathematics software. Systematic and effective training on dynamic mathematics software will improve the effort expectancy of elementary school mathematics teachers, which will affect their usage behaviors eventually. Since 2013, the Chinese government launched a project which aimed to improve the information technology application capabilities of elementary and secondary teachers [102,103]. However, the assessment did not pay more attention to school teachers’ abilities to use subject-specific educational technology [104], such as dynamic mathematics software for school mathematics teachers. It is necessary to add this requirement. Moreover, since elementary school mathematics teachers also noticed the ease of using dynamic mathematics software, the developers can continue to revise the software program, so that it can be easily used. Some usage tips and models for dynamic mathematics software can also be given to teachers.

7. Conclusions

By using the PLS-SEM approach, this study analyzed factors affecting elementary school teachers’ usage behavior of dynamic mathematics software based on a revised UTAUT model. It was found that facilitating conditions and effort expectancy significantly and positively affected elementary school teachers’ usage behavior of dynamic mathematics software, and facilitating conditions were the greatest influential factor. There are no significant moderating effects of gender, major, and training on all relationships in the dynamic mathematics software usage conceptual model. This study contributed to enhancing teachers’ ability for digital teaching by helping schools and the government to figure out the important factors that need to be observed for the adoption of dynamic mathematics software at the elementary school level. In order to improve elementary school teachers’ usage behavior of dynamic mathematics software, the government should provide sufficient funds to make sure the schools have enough hardware and software facilities, the schools should provide appropriate curriculum resources related to dynamic mathematics software, and the teachers should try their best to learn how to use dynamic mathematics software effectively in their classrooms.

8. Limitations and Future Research

This study had several limitations that need to be considered with caution. Firstly, it only used a small and non-random sample. The regional, cultural, and urban characteristics may also have had significant differences. This may constrain generalizability of conclusions. Therefore, another examination is needed to confirm the results of this study. Secondly, the model in this study can only explain up to 56.3%, indicating that some other factors still affect elementary school teachers’ usage behavior of dynamic mathematics software. Further studies need to use internal factors such as self-efficacy, TPACK, or digital teaching competency. Finally, the qualitative methods, such as in-depth interview, should be included. A further study may need to integrate quantitative and qualitative methods to explore the factors influencing secondary school teachers to adopt dynamic mathematics software.

Author Contributions

Conceptualization, Z.Y. and J.L.; methodology, Z.Y., J.L., X.D. and T.D.; software, Z.Y., J.L. and T.T.W.; validation, Z.Y., J.L., X.D. and T.D.; formal analysis, Z.Y., J.L. and T.T.W.; investigation, Z.Y.; resources, Z.Y.; data curation, Z.Y. and J.L.; writing—original draft preparation, Z.Y., J.L. and T.T.W.; writing—review and editing, Z.Y., J.L., X.D., T.D. and T.T.W.; visualization, Z.Y., J.L. and T.T.W.; supervision, Z.Y.; project administration, Z.Y.; funding acquisition, Z.Y. All authors have read and agreed to the published version of the manuscript.

Funding

This study was funded by Young Scholar Fund of Humanities & Social Science of Chinese Ministry of Education, grant number 18YJC880115.

Data Availability Statement

Not applicable.

Acknowledgments

The authors extend their thanks to all elementary school mathematics teachers in the Hunan and Guangdong provinces of China who supported this study.

Conflicts of Interest

The authors declare no conflict of interest.

Appendix A

Table A1. Questionnaire items for investigating the factors influencing elementary school teachers’ usage behavior of dynamic mathematics software.
ConstructsCodeChinese VersionEnglish VersionReferences
Performance Expectancy
(PE)
PE1Q1.动态数学软件有助于小学生理解几何图形之间的关系Q1. Dynamic mathematics software helps elementary school students to understand the relationships between geometry figures.[20,79]
PE2Q2.动态数学软件有助于培养小学生的推理意识和猜想能力Q2. Dynamic mathematics software helps to cultivate elementary school students’ reasoning awareness and conjecture ability.
PE3Q3.动态数学软件有助于小学生符号意识的形成和发展Q3. Dynamic mathematics software helps the formation and development of symbolic consciousness of elementary school students.
PE4Q4.动态数学软件有助于小学生建立模型意识Q4. Dynamic mathematics software helps elementary school students to build modeling awareness.
PE5Q5.动态数学软件有助于小学生体会数据的随机性Q5. Dynamic mathematics software helps elementary school students experience the randomness of data.
PE6Q6.动态数学软件有助于培养小学生的数据意识Q6. Dynamic mathematics software helps elementary school students to cultivate data awareness.
Effort Expectancy
(EE)
EE1Q7.我觉得动态数学软件很容易使用I find dynamic mathematics software is easy to use.[44,45,79]
EE2Q8.我觉得动态数学软件的操作过程很容易理解I find the illustration of dynamic mathematics software is easy to understand.
EE3Q9.我能很灵活地使用动态数学软件完成我想做的事情I can flexibly use dynamic mathematics software according to my wishes.
Social Influence (SI)SI1Q10.我相信领导会很乐意看到我在恰当的时候使用动态数学软件I believe the school leaders will encourage me to use dynamic mathematics software at the right time.[44,45,48]
SI2Q11.我相信同事会很乐意看到我在恰当的时候使用动态数学软件I believe my fellow teachers will encourage me to use dynamic mathematics software at the right time.
SI3Q12.我相信学生会很乐意看到我在恰当的时候使用动态数学软件I believe students will be happy and encourage me to use dynamic mathematics software at the right time.
Facilitating Conditions
(FC)
FC1Q13.学校有较好的硬件设备来支持我使用动态数学软件The school has complete facilities for me to use dynamic mathematics software.[44,45,56,79]
FC2Q14.我可以方便的得到使用动态数学软件的相关课程资源I can easily get curriculum resources for using dynamic mathematics software.
FC3Q15.我在使用动态数学软件时可以得到同事或专家的帮助When I have problems using dynamic mathematics software, some colleagues or experts are ready to help me.
Usage Behavior
(UB)
UB1Q19.我在最近一年的数学课堂教学中经常使用动态数学软件In the last year, I often use dynamic mathematics software to teach.[44,45]
UB2Q20.我对自己使用动态数学软件进行教学的效果非常满意I am very satisfied with the effectiveness of myself using dynamic mathematics software.
UB3Q21.我经常推荐其他同事使用动态数学软件I often recommend dynamic mathematics software to other teachers.

References

  1. Cevikbas, M.; Kaiser, G. A systematic review on task design in dynamic and interactive mathematics learning environments (DIMLEs). Mathematics 2021, 9, 399. [Google Scholar] [CrossRef]
  2. Yohannes, A.; Chen, H.-L. GeoGebra in mathematics education: A systematic review of journal articles published from 2010 to 2020. Interact. Learn. Environ. 2021, 29, 1–16. [Google Scholar] [CrossRef]
  3. Ziatdinov, R.; Valles, J.R. Synthesis of modeling, visualization, and programming in GeoGebra as an effective approach for teaching and learning STEM topics. Mathematics 2022, 10, 398. [Google Scholar] [CrossRef]
  4. Caglayan, G. Exploring Archimedes’ quadrature of parabola with GeoGebra snapshots. Technol. Knowl. Learn. 2014, 19, 101–115. [Google Scholar] [CrossRef]
  5. Mushipe, M.; Ogbonnaya, U.I. Geogebra and grade 9 learners’ achievement in linear functions. Int. J. Emerg. Technol. Learn. 2019, 14, 206–219. [Google Scholar] [CrossRef]
  6. Leung, A.; Lee, A.M.S. Students’ geometrical perception on a task-based dynamic geometry platform. Educ. Stud. Math. 2013, 82, 361–377. [Google Scholar] [CrossRef]
  7. Pereira, J.; Tang, J.; Wijaya, T.T.; Purnama, A.; Hermita, N.; Tamur, M. Using Hawgent mathematics software to help primary school students to read clocks. J. Phys. Conf. Ser. 2021, 2049, 012049. [Google Scholar] [CrossRef]
  8. Borwein, J.M. The experimental mathematician: The pleasure of discovery and the role of proof. Int. J. Comput. Math. Learn. 2005, 10, 75–108. [Google Scholar] [CrossRef]
  9. Reis, Z.A.; Ozdemir, S. Using Geogebra as an information technology tool: Parabola teaching. Procedia-Soc. Behav. Sci. 2010, 9, 565–572. [Google Scholar] [CrossRef] [Green Version]
  10. Martinovic, D.; Manizade, A.G. Teachers using GeoGebra to visualize and verify conjectures about trapezoids. Can. J. Sci. Math. Technol. Educ. 2020, 20, 485–503. [Google Scholar] [CrossRef]
  11. Bozkurt, G.; Ruthven, K. Classroom-based professional expertise: A mathematics teacher’s practice with technology. Educ. Stud. Math. 2017, 94, 309–328. [Google Scholar] [CrossRef] [Green Version]
  12. Çekmez, E. Using dynamic mathematics software to model a real-world phenomenon in the classroom. Interact. Learn. Environ. 2020, 28, 526–538. [Google Scholar] [CrossRef]
  13. Hernández-Rodríguez, O.; González, G.; Villafañe-Cepeda, W. Planning a research lesson online: Pre-service teachers’ documentation work. Int. J. Lesson Learn. Stud. 2021, 10, 168–186. [Google Scholar] [CrossRef]
  14. Lavicza, Z.; Papp-Varga, Z. Integrating GeoGebra into IWB-equipped teaching environments: Preliminary results. Technol. Pedagog. Educ. 2010, 19, 245–252. [Google Scholar] [CrossRef] [Green Version]
  15. Miragliotta, E.; Baccaglini-Frank, A.E. Enhancing the Skill of Geometric Prediction Using Dynamic Geometry. Mathematics 2021, 9, 821. [Google Scholar] [CrossRef]
  16. Baya’a, N.; Daher, W.; Mahagna, S. Technology-based collaborative learning for developing the dynamic concept of the angle. Emerg. Sci. J. 2022, 6, 118–127. [Google Scholar] [CrossRef]
  17. Daher, W. Middle school students’ motivation in solving modelling activities with technology. EURASIA J. Math. Sci. Technol. Educ. 2021, 17, em1999. [Google Scholar] [CrossRef]
  18. Radović, S.; Radojičić, M.; Veljković, K.; Marić, M. Examining the effects of Geogebra applets on mathematics learning using interactive mathematics textbook. Interact. Learn. Environ. 2020, 28, 32–49. [Google Scholar] [CrossRef]
  19. Kaplar, M.; Radović, S.; Veljković, K.; Simić-Muller, K.; Marić, M. The Influence of interactive learning materials on solving tasks that require different types of mathematical reasoning. Int. J. Sci. Math. Educ. 2022, 20, 411–433. [Google Scholar] [CrossRef] [PubMed]
  20. MOE. Standards of Mathematics Curriculum for Compulsory Educaiton (2022 Year Version); Beijing Normal University Publishing House: Beijing, China, 2022. (In Chinese) [Google Scholar]
  21. Vitale, J.M.; Swart, M.I.; Black, J.B. Integrating intuitive and novel grounded concepts in a dynamic geometry learning environment. Comput. Educ. 2014, 72, 231–248. [Google Scholar] [CrossRef]
  22. Coutat, S.; Laborde, C.; Richard, P.R. Instrumented learning of the properties in geometry: Foundation course in the acquisition of demonstration competence. Educ. Stud. Math. 2016, 93, 195–221. [Google Scholar] [CrossRef]
  23. Coşkun, T.K.; Deniz, G.F. The contribution of 3D computer modeling education to twenty-first century skills: Self-assessment of secondary school students. Int. J. Technol. Des. Educ. 2022, 32, 1553–1581. [Google Scholar] [CrossRef]
  24. Lin, C.-P.; Shao, Y.-j.; Wong, L.-H.; Li, Y.-J.; Niramitranon, J. The impact of using synchronous collaborative virtual tangram in children’s geometric. Turk. Online J. Educ. Technol. 2021, 10, 250–258. [Google Scholar]
  25. Wijaya, T.T.; Zhou, Y.; Ware, A.; Hermita, N. Improving the creative thinking skills of the next generation of mathematics teachers using dynamic mathematics software. Int. J. Emerg. Technol. Learn. 2021, 16, 212–226. [Google Scholar] [CrossRef]
  26. Güven, B. Using dynamic geometry software to improve eight grade students’ understanding of transformation geometry. Australas. J. Educ. Technol. 2012, 28, 364–382. [Google Scholar] [CrossRef] [Green Version]
  27. Disbudak, O.; Akyuz, D. The comparative effects of concrete manipulatives and dynamic software on the geometry achievement of fifth-grade students. Int. J. Technol. Math. Educ. 2019, 26, 3–20. [Google Scholar]
  28. Birgin, O.; Yazıcı, K.U. The effect of GeoGebra software–supported mathematics instruction on eighth-grade students’ conceptual understanding and retention. J. Comput. Assist. Learn. 2021, 37, 925–939. [Google Scholar] [CrossRef]
  29. Joglar Prieto, N.; Sordo Juanena, J.M.; Star, J.R. Designing Geometry 2.0 learning environments: A preliminary study with primary school students. Int. J. Math. Educ. Sci. Technol. 2014, 45, 396–416. [Google Scholar] [CrossRef]
  30. Leung, A. Variation in tool-based mathematics pedagogy. In Teaching and Learning Mathematics through Variation: Confucian Heritage Meets Western Theories; Huang, R., Li, Y., Eds.; Sense Publishers: Rotterdam, The Netherlands, 2017; pp. 69–84. [Google Scholar] [CrossRef]
  31. Tan, Q.; Yuan, Z. A framework on mathematical problem solving with technology and its applications. J. Math. Educ. 2021, 30, 48–54. (In Chinese) [Google Scholar]
  32. Dikovic, L. Implementing Dynamic Mathematics Resources with GeoGebra at the College Level. Int. J. Emerg. Technol. Learn. (Ijet) 2009, 4, 51–54. [Google Scholar] [CrossRef] [Green Version]
  33. Caglayan, G. Making sense of eigenvalue–eigenvector relationships: Math majors’ linear algebra—Geometry connections in a dynamic environment. J. Math. Behav. 2015, 40, 131–153. [Google Scholar] [CrossRef]
  34. Zengin, Y.; Furkan, H.; Kutluca, T. The effect of dynamic mathematics software geogebra on student achievement in teaching of trigonometry. Procedia-Soc. Behav. Sci. 2012, 31, 183–187. [Google Scholar] [CrossRef] [Green Version]
  35. Birgin, O.; Acar, H. The effect of computer-supported collaborative learning using GeoGebra software on 11th grade students’ mathematics achievement in exponential and logarithmic functions. Int. J. Math. Educ. Sci. Technol. 2022, 53, 872–889. [Google Scholar] [CrossRef]
  36. Doruk, B.K.; Aktümen, M.; Aytekin, C. Pre-service elementary mathematics teachers’ opinions about using GeoGebra in mathematics education with reference to ‘teaching practices’. Teach. Math. Its Appl. Int. J. IMA 2013, 32, 140–157. [Google Scholar] [CrossRef]
  37. Karadag, Z.; McDougall, D. Geogebra as a cognitive tool: Where cognitive theories and technology meet. In Model-Centered Learning: Pathways to Mathematical Understanding Using GeoGebra; Bu, L., Schoen, R., Eds.; Sense Publishers: Rotterdam, The Netherlands, 2011; pp. 169–181. [Google Scholar] [CrossRef]
  38. Rahmadi, I.F.; Lavicza, Z.; Arkün Kocadere, S.; Houghton, T.; Hohenwarter, M. The strengths and weaknesses of user-generated microgames for assisting learning. Educ. Inf. Technol. 2022, 27, 979–995. [Google Scholar] [CrossRef] [PubMed]
  39. Rahmadi, I.F.; Lavicza, Z.; Houghton, T. Towards user-generated microgames for supporting learning: An investigative exploration. Contemp. Educ. Technol. 2021, 13, ep299. [Google Scholar] [CrossRef] [PubMed]
  40. Hu, Y.; Zhang, H. ICT in Education in China. In ICT in Education and Implications for the Belt and Road Initiative; Looi, C.-K., Zhang, H., Gao, Y., Wu, L., Eds.; Springer: Singapore, 2020; pp. 15–35. [Google Scholar] [CrossRef]
  41. Chen, M.; Zhou, C.; Meng, C.; Wu, D. How to promote Chinese primary and secondary school teachers to use ICT to develop high-quality teaching activities. Educ. Technol. Res. Dev. 2019, 67, 1593–1611. [Google Scholar] [CrossRef]
  42. Fan, L.; Luo, J.; Xie, S.; Zhu, F.; Li, S. Chinese students’ access, use and perceptions of ICTs in learning mathematics: Findings from an investigation of Shanghai secondary schools. ZDM-Math. Educ. 2022, 54, 611–624. [Google Scholar] [CrossRef]
  43. Cao, Y.; Zhang, S.; Chan, M.C.E.; Kang, Y. Post-pandemic reflections: Lessons from Chinese mathematics teachers about online mathematics instruction. Asia Pac. Educ. Rev. 2021, 22, 157–168. [Google Scholar] [CrossRef]
  44. Venkatesh, V.; Morris, M.G.; Davis, G.B.; Davis, F.D. User acceptance of information technology: Toward a unified view. MIS Q. 2003, 27, 425–478. [Google Scholar] [CrossRef] [Green Version]
  45. Venkatesh, V.; Thong, J.Y.L.; Xu, X. Consumer acceptance and use of information technology: Extending the unified theory of acceptance and use of technology. MIS Q. 2012, 36, 157–178. [Google Scholar] [CrossRef] [Green Version]
  46. Piramanayagam, S.; Seal, P.P. Hospitality students’ adoption of e-Books during the COVID-19 pandemic: A developing country perspective. Libr. Philos. Pract. 2021, 5865, 1–17. [Google Scholar]
  47. Foroughi, B.; Nhan, P.V.; Iranmanesh, M.; Ghobakhloo, M.; Nilashi, M.; Yadegaridehkordi, E. Determinants of intention to use autonomous vehicles: Findings from PLS-SEM and ANFIS. J. Retail. Consum. Serv. 2023, 70, 103158. [Google Scholar] [CrossRef]
  48. Wijaya, T.T.; Cao, Y.; Weinhandl, R.; Yusron, E.; Lavicza, Z. Applying the UTAUT model to understand factors affecting micro-lecture usage by mathematics teachers in China. Mathematics 2022, 10, 1008. [Google Scholar] [CrossRef]
  49. Shiferaw, K.A.-O.; Mengiste, S.A.; Gullslett, M.K.; Zeleke, A.A.; Tilahun, B.; Tebeje, T.; Wondimu, R.; Desalegn, S.; Mehari, E.A.-O. Healthcare providers’ acceptance of telemedicine and preference of modalities during COVID-19 pandemics in a low-resource setting: An extended UTAUT model. PLoS ONE 2021, 16, e0250220. [Google Scholar] [CrossRef] [PubMed]
  50. Saprikis, V.; Avlogiaris, G.; Katarachia, A. Determinants of the intention to adopt mobile augmented reality Apps in shopping malls among university students. J. Theor. Appl. Electron. Commer. Res. 2021, 16, 491–512. [Google Scholar] [CrossRef]
  51. Davis, F.D.; Bagozzi, R.P.; Warshaw, P.R. User acceptance of computer technology: A comparison of two theoretical models. Manag. Sci. 1989, 35, 982–1003. [Google Scholar] [CrossRef] [Green Version]
  52. Venkatesh, V.; Bala, H. Technology acceptance model 3 and a research agenda on interventions. Decis. Sci. 2008, 39, 273–315. [Google Scholar] [CrossRef] [Green Version]
  53. Davis, F.D. Perceived usefulness, perceived ease of use, and user acceptance of information technology. MIS Q. 1989, 13, 319–340. [Google Scholar] [CrossRef] [Green Version]
  54. Venkatesh, V.; Davis, F.D. A theoretical extension of the technology acceptance model: Four longitudinal field studies. Manag. Sci. 2000, 46, 186–204. [Google Scholar] [CrossRef] [Green Version]
  55. Abbad, M.A.-O. Using the UTAUT model to understand students’ usage of e-learning systems in developing countries. Educ. Inf. Technol. 2021, 26, 7205–7224. [Google Scholar] [CrossRef] [PubMed]
  56. Wong, K.-T.; Teo, T.; Russo, S. Interactive whiteboard acceptance: Applicability of the UTAUT model to student teachers. Asia-Pac. Educ. Res. 2013, 22, 1–10. [Google Scholar] [CrossRef]
  57. Wijaya, T.T.; Weinhandl, R. Factors influencing students’s continuous intentions for using micro-lectures in the post-COVID-19 period: A modification of the UTAUT-2 Approach. Electronics 2022, 11, 1924. [Google Scholar] [CrossRef]
  58. Graham, M.A.; Stols, G.; Kapp, R. Teacher practice and integration of ICT: Why are or aren’t South African teachers using ICTs in their classrooms. Int. J. Instr. 2020, 13, 749–766. [Google Scholar] [CrossRef]
  59. Wijaya, T.T.; Zhou, Y.; Houghton, T.; Weinhandl, R.; Lavicza, Z.; Yusop, F.D. Factors affecting the use of digital mathematics textbooks in Indonesia. Mathematics 2022, 10, 1808. [Google Scholar] [CrossRef]
  60. Venkatesh, V. Determinants of perceived ease of use: Integrating control, intrinsic motivation, and emotion into the technology acceptance model. Inf. Syst. Res. 2000, 11, 342–365. [Google Scholar] [CrossRef] [Green Version]
  61. Saal, P.E.; Graham, M.A.; van Ryneveld, L. Integrating educational technology in mathematics education in economically disadvantaged areas in South Africa. Comput. Sch. 2020, 37, 253–268. [Google Scholar] [CrossRef]
  62. LÓPez-PÉRez, V.A.L.-P.; RamÍRez-Correa, P.E.; GrandÓN, E.E. Innovativeness and factors that affect the information technology adoption in the classroom by primary teachers in Chile. Inform. Educ. 2019, 18, 165–185. [Google Scholar] [CrossRef]
  63. Aldekheel, A.Y.; Khalil, O.; AlQenaei, Z.M. Factors impacting teachers’ continued IT adoption in pre-college education. J. Inf. Technol. Educ. Res. 2022, 21, 465–500. [Google Scholar] [CrossRef]
  64. Salahshour Rad, M.; Nilashi, M.; Mohamed Dahlan, H.; Ibrahim, O. Academic researchers’ behavioural intention to use academic social networking sites: A case of Malaysian research universities. Inf. Dev. 2017, 35, 245–261. [Google Scholar] [CrossRef]
  65. Anthony, B.; Kamaludin, A.; Romli, A. Predicting academic staffs behaviour intention and actual use of blended learning in higher education: Model development and validation. Technol. Knowl. Learn. 2021, 26, 1–47. [Google Scholar] [CrossRef]
  66. Foluke, O. Determinants of electronic book adoption in Nigeria. J. Libr. Inf. Technol. 2019, 39, 175–179. [Google Scholar] [CrossRef] [Green Version]
  67. Teo, T.; Noyes, J. Explaining the intention to use technology among pre-service teachers: A multi-group analysis of the unified theory of acceptance and use of technology. Interact. Learn. Environ. 2014, 22, 51–66. [Google Scholar] [CrossRef]
  68. Jang, S.-J.; Tsai, M.-F. Reasons for using or not using interactive whiteboards: Perspectives of Taiwanese elementary mathematics and science teachers. Australas. J. Educ. Technol. 2012, 28, 1451–1465. [Google Scholar] [CrossRef]
  69. Chen, K.T. Elementary EFL teachers’ computer phobia and computer self-efficacy in Taiwan. Turk. Online J. Educ. Technol. 2012, 11, 100–107. [Google Scholar]
  70. Eagly, A.H. Gender and social influence: A social psychological analysis. Am. Psychol. 1983, 38, 971–981. [Google Scholar] [CrossRef]
  71. Redmond, P.; Lock, J.V. Secondary pre-service teachers’ perceptions of technological pedagogical content knowledge (TPACK): What do they really think? Australas. J. Educ. Technol. 2019, 35, 45–54. [Google Scholar] [CrossRef] [Green Version]
  72. Schmid, M.; Brianza, E.; Petko, D. Self-reported technological pedagogical content knowledge (TPACK) of pre-service teachers in relation to digital technology use in lesson plans. Comput. Hum. Behav. 2021, 115, 106586. [Google Scholar] [CrossRef]
  73. Yuan, Z.; Li, S. Developing prospective mathematics teachers’ technological pedagogical content knowledge (TPACK): A case of normal distribution. In Proceedings of the 12th International Congress on Mathematical Education, COEX, Seoul, Repulic of Korea, 8–15 July; pp. 5804–5813.
  74. Yuan, Z.; LI, X. “Same Content Different Designs” activities and their impact on prospective mathematics teachers’ professional development: The case of Nadine. In How Chinese Teach Mathematics: Perspectives from Insiders; Fan, L., Wong, N.-Y., Cai, J., Li, S., Eds.; World Scientific: Singapore, 2015; pp. 567–590. [Google Scholar]
  75. Yuan, Z.; Huang, R. Pedagogical training for prospective mathematics teachers in China. In How Chinese Acquire and Improve Mathematics Knowledge for Teaching; Li, Y., Huang, R., Eds.; Koninklijke Brill NV: Leiden, The Netherlands, 2018; pp. 137–152. [Google Scholar]
  76. Sungur Gül, K.; Ateş, H. An examination of the effect of technology-based STEM education training in the framework of technology acceptance model. Educ. Inf. Technol. 2022, 27, 1–27. [Google Scholar] [CrossRef]
  77. Kolil, V.K.; Achuthan, K. Longitudinal study of teacher acceptance of mobile virtual labs. Educ. Inf. Technol. 2022, 27, 1–34. [Google Scholar] [CrossRef]
  78. Lee, C.-Y.; Chen, M.-J. Developing a questionnaire on technology-integrated mathematics instruction: A case study of the AMA training course in Xinjiang and Taiwan. Br. J. Educ. Technol. 2016, 46, 1287–1303. [Google Scholar] [CrossRef]
  79. Pittalis, M. Extending the technology acceptance model to evaluate teachers’ intention to use dynamic geometry software in geometry teaching. Int. J. Math. Educ. Sci. Technol. 2021, 52, 1385–1404. [Google Scholar] [CrossRef]
  80. Lin, H.-M.; Lee, M.-H.; Liang, J.-C.; Chang, H.-Y.; Huang, P.; Tsai, C.-C. A review of using partial least square structural equation modeling in e-learning research. Br. J. Educ. Technol. 2020, 51, 1354–1372. [Google Scholar] [CrossRef]
  81. Hair, J.F.; Ringle, C.M.; Sarstedt, M. PLS-SEM: Indeed a silver bullet. J. Mark. Theory Pract. 2011, 19, 139–152. [Google Scholar] [CrossRef]
  82. Hair, J.F.; Risher, J.J.; Sarstedt, M.; Ringle, C.M. When to use and how to report the results of PLS-SEM. Eur. Bus. Rev. 2019, 31, 2–24. [Google Scholar] [CrossRef]
  83. Wijaya, T.T.; Yu, B.; Xu, F.; Yuan, Z.; Mailizar, M. Analysis of factors affecting academic performance of mathematics education doctoral students: A structural equation modeling approach. Int. J. Environ. Res. Public Health 2023, 20, 4518. [Google Scholar] [CrossRef] [PubMed]
  84. Hair, J.F.; Sarstedt, M.; Ringle, C.M.; Mena, J.A. An assessment of the use of partial least squares structural equation modeling in marketing research. J. Acad. Mark. Sci. 2012, 40, 414–433. [Google Scholar] [CrossRef]
  85. Hair, J.; Hult, T.; Ringle, C.; Sarstedt, M. A Primer on Partial Least Squares Structural Equation Modeling (PLS-SEM), 2nd ed.; Sage Publications: Los Angeles, CA, USA, 2017. [Google Scholar]
  86. Hair, J.F.; Black, W.; Babin, B.; Anderson, R. Multivariate Data Analysis, 8th ed.; Cengage Learning EMEA: Hampshire, UK, 2019. [Google Scholar]
  87. O’brien, R.M. A caution regarding rules of thumb for variance inflation factors. Qual. Quant. 2007, 41, 673–690. [Google Scholar] [CrossRef]
  88. Fornell, C.; Larcker, D.F. Evaluating structural equation models with unobservable variables and measurement error. J. Mark. Res. 1981, 18, 39–50. [Google Scholar] [CrossRef]
  89. Henseler, J.; Hubona, G.; Ray, P.A. Using PLS path modeling in new technology research: Updated guidelines. Ind. Manag. Data Syst. 2016, 116, 2–20. [Google Scholar] [CrossRef]
  90. Huang, C.-H. Using PLS-SEM model to explore the influencing factors of learning satisfaction in blended learning. Educ. Sci. 2021, 11, 249. [Google Scholar] [CrossRef]
  91. Schuberth, F.; Rademaker, M.E.; Henseler, J. Assessing the overall fit of composite models estimated by partial least squares path modeling. Eur. J. Mark. 2022. ahead-of-print. [Google Scholar] [CrossRef]
  92. Ziggers, G.W.; Henseler, J. The reinforcing effect of a firm’s customer orientation and supply-base orientation on performance. Ind. Mark. Manag. 2016, 52, 18–26. [Google Scholar] [CrossRef]
  93. Matthews, L. Applying multigroup analysis in PLS-SEM: A step-by-step process. In Partial Least Squares Path Modeling: Basic Concepts, Methodological Issues and Applications; Latan, H., Noonan, R., Eds.; Springer International Publishing: Cham, Switzerland, 2017; pp. 219–243. [Google Scholar] [CrossRef]
  94. Taamneh, A.; Alsaad, A.; Elrehail, H.; Al-Okaily, M.; Lutfi, A.; Sergio, R.P. University lecturers acceptance of moodle platform in the context of the COVID-19 pandemic. Glob. Knowl. Mem. Commun. 2022. ahead-of-print. [Google Scholar] [CrossRef]
  95. Dahri, N.A.; Vighio, M.S.; Bather, J.D.; Arain, A.A. Factors influencing the acceptance of mobile collaborative learning for the continuous professional development of teachers. Sustainability 2021, 13, 13222. [Google Scholar] [CrossRef]
  96. Alvi, I. College students’ reception of social networking tools for learning in India: An extended UTAUT model. Smart Learn. Environ. 2021, 8, 19. [Google Scholar] [CrossRef]
  97. Tosuntaş, Ş.B.; Karadağ, E.; Orhan, S. The factors affecting acceptance and use of interactive whiteboard within the scope of FATIH project: A structural equation model based on the unified theory of acceptance and use of technology. Comput. Educ. 2015, 81, 169–178. [Google Scholar] [CrossRef]
  98. Wong, G.K.W. The behavioral intentions of Hong Kong primary teachers in adopting educational technology. Educ. Technol. Res. Dev. 2016, 64, 313–338. [Google Scholar] [CrossRef]
  99. Koh, J.H.L.; Chai, C.S. Modeling pre-service teachers’ technological pedagogical content knowledge (TPACK) perceptions: The influence of demographic factors and TPACK constructs. In Proceedings of the Australasian Society for Computers in Learning in Tertiary Education (ASCILITE) Conference, Hobart, Australia, 4–7 December 2011; pp. 735–746. [Google Scholar]
  100. Koh, J.H.L.; Chai, C.S.; Tsai, C.-C. Demographic factors, TPACK constructs, and teachers’ perceptions of constructivist-Oriented TPACK. Educ. Technol. Soc. 2014, 17, 185–196. [Google Scholar]
  101. Bozkurt, G.; Koyunkaya, M.Y. Supporting prospective mathematics teachers’ planning and teaching technology-based tasks in the context of a practicum course. Teach. Teach. Educ. 2022, 119, 103830. [Google Scholar] [CrossRef]
  102. Wu, D. An introduction to ICT in education in China. In ICT in Education in Global Context: Emerging Trends Report 2013–2014; Huang, R., Kinshuk, Price, J.K., Eds.; Springer: Berlin/Heidelberg, Germany, 2014; pp. 65–84. [Google Scholar] [CrossRef]
  103. MOE. An opinion on the implementing a project named improvement of information technology application abilities of elementary and secondary school teachers of China. Inserv. Educ. Train. Sch. Teach. 2013, 3–4. (In Chinese) [Google Scholar]
  104. Yuan, Z.; Milner-Bolotin, M. A study of a TPACK-based subject-specific educational technology course and its implications: The case of “Teaching Mathematics and Science through Technology” course at the University of British Columbia. J. Math. Educ. 2020, 29, 23–28. (In Chinese) [Google Scholar]
Figure 1. Dynamic mathematics software usage conceptual model.
Mathematics 11 01536 g001
Figure 2. Final model with R2, path coefficients, and p values.
Mathematics 11 01536 g002
Table 1. Demographics data of the respondents.
DemographicTypeNPercentage
GenderMale7126.7
Female19573.3
Level of educationBachelor’s or associate degree25595.9
Master’s degree114.1
MajorMathematics17967.3
Non-Mathematics8732.7
Teaching experiences less than 5 years7327.4
between 6–15 years9937.2
over 15 years9435.3
School locationUrban20476.7
Rural6223.3
Training on dynamic mathematics software Yes7227.1
No19472.9
Table 2. Results for reliability, convergent validity, and multicollinearity test.
ConstructsIndicatorOuter LoadingsT-
Statistics
Cronbach’s AlphaComposite Reliability
(CR, ρA)
Average Variance Extracted (AVE)Variance Inflation Factor (VIF)
Performance Expectancy (PE)PE10.84027.0630.9490.9690.7972.876
PE20.90951.9434.957
PE30.88440.4983.042
PE40.88332.5433.360
PE50.91750.3615.674
PE60.92153.2756.816
Effort Expectancy
(EE)
EE10.90754.2330.8970.8990.8292.682
EE20.90653.5612.711
EE30.91984.8732.839
Social Influence
(SI)
SI10.967130.9280.9490.9500.9087.404
SI20.95578.8235.870
SI30.93668.8913.957
Facilitating Conditions (FC)FC10.86936.2630.8940.9020.8252.192
FC20.92973.8963.393
FC30.92583.9053.130
Usage Behavior
(UB)
UB10.91167.2830.9050.9120.8402.720
UB20.94399.4004.055
UB30.89546.1802.884
Table 3. Results of the Fornell–Larcker test for assessing discriminant validity.
ConstructsEEFCPESIUB
Effort Expectancy (EE)0.911
Facilitating Conditions (FC)0.5800.908
Performance Expectancy (PE)0.4200.3540.893
Social Influence (SI)0.3790.3470.7420.953
Usage Behavior (UB)0.5830.7210.2630.2600.917
Table 4. Results of the HTMT test for assessing discriminant validity.
ConstructsEEFCPESIUB
Effort Expectancy (EE)
Facilitating Conditions (FC)0.640
Performance Expectancy (PE)0.4490.381
Social Influence (SI)0.4120.3790.789
Usage Behavior (UB)0.6430.7950.2800.287
Table 5. Results of the initial hypothesis test.
RelationshipsPath Coefficients (β)Sample MeanStandard DeviationT-
Statistics
p-
Values
Effect Size f2Result
H1: PE→UB−0.053−0.0520.0531.0070.3140.003Not Supported
H2: EE→UB0.2680.2670.0594.5680.0000.100Supported
H3: SI→UB−0.004−0.0060.0640.0690.9450.000Not Supported
H4: FC→UB0.5860.5870.05311.0970.0000.506Supported
Table 6. Results of moderating effect analysis of gender.
RelationshipsPath Coefficients (β)p-Values
2-Tailed (Female vs. Male)
Result
H1: PE→UB0.0760.467Not Supported
H2: EE→UB−0.0220.882Not Supported
H3: SI→UB−0.1170.374Not Supported
H4: FC→UB0.0220.911Not Supported
Table 7. Results of moderating effect analysis of major.
RelationshipsPath Coefficients (β)p-Values
2-Tailed (Math vs. Non-Math)
Result
H1: PE→UB0.1050.320Not Supported
H2: EE→UB−0.2030.099Not Supported
H3: SI→UB−0.1660.185Not Supported
H4: FC→UB0.1290.235Not Supported
Table 8. Results of moderating effect analysis of training.
RelationshipsPath Coefficients (β)p-Values
2-Tailed (Training-Yes vs.
Training-No)
Result
H1: PE→UB0.2550.054Not Supported
H2: EE→UB−0.0030.996Not Supported
H3: SI→UB−0.2740.061Not Supported
H4: FC→UB0.1000.439Not Supported
Disclaimer/Publisher’s Note: The statements, opinions and data contained in all publications are solely those of the individual author(s) and contributor(s) and not of MDPI and/or the editor(s). MDPI and/or the editor(s) disclaim responsibility for any injury to people or property resulting from any ideas, methods, instructions or products referred to in the content.

