
Intelligent Health Care and Diseases Management System: Multi-Day-Ahead Predictions of COVID-19

1
College of Technological Innovation, Abu Dhabi Campus, Zayed University, FF2-0-056, Abu Dhabi P.O. Box 144534, United Arab Emirates
2
Department of Computer Sciences, Sub Campus Burewala-Vehari, University of Agriculture Faisalabad, Faisalabad 38000, Pakistan
*
Author to whom correspondence should be addressed.
Mathematics 2023, 11(4), 1051; https://doi.org/10.3390/math11041051
Submission received: 5 January 2023
/
Revised: 23 January 2023
/
Accepted: 14 February 2023
/
Published: 19 February 2023
(This article belongs to the Topic Engineering Mathematics)
Abstract
:The rapidly growing number of COVID-19 infected and death cases has had a catastrophic worldwide impact. As a case study, the total number of death cases in Algeria is over two thousand people (increased with time), which drives us to search its possible trend for early warning and control. In this paper, the proposed model for making a time-series forecast for daily and total infected cases, death cases, and recovered cases for the countrywide Algeria COVID-19 dataset is a two-layer dropout gated recurrent unit (TDGRU). Four performance parameters were used to assess the model’s performance: mean absolute error (MAE), root mean squared error (RMSE), R, and mean absolute percentage error (MAPE). The results generated with TDGRU are compared with actual numbers as well as predictions with conventional time-series techniques, such as autoregressive integrated moving average (ARIMA), machine learning model of linear regression (LR), and the time series-based deep learning method of long short-term memory (LSTM). The experiment results on different time horizons show that the TDGRU model outperforms the other forecasting methods that deliver correct predictions with lower prediction errors. Furthermore, since this TDGRU is based on a relatively simpler architecture than the LSTM, in comparison to LSTM-based models, it features a significantly reduced number of parameters, a shorter training period, a lower memory storage need, and a more straightforward hardware implementation.
1. Introduction
The world has witnessed social and economic disruption in the year 2020 due to the emergence of a viral disease called COVID-19, similar to SARS-CoV, the virus responsible for SARS (severe acute respiratory syndrome) [1]. This respiratory illness which was first aroused in December 2019 in the city of Wuhan, China, has touched until now about 88 million persons worldwide, leading to more than 1.9 million deaths [2]. Immediately after the detection of the first case, and without effective medications or vaccinations, countries started to implement prevention measures, such as travel restrictions, quarantines, social distancing, testing, and total or partial containment, to limit the spread of this disease and avert the collapse of their health systems [3]. Simultaneously, multiple types of research were launched to comprehend the clinical and population-based characteristics of incurable disease. One of the important chapters in the comprehension of COVID-19 disease is the epidemiological component. Thus, the epidemiology of the disease allows determining multiple indicators, such as the rate of mortality, fatality, and recovery. It allows the comprehension of its spread and prediction of the epidemic evolution and consequently adopts and evaluates preventive measures [4]. In this way, epidemiological, mathematical, and statistical models are of great importance in the prediction of epidemic trends. In the context of the COVID-19 epidemic, it has caused widespread upheaval in many fields, for example, academia [5], the medical sector [6,7], etc.
Therefore, different models are employed to speculate on its future development., to determine the peak, the end time, and the final size of the epidemic [8,9,10]. Among these models, researchers employed the common epidemiological models such as susceptible infected recovered (SIR) [11]. SEIR models [12] and various variants, as well as other statistical approaches, such as the linear regression algorithms [13], models for data series [14] and machine learning (ML) or AI [15]. ARIMA is a time series model among the traditional machine learning regression methods that could predict future events using aggregating past and current data [16,17]. These models have successfully implemented economics, finance, climatology, hydrology engineering, and epidemiology [18]. In epidemiology, ARIMA was widely and efficiently used in simulating several infectious diseases, such as tuberculosis [19], influenza disease [20], SARS [21], HIV [22], and hemorrhagic fever with renal syndrome [23]. Additionally, this model was extensively utilized to forecast the COVID-19 trend in many nations [24,25,26]. One-layer ANN [27], conventional CNN [28,29], Elman neural network [30], nonlinear-AR-ANN (NARANN) [31], standard recurrent neural network (RNN) [32], and its variants LSTM [33] and GRU, LR [34], LASSO regression model, exponential smoothing method (ESM) [35], support vector regressor (SVR) [36], auto-encoder and variational auto-encoder (AE-VAE) [37] models [38] are all traditional ML models which were employed to forecast the coronavirus evolution. These models use historical data to predict future changes in domains such as image analysis, speech recognition, and health informatics [39]. Additionally, Fu et al. [40] proposed the use of an artificial neural network (ANN) for modeling the confirmed cases and fatalities caused by COVID-19, and stated that the approach was successful. In the current context of COVID-19, machine learning models have not only been used to predict the epidemic evolution but also used in diagnosis and prognosis, patient outcome prediction, drug development, vaccine discovery, false news prediction, and future mutation rate of the novel coronavirus [41].
Multiple studies have been conducted using ARIMA and various artificial intelligence models since the COVID-19 outbreak started. A few studies were used to predict the epidemic trend in different countries [42], while others compared these models’ performance with other models. Some of these comparative studies are cited below. Certain authors have compared the performance of machine learning with the SEIRD model. Bedi [43] reported that for LSTM and SEIRD, in India for a period of thirty days, the models’ predicted accuracy was the same in comparison to the computed fatality and recovery rate. Still, some differences were observed at the state level. In the same way, Liu [44] reported that the SEIRD, LSTM, and GRU models have comparable performance and remarkable prediction capabilities. Other authors compared the performance of ARIMA with other machine learning models. Kirbas [45] found that for predicting COVID-19 coronavirus cases in eight European nations, ARIMA is more accurate than NARNN but less accurate than the LSTM model, while Shahid [46] reported that ARIMA is a less accurate model than other machine learning models, such as Bi-LSTM, LSTM, GRU, and SVR, in the prediction of infected cases, deaths, and recoveries in the top ten most affected countries.
In the same way, Ibrahim [47] reported that Weibull-based LSTM (W-LSTM) showed satisfactory performance in predicting the spread and severity of COVID-19 in 50 countries and outperformed both LSTM and ARIMA models. Azarafza [48] used the LSTM model to anticipate the propagation of the COVID-19 virus in Iran, and its effectiveness was contrasted to that of other deep neural networks, such as the recurrent neural network (RNN), the seasonal autoregressive integrated moving average (SARIMA), Holt-Winter’s exponential smoothing (HWES), and the moving averages (MA) models. The authors claimed that the LSTM model surpasses the competition and generates fewer inaccurate results. Elsheikh et al. [26] reported that ARIMA performs better than NARNN but less than LSTM in forecasting COVID-19 in Saudi Arabia. In another work [49], ARIMA was compared with five other statistical approaches using a wide variety of statistical methods, that is, ridge regression, cubist regression, support vector regressor, and random decision forests, to make predictions on the spread of COVID-19 in Brazil. The authors showed that it has better prediction accuracy than ridge regression, cubist recurrence, and random decision forests, and lower than layering learning and support vector regressor. Papastefanopoulos et al. [1] compared ARIMA to various methods of time series predictions of the spread of COVID-19 in the worst-hit regions using a number of different methods, such as the Holt-Winters additive model (HWAAS), the TBAT and N-Beats. The authors showed that ARIMA and TBAT showed the best performance in terms of root mean square error (RMSE). At last, other works compared the performance of different machine learning models: Chatterjee et al. [50] made predictions on the evolution of COVID-19 in the main 17 countries using LSTM models. The authors concluded that no single model is 100% accurate; however, the performance of multilayer LSTM models is inferior to that of the vanilla, stacked, and bi-LSTM models. In the study of Zeroual [15], standard RNN and its variants, LSTM, Bi-LSTM, and GRUs, are employed for the short-term forecasting of COVID-19 cases in 6 countries. They demonstrated that VAE performs better than the other models. Guo et al. proposed using an ANN to simulate COVID-19 fatalities and confirmed cases. Between January 20 and November, samples on verified cases and fatalities were compiled. In the same way, Shastri [51] collected relatively brief COVID-19 instances in India and the USA for 1 month and compared the results to the outcomes of three LSTM versions. According to their findings, the multi-layer LSTM model outperformed the other models. Inversely, Arora [4] compared convolutional and stacked LSTM algorithms, and it was determined that Bi-LSTM is superior for COVID-19 projection in India due to its lower mean range error. Another work compared the performance of three machine learning models for new deaths and new cured cases in Wuhan. The findings showed that Elman neural networks and support vector machines (SVMs) outperformed LSTM in predicting the trajectory of cumulative fatalities and cumulative cured cases [11].
There are many machine learning methods that can be used for prediction. Machine learning models train their networks by optimizing the parameters and hyperparameters, and there are limitations of computing power and execution time according to accuracy and relevance. GRU is among the best techniques used for time series-based prediction problems. In the proposed model of TDGRU, a two-layered architecture is used to process the input sequences and optimize the number of neurons through the dropout layer in TDGRU layers, and the performance is enhanced. It is also evident from the comparison of results in terms of several performance indices that were carried out for evaluation that the proposed technique significantly gives the best predictions. TDGRU outperforms other existing methods considering all error measures. The current study proposes the TDGRU model to predict COVID-19 infection and recovery. Death cases in the countrywide Algerian data of reported cases, deaths, and recovery by the Algerian ministry of health, for the comparison and recommendation of the efficiency of the proposed three-time series regression models, are employed, named as ARIMA, LR, and LSTM. Overall, the following provides a summary of the main characteristics of this study:
- Multi-layer neural network approaches for COVID-19 daily and overall infection rates, fatalities, and recovered cases are described. The proposed TDGRU architecture among DNN is convenient to develop and implement on time-series datasets due to the better learning capability in the nonlinear feature space and generalization ability.
- The performance of TDGRU is superior to overcoming the gradient exploding/vanishing issues and provides faster convergence by exploiting the dropout technique.
- To compare performance on the proposed TDGRU, baseline regressors ARIMA, LR, and deep learning algorithms, such as LSTM, are also implemented on the datasets for COVID-19 prediction.
- The efficiency, accuracy, and robustness of TDGRU are endorsed in terms of MAE, RMSE, R2 and MAPE performance metrics.
The paper lays forth the methodical framework for a COVID-19 cases prediction model employing the TDGRU algorithm along with comparison models LSTM, ARIMA, and LR. Multi-day forward planning is described in the Section 2 generic structure for prediction models and depicts the COVID-19 infected, death, and recovered cases dataset for Algeria, assessed for use in making predictions. In Section 3, we take a look at the full results of the time series forecasting proposed technique and contrast the outcomes with those of LSTM, ARIMA, and LR models. We talk about how those models could be used and where they could go from here in the future.
2. Materials and Methods
This section presents the approach of this paper, which includes the collection and description of the dataset. The design and a brief explanation of conventional and deep learning models, experiment environment, and the evaluation measures are also discussed. The figure provides a graphical summary of the suggested Figure 1.
2.1. Data Description and Pre-Processing
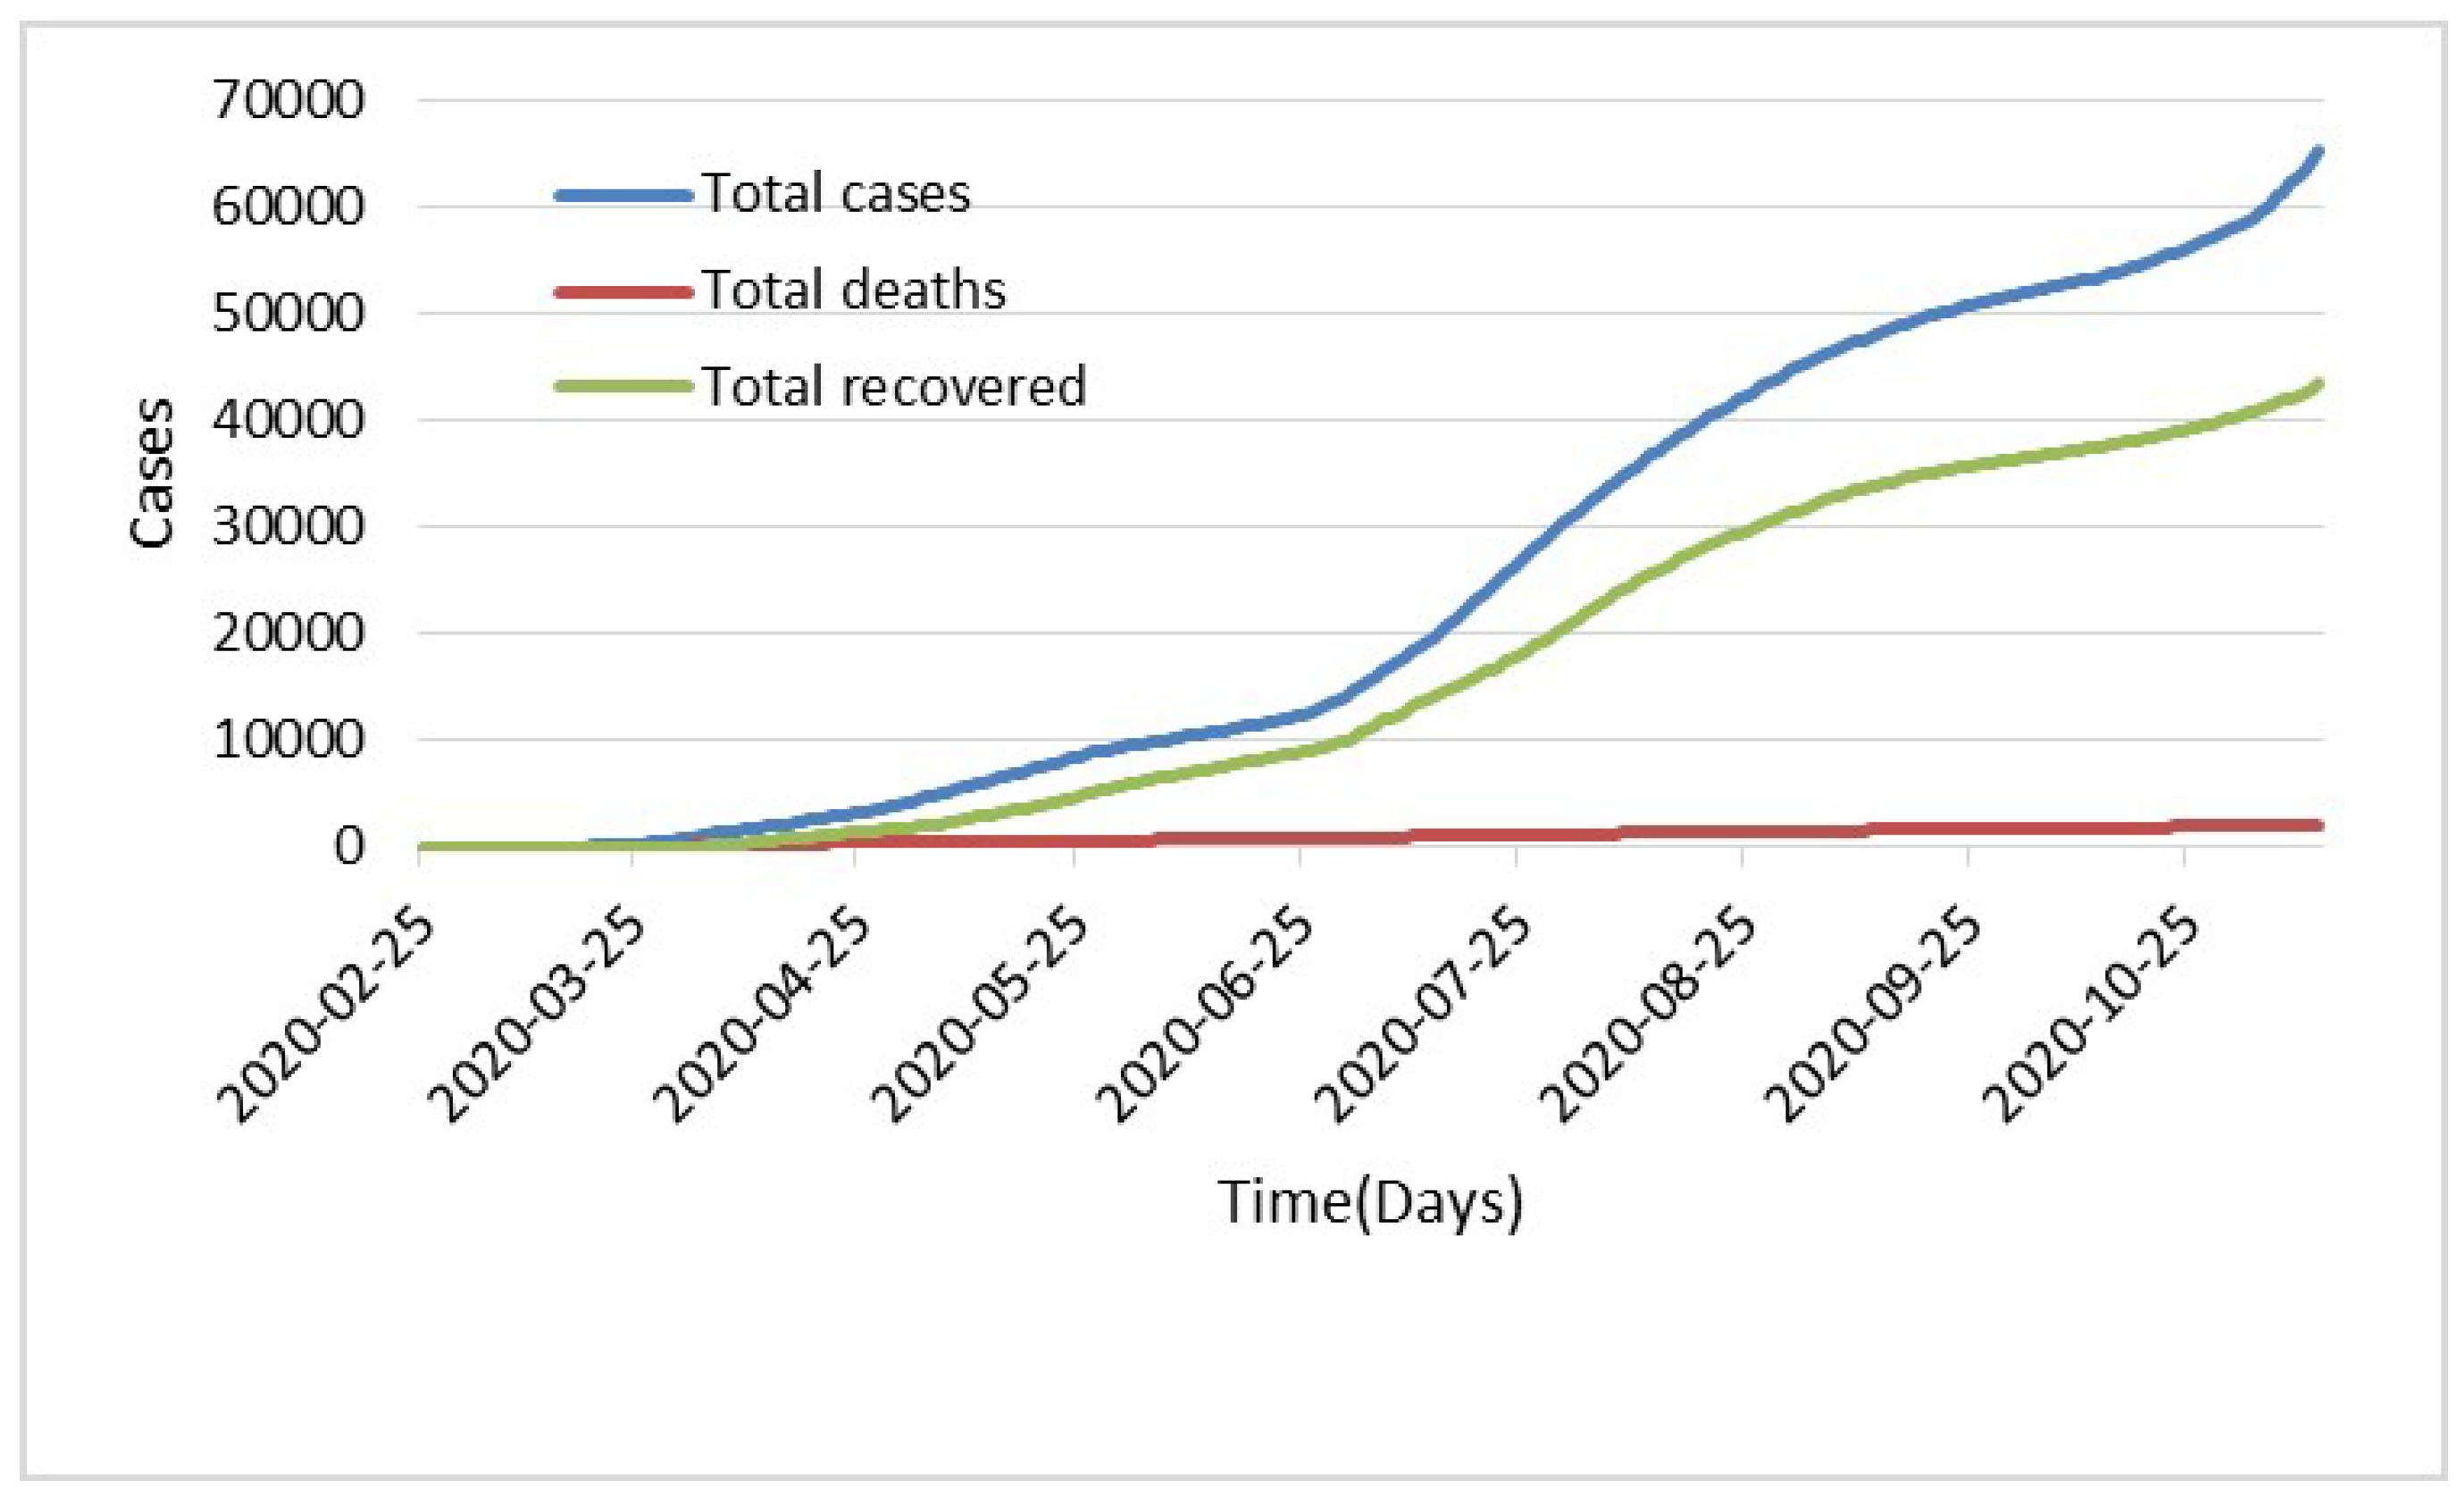
In this work, Algerian COVID-19 infection datasets, recovered, and deaths cases are taken from the daily reports of the Algerian Ministry of Health from 25 February to 12 November 2020 https://ourworldindata.org/coronavirus/country/algeria (accessed on 4 January 2023). Based on the results of the RT-PCR positive tests, the total number of infected patients is determined. On 12 November 2020, 65,108 instances were thought to be involved. The figures demonstrate that within the same day, there were 43,366 people who were recovered and 2111 people who died Figure 2 and Figure 3 in terms of daily infected, death, and recovered cases and the total number of infections, deaths and recoveries, respectively. The data sets were updated till 13 April 2022, and first phase analysis of the data sets was used up to 12 November 2020. To further check the efficiency of the model, TDGRU-II was employed to evaluate all four phases of the corona dataset. The collected dataset has six features, named daily infected cases, total infected cases, daily death cases, total death cases, daily recovered cases and total recovered cases. For the pre-processing part, the Python programming language is used to normalize the data and convert them between 0 and 1. Transformation of the data is performed by using one of the standardization libraries, Minmaxscaler, which is employed to scale the features among the given minimum and maximum values.
Table 1 also includes the suggested models’ respective control parameters. Utilizing the computational intelligence platform Keras, the time series regression models are set up with multi-layers and utilize the Adam optimization algorithm. To mitigate the risk of overfitting, the TDGRU/LSTM models incorporate a dropout control metric in the interlayer space. The optimizer, the number of delays, and the total number of hidden layers are all crucial hyper-parameters for the suggested methods. Greater precision, enhanced efficiency, and satisfactory convergence can all be attained by careful optimization of the relevant parameters. To improve each hyper-parameter, we applied the hit-and-error rule (see Table 1), keeping everything else the same, and choosing optimal parameter values as a compromise between accuracy and runtime. Different optimizers were utilized to generate the experimental results for parameter optimization; the dropout rate, number of hidden neurons, and number of hidden layers are all determined by computing the highest possible score on the validation set. The total amount of delays is determined by the score. The following parameters of a Windows 10 PC were utilized as the simulation environment: specifications include a 1.80 GHz Intel Core (TM) i7-8550U processor, 16 GB of DDR4 RAM, and a 1 TB hard drive. This paper discusses the Python programming language since it meets the needs of the project and may be modified with additional compiler code to increase productivity.
2.2. Gated Recurrent Unit
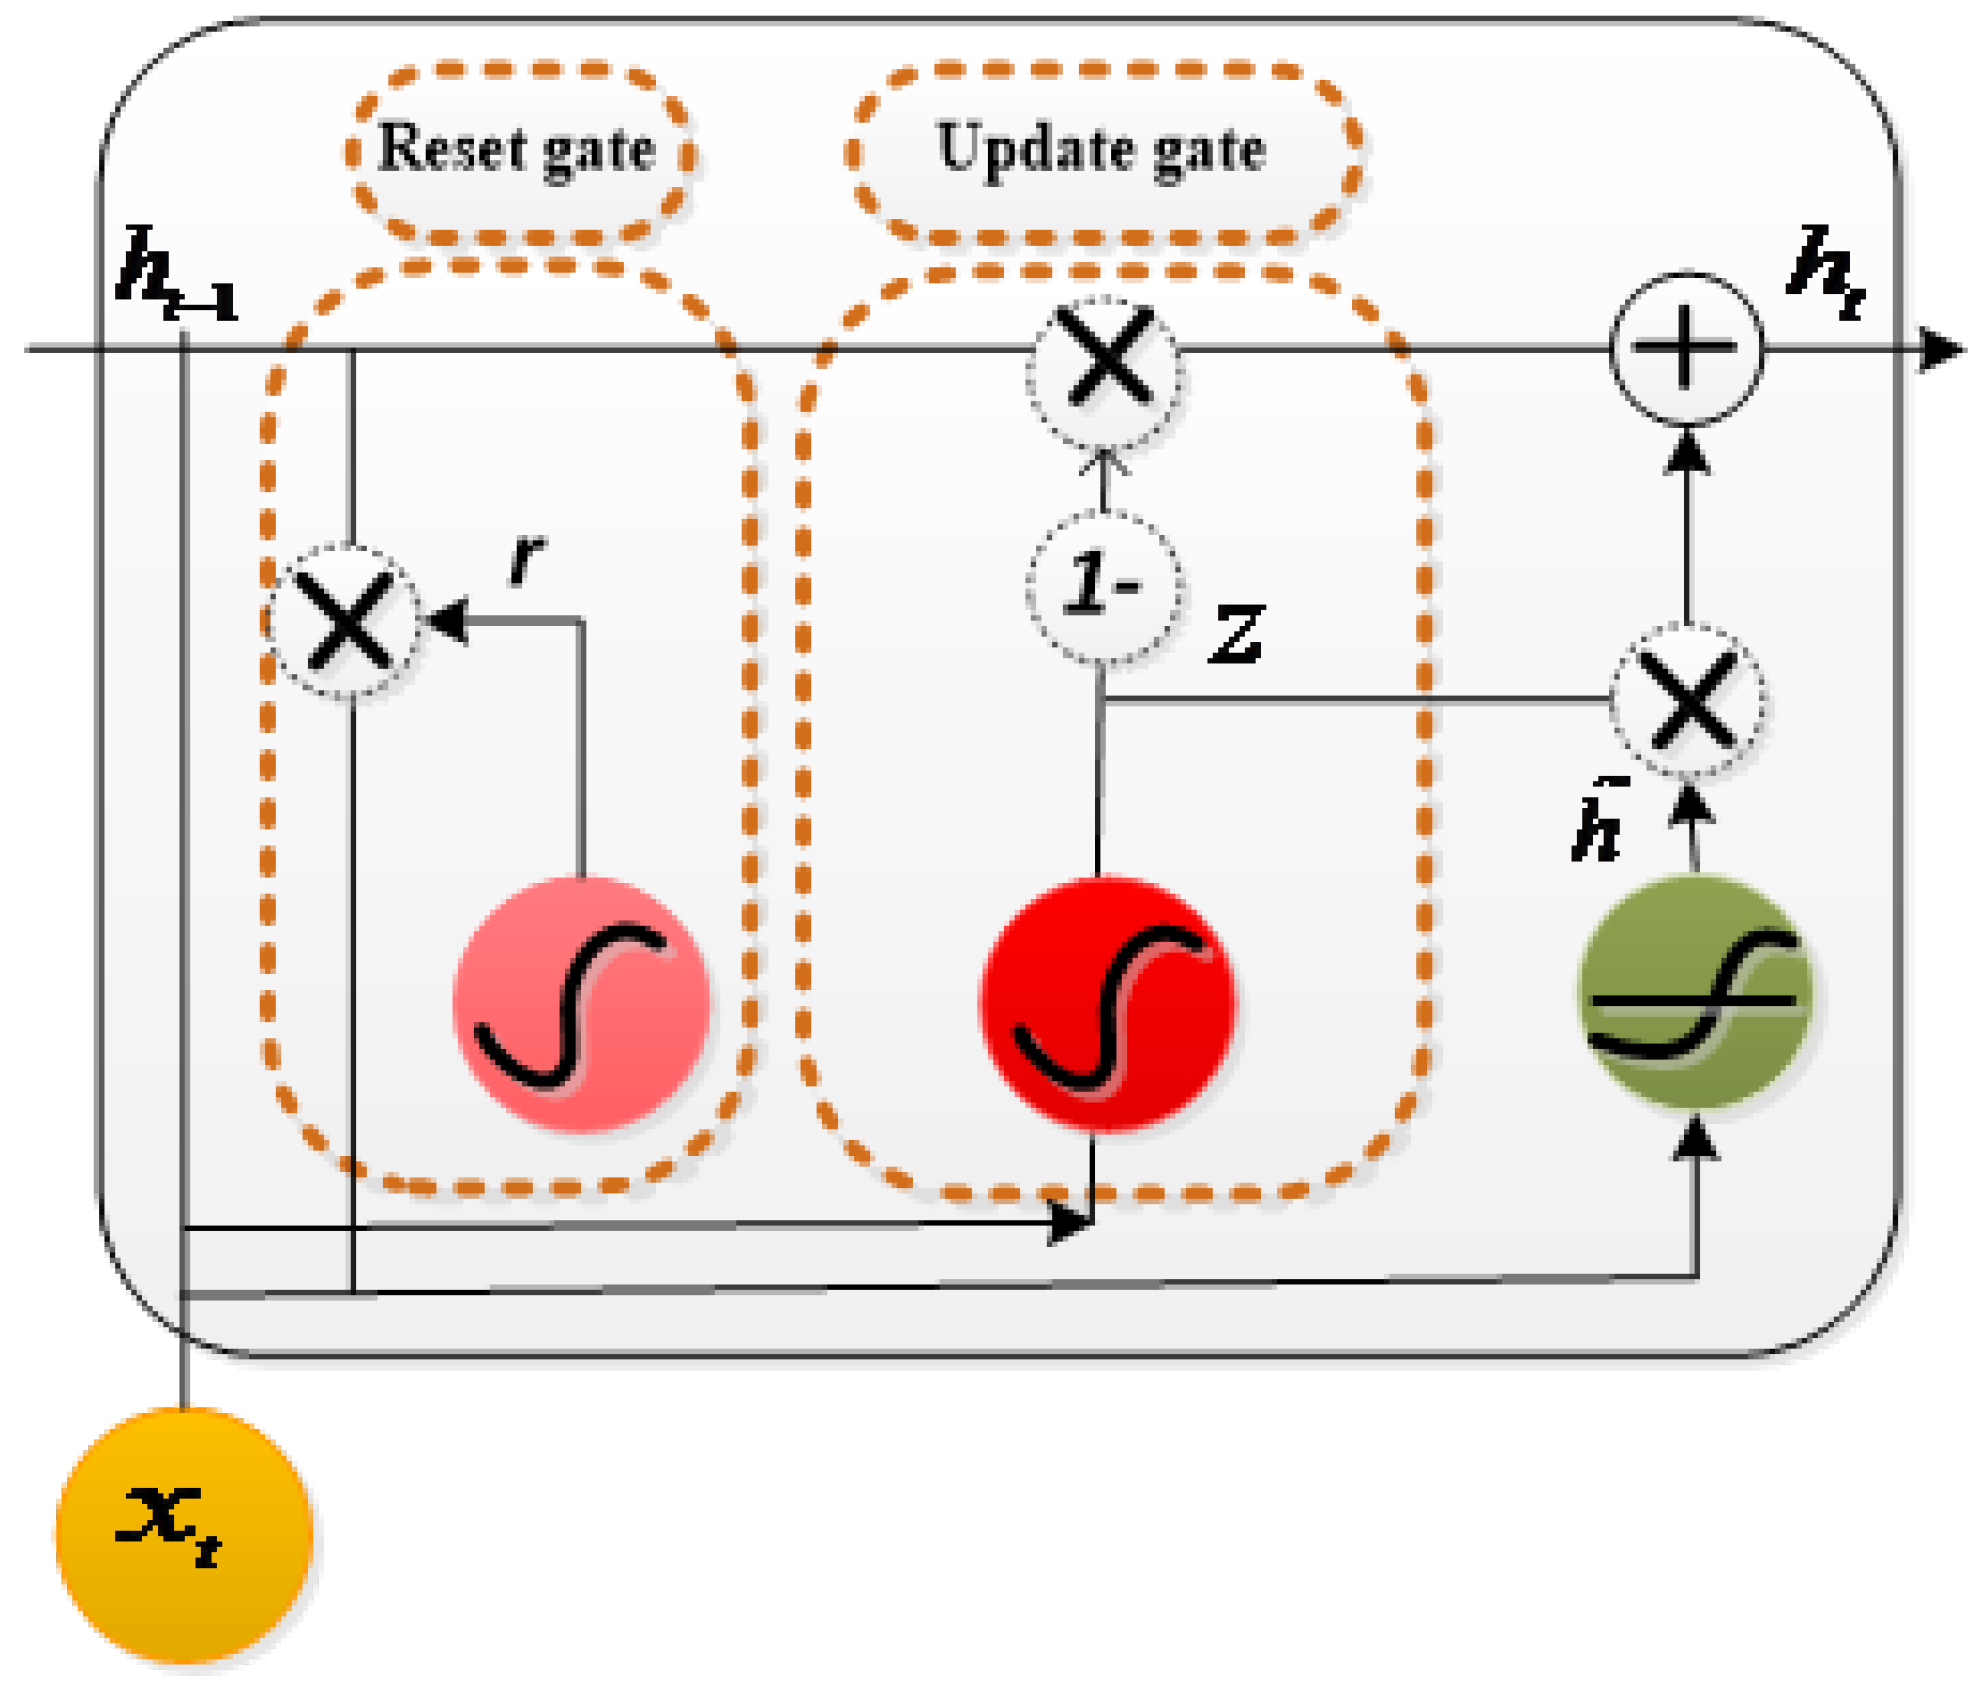
One of the well-known variants of RNN is the gated recurrent unit [52], which comprises two gates, reset and update gates . The update gate is employed when a hidden state is needed to be updated by a new hidden state, whereas the reset gate is selected to ignore the prior hidden state. Figure 4 is a representation of the GRU cell. The reset gate works similarly to the forget gate of LSTM. Similar to the LSTM cell, a hidden unit at time day t is computed using the hidden unit at time day . The reset gate, update gate, and hidden unit at time t are represented in Equations (1)–(3):
, are the reset and update gate’s weight vectors. , , and are the element-wise multiplication and reoccurring input weight vectors ⊗. The sigmoid and kernel functions for GRU output are in the range of (0, 1).
Deep learning neural networks have a large memory. However, the network is prone to learning data features that cannot be generalized, resulting in overfitting. Dropout is among the most popular regularization techniques proposed to address this issue. To reduce neural network complexity, it randomly returns the output of a proportion of the hidden units to zero. During the training process, the dropout layer deactivates some neurons. To facilitate and accelerate the training day, we integrated a dropout layer between the two GRU layers in this work.
2.3. Long Short Term Memory
The LSTM unit was primarily offered by Hochreiter and Schmidhuber [53]. Meanwhile, few modifications to the original RNN have been made; it uses the memory unit to keep the sequence for further use. The paper follows the implementation of LSTM as described in [54]. The architecture of LSTM consists of three gates: an input gate, forget gate, an output gate, and two modulations of input and output. These gates are processed by current and recurrent inputs and use sigmoid as an activation function. Typically, the nonlinear activation function is utilized in the modulation process (tanh). At time day 3, input x updates its states, which are described in Equations (4)–(8).
Here, , and symbolize the forget gate, input gate, and output gate, respectively. is the memory cell unit, and is the output of LSTM. , , , and are the weight vectors of forgetting, input, output gate, and memory cell unit. , , , and are the weight vectors of the recurrent input. , , , and is for the biases and ⊗ the pointwise multiplication. Tanh and sigmoid kernel functions for the LSTM outcome are limited to the domains of (−1, 1) and (0, 1), correspondingly.
2.4. Modeling through ARIMA Model
The auto-regressive moving average works on univariate time series data [55]. It adds three hyperparameters to specify the autoregression (AR), differencing , and moving average (MA), termed as p, d, and q, which denote the autoregressive, difference, and moving average orders, respectively. The entire model is expressed as ARIMA (p, d, q). Suppose the observation series is , that is, the linear function of the proceeding values is shown in Equation (9):
represents the random component of each observation, and is the self-regression coefficient. In this work, we employ the general procedure of ARIMA modeling for the prediction of COVID-19 cases. A suitable model structure and parameters are obtained based on the data obtained after the hit and trial method. The selected parameters for the ARIMA (p, d, q) model are denoted as 2, 1, and 2, respectively.
2.5. Linear Regression
For comparison, the linear regression (LR) model describes relationships between dependent and independent variables. The model with a single regressor input , where, features represent the relationship with the response of with a straight line.
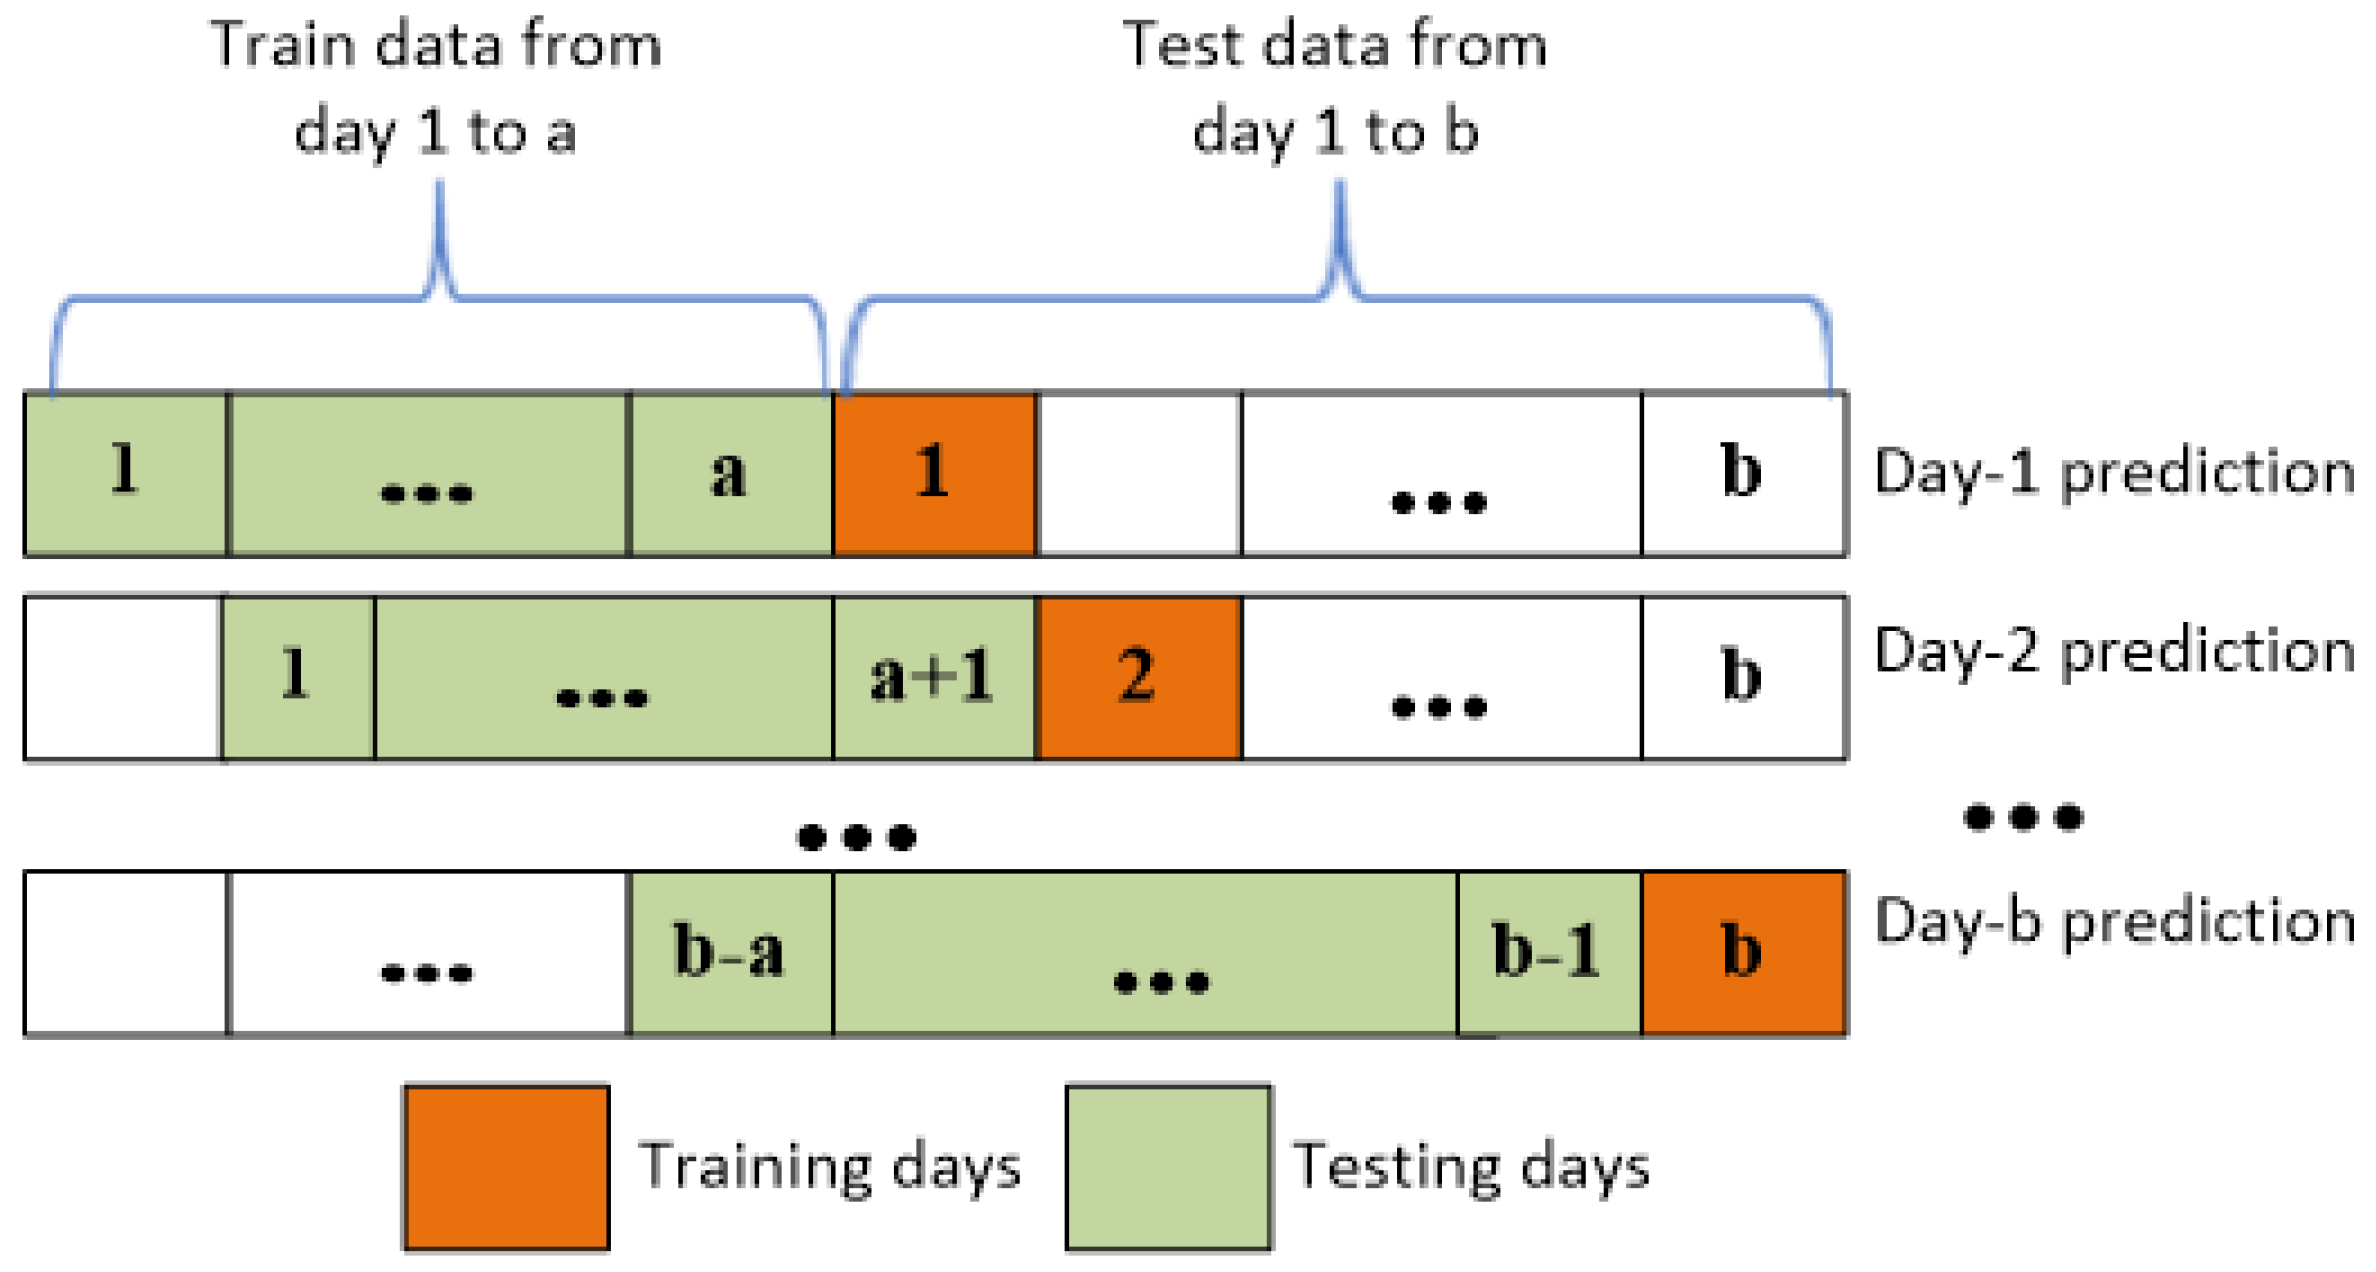
Here, and are the parameters to estimate. Generally, the parameters are learned by minimizing the sum of squared errors. In this work, we employ the general procedure of ARIMA modeling for COVID-19 cases prediction. A suitable model structure and parameters are obtained based on the data obtained after the hit-and-trail method. The selected parameters for the ARIMA (p, d, q) model are denoted as 2, 1, and 2, respectively, where y is the dependent variable, are the independent variables, and are the regression coefficients. Several independent variables, including daily/total infected cases, daily/total death cases, and daily/total recovered instances, are considered in this study. In this study, TDGRU is applied in this work to the countrywide Algeria COVID-19 dataset, which contains total infected cases, daily infected cases, total death cases, daily death cases, total recovered cases, and daily recovered cases as input and we obtain the output in terms of 1, 3, and 5 days ahead of future predictions as mentioned in Figure 4. However, the models’ dataset is divided into two parts: the training set (about 70% of the dataset), which is used to train the network, and the testing set (about 30% of the dataset), which is not utilized during training but provides a measure of network performance before, during, and after training. After much trial and error, a handful of parameters are settled on and implemented, with the best of these being those with higher validation scores. As shown in Figure 5, the data have two train and test splits. The sliding window over the training data is used to learn the nonlinear patterns of COVID-19 cases. This denotes the previous three days’ observations appended with the current time day in the training set. Hence, the training data contain all the observations before the testing day.
The majority of machine learning models make use of 2D arrays (samples and features) as input patterns; this is because temporal forecasting often involves the examination of historical data. On the other hand, TDGRU employs a three-dimensional array to capture trends in the time horizon (samples, time day and attributes). In light of this, it is necessary to transform the time series components that need to be forecasted into a sequential regression problem with predefined lag times. The term loopback describes the number of days in a series (days for the dataset under consideration that are used to review and take into account the feature values in order to use them when predicting the next (and/or subsequent) day(s). Through trial and error, it was discovered that the COVID-19 dataset’s optimal lag value for the very near future (such as ) is a loopback element. This number represents the data records from the seven and three days prior. In Table 2, the prediction performance results for specified lag time evaluations in terms of error measures are listed.
2.6. Evaluation Metrics
Evaluation is measured through computing the values for mean absolute error (MAE), root mean square error (RMSE), and coefficient of determination (R). These indices calculate the target values and assessment of the model performance. However, metrics are employed to evaluate the model accuracy and the equations where presents the actual (A) and for predicted (P). The predicted values of MAE are zero for the best model. The equations used in this study are Equations (11)–(14):
Calculating the differences between the actual and the predicted number of COVID-19 cases, RMSE is denoted as
To exhibit the variance among dependent and independent parameters, R is defined as
MAPE computes the range of error in terms of percentage
3. Results and Discussion
In this part, the simulation and results are commenced in detail. However, in the suggested approach, the numbers of COVID-19 total and daily infected cases, total and daily death cases, and total and daily recovered cases in Algeria are predicted by employing the TDGRU model.
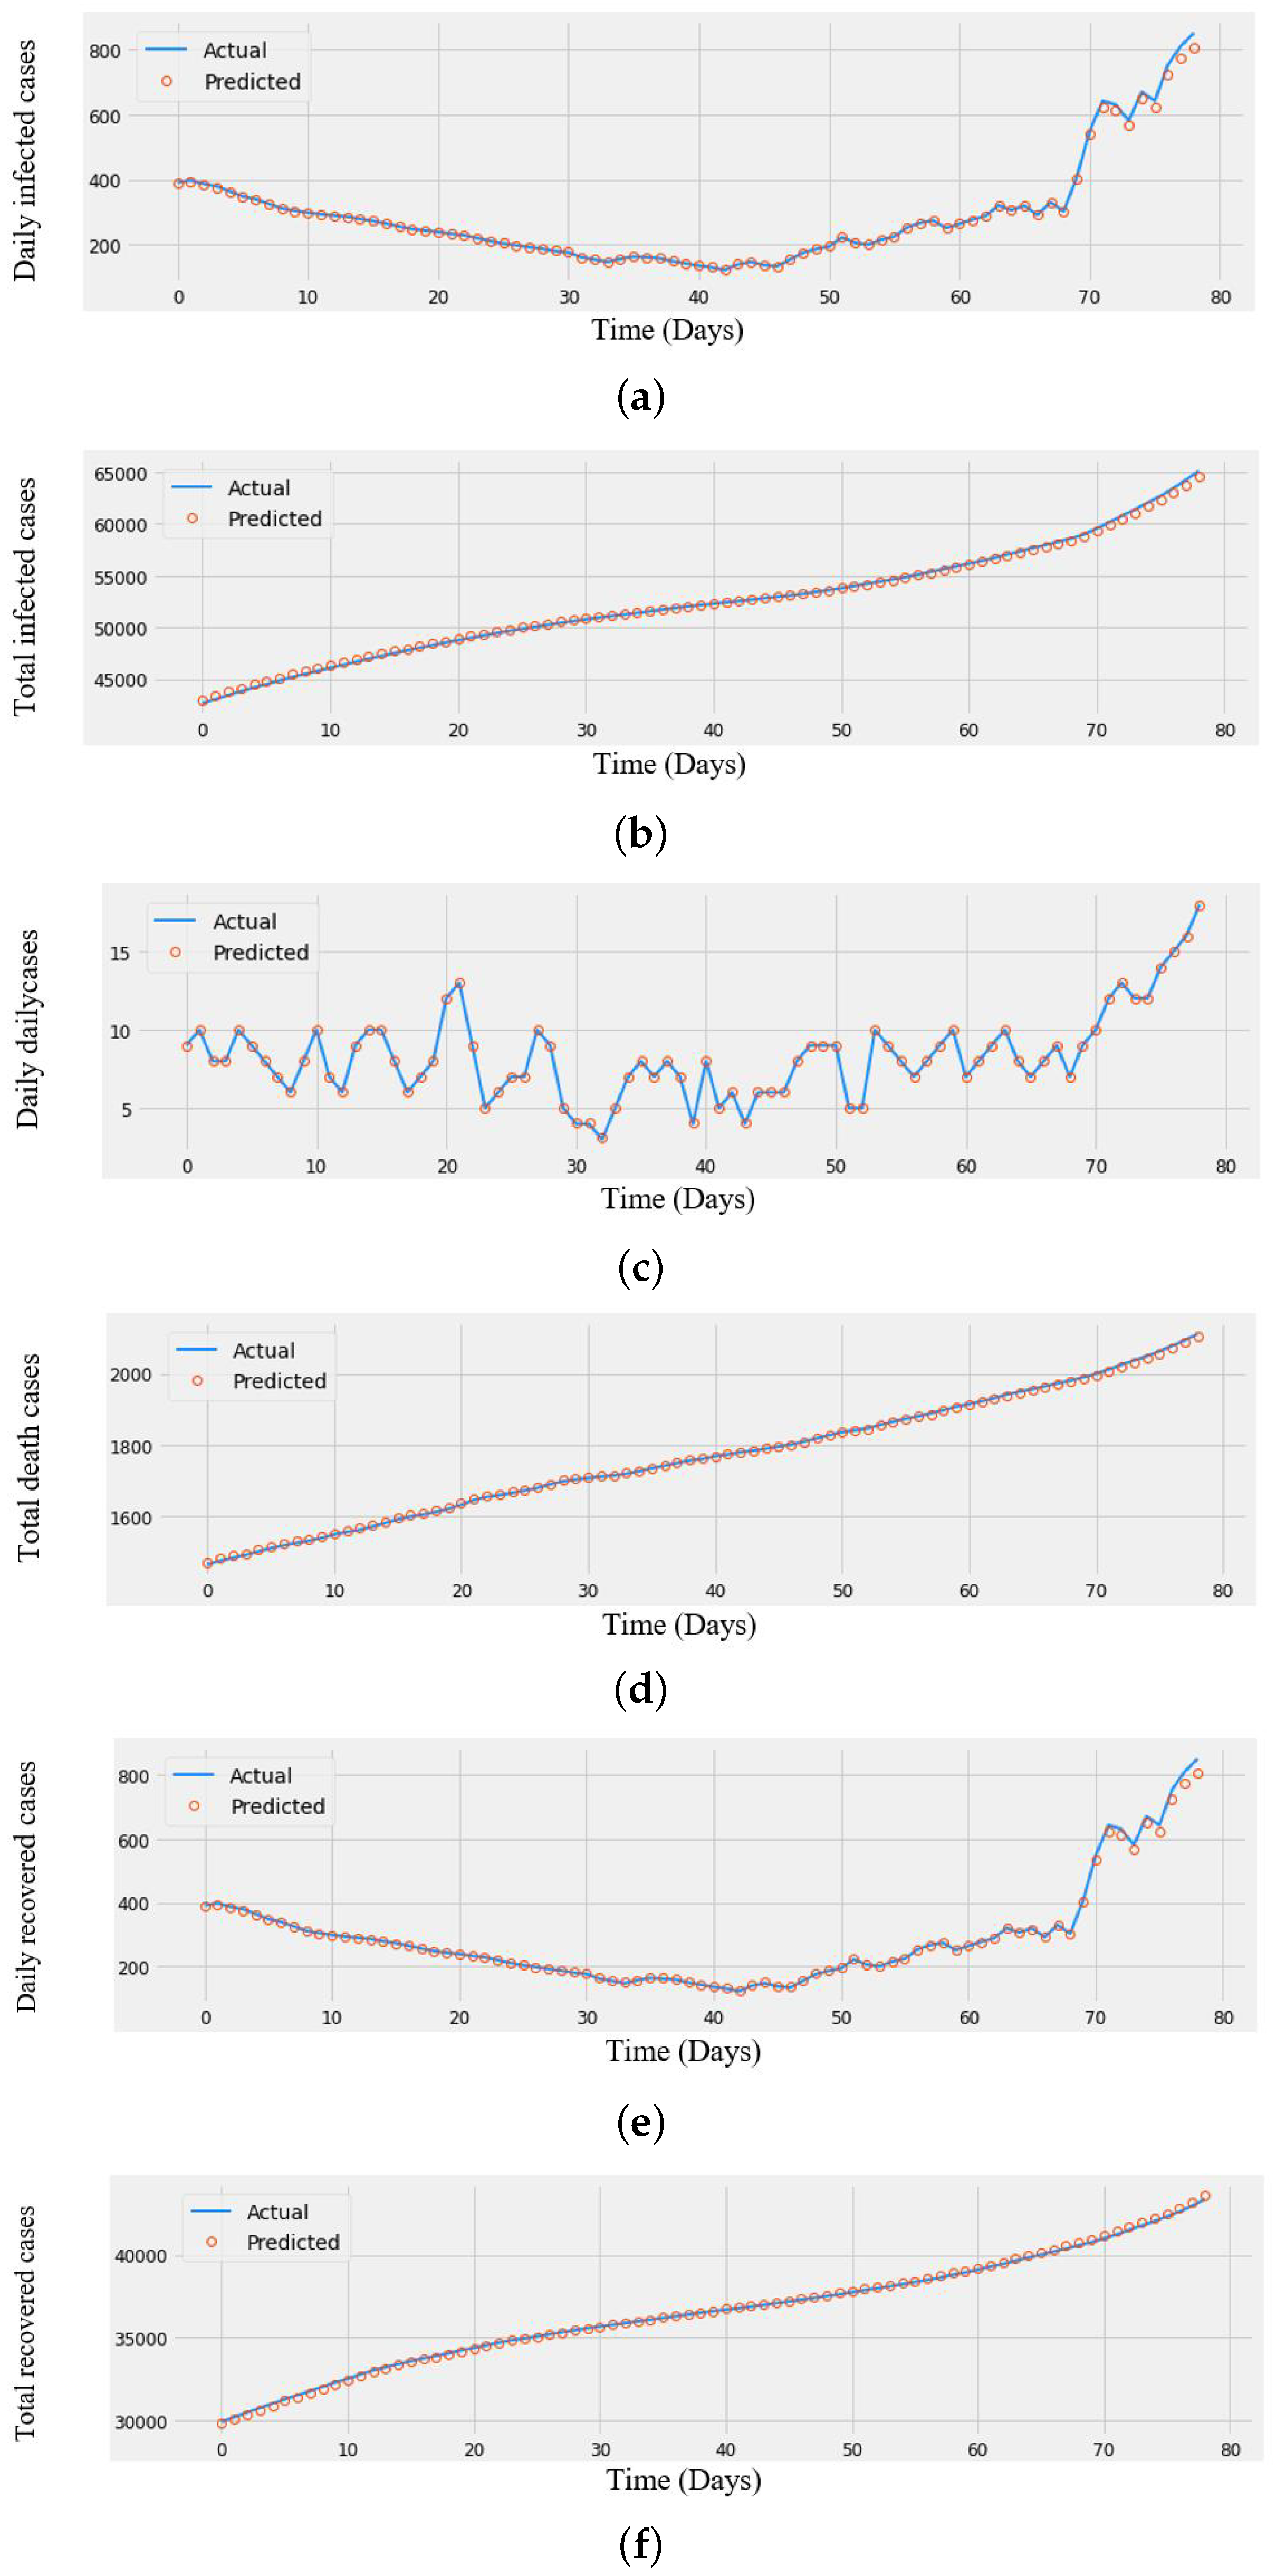
The model is trained to make predictions for the next two months to produce the prediction from data that were collected from the Algerian website (https://ourworldindata.org/coronavirus/country/algeria (accessed on 4 January 2023)). To evaluate the performance of the proposed technique, TDGRU, two cases are used: TDGRU-I represents the first two phases of COVID-19 data (i.e., 25 February 2020–12 November 2020) and TDGRU-II corresponds to the all phases of COVID-19 data (i.e., 25 February 2020–13 April 2022). The actual and predicted numbers of COVID-19 total and daily infected, death, and recovered cases of TDGRU-I are plotted in Figure 6a–f.
It can be perceived that the predicted cases are a good match with the actual cases, which signify a better impact of the TDGRU-I model. Experimental results verify the dominance of the proposed model in terms of MAE, RMSE, R, MAPE metrics along with comparing three other distinct benchmark techniques. Table 2 demonstrates the future prediction results concerning all error measures of all models for the COVID-19 Algerian dataset for daily and total infected, death, and recovered cases. It can be noticed that TDGRU outperforms on all models, as enumerated in Table 2, which shows 21.15 low MAE value for total infected cases, 0.33 for total death cases, and 8.24 for total recovered cases, and RMSE values for total infected cases of 24.51, 0.41 for total death cases, and 8.24 for total recovered cases.
The R has shown the highest values for total infected, death, and recovered cases at 0.92, 0.99, and 0.99, respectively. Another performance measure, MAPE, represents the best values of 0.176, 0.053, and 0.244 for total infected, deaths, and recovered cases, correspondingly.
It can be noticed from Table 2 that all the error measures for daily infected, death, and recovered cases have the lowest values among other techniques. The model’s performance depends upon the higher value of the coefficient of determination and the lower value of the MAE and RMSE. Furthermore, LSTM can be found to have better performance in all cases than ARIMA and LR among the comparison models.
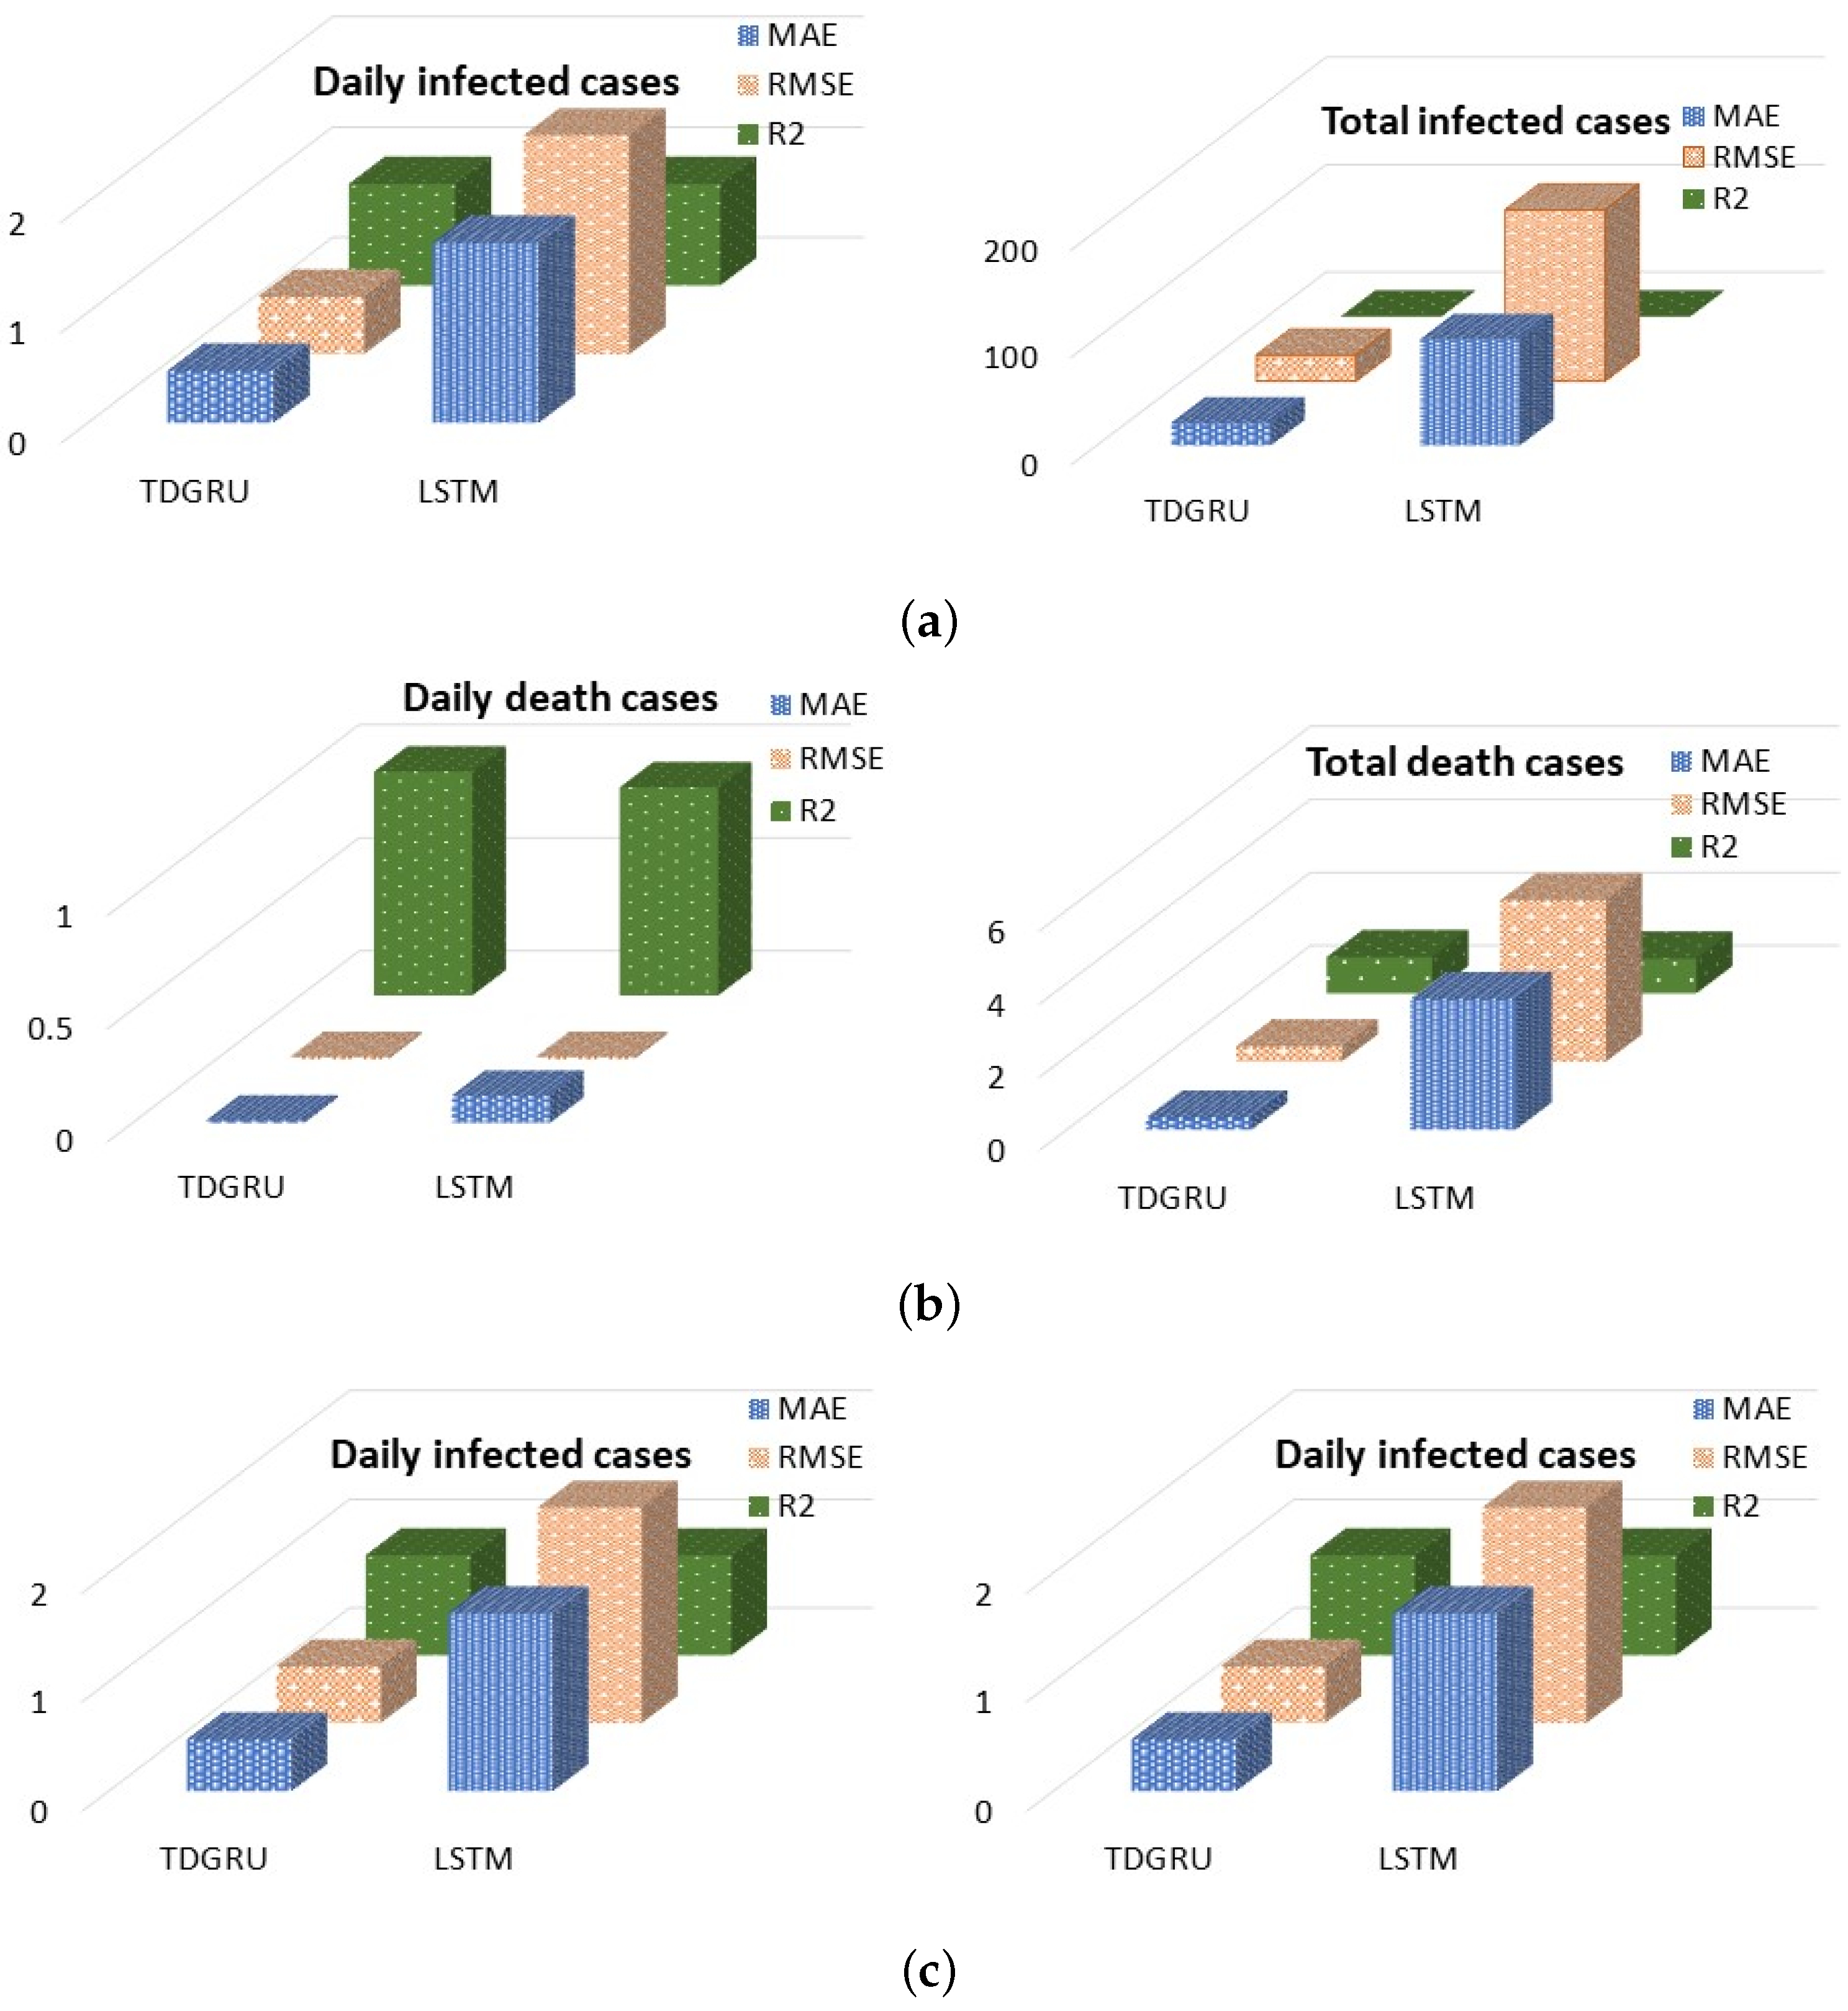
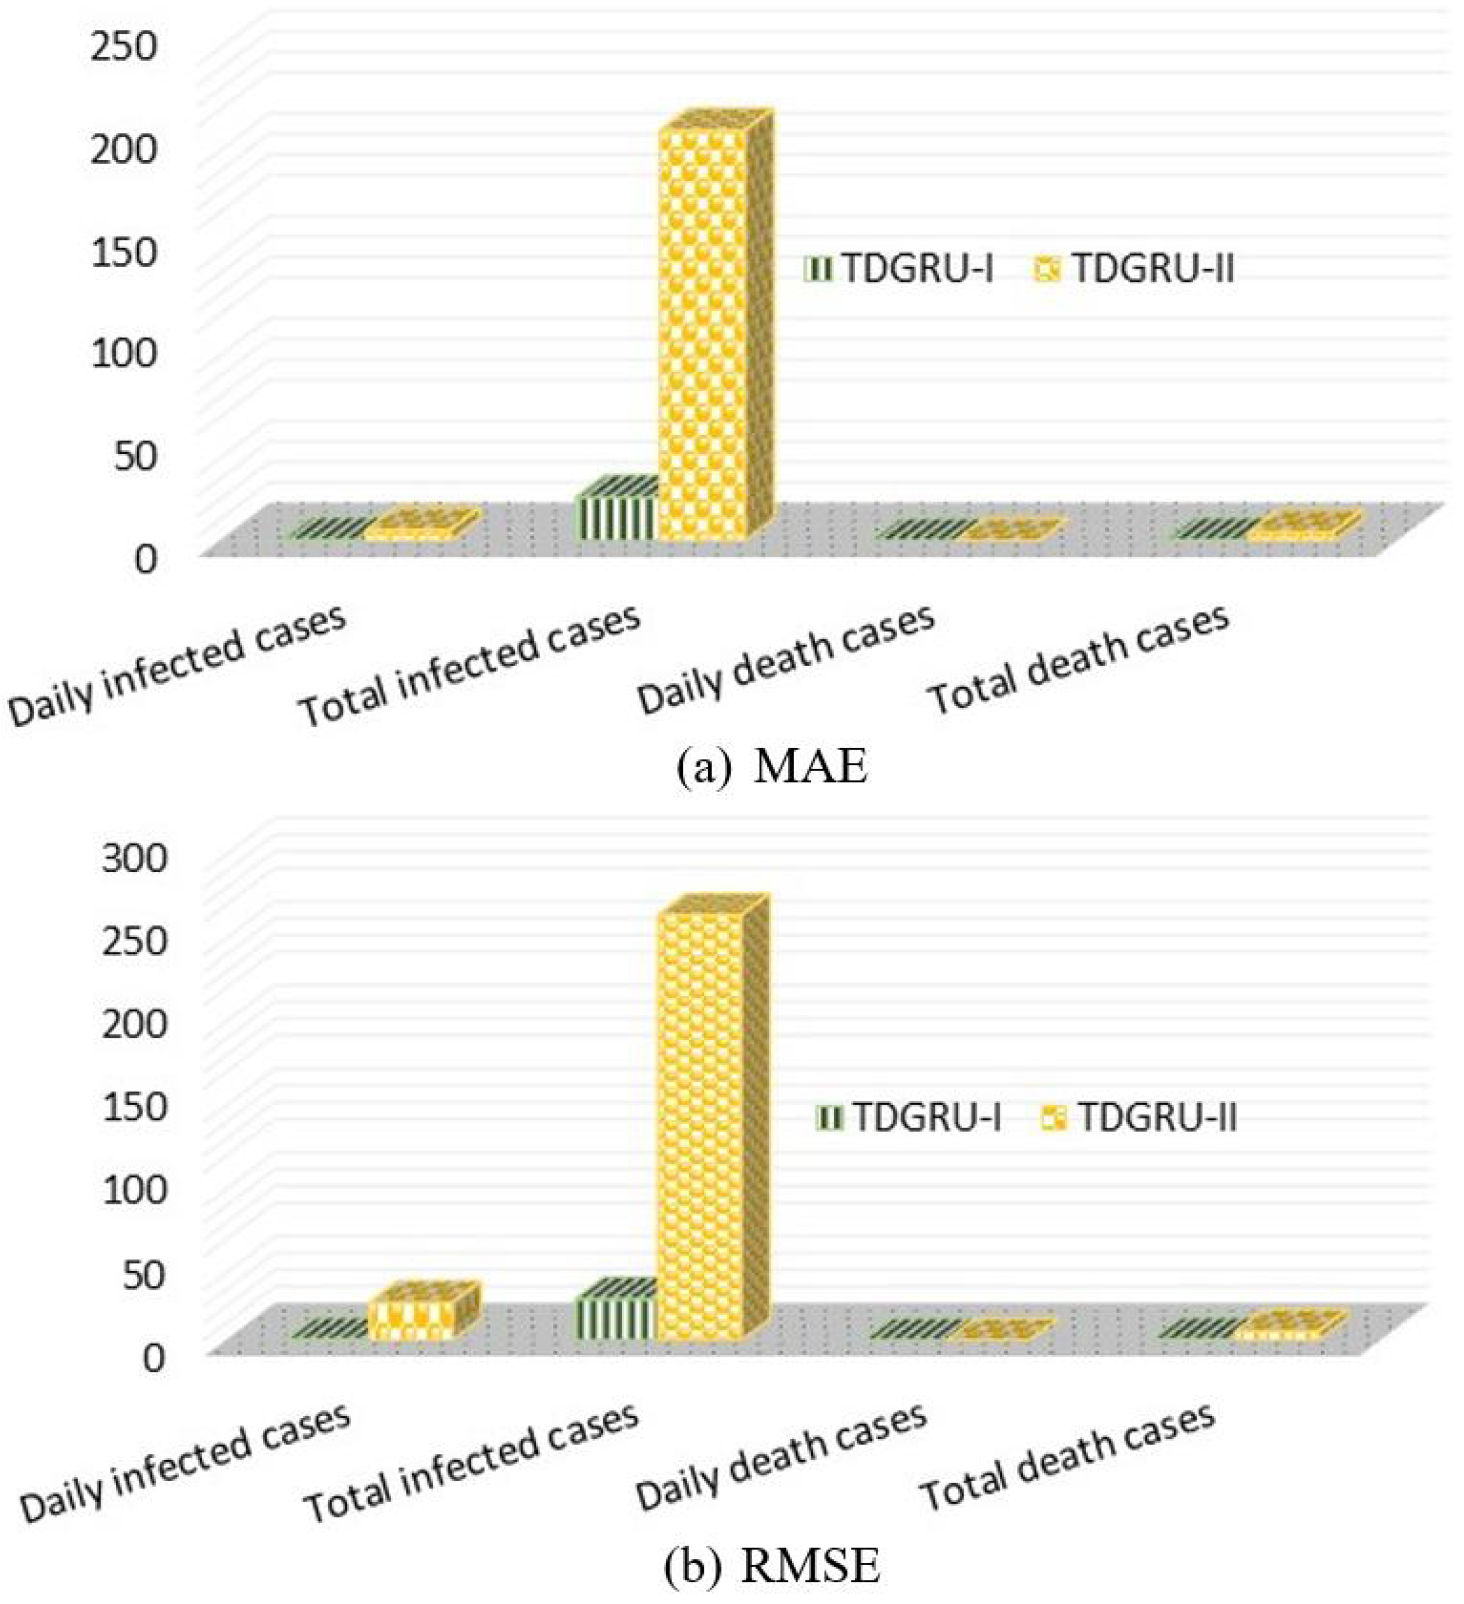
It can be examined from these illustrations that LSTM gives 98.83 MAE for total infected and 3.57 MAE for total death, and 14.9 MAE for total recovered cases. Additionally, the computed RMSE errors for daily infected, death, and recovered are 1.98, 0.01, and 0.38, respectively. R shows better values of 0.99 approximately and the best values for MAPE. Subsequently, a comparison analysis between the TDGRU-I model and the LSTM in three error indices is demonstrated as bar charts in Figure 7a–c. This figure shows that LSTM gives the lowest values of MAE, RMSE, and R for the daily and total infected, death, and recovered cases of the Algerian COVID-19 dataset. The experimental results state that the TDGRU model recommended in this work attained in all cases the best performance compared with the LSTM model; hence, parameter selection for both DL models is the same. To further evaluate the efficacy of the proposed model, it is implemented on the second case, TDGRU-II, for the whole dataset, and the result is given in Table 3. It can be observed that the proposed model performed very well on both suggested cases of datasets among all the approaches; Figure 8 demonstrates the comparison analysis of both cases in terms of all error measures and finds that the TDGRU-I model has the best performance over others.
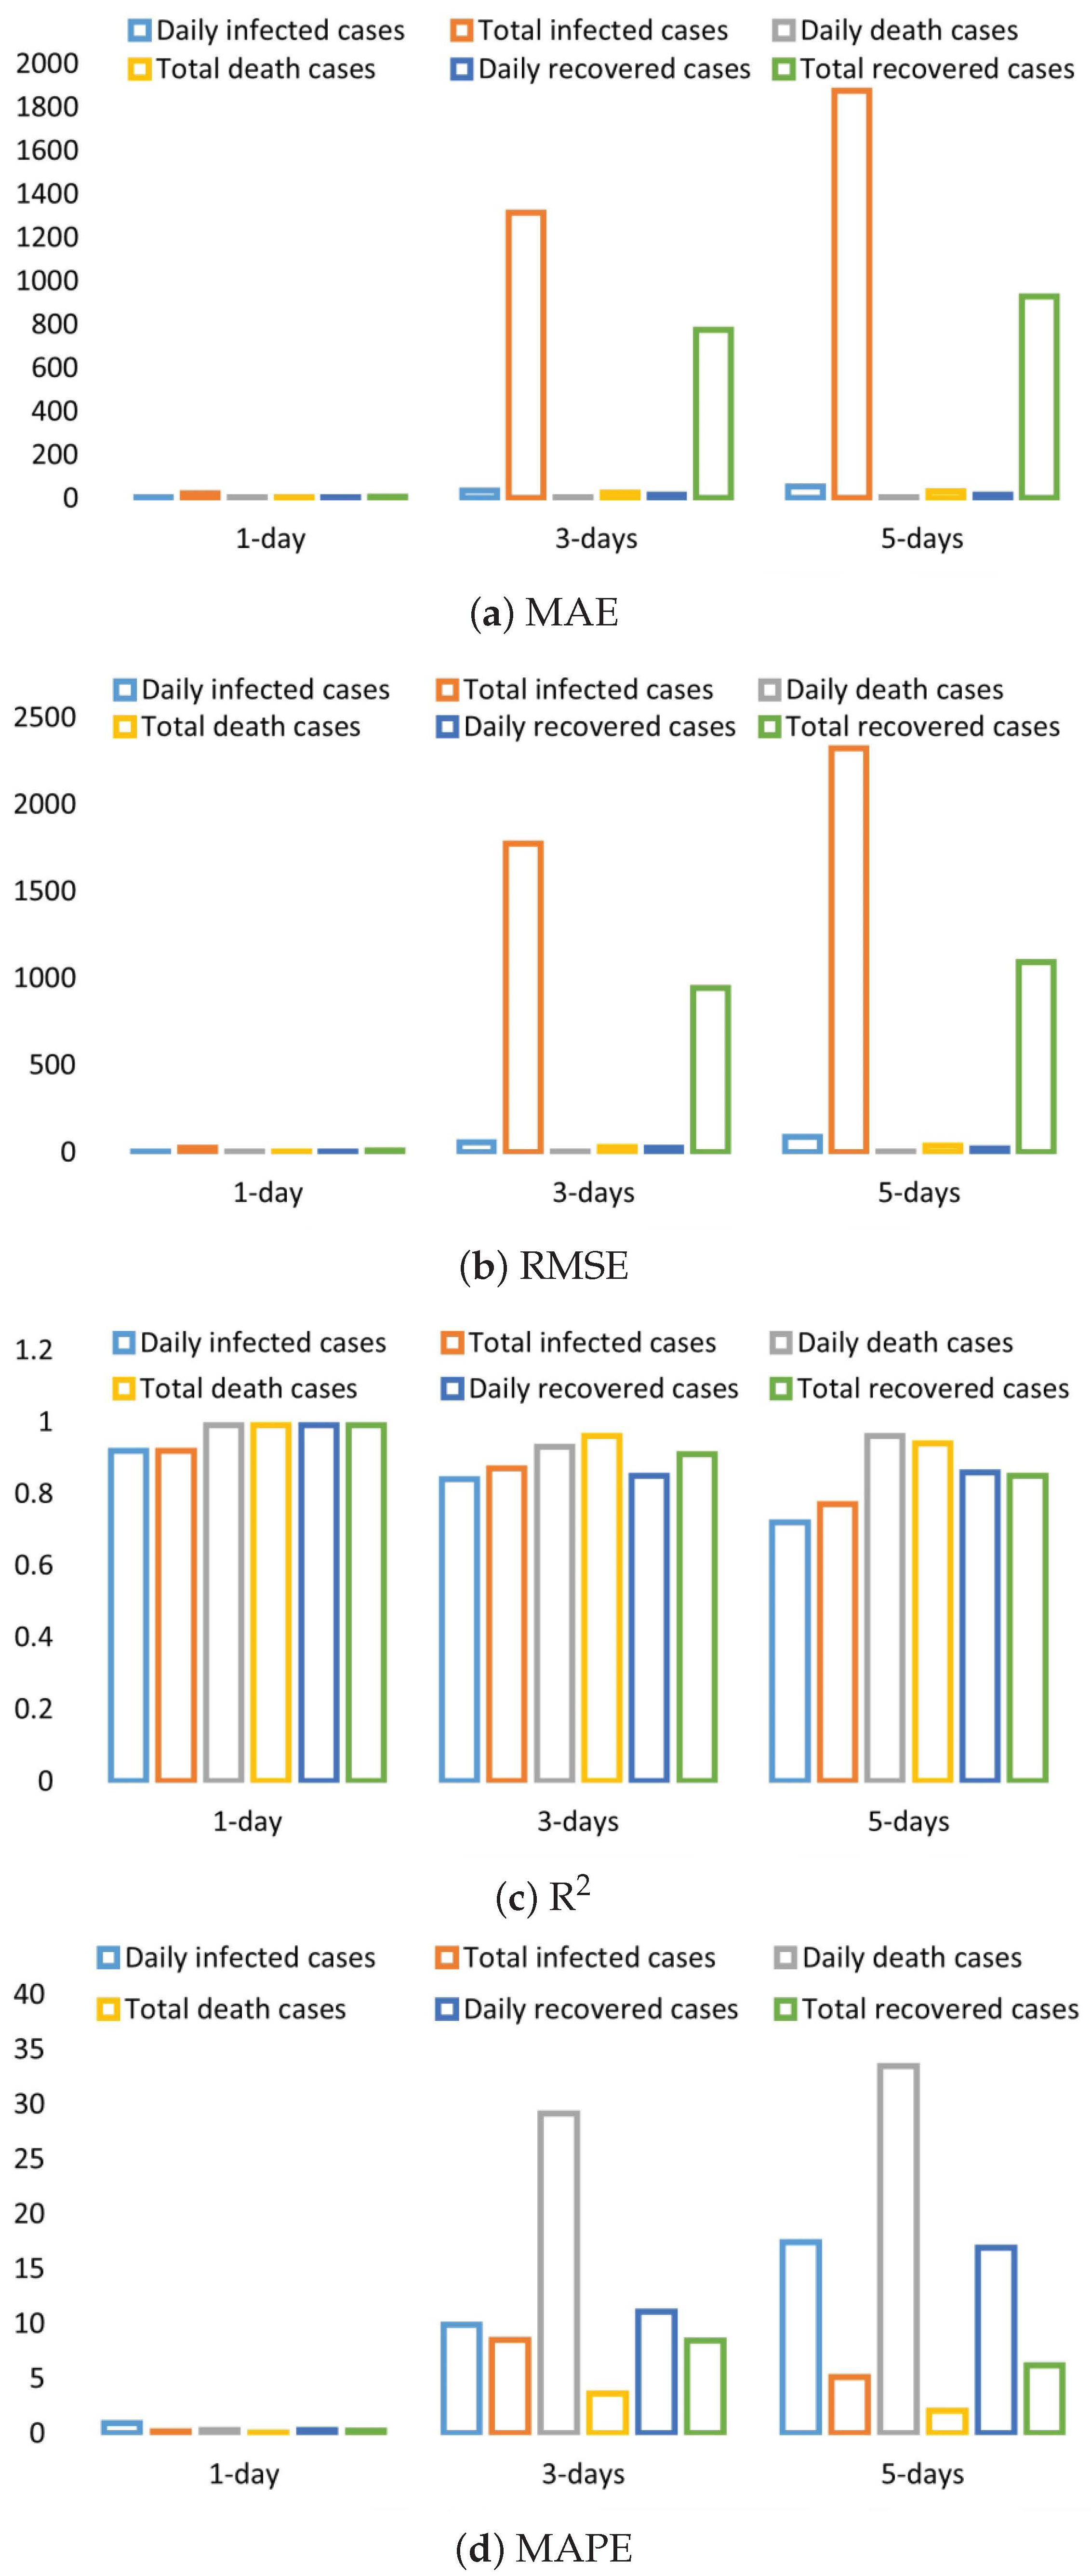
For multi-day-ahead predictions, Table 4 demonstrates the prediction interval of multiple days termed as 1-day, 3-day, and 5-day prediction results of the TDGRU-I model for all cases of the Algerian dataset. On each prediction interval, the performance shows more variation than single-day prediction. Similarly, 1-day-ahead prediction has similar performance values for all cases, where MAE and RMSE range from 0.13 to 0.52, and R ranges from 0.92 to 0.99 for daily infected, death, and recovered cases, while for MAPE, the range is 0.053 to 33.5. On 3-day-ahead (three days ahead) predictions, the range of error metrics is different in the cases of daily and total infected, death, and recovered: from 2.17 to 55.30 for MAE; 25.65 to 1050.5 for RMSE; and 0.85 to 0.97 for R. On 5-day-ahead (five days ahead) predictions, features of daily death and recovered cases outperform over 3-day-ahead TDGRU with 2.01, 2.48, 15.39, and 21.29 for MAE and RMSE, respectively.
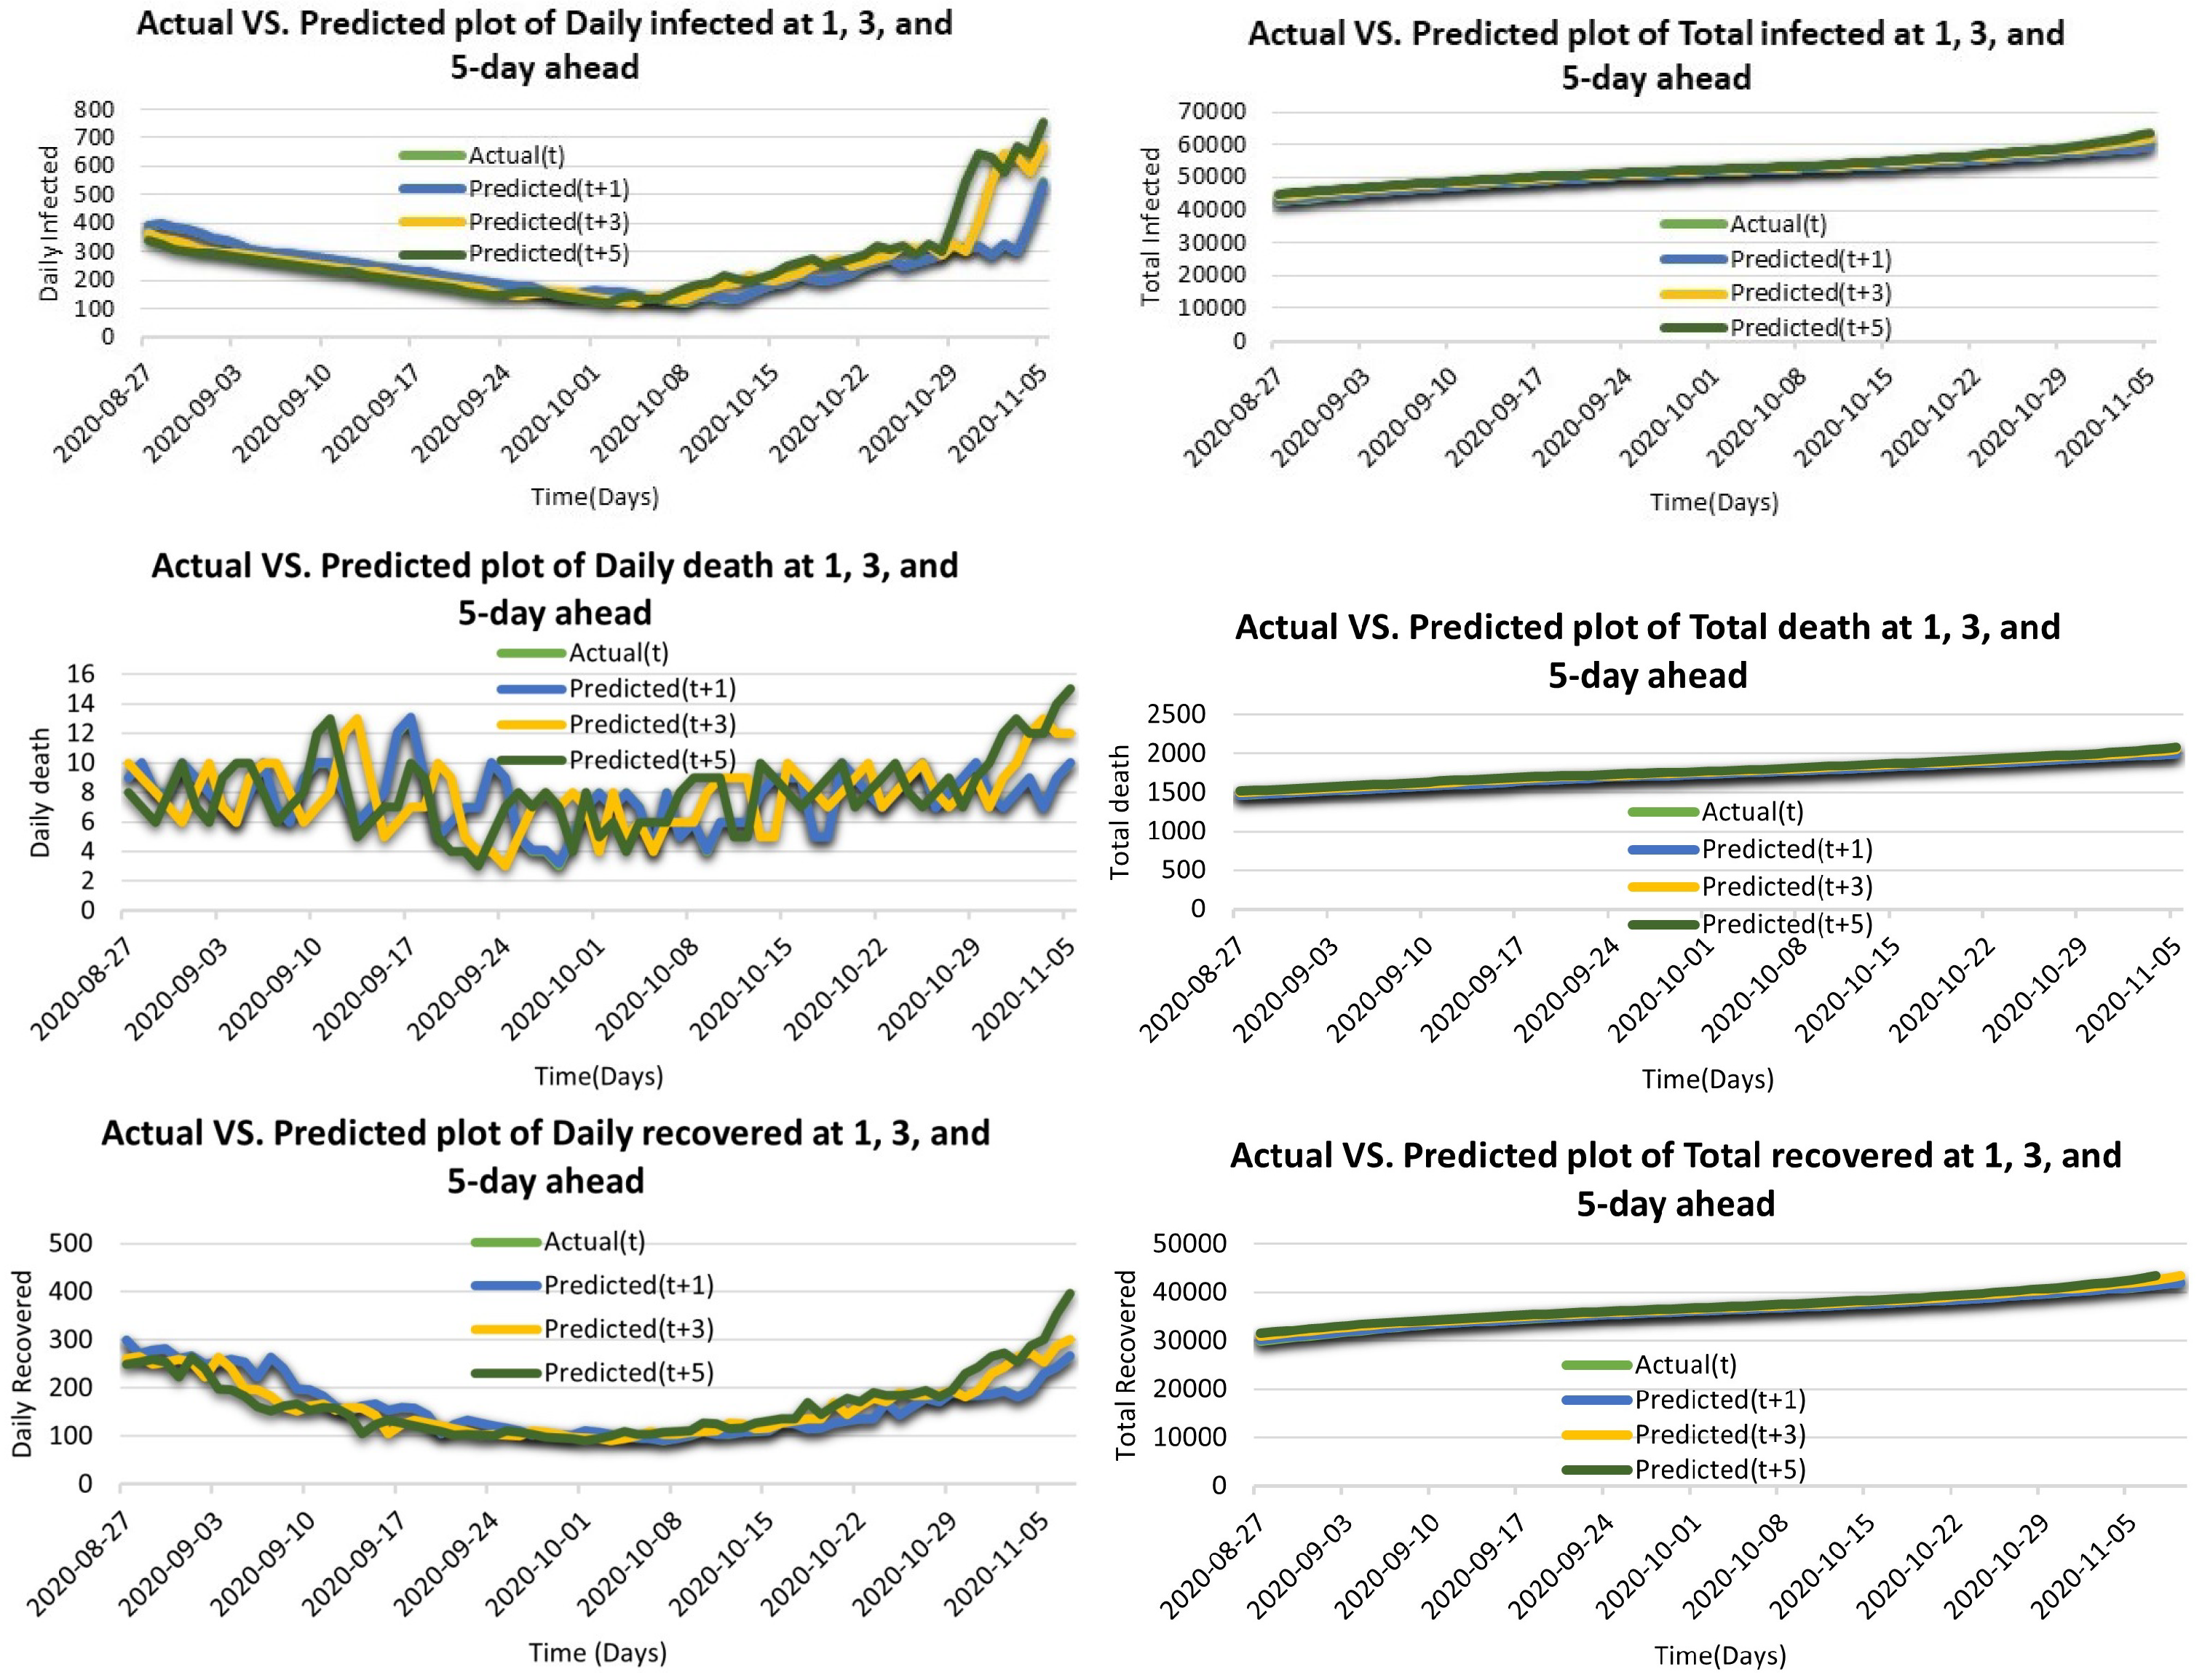
The TDGRU model has a noticeable improvement for 1-day-ahead prediction in the error measures of MAE, RMSE, R, and MAPE as compared to 3- and 5-day-ahead predictions. Furthermore, to explore the relationship between prediction performance concerning all categories of features, Figure 9 shows the prediction analysis in terms of the 1-, 3-, 5-day-ahead predictions of TDGRU-I model. It can be observed that the performance of all cases leads to the moderately same level. Therefore, the performance on the 1-day GRU model (blue curve) is the most fitted to the actual curve (green). On the other hand, prediction (t + 3) represents the prediction at 3 days ahead. Its curve (yellow) is far from the actual (t). Therefore, the third prediction (t + 5) becomes worse than the other at two days ahead.
For further performance evaluation of the proposed model with the ability of multi-day-ahead prediction, Figure 10 depicts the 1-, 3-, and 5-day-ahead performance results of the TDGRU-I model based on MAE, RMSE, R, and MAPE, separately. Hence, it can be examined from the first part of Figure 10 with the lowest MAE value of the 1-day TDGRU model as compared to others. Additionally, the predictions of the daily death, recovery, and total death at 3 and 5 days ahead are similar. Otherwise, the 3-day TDGRU model results are better than the 5-day TDGRU for total infected and recovered cases. Therefore, the results reconfirm the superiority of the proposed model. To verify the dominance of the TDGRU model, this work creates three other distinct benchmark techniques for comparison. Table 2 illustrates the future prediction results concerning all error measures of all models for the COVID-19 Algerian dataset of daily and total infected, death, and recovered cases. It can be noticed that TDGRU outperforms all models, as enumerated in Table 2, which shows 21.15 low MAE value for total infected cases, 0.33 for total death cases, and 8.24 for total recovered cases, while the RMSE value for the total infected cases is 24.51, and 0.41 for total death cases.
The R is shown the high values for total infected, death, and recovered cases at 0.92, 0.99, and 0.99, respectively, and the best values of MAPE are demonstrated in Figure 10.
The experimental results state that the TDGRU model recommended in this work attained the best performance in all cases compared with the LSTM model. The TDGRU model has a noticeable improvement for 1 day in the error measures of MAE, RMSE, R and MAPE as compared to 3- and 5-day-ahead predictions. Both TDGRU models are able to preserve significant properties through many gates, which ensures that important special qualities are not lost during long-term transmission. This can be seen from the fact that both of these may be observed. TDGRU has a more straightforward organizational structure. TDGRU can save a large amount of time without sacrificing performance because it has one fewer gate than LSTM, which minimizes the amount of matrix multiplication that needs to be performed.
In addition, in order to evaluate and contrast the effectiveness of the suggested model in both scenarios, the paired sample t-test is a statistical method that compares two means scores that come from the same group. The pair samples t-test is utilized in situations in which the variables being tested are independent, there are two levels, and each level is comprised of repeated measures. Table 5 presents a graphical representation of the ratio of these two correlation statistics of the 1-day-ahead prediction for daily infected cases of the TDGRU and LSTM models with respect to MAE based on twenty separate executions. We use the testing sample in a paired t-test for this purpose (TDGRU-I). By applying the sample t-test to the outcomes of two independent evaluations carried out on the records of the test set of data, we can calculate a 95 percent confidence interval for the difference in mean scores between the two models after numerous rounds of refinement. In Table 5, we see that the MAE values for the TDGRU model (M = 3.351, SD = 0.697) are significantly higher than those for the LSTM model (M = 9.957, SD = 1.993). Table 5 displays the r-squared value, at the 0.000 level of significance, between the two distinct groups of model evaluations to demonstrate how they are distinct from one another. According to the data presented in Table 5, the confidence interval for that difference has a lower bound of and an upper bound of as its upper and lower bounds, respectively. The outcomes of the sample t-test seem to be , p = 0.00 respectively. Because the two-tailed test’s importance threshold is less then 0.05, it may be deduced that the differences between the assessment sets do, in fact, constitute differences that are statistically significant. Additionally, the relevance of our suggested model, the TDGRU model, is demonstrated by the lack of connection between the data points of the TDGRU-I and LSTM models.
4. Discussion
Several factors influence COVID-19 infection, resulting in stochastic and nonlinear behavior. Many times, traditional machine learning algorithms are unable to accurately predict process parameters with several affecting variables. Forecasts can be improved by employing more complex models. In contrast to conventional methods of forecasting, such as LR, ARIMA, and standard LSTM, the proposed TDGRU technique is more computationally efficient and significantly more accurate for 1-day-ahead corona case predictions but becomes progressively less accurate for 3- and 5-day-ahead corona case predictions. Each model’s error rates increase as the amount of foresight days grows. It is likely due to prediction errors accumulating within the framework of iterative forecasting. The experimental results in Figure 10 demonstrate that a forecast made more days in advance has a larger inaccuracy rate. The purpose of TDGRU is for multi-day forecasting and prediction tasks that require one, three, or five output neurons to complete. TDGRU has more consistent gradients compared to the LSTM, and the backpropagation method is easier to train, reducing the effects of multiple gates. Previous research has shown that the TDGRU is frequently the best predictor compared to the literature. Those studies, however, were limited to univariate data. The current study focused on the univariate time series prediction model. However, this is only for a small dataset and a forecast with 5-day-ahead. So, the author’s main idea is to use the neural networks and use different comparisons with up-to-date algorithms. The author will consider a SIR- and SEIR-based study as future work. In addition, the proposed model can be useful for predicting multi-day-ahead forecast from multivariate time series data.
5. Conclusions
In this work, the TDGRU model is employed to predict the number of daily and total infected cases, death cases, and recovered cases in Algeria for forecasting the short-term incidence and severity of COVID-19. The model is evaluated in terms of performance metrics of MAE, RMSE, R and MAPE with actual numbers and comparison with the other three benchmark models. The results comprise incidence, mortality, and survival rates with 1-day, 3-day, and 5-day predictions. The findings suggest that the spread continued to rise by the end of December 2022, and certain containment measures need to be strengthened to help political and health experts effectively organize and provide resources, with personnel protection and medical establishments. At that time, the progression of the epidemic poses the greatest threat to the global economy, and the speed of economic recovery now depends on the speed with which the pandemic can be stopped worldwide. In the current state of affairs, special COVID-19 drugs have yet to be developed successfully. It is critical to launching a coordinated response to the epidemic. China will undoubtedly greatly assist in the global fight against the epidemic.
Author Contributions
Conceptualization, A.A. and F.S.; carried out the implementation, A.A. and F.S.; writing—review and editing, F.S.; funding acquisition, A.A. All authors have read and agreed to the published version of the manuscript.
Funding
This work is supported by the Policy Research Incentive Program 2022, the Office of Research and the Institute for Social and Economic Research (ISER), Zayed University, Abu Dhabi, UAE.
Data Availability Statement
The data are available from the authors upon request.
Conflicts of Interest
The authors declare no conflict of interest.
References
- Papastefanopoulos, V.; Linardatos, P.; Kotsiantis, S. COVID-19: A comparison of time series methods to forecast percentage of active cases per population. Appl. Sci. 2020, 10, 3880. [Google Scholar] [CrossRef]
- Killeen, B.D.; Wu, J.Y.; Shah, K.; Zapaishchykova, A.; Nikutta, P.; Tamhane, A.; Chakraborty, S.; Wei, J.; Gao, T.; Thies, M.; et al. A county-level dataset for informing the United States’ response to COVID-19. arXiv 2020, arXiv:2004.00756. [Google Scholar]
- Dey, S.K.; Rahman, M.M.; Siddiqi, U.R.; Howlader, A. Analyzing the epidemiological outbreak of COVID-19: A visual exploratory data analysis approach. J. Med. Virol. 2020, 92, 632–638. [Google Scholar] [CrossRef]
- Arora, P.; Kumar, H.; Panigrahi, B.K. Prediction and analysis of COVID-19 positive cases using deep learning models: A descriptive case study of India. Chaos Solitons Fractals 2020, 139, 110017. [Google Scholar] [CrossRef] [PubMed]
- Al-smadi, A.M.; Abugabah, A.; Smadi, A.A. Evaluation of E-learning Experience in the Light of the Covid-19 in Higher Education. Procedia Comput. Sci. 2022, 201, 383–389. [Google Scholar] [CrossRef]
- Smadi, A.A.; Abugabah, A.; Al-smadi, A.M.; Almotairi, S. SEL-COVIDNET: An intelligent application for the diagnosis of COVID-19 from chest X-rays and CT-scans. Inform. Med. Unlocked 2022, 32, 101059. [Google Scholar] [CrossRef] [PubMed]
- Mehmood, A.; Abugabah, A.; Smadi, A.A.L.; Alkhawaldeh, R. An Intelligent Information System and Application for the Diagnosis and Analysis of COVID-19. In Proceedings of the Intelligent Computing & Optimization, Hua Hin, Thailand, 30–31 December 2021; Springer International Publishing: Cham, Switzerland, 2022; pp. 391–396. [Google Scholar]
- Tashtoush, Y.; Alrababah, B.; Darwish, O.; Maabreh, M.; Alsaedi, N. A Deep Learning Framework for Detection of COVID-19 Fake News on Social Media Platforms. Data 2022, 7, 65. [Google Scholar] [CrossRef]
- Karajeh, O.; Darweesh, D.; Darwish, O.; Abu-El-Rub, N.; Alsinglawi, B.; Alsaedi, N. A classifier to detect informational vs. non-informational heart attack tweets. Future Internet 2021, 13, 19. [Google Scholar] [CrossRef]
- Alsinglawi, B.; Alnajjar, F.; Mubin, O.; Novoa, M.; Karajeh, O.; Darwish, O. Benchmarking predictive models in electronic health records: Sepsis length of stay prediction. In Proceedings of the International Conference on Advanced Information Networking and Applications, Caserta, Italy, 15–17 April 2020; Springer: Berlin/Heidelberg, Germany, 2020; pp. 258–267. [Google Scholar]
- Cooper, I.; Mondal, A.; Antonopoulos, C.G. A SIR model assumption for the spread of COVID-19 in different communities. Chaos Solitons Fractals 2020, 139, 110057. [Google Scholar] [CrossRef]
- Carcione, J.M.; Santos, J.E.; Bagaini, C.; Ba, J. A simulation of a COVID-19 epidemic based on a deterministic SEIR model. Front. Public Health 2020, 8, 230. [Google Scholar] [CrossRef]
- Jeppsson, U.; Pons, M.N. The COST benchmark simulation model—current state and future perspective. Control Eng. Pract. 2004, 12, 299–304. [Google Scholar] [CrossRef]
- Khan, F.; Saeed, A.; Ali, S. Modelling and forecasting of new cases, deaths and recover cases of COVID-19 by using Vector Autoregressive model in Pakistan. Chaos Solitons Fractals 2020, 140, 110189. [Google Scholar] [CrossRef] [PubMed]
- Zeroual, A.; Harrou, F.; Dairi, A.; Sun, Y. Deep learning methods for forecasting COVID-19 time-Series data: A Comparative study. Chaos Solitons Fractals 2020, 140, 110121. [Google Scholar] [CrossRef] [PubMed]
- Gordeev, D.; Singer, P.; Michailidis, M.; Müller, M.; Ambati, S. Backtesting the predictability of COVID-19. arXiv 2020, arXiv:2007.11411. [Google Scholar]
- Takele, R. Stochastic modelling for predicting COVID-19 prevalence in East Africa Countries. Infect. Dis. Model. 2020, 5, 598–607. [Google Scholar] [CrossRef] [PubMed]
- Aslam, M. Using the kalman filter with Arima for the COVID-19 pandemic dataset of Pakistan. Data Brief 2020, 31, 105854. [Google Scholar] [CrossRef]
- Liu, Q.; Li, Z.; Ji, Y.; Martinez, L.; Zia, U.H.; Javaid, A.; Lu, W.; Wang, J. Forecasting the seasonality and trend of pulmonary tuberculosis in Jiangsu Province of China using advanced statistical time-series analyses. Infect. Drug Resist. 2019, 12, 2311. [Google Scholar] [CrossRef] [PubMed] [Green Version]
- He, Z.; Tao, H. Epidemiology and ARIMA model of positive-rate of influenza viruses among children in Wuhan, China: A nine-year retrospective study. Int. J. Infect. Dis. 2018, 74, 61–70. [Google Scholar] [CrossRef] [Green Version]
- Earnest, A.; Chen, M.I.; Ng, D.; Sin, L.Y. Using autoregressive integrated moving average (ARIMA) models to predict and monitor the number of beds occupied during a SARS outbreak in a tertiary hospital in Singapore. BMC Health Serv. Res. 2005, 5, 36. [Google Scholar] [CrossRef] [PubMed] [Green Version]
- Yu, H.K.; Kim, N.Y.; Kim, S.S.; Chu, C.; Kee, M.K. Forecasting the number of human immunodeficiency virus infections in the Korean population using the autoregressive integrated moving average model. Osong Public Health Res. Perspect. 2013, 4, 358–362. [Google Scholar] [CrossRef] [Green Version]
- Liu, Q.; Liu, X.; Jiang, B.; Yang, W. Forecasting incidence of hemorrhagic fever with renal syndrome in China using ARIMA model. BMC Infect. Dis. 2011, 11, 218. [Google Scholar] [CrossRef] [PubMed] [Green Version]
- Anne, W.R.; Jeeva, S.C. ARIMA modelling of predicting COVID-19 infections. medRxiv 2020. [Google Scholar] [CrossRef]
- Singh, R.; Rani, M.; Bhagavathula, A.; Sah, R.; Rodriguez-Morales, A.; Kalita, H.; Kumar, P. The Prediction of COVID-19 Pandemic for top-15 Affected Countries using advance ARIMA model. JMIR Public Health Surveill. 2020, 6, 1–10. [Google Scholar] [CrossRef] [PubMed]
- Elsheikh, A.H.; Saba, A.I.; Abd Elaziz, M.; Lu, S.; Shanmugan, S.; Muthuramalingam, T.; Kumar, R.; Mosleh, A.O.; Essa, F.; Shehabeldeen, T.A. Deep learning-based forecasting model for COVID-19 outbreak in Saudi Arabia. Process Saf. Environ. Prot. 2021, 149, 223–233. [Google Scholar] [CrossRef] [PubMed]
- Huang, C.J.; Chen, Y.H.; Ma, Y.; Kuo, P.H. Multiple-input deep convolutional neural network model for COVID-19 forecasting in china. medRxiv 2020. [Google Scholar] [CrossRef]
- Antink, C.H.; Ferreira, J.C.M.; Paul, M.; Lyra, S.; Heimann, K.; Karthik, S.; Joseph, J.; Jayaraman, K.; Orlikowsky, T.; Sivaprakasam, M.; et al. Fast body part segmentation and tracking of neonatal video data using deep learning. Med. Biol. Eng. Comput. 2020, 58, 3049–3061. [Google Scholar] [CrossRef]
- Zadeh Shirazi, A.; Fornaciari, E.; Bagherian, N.S.; Ebert, L.M.; Koszyca, B.; Gomez, G.A. DeepSurvNet: Deep survival convolutional network for brain cancer survival rate classification based on histopathological images. Med. Biol. Eng. Comput. 2020, 58, 1031–1045. [Google Scholar] [CrossRef] [Green Version]
- Hao, Y.; Xu, T.; Hu, H.; Wang, P.; Bai, Y. Prediction and analysis of corona virus disease 2019. PLoS ONE 2020, 15, e0239960. [Google Scholar] [CrossRef] [PubMed]
- Syeda, H.B.; Syed, M.; Sexton, K.W.; Syed, S.; Begum, S.; Syed, F.; Prior, F.; Yu, F., Jr. Role of machine learning techniques to tackle the COVID-19 crisis: Systematic review. JMIR Med. Inform. 2021, 9, e23811. [Google Scholar] [CrossRef]
- Sherstinsky, A. Fundamentals of recurrent neural network (RNN) and long short-term memory (LSTM) network. Phys. D Nonlinear Phenom. 2020, 404, 132306. [Google Scholar] [CrossRef] [Green Version]
- Malhotra, P.; Vig, L.; Shroff, G.; Agarwal, P. Long short term memory networks for anomaly detection in time series. In Proceedings of the 23rd European Symposium on Artificial Neural Networks, Computational Intelligence and Machine Learning, ESANN 2015, Bruges, Belgium, 22–24 April 2015; Volume 89, pp. 89–94. [Google Scholar]
- Shuja, J.; Alanazi, E.; Alasmary, W.; Alashaikh, A. COVID-19 open source data sets: A comprehensive survey. Appl. Intell. 2021, 51, 1296–1325. [Google Scholar] [CrossRef] [PubMed]
- Singh, K.; Shastri, S.; Bhadwal, A.S.; Kour, P.; Kumari, M.; Sharma, A.; Mansotra, V. Implementation of exponential smoothing for forecasting time series data. Int. J. Sci. Res. Comput. Sci. Appl. Manag. Stud. 2019, 8, 1–8. [Google Scholar]
- Evgeniou, T.; Pontil, M. Support vector machines: Theory and applications. In Advanced Course on Artificial Intelligence; Springer: Berlin/Heidelberg, Germany, 1999; pp. 249–257. [Google Scholar]
- Girin, L.; Leglaive, S.; Bie, X.; Diard, J.; Hueber, T.; Alameda-Pineda, X. Dynamical variational autoencoders: A comprehensive review. arXiv 2020, arXiv:2008.12595. [Google Scholar]
- Fang, W.; Guo, Y.; Liao, W.; Huang, S.; Yang, N.; Liu, J. A Parallel Gated Recurrent Units (P-GRUs) network for the shifting lateness bottleneck prediction in make-to-order production system. Comput. Ind. Eng. 2020, 140, 106246. [Google Scholar] [CrossRef]
- Ahmad, A.; Garhwal, S.; Ray, S.K.; Kumar, G.; Malebary, S.J.; Barukab, O.M. The number of confirmed cases of COVID-19 by using machine learning: Methods and challenges. Arch. Comput. Methods Eng. 2021, 28, 2645–2653. [Google Scholar] [CrossRef] [PubMed]
- Fu, Y.; Li, Y.; Guo, E.; He, L.; Liu, J.; Yang, B.; Li, F.; Wang, Z.; Li, Y.; Xiao, R.; et al. Dynamics and correlation among viral positivity, seroconversion, and disease severity in COVID-19: A retrospective study. Ann. Intern. Med. 2021, 174, 453–461. [Google Scholar] [CrossRef] [PubMed]
- Alakus, T.B.; Turkoglu, I. Comparison of deep learning approaches to predict COVID-19 infection. Chaos Solitons Fractals 2020, 140, 110120. [Google Scholar] [CrossRef] [PubMed]
- Chimmula, V.K.R.; Zhang, L. Time series forecasting of COVID-19 transmission in Canada using LSTM networks. Chaos Solitons Fractals 2020, 135, 109864. [Google Scholar] [CrossRef]
- Bedi, P.; Dhiman, S.; Gole, P.; Gupta, N.; Jindal, V. Prediction of COVID-19 trend in India and its four worst-affected states using modified SEIRD and LSTM models. SN Comput. Sci. 2021, 2, 1–24. [Google Scholar] [CrossRef]
- Liu, F.; Wang, J.; Liu, J.; Li, Y.; Liu, D.; Tong, J.; Li, Z.; Yu, D.; Fan, Y.; Bi, X.; et al. Predicting and analyzing the COVID-19 epidemic in China: Based on SEIRD, LSTM and GWR models. PLoS ONE 2020, 15, e0238280. [Google Scholar] [CrossRef]
- Kırbaş, İ.; Sözen, A.; Tuncer, A.D.; Kazancıoğlu, F.Ş. Comparative analysis and forecasting of COVID-19 cases in various European countries with ARIMA, NARNN and LSTM approaches. Chaos Solitons Fractals 2020, 138, 110015. [Google Scholar] [CrossRef]
- Shahid, F.; Zameer, A.; Muneeb, M. Predictions for COVID-19 with deep learning models of LSTM, GRU and Bi-LSTM. Chaos Solitons Fractals 2020, 140, 110212. [Google Scholar] [CrossRef]
- Ibrahim, M.R.; Haworth, J.; Lipani, A.; Aslam, N.; Cheng, T.; Christie, N. Variational-LSTM autoencoder to forecast the spread of coronavirus across the globe. PLoS ONE 2021, 16, e0246120. [Google Scholar] [CrossRef]
- Azarafza, M.; Azarafza, M.; Tanha, J. COVID-19 infection forecasting based on deep learning in Iran. medRxiv 2020. [Google Scholar] [CrossRef]
- Ribeiro, M.H.D.M.; da Silva, R.G.; Mariani, V.C.; dos Santos Coelho, L. Short-term forecasting COVID-19 cumulative confirmed cases: Perspectives for Brazil. Chaos Solitons Fractals 2020, 135, 109853. [Google Scholar] [CrossRef]
- Chatterjee, A.; Gerdes, M.W.; Martinez, S.G. Statistical explorations and univariate timeseries analysis on COVID-19 datasets to understand the trend of disease spreading and death. Sensors 2020, 20, 3089. [Google Scholar] [CrossRef] [PubMed]
- Shastri, S.; Singh, K.; Kumar, S.; Kour, P.; Mansotra, V. Time series forecasting of Covid-19 using deep learning models: India-USA comparative case study. Chaos Solitons Fractals 2020, 140, 110227. [Google Scholar] [CrossRef] [PubMed]
- Fu, R.; Zhang, Z.; Li, L. Using LSTM and GRU neural network methods for traffic flow prediction. In Proceedings of the 2016 31st Youth Academic Annual Conference of Chinese Association of Automation (YAC), Wuhan, China, 11–13 November 2016; pp. 324–328. [Google Scholar]
- Hochreiter, S.; Schmidhuber, J. LSTM can solve hard long time lag problems. In Advances in Neural Information Processing Systems 9; MIT Press: Cambridge, MA, USA, 1996. [Google Scholar]
- Graves, A.; Jaitly, N.; Mohamed, A. Hybrid speech recognition with Deep Bidirectional LSTM. In Proceedings of the 2013 IEEE Workshop on Automatic Speech Recognition and Understanding, Olomouc, Czech Republic, 8–12 December 2013; pp. 273–278. [Google Scholar] [CrossRef]
- Ediger, V.Ş.; Akar, S. ARIMA forecasting of primary energy demand by fuel in Turkey. Energy Policy 2007, 35, 1701–1708. [Google Scholar] [CrossRef]
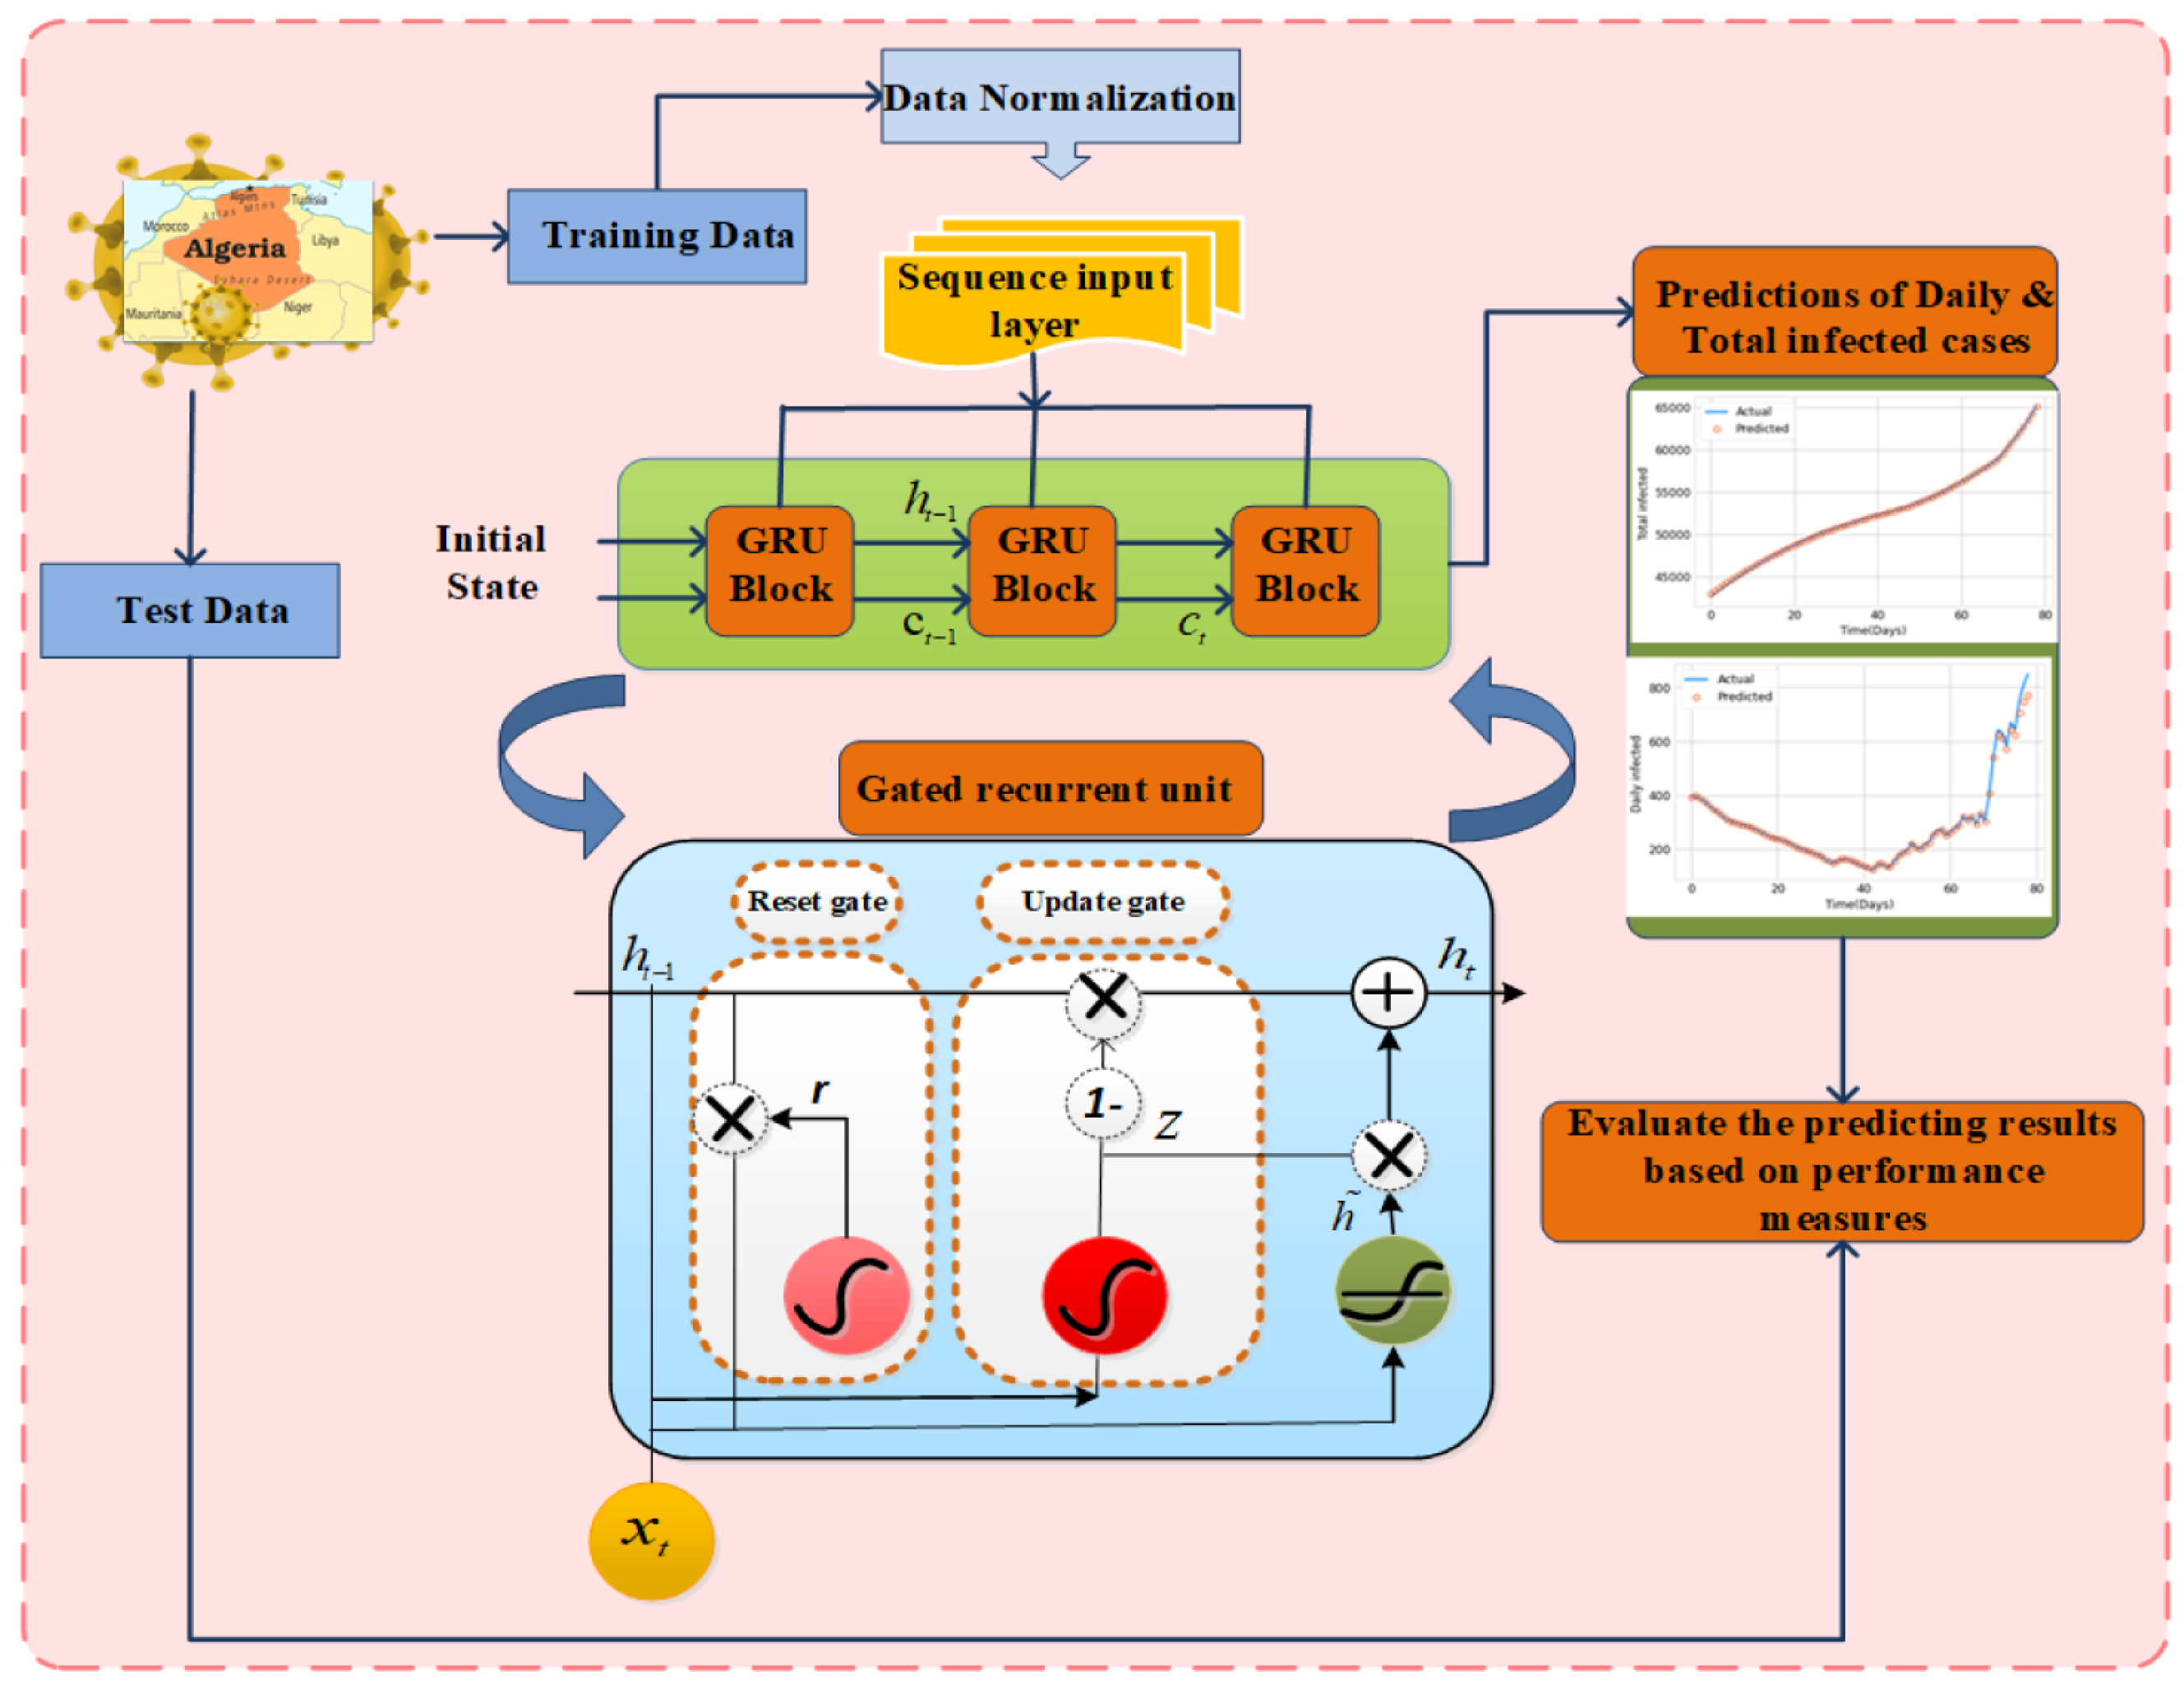
Figure 1.
Schematic depiction of the proposed TDGRU approach along with features of daily and total infected death and recovered cases and their prediction plots.
Figure 1.
Schematic depiction of the proposed TDGRU approach along with features of daily and total infected death and recovered cases and their prediction plots.

Figure 2.
Daily data for the cases of infected, mortality, and recovered of COVID-19 in Algeria.

Figure 3.
COVID-19 cases overall in Algeria, including those who have died and recovered.

Figure 4.
An illustration of single gate recurrent unit with their reset and update gates. The prediction strategy framework with the TDGRU model is depicted in Figure 1. This model is divided into three major sections. The input layer is primarily responsible for preprocessing the original data, the input sequence of three days’ data. The hidden layer is used to optimize parameters by employing 2-layer with dropout technique to train the data. The output layer predicts data based on the model trained in the hidden layer with the one/multi-day-ahead prediction, such as , , and .

Figure 5.
Learning principle of multi-day ahead in TDGRU.

Figure 6.
Prediction plots of TDGRU-I on daily and total infected, death and recovered cases in Algeria.
Figure 6.
Prediction plots of TDGRU-I on daily and total infected, death and recovered cases in Algeria.

Figure 7.
Comparison analysis of Daily and Total COVID-19 cases between TDGRU and LSTM with respect to MAE, RMSE, and R (a–c). (a) Daily infected, and total infected cases of Algeria data; (b) daily death, and total death cases of Algeria data; (c) daily recovered, and total recovered cases of Algeria data.

Figure 8.
Comparison analysis of TDGRU-I (first phase) and TDGRU-II (all phases of COVID-19).

Figure 9.
Actual vs. predicted plots of daily, and total infected, death, and recovered cases at 1-, 3-, and 5-day-ahead prediction results of the TDGRU model.
Figure 9.
Actual vs. predicted plots of daily, and total infected, death, and recovered cases at 1-, 3-, and 5-day-ahead prediction results of the TDGRU model.

Figure 10.
Comparison analysis of 1-, 3-, and 5-day-ahead predictions in form of bar charts for all daily and total infected, death, and recovered cases of TDGRU-I model and 8.24 for total recovered cases.
Figure 10.
Comparison analysis of 1-, 3-, and 5-day-ahead predictions in form of bar charts for all daily and total infected, death, and recovered cases of TDGRU-I model and 8.24 for total recovered cases.


Table 1.
Proposed models with parameters and their values.
| Models | Parameters | Values |
|---|---|---|
| TDGRU/LSTM | Layers | 2 |
| No. of neurons | {64, 128} | |
| Learning rate | 0.001 | |
| Dropout | 0.3 | |
| Optimizer | RMSprop | |
| Batch size | 16 | |
| Epochs | 250 | |
| ARIMA | Timeday | 3 |
| (p, d, q) | (2, 1, 2) |
Table 2.
Error analysis of COVID-19 Algerian dataset with respect to all error measures.
| Methods | Data | MAE | RMSE | R | MAPE |
|---|---|---|---|---|---|
| TDGRU | Daily infected | 0.47 | 0.52 | 0.92 | 0.933 |
| Total infected | 21.15 | 24.51 | 0.92 | 0.176 | |
| Daily death | 0.011 | 0.012 | 0.99 | 0.33 | |
| Total death | 0.33 | 0.41 | 0.99 | 0.053 | |
| Daily recovered | 0.26 | 0.61 | 0.99 | 0.271 | |
| Total recovered | 8.24 | 9.72 | 0.99 | 0.244 | |
| LSTM | Daily infected | 1.63 | 1.98 | 0.92 | 13.76 |
| Total infected | 98.83 | 159.7 | 0.91 | 5.10 | |
| Daily death | 0.01 | 0.01 | 0.92 | 11.70 | |
| Total death | 3.57 | 4.41 | 0.95 | 2.47 | |
| Daily recovered | 0.29 | 0.38 | 0.98 | 17.00 | |
| Total recovered | 14.9 | 19.4 | 0.96 | 4.487 | |
| ARIMA | Daily infected | 226.37 | 282.71 | 1.31 | 26.93 |
| Total infected | 52,904.7 | 81,764.59 | 13.59 | 51.9 | |
| Daily death | 214.69 | 387.63 | 1.22 | 14.45 | |
| Total death | 932.06 | 1060.65 | 0.34 | 44.91 | |
| Daily recovered | 284.87 | 372.74 | 1.83 | 38.10 | |
| Total recovered | 4340.33 | 5527.53 | 1.86 | 31.5 | |
| LR | Daily infected | 155.41 | 190.78 | 0.093 | 67.5 |
| Total infected | 15,399.0 | 17,907.21 | 0.24 | 59.6 | |
| Daily death | 206.86 | 260.86 | 0.024 | 26.5 | |
| Total death | 173.49 | 233.52 | 0.021 | 21.7 | |
| Daily recovered | 209.34 | 260.78 | 0.022 | 18.9 | |
| Total recovered | 176.15 | 239.77 | 0.173 | 24.8 |
Table 3.
One-day-ahead error analysis of COVID-19 country-wide dataset of Algeria with respect to error metrics.
Table 3.
One-day-ahead error analysis of COVID-19 country-wide dataset of Algeria with respect to error metrics.
| Methods | Data | MAE | RMSE | R | MAPE |
|---|---|---|---|---|---|
| TDGRU-II | Daily infected | 5.28 | 22.52 | 0.99 | 2.32 |
| Total infected | 200.21 | 254.03 | 0.97 | 0.081 | |
| Daily death | 0.033 | 0.068 | 0.99 | 0.079 | |
| Total death | 4.26 | 5.35 | 0.99 | 0.068 |
Table 4.
The 1-, 3-, and 5-day-ahead error analysis of COVID-19 dataset with respect to error measures.
Table 4.
The 1-, 3-, and 5-day-ahead error analysis of COVID-19 dataset with respect to error measures.
| Model Prediction | Data | MAE | RMSE | R | MAPE |
|---|---|---|---|---|---|
| 1-day-TDGRU | Daily infected | 0.47 | 0.52 | 0.92 | 0.933 |
| Total infected | 21.15 | 24.51 | 0.92 | 0.176 | |
| Daily death | 0.011 | 0.012 | 0.99 | 0.33 | |
| Total death | 0.33 | 0.41 | 0.99 | 0.053 | |
| Daily recovered | 0.13 | 0.17 | 0.99 | 0.271 | |
| Total recovered | 8.24 | 9.72 | 0.99 | 0.244 | |
| 3-days-TDGRU | Daily infected | 34.51 | 55.30 | 0.88 | 9.881 |
| Total infected | 986.74 | 1050.5 | 0.97 | 8.52 | |
| Daily death | 2.17 | 2.66 | 0.93 | 29.14 | |
| Total death | 25.65 | 30.49 | 0.96 | 3.642 | |
| Daily recovered | 17.32 | 25.79 | 0.85 | 11.06 | |
| Total recovered | 773.9 | 942.1 | 0.91 | 8.47 | |
| 5-days-TDGRU | Daily infected | 52.83 | 81.67 | 0.75 | 17.43 |
| Total infected | 1873.8 | 2324.3 | 0.77 | 5.16 | |
| Daily death | 2.01 | 2.48 | 0.96 | 33.45 | |
| Total death | 30.21 | 36.15 | 0.94 | 2.03 | |
| Daily recovered | 15.39 | 21.29 | 0.86 | 16.93 | |
| Total recovered | 927.7 | 1093.5 | 0.85 | 6.22 |
Table 5.
Paired t-test analysis of 1-day-ahead prediction for daily infected cases of TDGRU and LSTM model with respect to MAE.
Table 5.
Paired t-test analysis of 1-day-ahead prediction for daily infected cases of TDGRU and LSTM model with respect to MAE.
| Paired Samples Statistics | ||||||||
| Mean | N | Std. Deviation | Sdt. Error Mean | |||||
| Pair 1 TDGRU_MAE LSTM_MAE | 3.3516 9.8573 | 20 20 | 0. 69782 1.99366 | 0.15604 0.44580 | ||||
| Paired Samples Correlations | ||||||||
| N | Correlation | Sig. | ||||||
| Pair 1 TDGRU_MAE & LSTM_MAE | 20 | 0.903 | 0.000 | |||||
| Paired Samples Test | ||||||||
| Paired Differences | ||||||||
| Mean | Std. Deviation | Sdt. Error Mean | 95% Confidence Interval of the Difference | t | df | sig. (2-tailod) | ||
| Pair 1 TDGRU_MAE- LSTM_MAE | −6.50570 | 1.39635 | 0.31223 | Lower | Upper | −20.836 | 19 | 0.000 |
| −7.15921 | −5.85219 | |||||||
Disclaimer/Publisher’s Note: The statements, opinions and data contained in all publications are solely those of the individual author(s) and contributor(s) and not of MDPI and/or the editor(s). MDPI and/or the editor(s) disclaim responsibility for any injury to people or property resulting from any ideas, methods, instructions or products referred to in the content. |
© 2023 by the authors. Licensee MDPI, Basel, Switzerland. This article is an open access article distributed under the terms and conditions of the Creative Commons Attribution (CC BY) license (https://creativecommons.org/licenses/by/4.0/).
Share and Cite
MDPI and ACS Style
Abugabah, A.; Shahid, F. Intelligent Health Care and Diseases Management System: Multi-Day-Ahead Predictions of COVID-19. Mathematics 2023, 11, 1051. https://doi.org/10.3390/math11041051
AMA Style
Abugabah A, Shahid F. Intelligent Health Care and Diseases Management System: Multi-Day-Ahead Predictions of COVID-19. Mathematics. 2023; 11(4):1051. https://doi.org/10.3390/math11041051
Chicago/Turabian StyleAbugabah, Ahed, and Farah Shahid. 2023. "Intelligent Health Care and Diseases Management System: Multi-Day-Ahead Predictions of COVID-19" Mathematics 11, no. 4: 1051. https://doi.org/10.3390/math11041051
Note that from the first issue of 2016, this journal uses article numbers instead of page numbers. See further details here.