


Analysis of Microscopic Pore Characteristics and Macroscopic Energy Evolution of Rock Materials under Freeze-Thaw Cycle Conditions
1
School of Resources and Safety Engineering, Central South University, Changsha 410083, China
2
Sinosteel Maanshan General Institute of Mining Research Co., Ltd., Maanshan 243000, China
3
School of Emergency Management, Jiangxi University of Science and Technology, Ganzhou 341000, China
*
Authors to whom correspondence should be addressed.
Mathematics 2023, 11(3), 710; https://doi.org/10.3390/math11030710
Submission received: 29 November 2022
/
Revised: 19 January 2023
/
Accepted: 22 January 2023
/
Published: 31 January 2023
(This article belongs to the Special Issue Advances in Computational Intelligence in Geotechnical and Geological Engineering)
Abstract
:The repeated cyclic freeze-thaw effect in low-temperature environments causes irreversible damage and deterioration to the microscopic pore structure and macroscopic mechanical properties of a rock. To study the effects of the freeze-thaw cycle on the porosity and mechanical properties, the indoor freeze-thaw cycle test and mechanical tests of sandstone-like materials were conducted. Based on nuclear magnetic resonance, the influence of the freeze-thaw cycle on microscopic pores was analyzed, and the intrinsic relationship between porosity and mechanical strength was discussed. Meanwhile, the energy change in the uniaxial compression test was recorded using the discrete element software (PFC2D). The influence of freeze-thaw cycles on different types of energy was analyzed, and the internal relationship between different energies and freeze-thaw cycles was discussed. The results showed that the microscopic pore structure is dominated by micropores, followed by mesopores and the smallest macropores. With an increase in the freeze-thaw cycle, both micropores and mesopores showed an increasing trend. The porosity showed an exponentially increasing trend with the increase in freeze-thaw cycles. The peak strength and elastic modulus decreased exponentially with the increase in freeze-thaw times, while the peak strain showed an exponentially increasing trend. The strain energy and bond strain energy showed a trend of increasing and decreasing in the front and back stages of the peak strength, respectively. However, the frictional energy always showed an increasing trend. The total energy, strain energy, bond strain energy, and friction energy all showed exponential increases with the increase in the number of freeze-thaw cycles.
Keywords:
freeze-thaw cycle; microscopic porosity; nuclear magnetic resonance; mechanical properties; energy evolutionMSC:
74S301. Introduction
With the continuous development of human society, the scale of infrastructure construction and the degree of resource development and utilization in cold regions will be further improved. However, in low-temperature environments, all geotechnical engineering will inevitably face the unique effects of freeze-thaw cycles. Rocks in their natural environment are a kind of porous material with internal defects, such as microcracks and pores. This repeated rise and decrease in temperature change will lead to water-ice phase changes in porous or crack water inside the engineering bearing unit with porous characteristics. The volume expansion generated by the phase change can cause damage to the initial microscopic pore structure of the rock and soil elements, which can eventually have an important impact on the mechanical characteristics of the bearing unit and the safety and stability of the project [1]. Therefore, it is of great significance to study the effect of cyclic freeze-thaw on the microscopic structure and macroscopic mechanical parameters for the stability of geotechnical engineering in low-temperature regions.
In recent years, the research on the influence of F-T cycle microscopic pore structure in rocks has attracted attention. Li and Zhou [2,3,4,5] analyzed the effect of freeze-thaw cycles on the microscopic pore structure of sandstone. The research showed that with the increase in F-T cycles, the porosity increased and the pore sizes of micropores and macropores increased significantly. Gao [6] took red sandstone as the research object and conducted a study on the influence of the F-T cycle on the microscopic pore structure under the action of the chemical environment. The results showed that, under the action of the freeze-thaw cycle, the porosity showed a linear growth trend. Meanwhile, new micropores were constantly emerging inside the specimen. In the study of the influence of F-T cycles on granite, repeated freezing and thawing of pore water generated damage to the microscopic pore structure. Among them, the porosity gradually increased with the increase in the number of cycles, and the micropores gradually developed into macropores [7].
The mechanical strength of the bearing unit in geotechnical engineering plays an important role in the safety and stability of the project. It is of great significance for the safe and efficient operation of rocks to study the influence of the freeze-thaw cycle on mechanical properties. Related research directions have always been the focus of experts and scholars. Gao [8,9] discussed the variation of internal porosity of sandstone under the action of the freeze-thaw cycle and established a strength degradation model of water-saturated sandstone by taking porosity as the dependent variable. At the same time, based on the statistical damage mechanical model of strain equivalence, a constitutive model of sandstone segmentation under freeze-thaw conditions was proposed and verified by the experimental results. Based on the combination of NMR and infrared thermal imaging detection, Yang [10] analyzed the change trend of porosities and mechanical characteristics of marble, granite, and sandstone under the action of F-T cycle and discussed the failure process and failure mode of different rock samples. Through the creep test of sandstone under the F-T cycle, Li [11] established a constitutive model of nonlinear creep damage in sandstone.
Previous studies have shown that the process of rock loading and destruction is accompanied by the release and dissipation of energy, in which the process of energy dissipation can indicate the continuous development of microscopic defects and the weakening of the macroscopic strength until the final destruction [12,13]. From the above research, it can be seen that during F-T cycles, the physical parameters of different rock samples had a certain degree of attenuation. In the same way, the energy release and dissipation laws also have changed accordingly. In recent years, more and more attention has been paid to the effects of cyclic freeze-thaw on energy release and dissipation laws. Taking sandstone as the research object, Deng [14] calculated the strain energy, the elastic strain energy, and the dissipative energy released by using the stress-strain curve, finally analyzing the influence of the freeze-thaw cycle on different types of energy. The results suggested that the strain energy, the elastic strain energy, and the dissipative energy all showed a decreasing trend with an increase in the F-T cycle. Feng [15] discussed the evolution of specimen porosity, mechanical strength, and energy under F-T cycles. Gao [16] conducted uniaxial compression tests on blue sandstone under F-T cycles and explored the influence of cyclic freeze-thaw on the evolution of strain energy, releasable elastic strain energy, and dissipative energy. The damage model of peak stress and peak strain of specimens under freeze-thaw action was established by the ratio of dissipative energy to strain energy, verified with laboratory tests. In summary, the F-T cycle has an important impact on the microscopic pore characteristics, macroscopic mechanical strength, and energy evolution of rock samples. However, in previous studies on the energy evolution of rocks under F-T cycle conditions, most researchers calculated strain energy, releasable strain energy, and dissipative energy through stress-strain curves in mechanical tests. In this study, the uniaxial compression process of sandstone-like material under different freeze-thaw cycles was simulated based on the particle flow code. Different types of energy parameters during the loading process were tracked through the internal energy recording module of the program. Combined with the NMR detection of microscopic pore parameters under different freeze-thaw cycles, the influence of the freeze-thaw cycle on porosity was analyzed from a microscopic perspective. At the same time, the influence of cyclic freeze-thaw on mechanical properties and energy evolution was discussed from a macroscopic perspective. The influence mechanism of the freeze-thaw cycle on the microscopic pores and macroscopic mechanical characteristics of sandstone was revealed from multiple angles. The results of this paper can provide reference and guidance for safety and stability analysis and instability prevention of open-pit mine slopes, highway shoulder slopes, and other geotechnical engineering structures in low-temperature environments [17].
2. Experimental Progress and Methodology
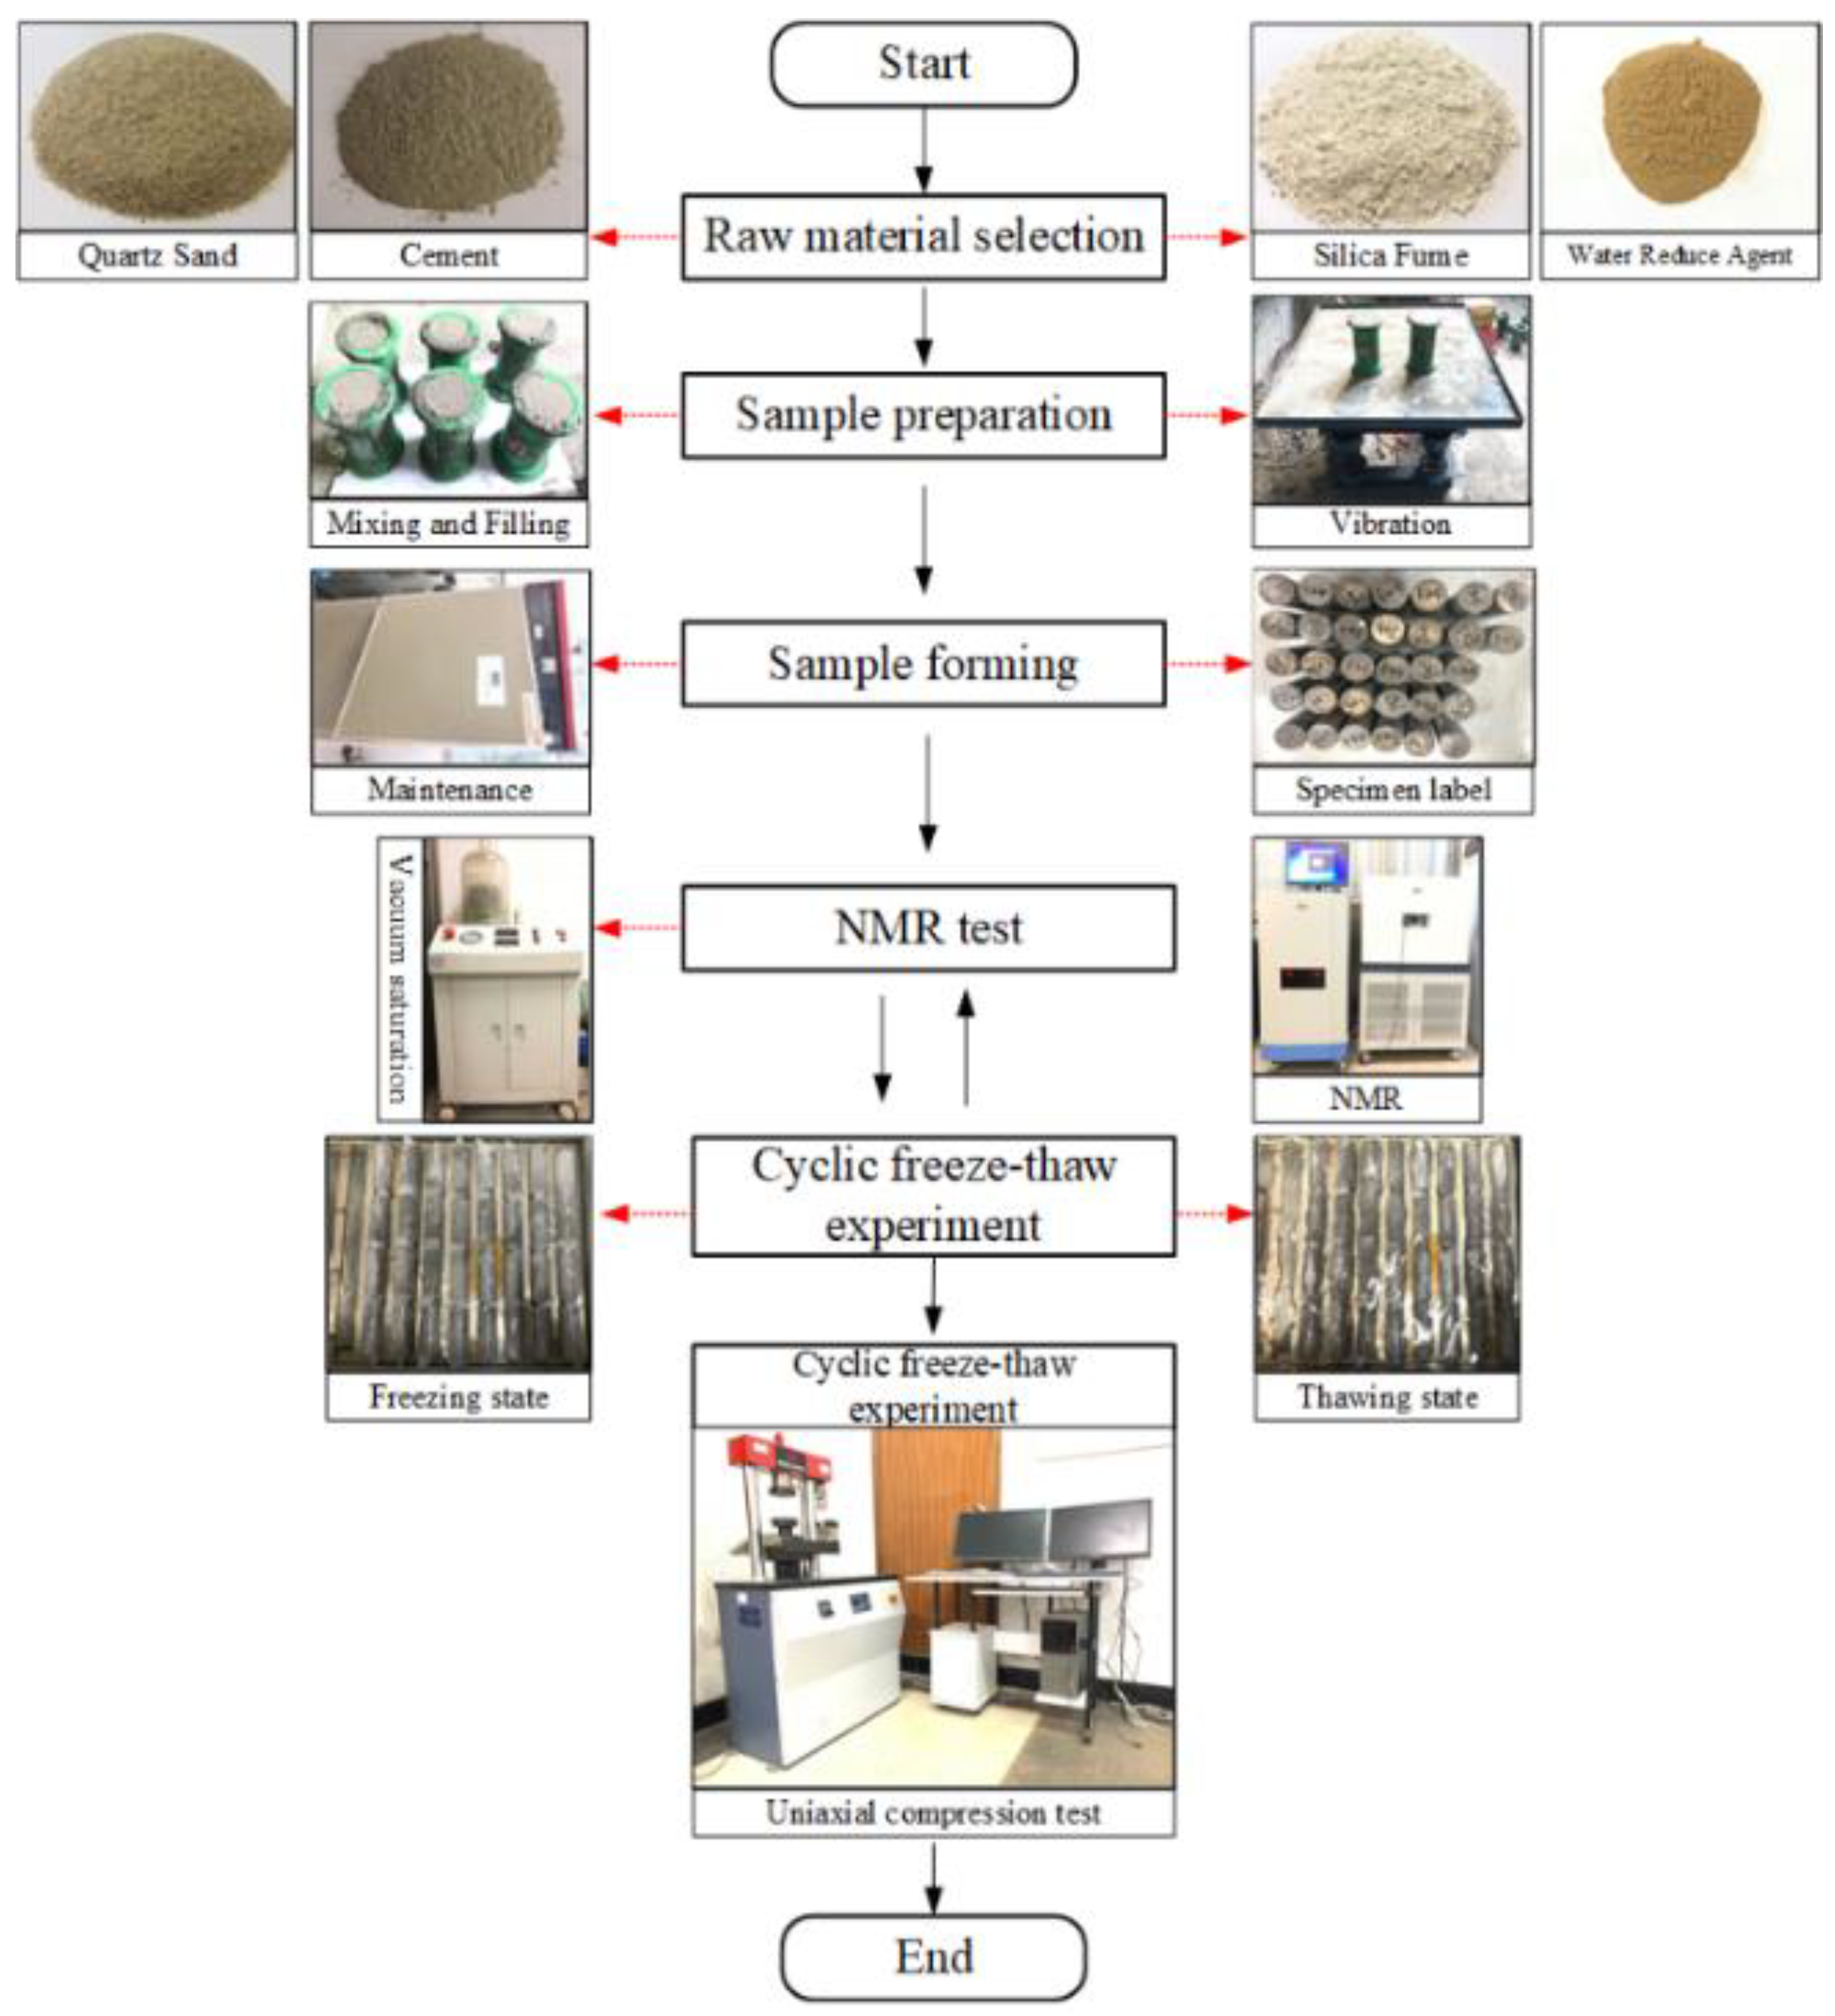
2.1. Raw Materials Selection and Sample Preparation
The sample studied in this paper is a sandstone-like material. The original rock is yellow sandstone from the slope of an open slope in Shandong Province, China. According to the current research on rock-like materials, the cementitious material is ordinary Portland cement (P.O 42.5) [18,19,20,21,22,23,24]. The aggregate is a yellow-white spherical quartz sand with a particle size of 0.5~1 mm, and the spherical shape can make it fully wrapped by the cementitious material. The admixtures selected for the test were a yellow-brown, naphthalene-based high-efficiency water reducer and a white, micron-sized silica powder. The specific parameters of raw materials are shown in Table 1 and Table 2. In the sample production, the mass matching ratio of different raw materials is 0.32:1.00:1.30:0.10:0.01 (water:cement:quartz sand:silica powder:naphthalene water reducer). First of all, different raw materials are weighed according to different proportions. Then stirring, filling, vibration, demolding, numbering, and curing were carried out in turn. Finally, different physical and mechanical parameters of the sample were tested and compared with the original rock. The test procedures are shown in Figure 1. Table 3 shows the test results for sandstone and sandstone-like materials. Based on the statistical results, it can be seen that the different physical parameters of sandstone-like material are basically close to those of sandstone.
2.2. Laboratory Test
2.2.1. Freeze-Thaw Cycle Test
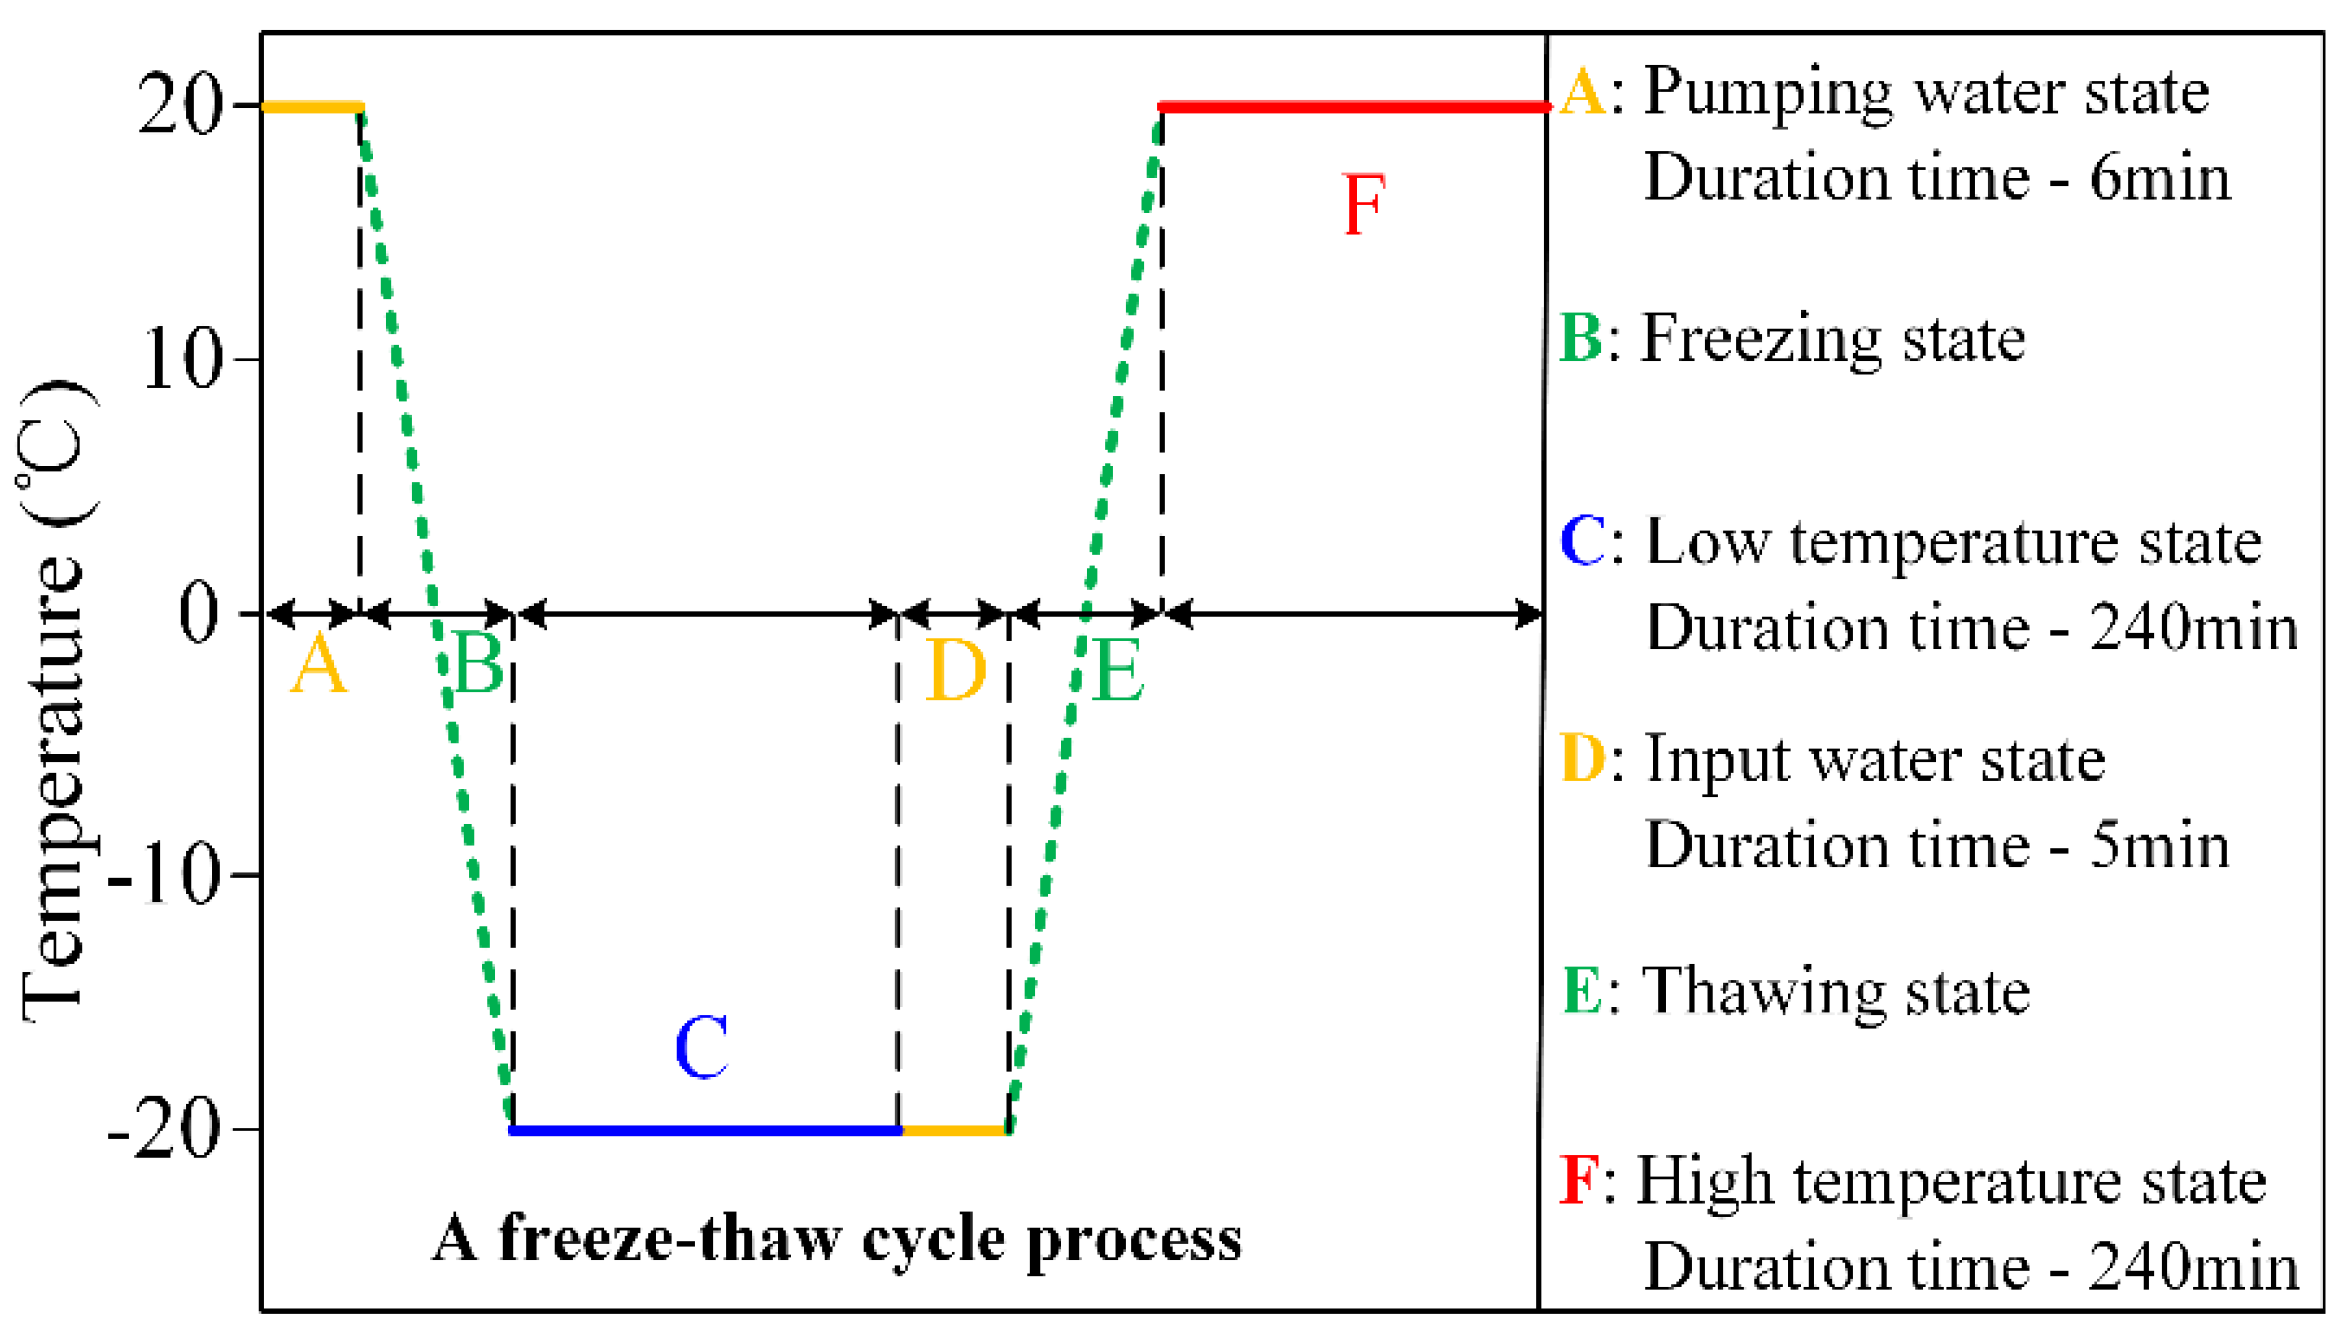
The freeze-thaw test equipment used in this experiment is the TDS-300 concrete freeze-thaw testing machine produced by Suzhou Donghua Test Instrument Co., Ltd., and the working mode of the equipment is air freezing and water thawing. It takes 12 h for the test equipment to accomplish a full freeze-thaw cycle. Among them, the freezing temperature is −20 °C, and the low-temperature holding time is 4 h. The melting temperature is 20 °C, and the high-temperature holding time is 4 h. A complete freeze-thaw cycle is shown in Figure 2.
2.2.2. NMR Test
The NMR analysis device is MesoMR23-060H produced by Suzhou Newmai Analytical Instrument Co., Ltd. The instrument uses the H+ atomic probe of pore water inside rocks to measure the pore water content of different radii, which is inverted into the pore signal (T2 relaxation time). In the process of sample detection, the magnetic field strength was 0.3 T, and the central principal frequency of NMR was 12.8 MHZ. The diameter of the probe coil was 60 mm and the sampling number was 4 times greater. The sampling interval was 6000 ms and the number of echoes was 7000 times. In addition, to saturate the rock sample, the specimens need to be vacuum saturated before the NMR test. The vacuum pressure inside the instrument cover was 0.1 MPa. The dry pumping time was set to 360 min and the wet pumping time was 240 min.
2.2.3. Uniaxial Compressive Strength Test
The equipment for uniaxial compression test was WHY-300 microcomputer-controlled pressure test equipment produced by Shanghai Hualong Testing Instrument Co., Ltd. The control mode was displacement, and the loading speed was 1 mm/min. The basis for the determination of the end of loading was 40% of the peak strength. According to the test standard specifications [25], the width of test specimen was 50 mm and the length was 100 mm. The uniaxial compressive strength is calculated as follows:
In the formula, is the uniaxial compressive strength. is the failure load of the rock sample. is the loading area.
2.3. Pore Radius Decision
According to the basic principle of NMR, the relaxation time () of pore water inside the rock is mainly affected by the surface relaxation () of pore water. During the test, the surface relaxation conforms to the following expression:
In the formula, is the relaxation strength of the rock particle surface, which is mainly controlled by the lithology of the rock. is the pore surface area, and is the pore volume. The NMR testing generally treats the pore shape as spherical, so the formula can be changed to:
is the pore shape factor (spherical pores, = 3) and is the pore radius. Since and are constants in the formula, the formula can be reduced to:
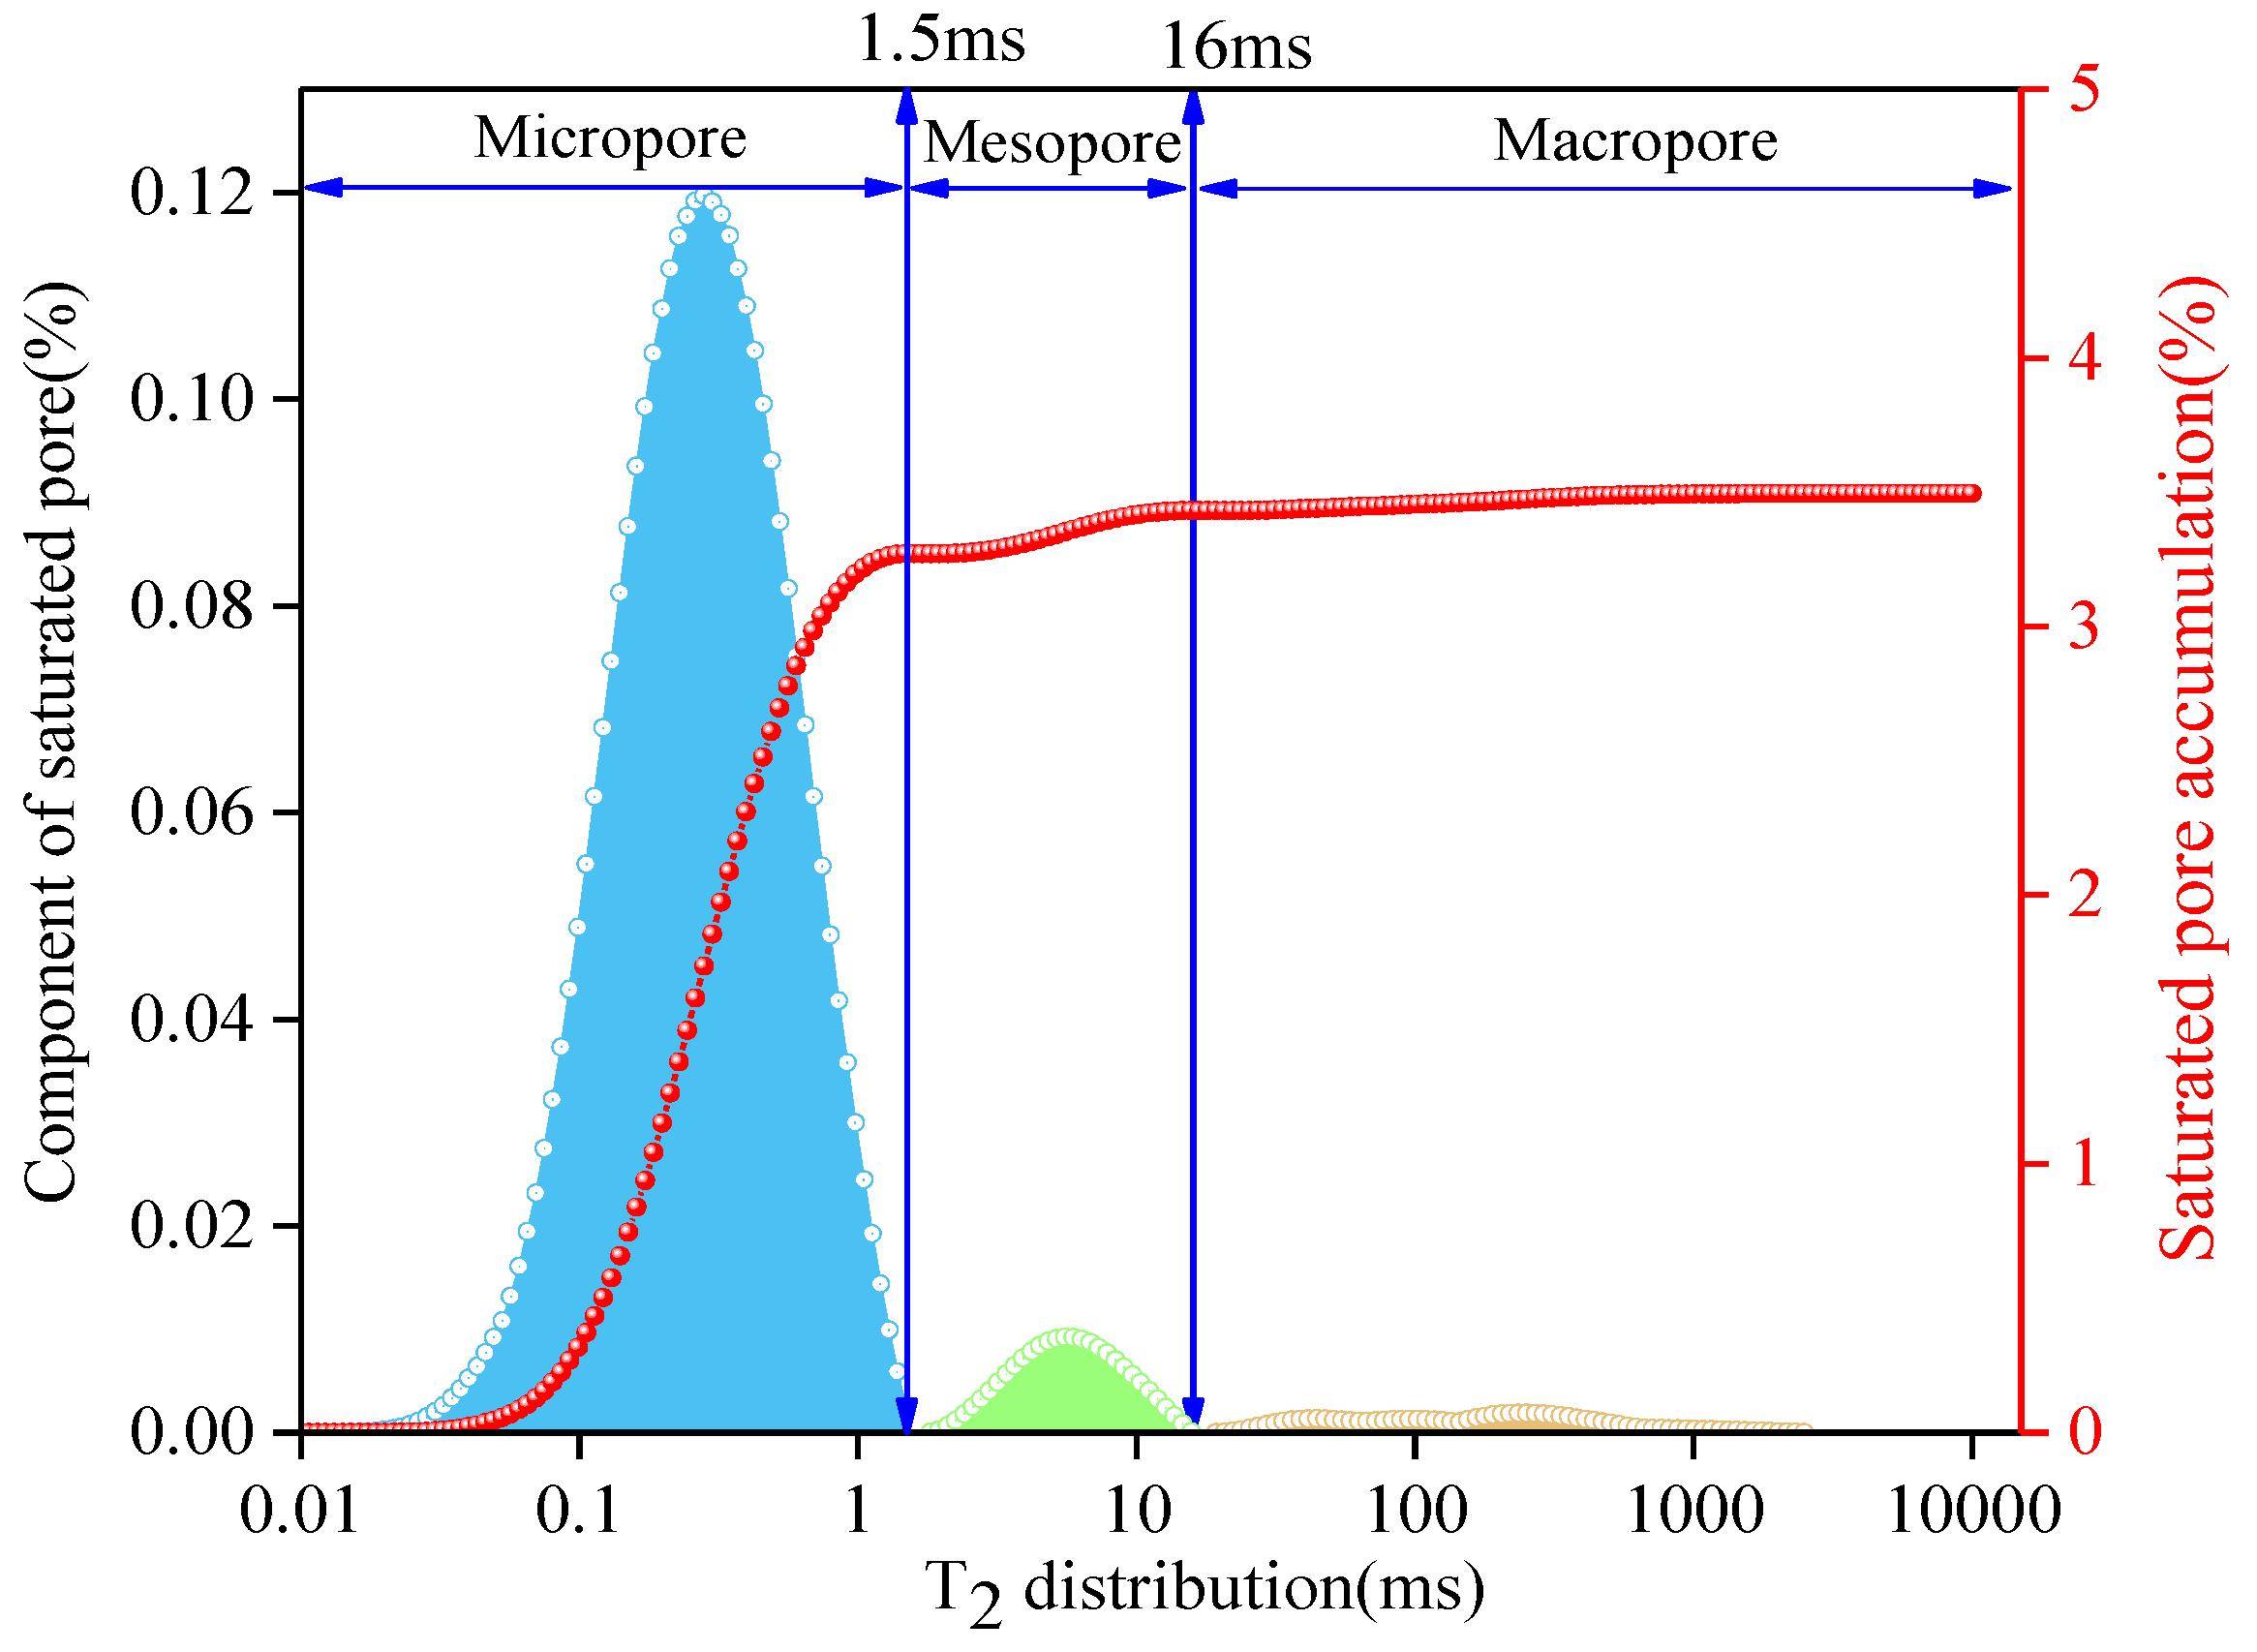
As can be seen from Equation (4), the relaxation time is linearly related to the pore radius and corresponds one by one. Based on the relaxation time distribution characteristics of the 0-cycle rock sample, the pores are divided into three types of pores: miacropore (), mesopore (), and macropores (). The result of pore radius decision is shown in Figure 3.
2.4. Model Description
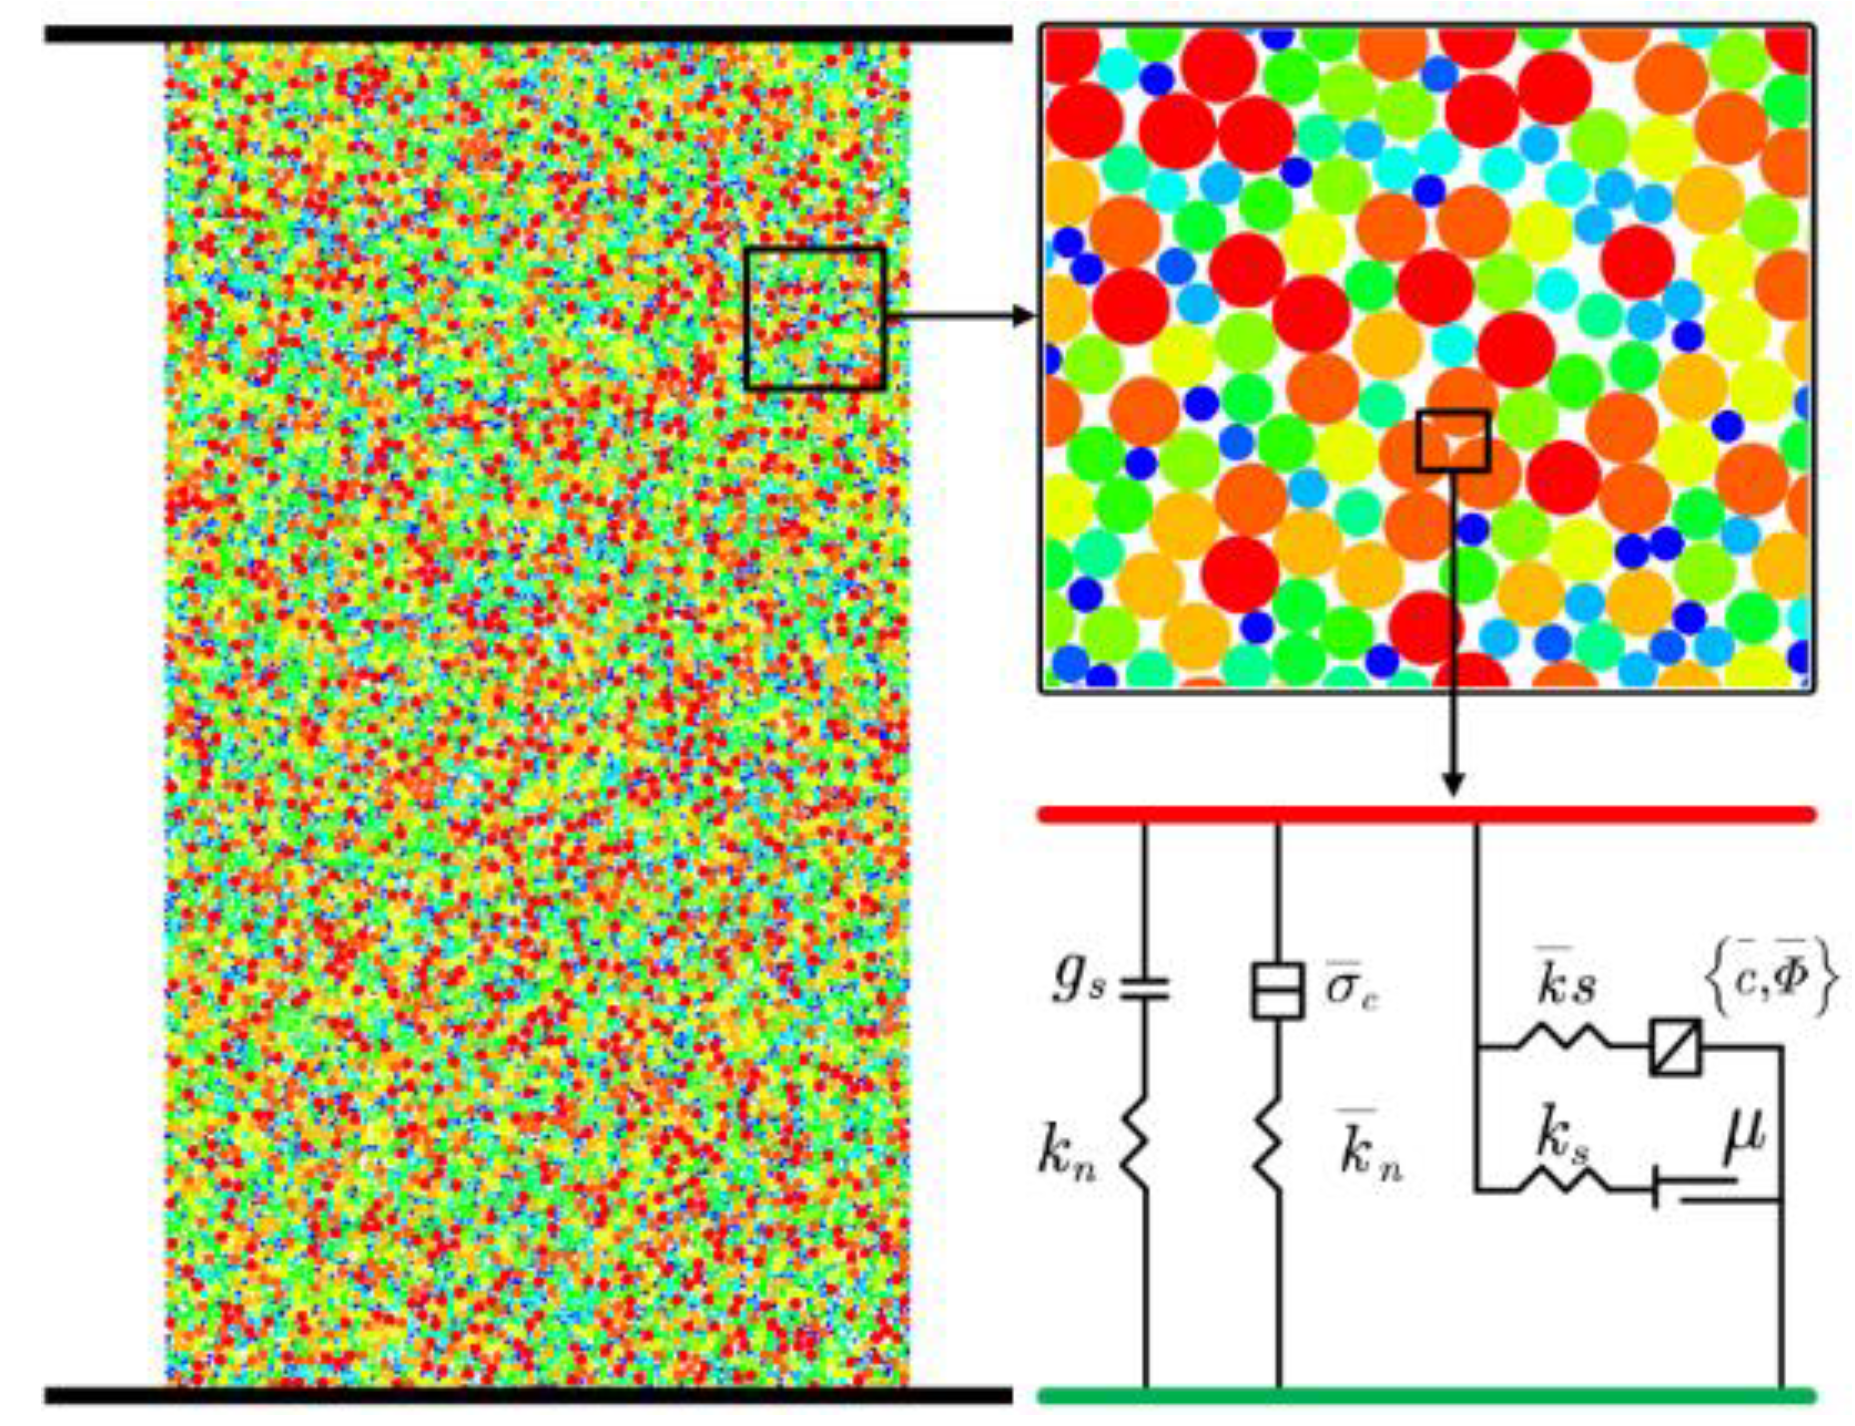
The software PFC is a particle flow analysis program developed based on the discrete element method, which is widely used in the study of microscopic and macroscopic damage evolution, crack propagation, and failure modes in the processing of rock material [26]. In numerical simulations, the microparticles of different radii are taken as the basic units. The mechanical parameters between the units are used to characterize the macroscopic mechanical properties of rocks. The mechanical parameter relationship between particles is the relationship between force and displacement, and its equation of motion conforms to Newton’s second law [27,28]. In addition, the mechanical parameters of different particle units are not directly related to the macroscopic mechanical properties of rock samples. Therefore, in numerical simulations, the trial-and-error method is needed to modify the microscopic parameters of particles until the results are basically consistent with the laboratory test results [29].
The parallel bonding model is one of the important models of the built-in constitutive relationships of PFC systems, which can simulate solid materials (rock, concrete, etc.) with cementing properties. It is a commonly used model for the numerical simulation of current rock and soil materials. The schematic diagram is shown in Figure 4.
3. Results and Discussions
3.1. The Effects of the Freeze-Thaw Cycle on Microscopic Pore Structure
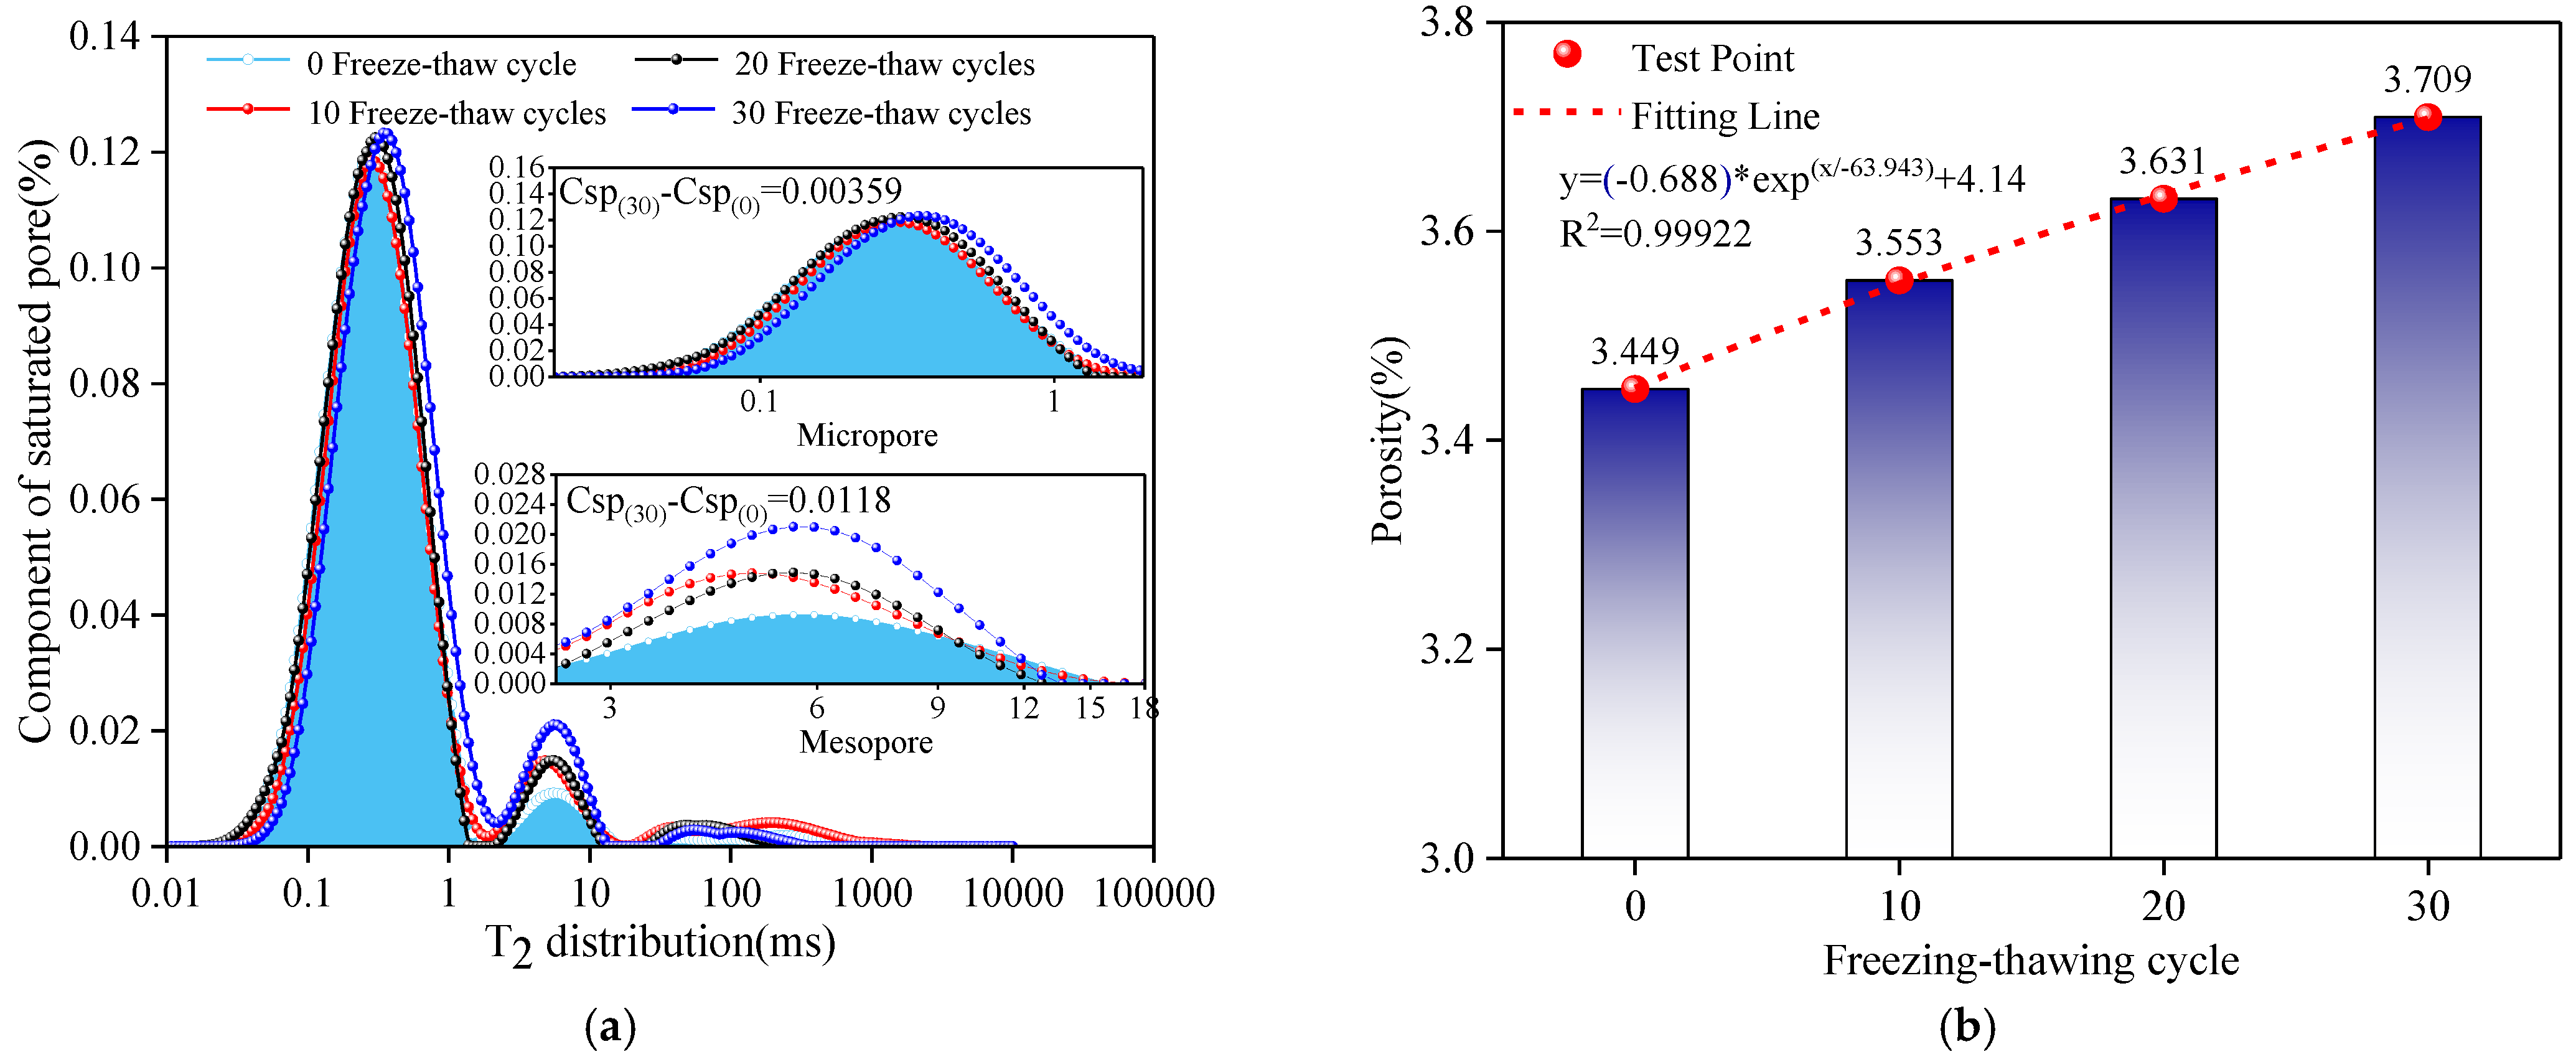
In NMR detection, the relaxation distribution is an important parameter that reflects the internal pore signal in rocks. Figure 5 shows the influence of the microscopic pore structure under different freeze-thaw cycles. As can be seen from Figure 5a, the T2 distribution basically presents a three-peak feature character. The peak value of the micropore signal was significantly higher than that of mesopores and macropores. The internal microscopic pores are mainly micropores, followed by mesopores, and lastly macropores. As the number of freeze-thaw cycles increased, the T2 distribution shifted significantly to the right, causing the microscopic pores inside the sample to change from a smaller radius to a larger radius. In addition, except for individual data points, with the increase in F-T cycles, the signal peak of micropores and mesopores also showed a significant increase. However, the change in the peak signal in macropores was not obvious.
Table 4 shows the statistical results of the pore peak signals of pores of different radii and porosities under the action of the freeze-thaw cycle. According to the analysis of statistical results, when the number of freeze-thaw cycles increased from 0 to 30, the average porosity increased from 3.449% to 3.709%. The increase rate was 7.54%. In the variation law of peak signals of pores of different radii, except for 10 cycles of the peak signal of the micropore slightly less than 0 cycles, the peak value of the micropore signal increased from 0.1197% to 0.12323%, and the increase rate was 2.95%. The peak value of the mesopore signal increased from 0.00922% to 0.02102%, and the increase rate was 1.28%. Although the signal peaks of the 10, 20, and 30 cycles of the macropore were greater than 0 cycles, the change in trend from 10 cycles to 30 cycles was not obvious.
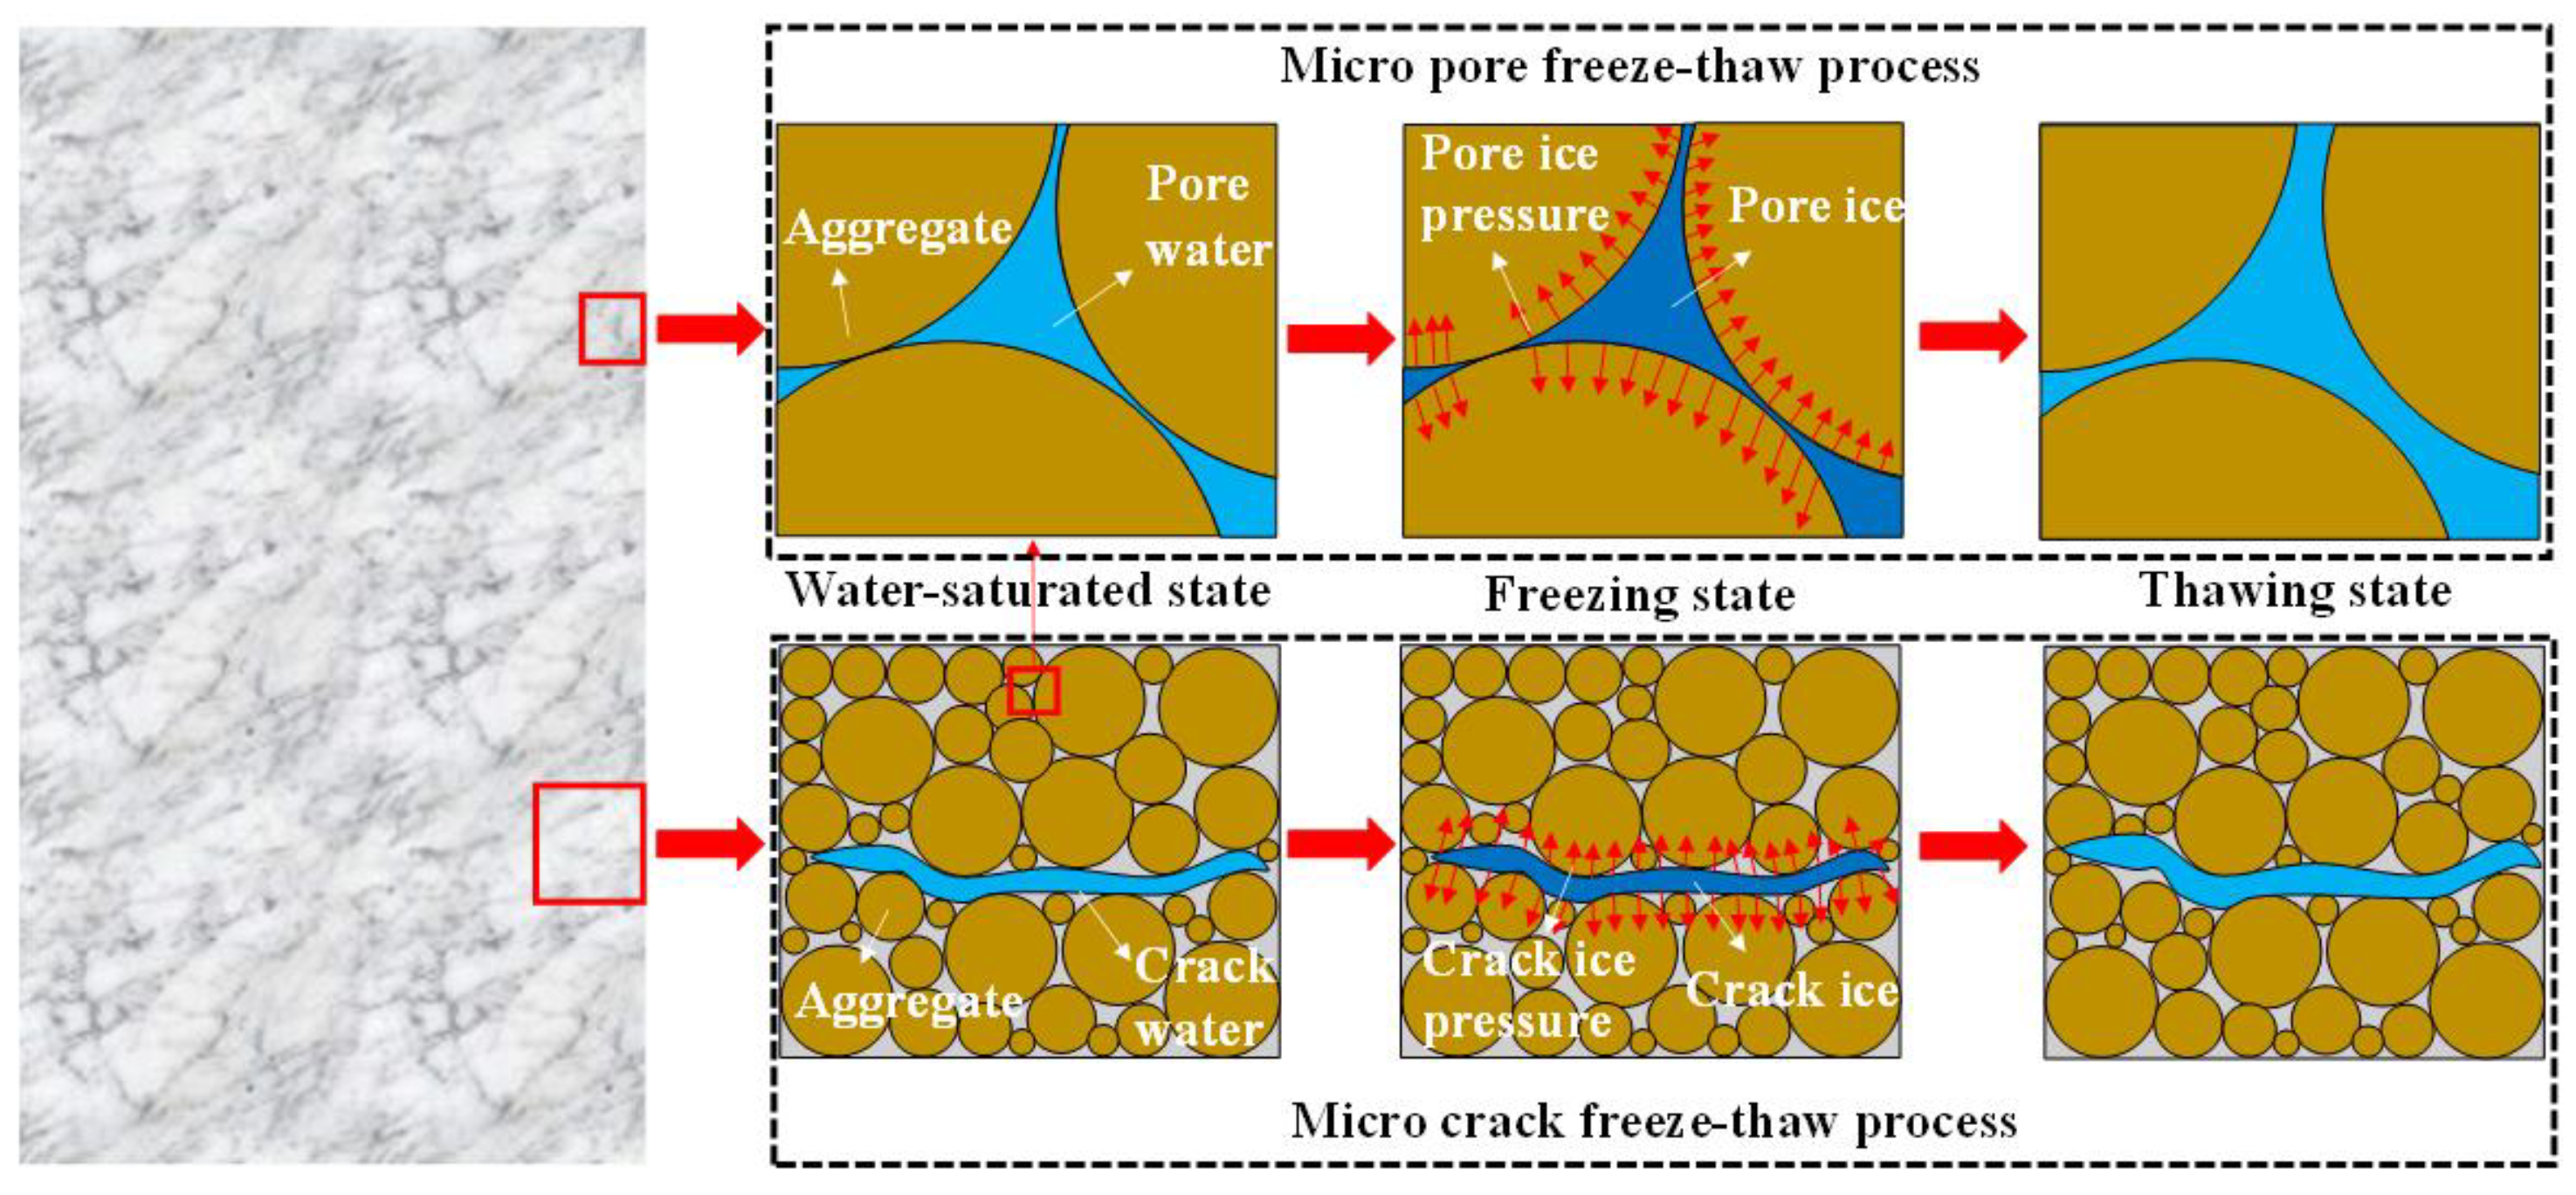
As the temperature decreased, the pore water and crack water inside the sample began to gradually change from the liquid water state to the solid ice state (Figure 6). At the same time, the change in water ice morphology in pores or cracks leads to an increase in the volume of pore or crack fillers, which causes ice crystals in the pore or crack to generate corresponding pressure on the inner walls of the pore or crack. Studies have shown that a phase change from water to ice increases the volume by 9% [30,31,32,33], and the ice crystallization pressure can reach several hundred megapascals. When the pressure of the pore ice crystals in the internal micropores and mesopores on the inner wall was greater than the ultimate tensile strength of the wall, the radius of the micropores and mesopores expanded, and the pore volume continued to increase. Therefore, in the NMR test results, the signal peak of the relaxation time of micropores and mesopores increased, and the porosity increased. Moreover, with the continuous expansion of the pore radius of micropores and mesopores, pore communication occurred between different micropores and mesopores. The micropores and mesopores continued to develop into mesopores and macropores. Finally, in the NMR test, the relaxation time distribution shifted to the right as a whole. In addition, there are microcracks of different sizes in the internal microstructure of the sample. When the pressure of the crack ice of the microcrack on the inner wall was greater than the ultimate tensile strength, the microcrack also expanded in different directions, and the volume of the microcrack increased continuously. The NMR results also showed that the peak signal increased in micropores and mesopores. Similarly, as the volume of microcracks continued to increase, microcracks of different scales expanded and connected, and cracks of smaller sizes gradually developed into larger sizes. The test results also showed that the relaxation distribution began to shift to the right. Moreover, the porosity and the number of the F-T cycle were fitted. The results showed that the number of F-T cycles and porosity had a good exponential relationship (R2 = 0.9982), and the porosity increased exponentially with the increase in the number of F-T cycles.
It can be seen that in low-temperature environments, there is a good exponential relationship between porosity and F-T cycles; the porosity increases with the increase in the F-T cycle. The results of this experiment can provide reference and support for the subsequent study of the evolution law of microscopic pore structure in low-temperature environments.
3.2. The Effects of the Freeze-Thaw Cycle on Macroscopic Properties
3.2.1. The Effects of the Freeze-Thaw Cycle on Mechanical Properties
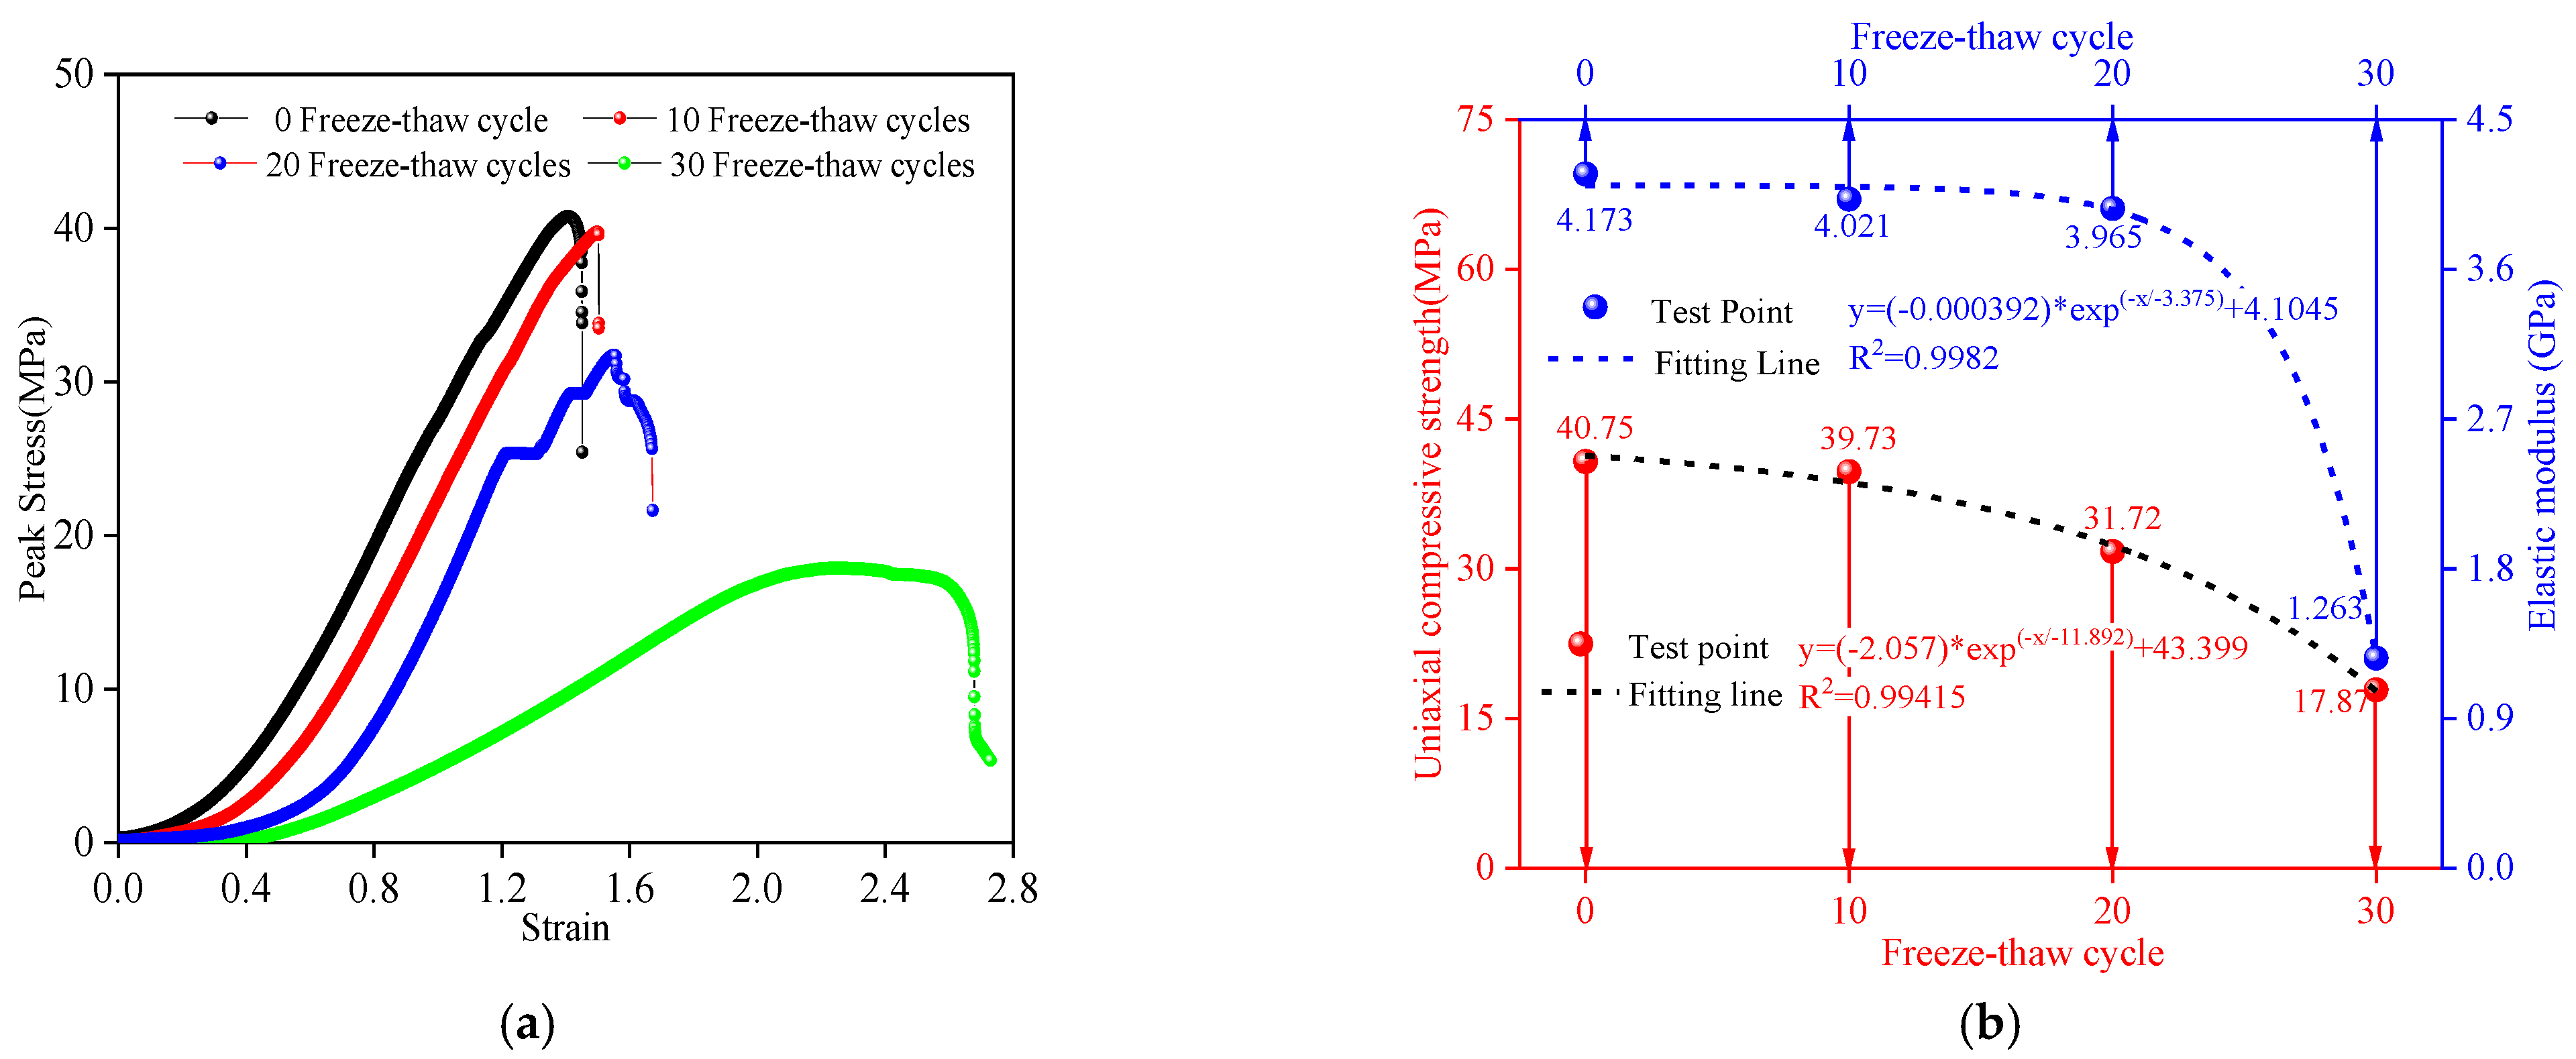
Figure 7a shows the stress-strain curve under different freeze-thaw cycles. It can be seen that the stress-strain curves have obvious pores compaction, elastic deformation, stable development of fractures and unstable development stages of fractures under different freeze-thaw cycles. Meanwhile, with the increase in the number of freeze-thaw cycles, the strain in the pore compaction stage increased significantly. The peak strength decreased, and the peak strain increased observably. Table 5 shows the statistical results of the peak strength, elastic modulus, and peak strain under different freeze-thaw cycles. When the number of the F-T cycle increased from 0 to 30, the peak strength decreased from 40.75 MPa to 17.87 MPa with a reduction rate of 56.15%. The elastic modulus was reduced from 41.73 MPa to 12.63 MPa with a reduction rate of 69.73%. The peak strain increased from 1.40612% to 2.25087%, with an increase rate of 60.08%. According to the influence of freeze-thaw on the change rate of different mechanical parameters, the F-T cycle had the largest influence on the elastic modulus, followed by the peak strain, which had the least influence on the peak strength.
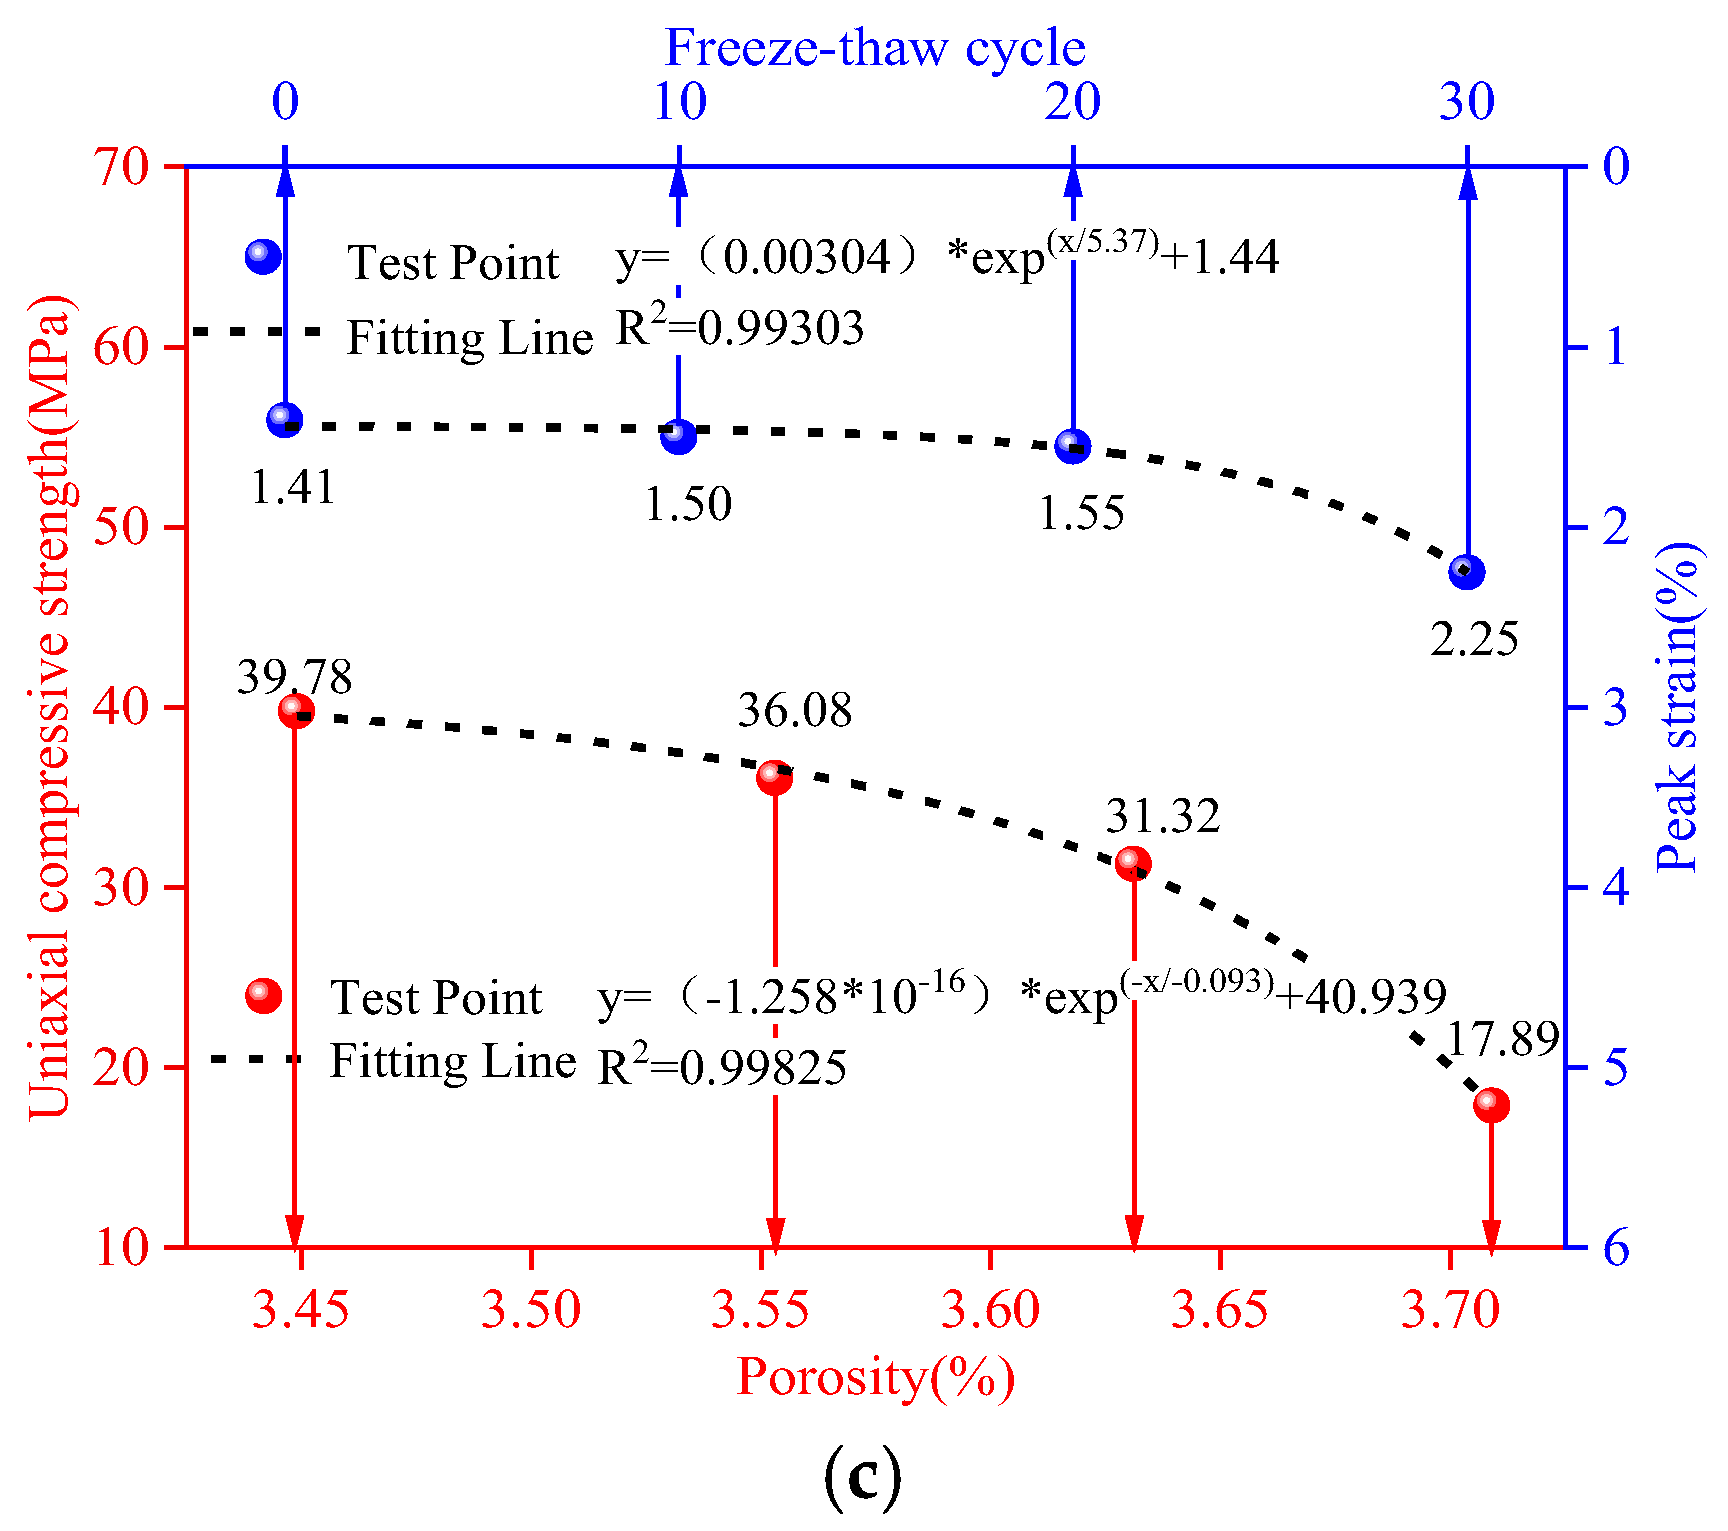
The pore compaction stage is a nonlinear deformation stage in which the original open cracks or pores gradually close during the initial stage of rock loading. With the increase in the F-T cycle, the number of microscopic pores inside the sample gradually increased, which also increased the deformation of the pore compaction stage of the sample. As a result, there was a significant increase in strain during the pore compaction phase, which ultimately led to an increase in peak strain. Moreover, the peak strain had a good exponential relationship with the number of F-T cycles, which increased exponentially with the increase in the cycles. In order to explore the intrinsic relationship between peak strength and elastic modulus and the F-T cycle, different mechanical parameters and freeze-thaw cycles were fitted (Figure 7b,c). The results showed that the peak strength and elastic modulus have a high exponential relationship with freeze-thaw cycles, and the fitting correlation coefficient is above 0.99. While the number of F-T cycles gradually increased, the peak strength and elastic modulus showed an exponential decrease. In previous studies, it was generally believed that the deterioration of the macroscopic mechanical properties under low-temperature environments was the result of the changes in the microscopic pore structure caused by the F-T cycle [34]. Consequently, the relationship between porosity and uniaxial compressive strength was also considered. The results showed that there was a good exponential relationship between porosity and compressive strength, and the fitting coefficient was 0.99825. When the repeated F-T cycle caused the number of microscopic pores to increase, the mechanical strength showed an exponentially decreasing trend, which finally affected the safety and stability of the project.
3.2.2. The Effects of Freeze-Thaw Cycles on Energy Evolution
When the particle flow program simulates rock damage under load, the evolution of different types of energy can be tracked by setting the energy command. Therefore, before tracing the energy evolution, a numerical simulation of the uniaxial compression test should be carried out by the trial-and-error method. When the numerical simulation results are basically consistent with the indoor test results, the energy evolution can be recorded by turning. Table 6 shows the particle flow simulation parameters of the uniaxial compression test under different freeze-thaw cycles. In this numerical simulation, the radius, density, normal and tangential stiffness ratios, porosity, and friction coefficient of the particle element were kept unchanged. The parameters affecting its peak strength and peak strain (Emod, pb_Emod, pb_coh, and pb_ten) were changed to simulate the uniaxial compression test under different cycles.
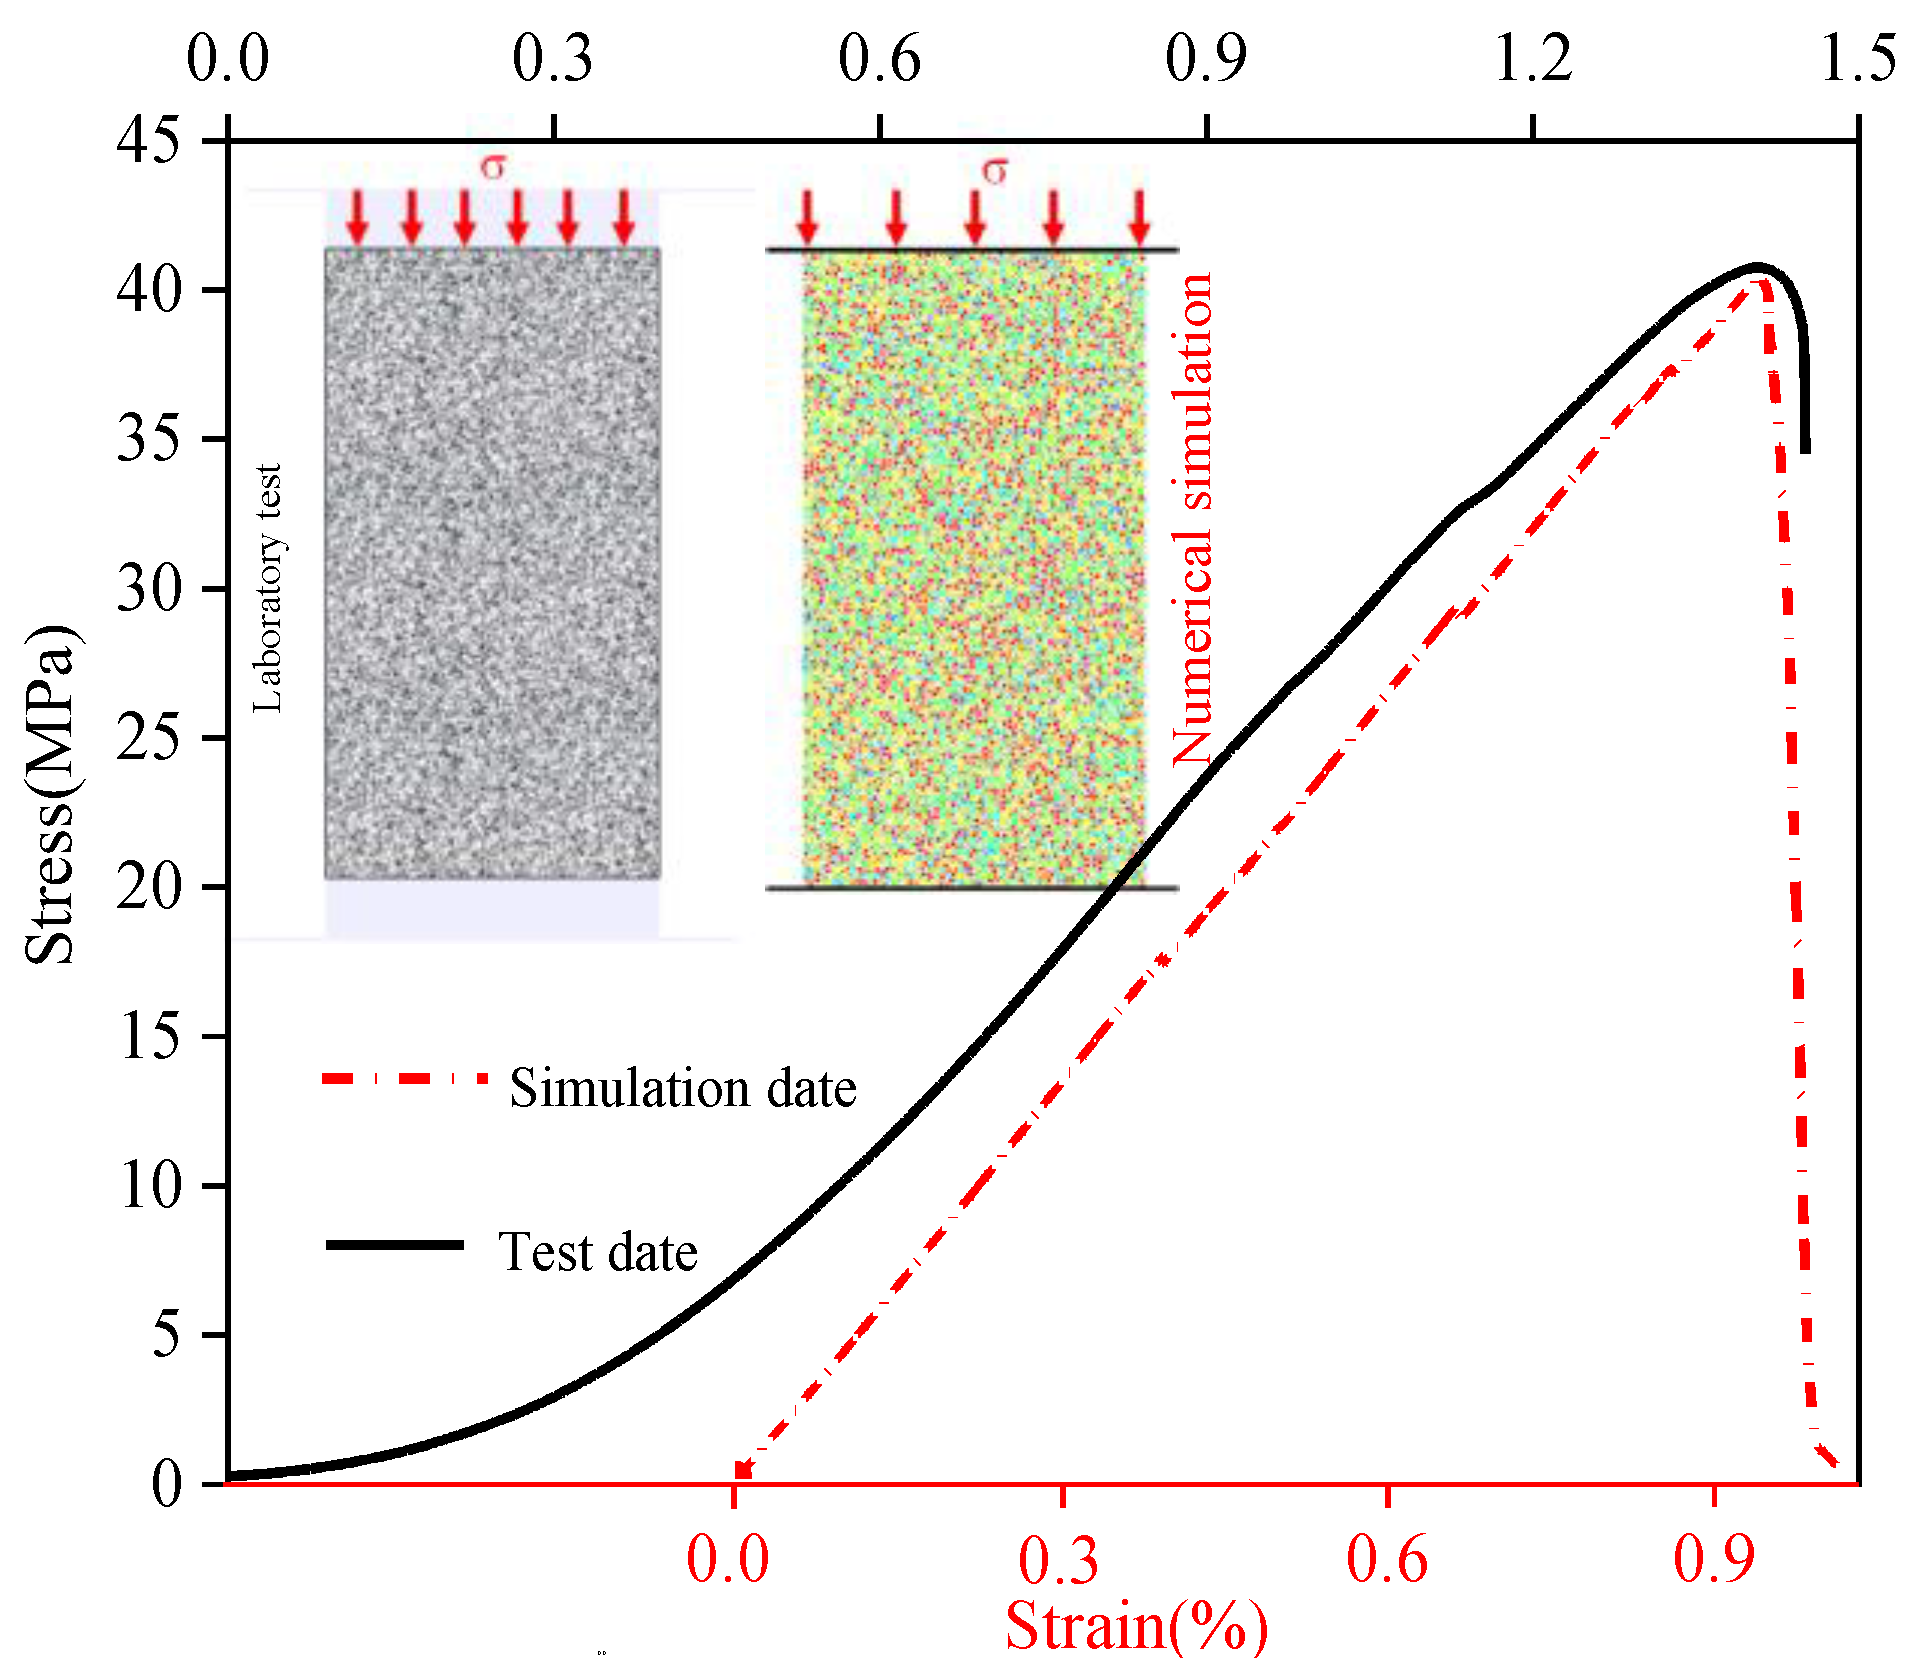
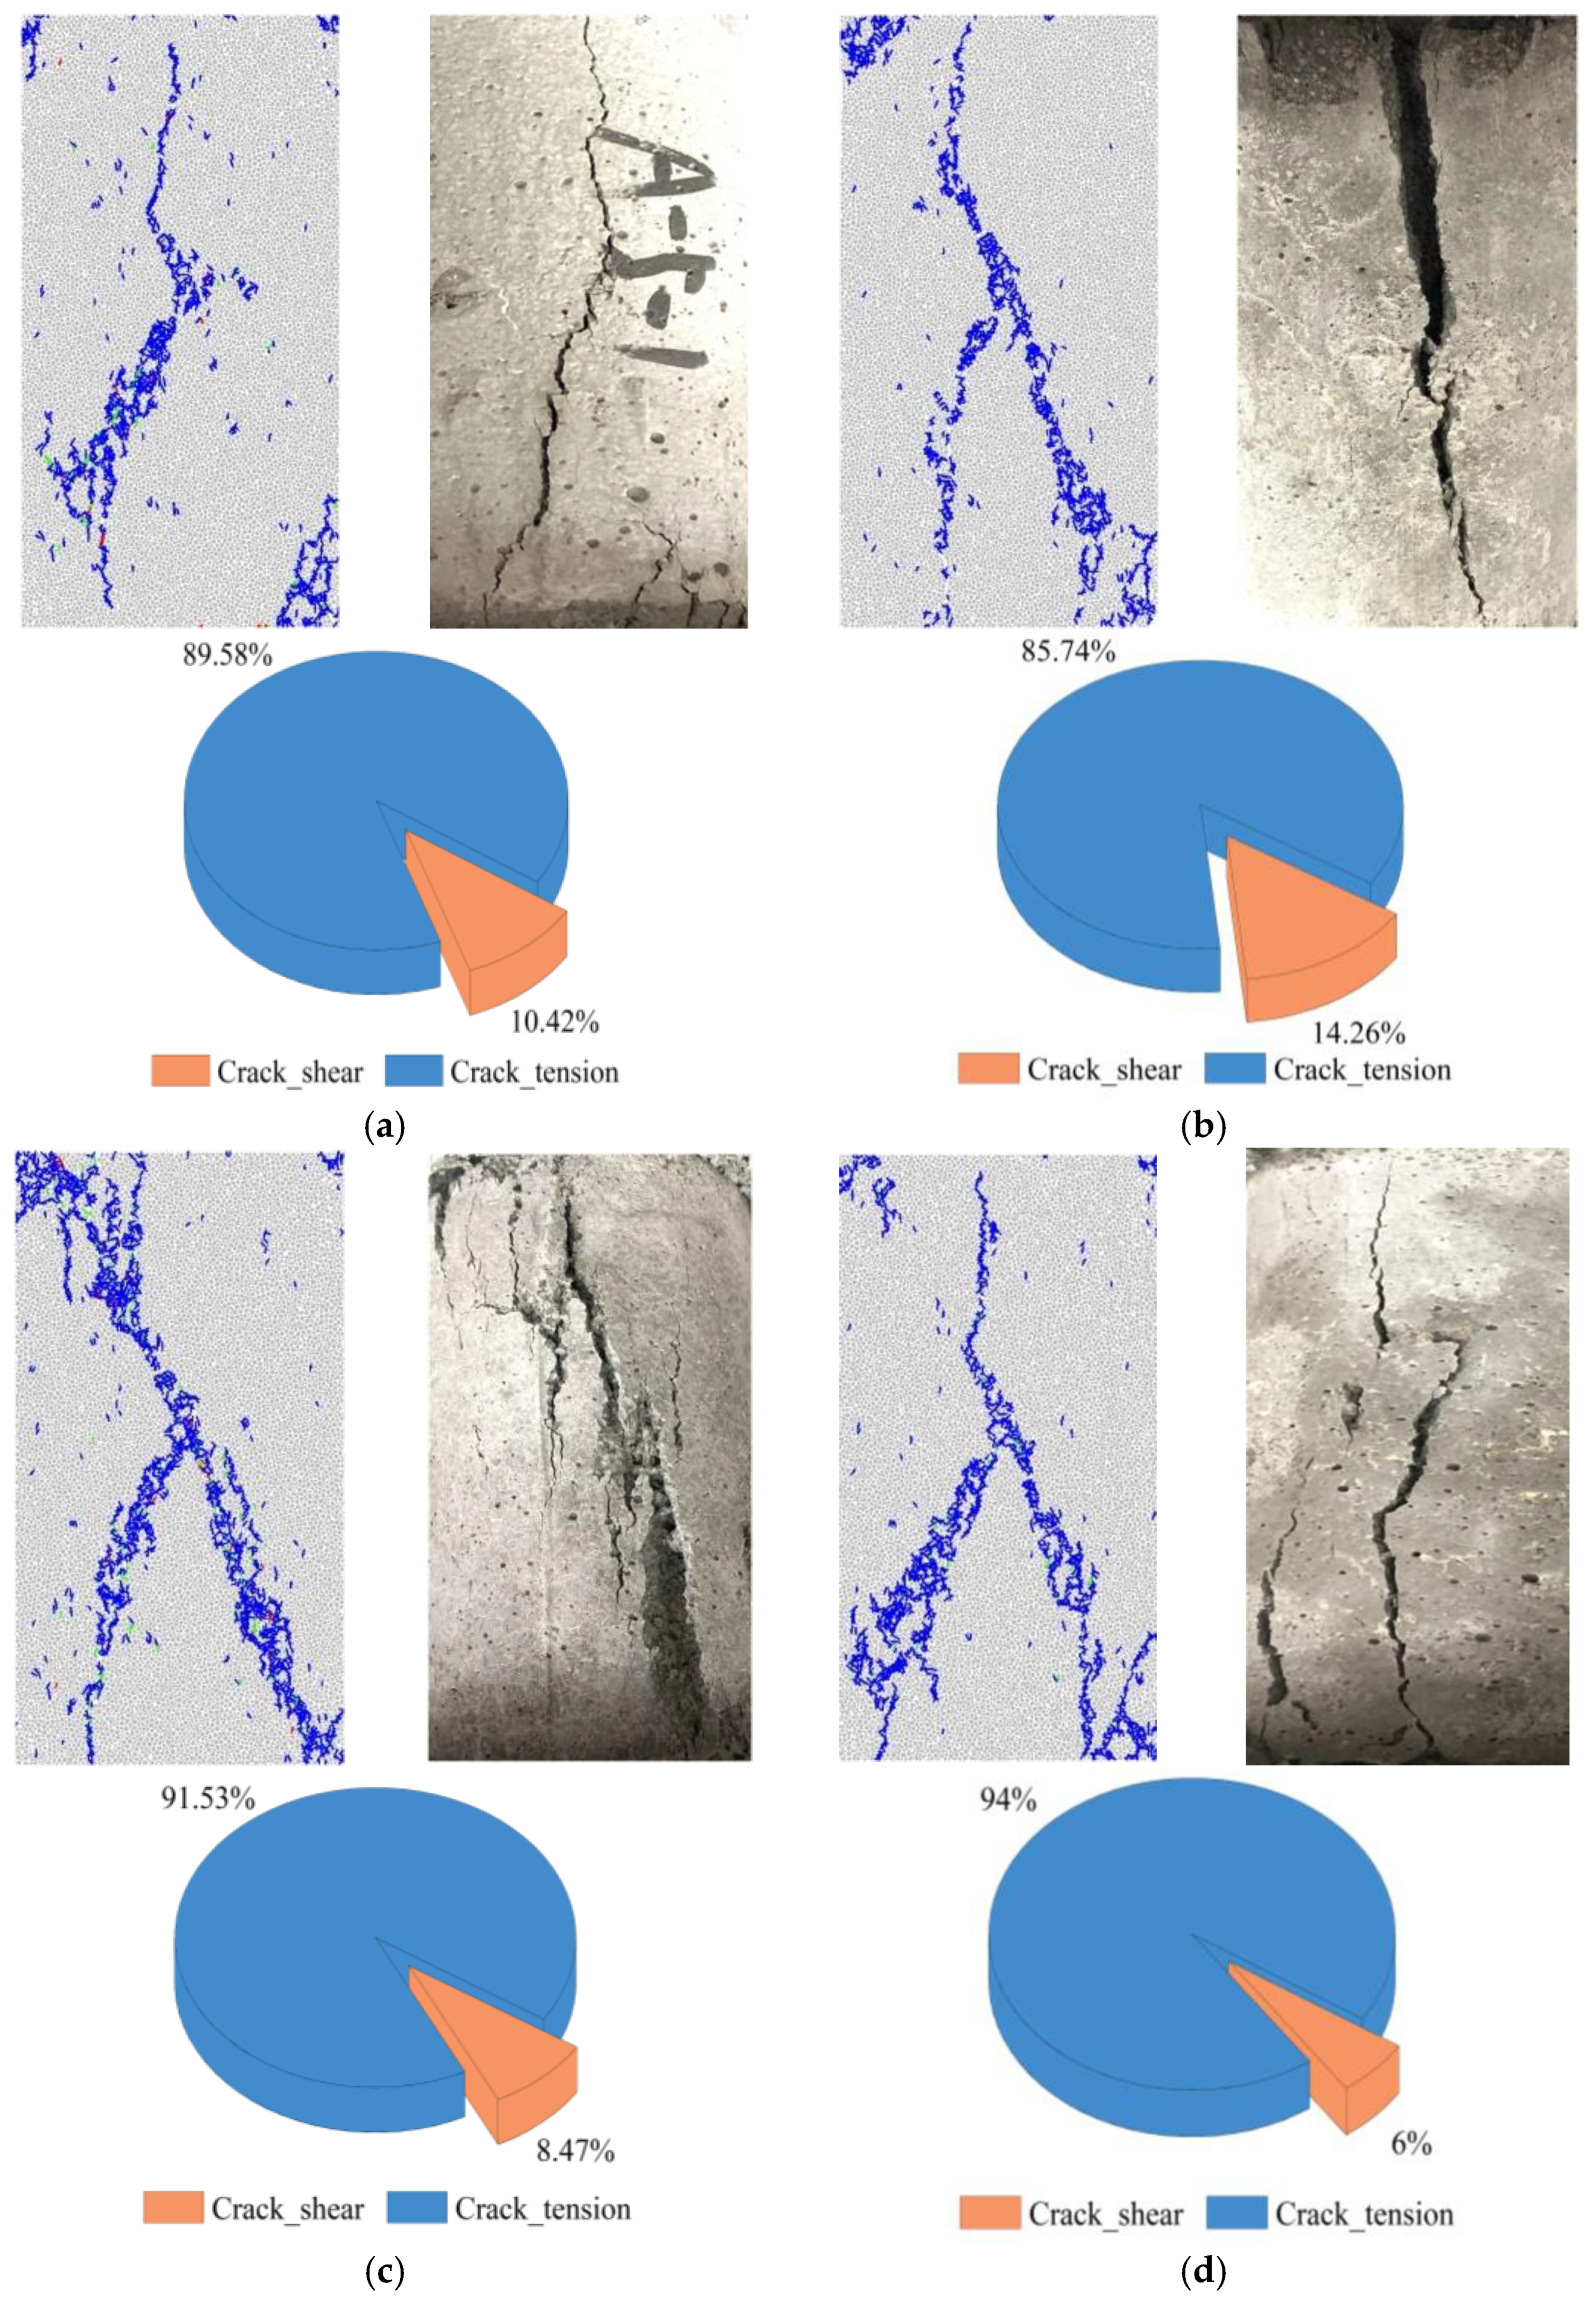
Figure 8 shows the stress-strain curve and numerical simulation stress-strain curve of the mechanical test of the 10 cycles. From the figure, the variation trend of the stress-strain curve simulated by the discrete element program is basically consistent with that of the indoor mechanical test curve. The values of the elastic modulus and peak strength of the discrete element program were basically consistent with those of the indoor mechanical test. The indoor mechanical test results and numerical simulation results of other freeze-thaw cycles are shown in Table 7. It can be seen that the indoor mechanics test results with different cycles were basically similar to the numerical simulation results. The errors in elastic modulus and peak strength were less than 1 MPa and 0.1 Gpa, respectively. Figure 9 shows the final failure mode under different freeze-thaw cycles of internal mechanical testing and numerical simulation. The failure mode of the numerical simulation under different cycles was basically consistent with the results of internal mechanics tests. Furthermore, the cracks caused by internal force failure were mainly tensile cracks, accounting for 85.74~64%. There are fewer shear cracks, accounting for 6~14.26%. Combined with the failure mode and crack type analysis in the indoor test and numerical simulation, it can be seen that the failure mode under different cycles was mainly a tensile splitting failure, accompanied by local shear failure.
In the numerical simulation of the particle flow program, mechanical energy can be divided into body energy and contact energy. Body energy is a change in energy caused by a gravitational load or an applied load. Contact energy is the energy distribution defined in the contact model. In this law of energy evolution, the total energy is a kind of body energy, which is the energy generated by the boundary movement of the wall. Therein, the strain energy and the bond strain energy are the contact energies in the parallel bond model, which are stored in the linear spring and parallel spring, respectively.
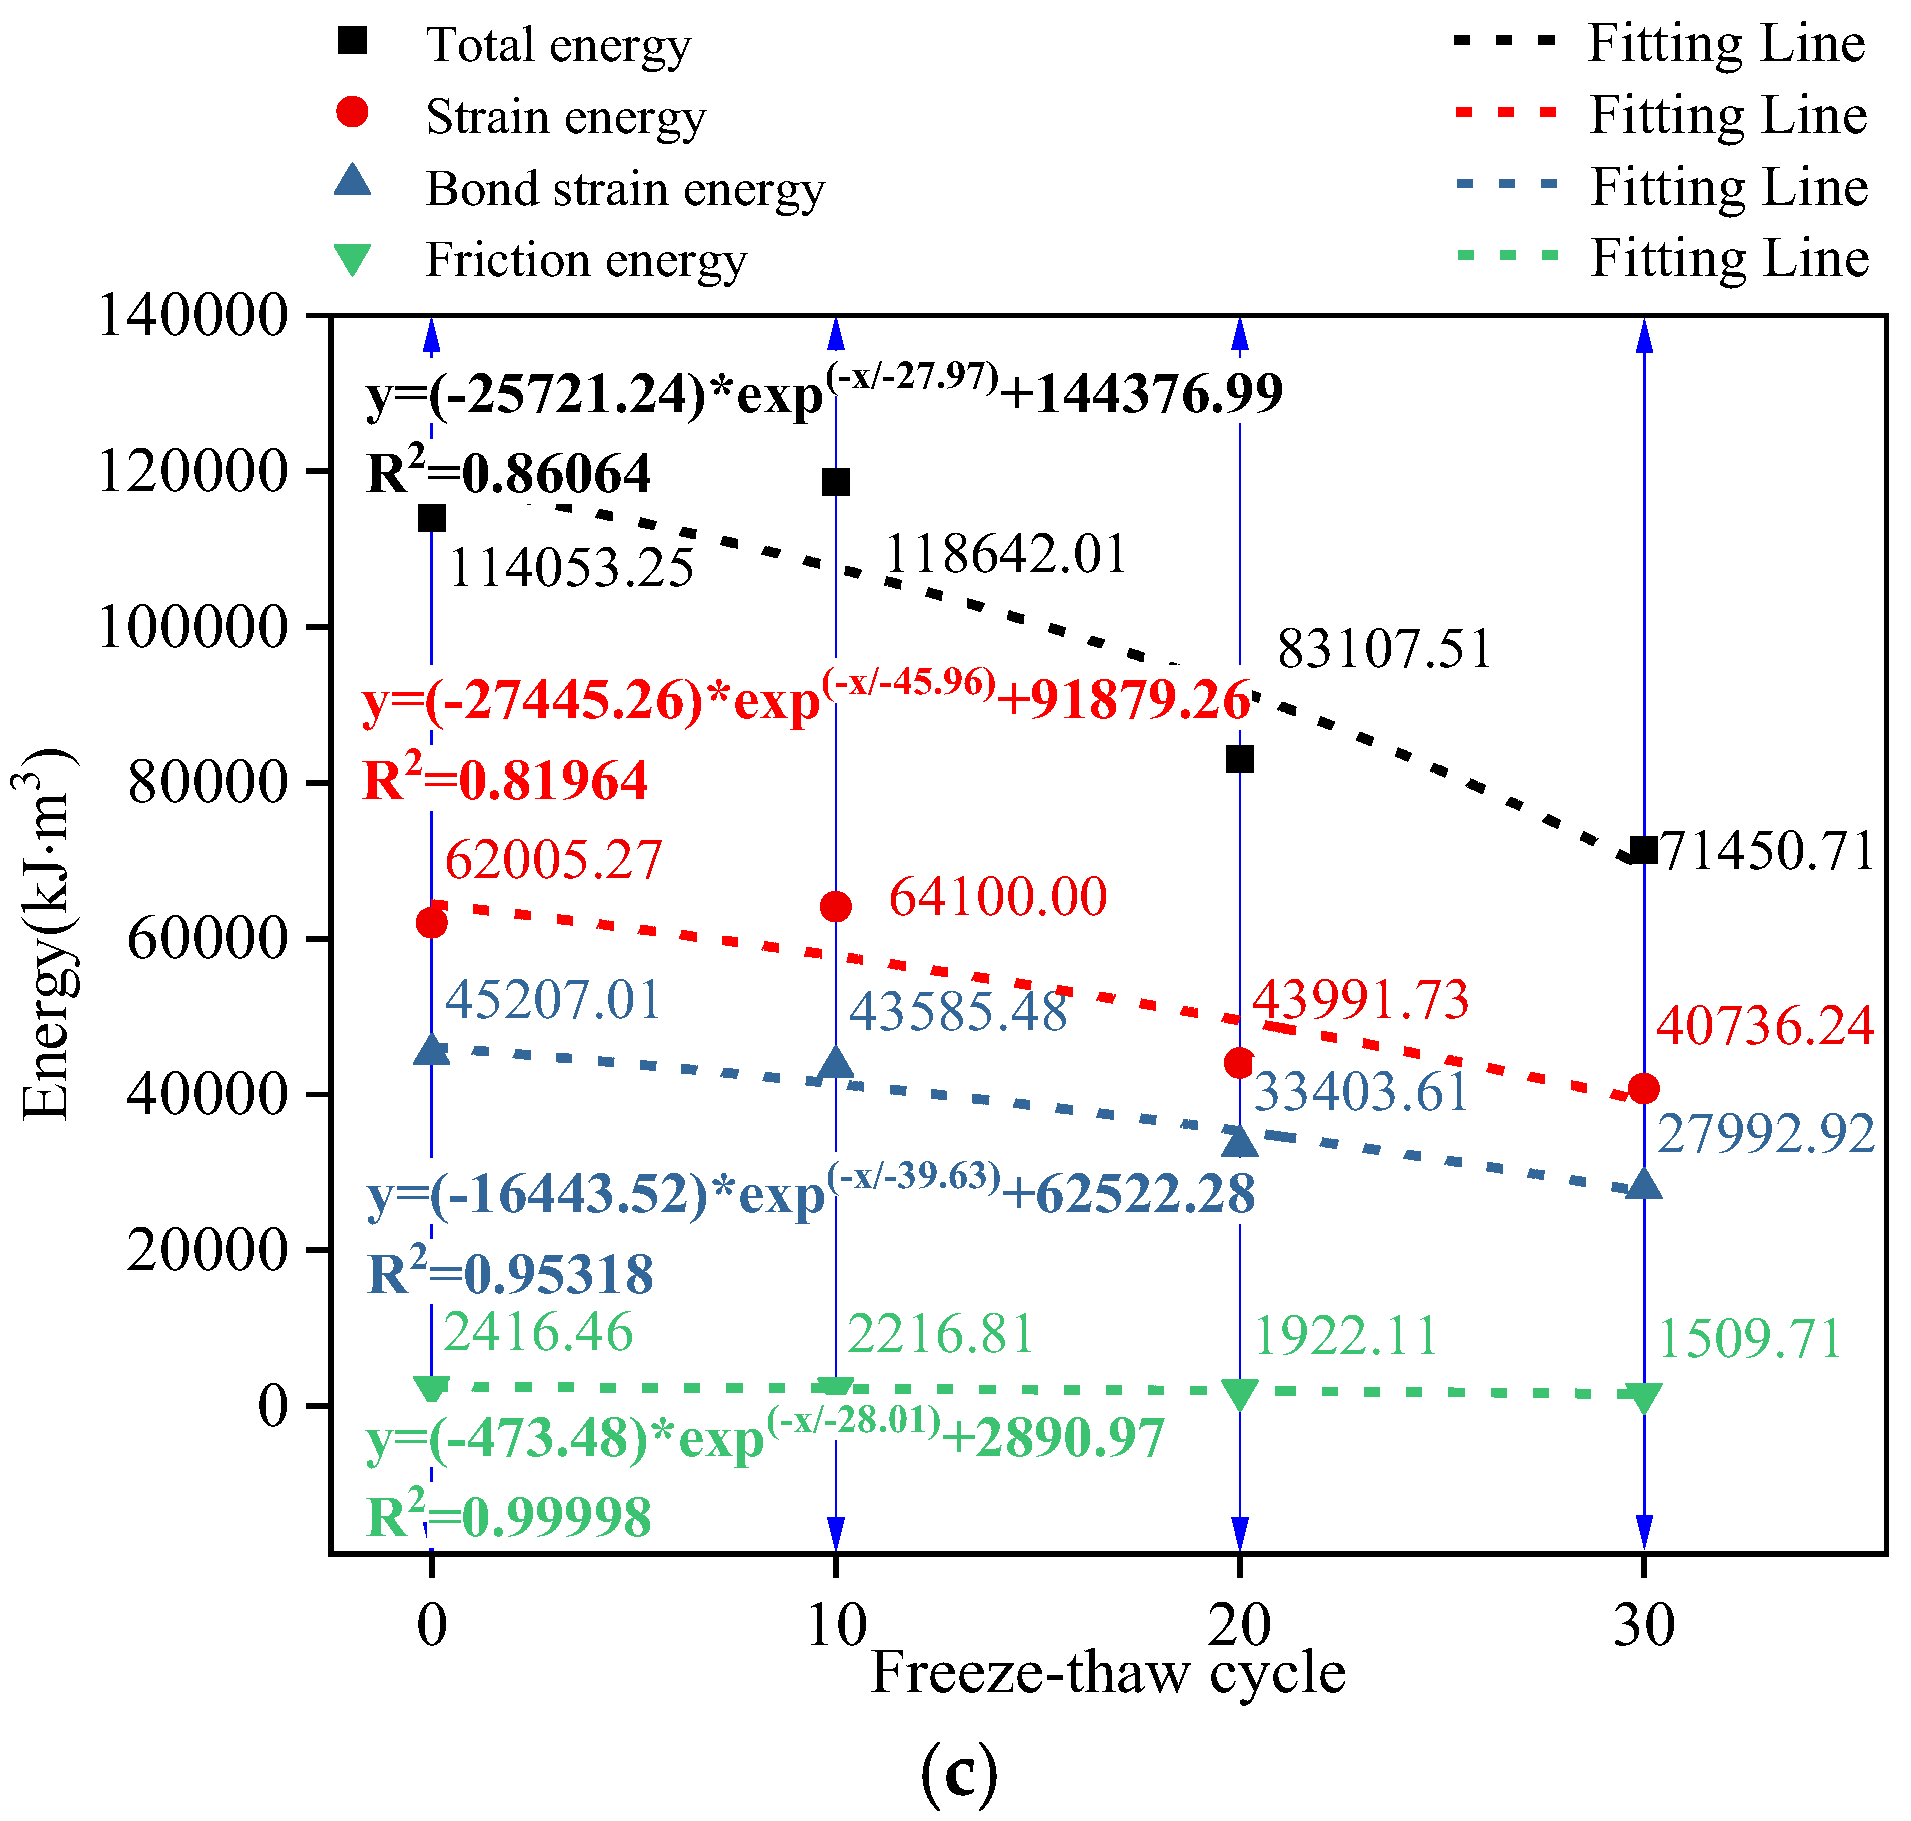
Figure 10 shows the evolution of the number of cracks and four types of energies under different freeze-thaw cycles. From the figure, although the F-T cycle is different, the number of cracks in the process of load failure and the evolution of different types of energy are consistent. Based on the crack propagation of the 0 cycle, the crack propagation and energy evolution were divided into four stages. The first stage is the crack-free stage (0–0.44σc). As the force of the specimen gradually increased, the total energy, strain energy, and bond strain energy showed an increasing trend. At this stage, there were no cracks and no frictional energy. The total energy was basically converted into strain energy and cementation energy, which were stored in linear springs and parallel linear springs. The second stage is the slow growth of cracks (0.44σc–0.75σc). At this stage, the energy absorption rates for total energy, strain energy, and cementation energy increased, and the different energies showed an increasing trend. Cracks and frictional energy appeared inside the specimen, and there was a slow, increasing trend. It can be seen that the friction energy was synchronized with the crack propagation. When cracks appeared, the friction energy also appeared. Moreover, the friction energy showed an increasing trend with the increase in the number of cracks. When the strain between particles reached a certain degree, cracks occurred between different particles. The energy consumed by friction between particles when they are cracked is generated by both friction energies. Since the cracks inside the specimen were in the stage of germination and slow growth, the frictional energy was small. Therefore, the cementation energy and strain energy were much greater than the friction energy. The third stage is the crack acceleration growth stage (0.75σc–σc). In the stage of accelerated crack growth, the total energy, strain energy, and bond strain energy continued to show an increasing trend. The number of cracks increased, and the growth rate of friction energy increased gradually. More and more of the total energy is dissipated by the frictional energy that overcomes the sliding of the particles. The fourth stage is the rapid growth of cracks (σc). In the post-peak phase, the crack spread rapidly, and the friction energy increased rapidly. The bearing capacity of the specimen was weakened, and the rate of total energy growth decreased. The strain energy and boundary energy stored by the linear spring and parallel bond spring were released rapidly due to the failure, and the variation trend changed from increasing to decreasing.
In order to explore the intrinsic relationship between the number of freeze-thaw cycles and different types of energy, the energy values of different stages were fitted to the F-T cycle. The fitting results are shown in Figure 11. The results showed that when the value points are 0.44σc and 0.75σc, the total energy, strain energy, bond strain energy, and friction energy have a good exponential relationship with the freeze-thaw cycles, the fitting coefficients of which are above 0.94. With the gradual increase in the number of freeze-thaw cycles, the total energy, strain energy, bond strain energy, and friction energy all showed an exponentially decreasing trend. At the point of peak strength (σc), the number of freeze-thaw cycles was exponentially related to the total energy and strain energy, and the fitting coefficient was 0.81964~0.86064. However, the bond strain energy and friction energy conformed severally to a good exponential relationship with freeze-thaw cycles, for which the fitting coefficient was above 0.95. While the number of freeze-thaw cycles gradually increased, the total energy, strain energy, bond strain energy, and friction energy all showed the law of exponential decrease.
In conclusion, peak compressive strength and different types of energy have a good exponential relationship with the F-T cycle. The peak strength and different types of energy showed a decreasing trend with the increase in the number of freeze-thaw cycles. The test results can provide data support for the safety and stability analysis of rock slopes, such as mine slopes and highway shoulder slopes in low-temperature environments, providing guidance for their instability prevention.
4. Conclusions
In this paper, the effects of the F-T cycle on the micropore structure and macroscopic mechanical properties of specimens were analyzed by carrying out nuclear magnetic resonance detection and mechanical tests of sandstone-like materials. The intrinsic relationship between porosity and compressive strength was explored. Simultaneously, the discrete element software (PFC2D) was used to simulate the stress-strain curve of the uniaxial compression test under different freeze-thaw times. Based on the built-in energy tracking command of the particle flow software, the evolution of different energies under load was analyzed. The influence of the F-T cycle on different energies was studied. Finally, the intrinsic relationship between the number of freeze-thaw cycles and the existence of different energies was discussed. The main conclusions are as follows:
- (1)
- The microscopic structure is mainly composed of micropores, followed by mesopores, and lastly macropores. The micropores and mesopores showed an increasing trend with the increase in the number of freeze-thaw cycles, while the change in large porosity was not obvious. In addition, the porosity conformed to a good exponential relationship with the number of freeze-thaw cycles and increased exponentially with the increase in the cycles.
- (2)
- The influence of the F-T cycle on elastic modulus is the largest, followed by peak strength, and the influence of peak strain is the least. The peak strength and elastic modulus had a good exponential relationship with the number of freeze-thaw cycles. With the increase in the number of freeze-thaw cycles, the peak strength and elastic modulus showed an exponentially decreasing trend, while the peak strain showed an exponentially increasing trend. In addition, there was a good exponential relationship between the porosity and the uniaxial compressive strength. The uniaxial compressive strength decreases exponentially with the increase in porosity.
- (3)
- The failure mode of mechanical testing under different F-T cycle conditions was similar to that of numerical simulation. The failure is mainly tensile, accompanied by shear failure locally. The failure mode is mainly tensile failure, accompanied by shear failure. In energy evolution, strain energy and bond strain energy showed an increasing trend before the peak intensity and a decreasing trend after the peak intensity. The friction energy and crack synchronously showed an accelerated increasing trend before the peak strength and a rapid increasing trend after the peak. The total, strain, bond strain, and friction energy had an exponential relationship with the number of freeze-thaw cycles. With the increasing number of freeze-thaw cycles, different types of energy showed an exponentially decreasing trend.
Author Contributions
Conceptualization, H.D. and S.Y.; methodology, Y.X. and G.T.; software, G.T.; validation, Y.X. and G.T.; formal analysis, G.T.; investigation, Y.X.; resources, G.T.; data curation, G.T.; writing—original draft preparation, G.T.; writing—review and editing, Y.X.; visualization, G.T.; supervision, H.D.; project administration, H.D.; funding acquisition, H.D. and S.Y. All authors have read and agreed to the published version of the manuscript.
Funding
This research was supported by the National Natural Science Foundation of China (Grant No. 51874352, 52004327), the China National Key R&D Program during the 14th Five-year Plan Period (Grant No. 2021YFC2900400), Science and Technology Project of the Education Department of Jiangxi Province (Grant No. GJJ210867) and Doctoral Scientific Research Foundation of Jiangxi University of Science and Technology (Grant No. 2021003, 205200100581).
Data Availability Statement
The data presented in this study are available on request from the corresponding author.
Conflicts of Interest
The authors declare no conflict of interest.
Abbreviations
| NMR | Nuclear magnetic resonance |
| F-T cycle | Freeze-thaw cycle |
| Kratio | Normal-to-shear stiffness ratio |
| Emod | Effective modulus |
| Pb_Emod | Bond effective modulus |
| Pb_coh | Cohesion |
| Pb_ten | Tensile strength |
| pb_fa | Friction angle |
References
- Al-Omari, A.; Beck, K.; Brunetaud, X.; Török, Á.; Al-Mukhtar, M. Critical degree of saturation: A control factor of freeze-thaw damage of porous limestones at Castle of Chambord, France. Eng. Geol. 2015, 185, 71–80. [Google Scholar] [CrossRef]
- Li, J.; Kaunda, R.; Zhou, K. Experimental investigations on the effects of ambient freeze-thaw cycling on dynamic properties and rock pore structure deterioration of sandstone. Cold Reg. Sci. Technol. 2018, 154, 133–141. [Google Scholar] [CrossRef]
- Li, J.; Zhu, L.; Zhou, K.; Liu, H.W.; Cao, S.P. Damage characteristics of sandstone pore structure under freeze-thaw cycles. Rock Soil Mech. 2020, 9, 3524–3532. [Google Scholar]
- Zhou, K.; Li, B.; Li, J.; Deng, H.; Bin, F. Microscopic damage and dynamic mechanical properties of rock under freeze-thaw environment. Trans. Nonferrous Met. Soc. China 2015, 25, 1254–1261. [Google Scholar] [CrossRef]
- Li, J.; Zhou, K.; Liu, W.; Deng, H. NMR research on deterioration characteristics of microscopic structure of sandstones in freeze-thaw cycles. Trans. Nonferrous Met. Soc. China 2016, 26, 2997–3003. [Google Scholar] [CrossRef]
- Gao, F.; Wang, Q.; Deng, H.; Zhang, J.; Tian, W.; Ke, B. Coupled effects of chemical environments and freeze–thaw cycles on damage characteristics of red sandstone. Bull. Eng. Geol. Environ. 2017, 76, 1481–1490. [Google Scholar] [CrossRef]
- Liu, C.; Deng, H.; Zhao, H.; Zhang, J. Effects of freeze-thaw treatment on the dynamic tensile strength of granite using the Brazilian test. Cold Reg. Sci. Technol. 2018, 155, 327–332. [Google Scholar] [CrossRef]
- Gao, F.; Xiong, X.; Xu, C.; Zhou, K. Mechanical property deterioration characteristics and a new constitutive model for rocks subjected to freeze-thaw weathering process. Int. J. Rock Mech. Min. Sci. 2021, 140, 104642. [Google Scholar] [CrossRef]
- Gao, F.; Xiong, X.; Zhou, K.; Li, J.; Shi, W. Strength deterioration model of saturated sandstone under freeze-thaw cycles. Rock Soil Mech. 2019, 40, 926–932. [Google Scholar]
- Yang, C.; Zhou, K.; Xiong, X.; Deng, H.; Pan, Z. Experimental investigation on rock mechanical properties and infrared radiation characteristics with freeze-thaw cycle treatment. Cold Reg. Sci. Technol. 2021, 183, 103232. [Google Scholar] [CrossRef]
- Li, J.; Zhu, L.; Zhou, K.; Chen, H.; Gao, L.; Lin, Y.; Shen, Y. Non-linear creep damage model of sandstone under freeze-thaw cycle. J. Cent. South Univ. 2021, 28, 954–967. [Google Scholar] [CrossRef]
- Xie, H.; Ju, Y.; Li, L. Criteria for strength and structural failure of rocks based on energy dissipation and energy release principles. Chin. J. Rock Mech. Eng. 2005, 17, 3003–3010. (In Chinese) [Google Scholar]
- Xie, H.; Ju, Y.; Li, L.; Peng, R.D. Energy mechanism of deformation and failure of rock masses. Chin. J. Rock Mech. Eng. 2008, 9, 1729–1740. (In Chinese) [Google Scholar]
- Deng, H.; Yu, S.; Deng, J.; Ke, B.; Bin, F. Experimental Investigation on Energy Mechanism of Freezing-Thawing Treated Sandstone under Uniaxial Static Compression. KSCE J. Civ. Eng. 2019, 23, 2074–2082. [Google Scholar] [CrossRef]
- Feng, Q.; Jin, J.; Zhang, S.; Liu, W.; Yang, X.; Li, W. Study on a Damage Model and Uniaxial Compression Simulation Method of Frozen–Thawed Rock. Rock Mech. Rock Eng. 2022, 55, 187–211. [Google Scholar] [CrossRef]
- Gao, F.; Cao, S.; Zhou, K.; Lin, Y.; Zhu, L. Damage characteristics and energy-dissipation mechanism of frozen-thawed sandstone subjected to loading. Cold Reg. Sci. Technol. 2020, 169, 102920. [Google Scholar] [CrossRef]
- Lazar, M.; Apostu, I.; Faur, F.; Rotunjanu, I. Factors influencing the flooding process of former coal open-pits. Min. Miner. Depos. 2021, 15, 124–133. [Google Scholar] [CrossRef]
- Jiang, C.; Guo, W.; Chen, H.; Zhu, Y.; Jin, C. Effect of filler type and content on mechanical properties and microstructure of sand concrete made with superfine waste sand. Constr. Build. Mater. 2018, 192, 442–449. [Google Scholar] [CrossRef]
- Diambra, A.; Festugato, L.; Ibraim, E.; Peccin da Silva, A.; Consoli, N.C. Modelling tensile/compressive strength ratio of artificially cemented clean sand. Soils Found. 2018, 58, 199–211. [Google Scholar] [CrossRef]
- Ueyendah, S.; Lezgy-Nazargah, M.; Eskandari-Naddaf, H.; Emamian, S.A. Predicting the mechanical properties of cement mortar using the support vector machine approach. Constr. Build. Mater. 2021, 291, 123396. [Google Scholar] [CrossRef]
- Chuta, E.; Colin, J.; Jeong, J. The impact of the water-to-cement ratio on the surface morphology of cementitious materials. J. Build. Eng. 2020, 32, 101716. [Google Scholar] [CrossRef]
- Deng, H.; Tian, G.; Yu, S.; Jiang, Z.; Zhong, Z.; Zhang, Y. Research on Strength Prediction Model of Sand-like Material Based on Nuclear Magnetic Resonance and Fractal Theory. Appl. Sci. 2020, 10, 6601. [Google Scholar] [CrossRef]
- Tian, G.; Deng, H.; Xiao, Y. Correlation Analysis between Microscopic Pore Parameters and Macroscopic Mechanical Properties of Rock-like Materials from the Perspective of Water-Cement Ratio and Sand-Cement Ratio. Materials 2022, 15, 2632. [Google Scholar] [CrossRef] [PubMed]
- Tian, G.; Deng, H.; Xiao, Y.; Yu, S. Experimental Study of Multi-Angle Effects of Micron-Silica Fume on Micro-Pore Structure and Macroscopic Mechanical Properties of Rock-like Material Based on NMR and SEM. Materials 2022, 15, 3388. [Google Scholar] [CrossRef]
- SL/T 264-2020; Rock Test Regulations for Water Conservancy and Hydropower Engineering. People’s Republic of China Ministry of Water Resources: Beijing, China, 2020. (In Chinese)
- Cundall, P.; Strack, O. A discrete numerical model for granular assemblies. Geotechnique 1979, 29, 47–65. [Google Scholar] [CrossRef]
- Zhao, Z.; Wang, X.; Wen, Z. Analysis of Rock Damage Characteristics Based on Particle Discrete Element Model. Geotech. Geol. Eng. 2018, 36, 897–904. [Google Scholar] [CrossRef]
- Ning, J.; Liu, X.; Tan, Y.; Wang, J.; Tian, C. Relationship of box counting of fractured rock mass with Hoek–Brown parameters using particle flow simulation. Geomech. Eng. 2015, 9, 619–629. [Google Scholar] [CrossRef]
- Chen, P.Y. Effects of microparameters on macroparameters of flat-jointed bonded-particle materials and suggestions on trial-and-error method. Geotech. Geol. Eng. 2017, 35, 663–677. [Google Scholar] [CrossRef]
- Tan, X.; Chen, W.; Liu, H.; Wang, L.; Ma, W.; Chan, A.H.C. A unified model for frost heave pressure in the rock with a penny-shaped fracture during freezing. Cold Reg. Sci. Technol. 2018, 153, 1–9. [Google Scholar] [CrossRef]
- Huang, S.; Ye, Y.; Cui, X.; Cheng, A.; Liu, G. Theoretical and experimental study of the frost heaving characteristics of the saturated sandstone under low temperature. Cold Reg. Sci. Technol. 2020, 174, 103036. [Google Scholar] [CrossRef]
- Deprez, M.; Kock, T.; De Schutter, G.; Cnudde, V. A review on freeze-thaw action and weathering of rocks. Earth-Sci. Rev. 2020, 203, 103143. [Google Scholar] [CrossRef]
- Huang, S.; Lu, Z.; Ye, Z.; Xin, Z. An elastoplastic model of frost deformation for the porous rock under freeze-thaw. Eng. Geol. 2020, 278, 105820. [Google Scholar] [CrossRef]
- Huang, S.; Yu, S.; Ye, Y.; Ye, Z.; Cheng, A. Pore structure change and physico-mechanical properties deterioration of sandstone suffering freeze-thaw actions. Constr. Build. Mater. 2022, 330, 127200. [Google Scholar] [CrossRef]
Figure 1.
Test procedures.

Figure 2.
Complete freeze—thaw cycle process.

Figure 3.
Pore radius division.

Figure 4.
The diagram of the parallel bond model. is the surface gap between particles and is the normal stiffness of a linear spring. is the shear stiffness of a linear spring, and is the normal stiffness of the parallel bond. and are the shear stiffness and the normal strength of the parallel bonds. is the shear strength of the parallel bond and is the coefficient of friction.

Figure 5.
The effect of freezing-thaw cycles on microscopic pore structure. (a) Relaxation distribution; (b) porosity.
Figure 5.
The effect of freezing-thaw cycles on microscopic pore structure. (a) Relaxation distribution; (b) porosity.

Figure 6.
Propagation and development of pores and cracks under freeze-thaw cycles.

Figure 7.
The influence of the number of freeze-thaw cycles on physical and mechanical parameters. (a) Stress-strain curve; (b) peak strength and elastic modulus; and (c) peak strain and porosity.
Figure 7.
The influence of the number of freeze-thaw cycles on physical and mechanical parameters. (a) Stress-strain curve; (b) peak strength and elastic modulus; and (c) peak strain and porosity.


Figure 8.
Indoor mechanics test and numerical simulation.

Figure 9.
Sample destruction mode under different freeze-thaw cycles: (a) 0 F-T cycle; (b) 10 F-T cycle; (c) 20 F-T cycle; and (d) 30 F-T cycle.
Figure 9.
Sample destruction mode under different freeze-thaw cycles: (a) 0 F-T cycle; (b) 10 F-T cycle; (c) 20 F-T cycle; and (d) 30 F-T cycle.

Figure 10.
The evolution of different types of energy in different F-T cycles: (a) 0 cycle; (b) 10 cycle; (c) 20 cycle; and (d) 30 cycle.
Figure 10.
The evolution of different types of energy in different F-T cycles: (a) 0 cycle; (b) 10 cycle; (c) 20 cycle; and (d) 30 cycle.


Figure 11.
The intrinsic relationship between the number of freeze-thaw cycles and different types of energy: (a) 0.44σc; (b) 0.75σc; and (c) σc.
Figure 11.
The intrinsic relationship between the number of freeze-thaw cycles and different types of energy: (a) 0.44σc; (b) 0.75σc; and (c) σc.


Table 1.
Chemical composition of Portland cement.
| Material | Traits | Main Ingredients | |||
|---|---|---|---|---|---|
| 3CaO·SiO2 | 2CaO·SiO2 | 3CaO·Al2O3 | 4CaO·Al2O3·Fe2O3 | ||
| Portland cement | Taupe powder | 52.8% | 20.7% | 11.5% | 8.8% |
Table 2.
Detailed parameters of aggregate and admixture.
| Material | Traits | Main Ingredients | Particle Size | Density (g/cm3) |
|---|---|---|---|---|
| Quartz sand | Yellow and white particles | Quartz > 99% | 0.5–1.0 mm | 1.49 |
| Naphthalene water reducer | Brown-yellow powder | β-Naphthal-enesulfonate sodium formaldehyde condensate | - | - |
| Silica fume | White powder | SiO2 > 99% | 1 μm | 2.2–2.6 |
Table 3.
Statistics test results of a sandstone-like material and sandstone.
| Material | Density (g/cm3) | Porosity (%) | Uniaxial Compressive Strength (MPa) |
|---|---|---|---|
| Sandstone | 2.33 | 3.186 | 32.01 |
| Sandstone-like material | 2.31 | 3.431 | 33.64 |
Table 4.
The test results of microscopic pores under different freezing-thawing cycles.
| F-T Cycle | Porosity (%) | The Peak of Micropore (%) | The Peak of Mesopore (%) | The Peak of Macropore (%) |
|---|---|---|---|---|
| 0 | 3.449 | 0.1197 | 0.00922 | 0.00188 |
| 10 | 3.553 | 0.11857 | 0.01483 | 0.00411 |
| 20 | 3.631 | 0.12249 | 0.01491 | 0.00366 |
| 30 | 3.709 | 0.12329 | 0.02102 | 0.00284 |
Table 5.
The statistical results of mechanical parameters under different freeze-thaw cycles.
| F-T Cycle | Peak Strength (MPa) | Elastic Modulus (GPa) | Peak Strain (%) |
|---|---|---|---|
| 0 | 40.75 | 4.173 | 1.40612 |
| 10 | 39.73 | 4.021 | 1.49959 |
| 20 | 31.72 | 3.965 | 1.55147 |
| 30 | 17.87 | 1.263 | 2.25087 |
| Change Ratio | 56.15% | 69.73% | 60.08% |
Table 6.
Numerical simulation parameters under different freeze-thaw cycles.
| F-T Cycle | Density (kg/m3) | Radius (m) | Kratio | Porosity | Fric | Emod\Pb-Emod (GPa) | Pb_coh/Pb _ten (MPa) | pb_fa (°) |
|---|---|---|---|---|---|---|---|---|
| 0 | 2000 | 0.002–0.005 | 1.5 | 0.03 | 0.5 | 5.66 | 37.7 | 20 |
| 10 | 5.53 | 42.6 | 50 | |||||
| 20 | 5.12 | 30.7 | 40 | |||||
| 30 | 1.16 | 16.3 | 20 |
Table 7.
Indoor mechanics test results and numerical simulation results under different freeze-thaw cycles.
Table 7.
Indoor mechanics test results and numerical simulation results under different freeze-thaw cycles.
| Mechanical Properties | Peak Stress (MPa) | Elastic Modulus (GPa) | ||||||
|---|---|---|---|---|---|---|---|---|
| F-T cycle | 0 | 10 | 20 | 30 | 0 | 10 | 20 | 30 |
| Laboratory test | 40.75 | 39.73 | 31.72 | 17.87 | 4.173 | 4.021 | 3.965 | 1.263 |
| Numerical simulation | 40.19 | 38.95 | 32.62 | 17.78 | 4.259 | 4.017 | 3.909 | 1.312 |
| Differential value | 0.56 | 0.78 | 0.9 | 0.09 | 0.086 | 0.004 | 0.056 | 0.049 |
Disclaimer/Publisher’s Note: The statements, opinions and data contained in all publications are solely those of the individual author(s) and contributor(s) and not of MDPI and/or the editor(s). MDPI and/or the editor(s) disclaim responsibility for any injury to people or property resulting from any ideas, methods, instructions or products referred to in the content. |
© 2023 by the authors. Licensee MDPI, Basel, Switzerland. This article is an open access article distributed under the terms and conditions of the Creative Commons Attribution (CC BY) license (https://creativecommons.org/licenses/by/4.0/).
Share and Cite
MDPI and ACS Style
Xiao, Y.; Deng, H.; Tian, G.; Yu, S. Analysis of Microscopic Pore Characteristics and Macroscopic Energy Evolution of Rock Materials under Freeze-Thaw Cycle Conditions. Mathematics 2023, 11, 710. https://doi.org/10.3390/math11030710
AMA Style
Xiao Y, Deng H, Tian G, Yu S. Analysis of Microscopic Pore Characteristics and Macroscopic Energy Evolution of Rock Materials under Freeze-Thaw Cycle Conditions. Mathematics. 2023; 11(3):710. https://doi.org/10.3390/math11030710
Chicago/Turabian StyleXiao, Yigai, Hongwei Deng, Guanglin Tian, and Songtao Yu. 2023. "Analysis of Microscopic Pore Characteristics and Macroscopic Energy Evolution of Rock Materials under Freeze-Thaw Cycle Conditions" Mathematics 11, no. 3: 710. https://doi.org/10.3390/math11030710
Note that from the first issue of 2016, this journal uses article numbers instead of page numbers. See further details here.