
Driver Response Time and Age Impact on the Reaction Time of Drivers: A Driving Simulator Study among Professional-Truck Drivers


1
Department of Road and Urban Transport, Faculty of Operation and Economics of Transport and Communications, University of Zilina, Univerzitna 1, SK-010 26 Zilina, Slovakia
2
Department of Economics, Faculty of Operation and Economics of Transport and Communications, University of Zilina, Univerzitna 1, SK-010 26 Zilina, Slovakia
3
Department of Logistics, Faculty of Transportation and Logistics, Avcilar Campus, Istanbul University, 34322 Istanbul, Turkey
*
Author to whom correspondence should be addressed.
Mathematics 2022, 10(9), 1489; https://doi.org/10.3390/math10091489
Submission received: 24 March 2022
/
Revised: 21 April 2022
/
Accepted: 26 April 2022
/
Published: 29 April 2022
(This article belongs to the Topic Engineering Mathematics)
Abstract
:Drivers’ response time means that drivers act after a judgment is made when an emergency action signal is needed. Drivers have different feelings while driving, and the response time to sudden situations differs. The main purpose of this study was to verify whether the mean reaction time of professional drivers is at the level of one second, which is the value usually used for practical purposes, and to verify the impact of age on the reaction times of drivers. Two different studies with a total of 120 participants—professional drivers—were conducted on the simulator, with 116 drivers participating in the first experiment and four drivers participating in the second experiment using eye-tracking technology. The determination of the mean reaction time was realized using statistical tests. The evaluation of the impact of age on the reaction time of professional drivers was carried out using statistical testing, a regression model, and clustering. The results of this study can be immediately used in practice for professional drivers, as the mean reaction time is usually used as a benchmark in several calculations in transport, for forensic and educational purposes, and for planning traffic and modelling different traffic situations.
MSC:
62P30; 62F03; 62J05; 62H301. Introduction
There is a growing trend in the number of registered motor vehicles in the territory of the Slovak Republic. Despite this, there is a constant effort to reduce the number of accidents, especially accidents resulting in death or serious injury [1].
Awareness of a driver is an extremely important factor that needs to be continuously monitored. A drowsy driver can cause several mishaps and accidents on highways, leading to loss of money, physical injuries, and, most importantly, loss of human life [2].
Further, increased reaction times of the drivers mean longer decision-making processes and can result in a collision or a traffic accident. The value of the average reaction time is very important in practice, as it is used as a benchmark in several calculations in transport, for example, in accident reports when forensic experts remodel the course of a traffic accident. Analyses of the samples revealed that the young and middle-aged have the shortest perception time. Studies published so far have found that age affects drivers’ reaction times, with older drivers generally responding more slowly [3,4,5,6]. In ref. [7], the authors investigated drivers’ stress reaction time. In addition, some studies have found that the average reaction time of the drivers is 1 s [8,9]. In this case, even a difference of one percentage point in the reaction time can mean a large increase in the probability of an accident. For example, if a driver falls asleep for just four seconds while traveling at a speed of 100 kilometres per hour, the car will have traveled 111 m without a driver in control. A crash is likely to pose a high risk of death or severe injury at high speeds [10]. This means that it is necessary to assume the right level of the drivers’ reaction time so that, for example, the vehicle can be constructed to ensure the highest possible safety for road users or for developing new autonomous systems in the vehicle. This value should also be used for educational purposes to explain the safety distance between the vehicles. Moreover, the theoretical level of the reaction time should be used in practice for planning the traffic and placing variable traffic signs or modeling different traffic situations.
Therefore, the main aim of this study was to verify whether the mean reaction time of professional drivers is at the level of one second and also to compare the reaction times of professional drivers in different age categories. Section 1 of this study explores various research conducted to investigate drivers’ reaction time and compare results. Section 2 also presents issues related to the determination of the drivers’ reaction time. Section 3 briefly introduces the study participants and presents the theoretical background of the evaluation and the methods applied in the study. We also provide necessary information on the user data and simulator. Section 4 and Section 5 present the results of the study, obtained using the statistical methods, and discusses the strengths and weaknesses of the realized analyses and outlines the possibility of the further direction of the analysis. Section 6 provides a brief overview of the results of the study and practical interpretation and usability of the results. According to the best of our knowledge on the state of the art, the studies realized so far have not been focused on professional drivers, but instead focused on all types of drivers, regardless of their driving experience or profession; we can consider the study carried out in this article to be relatively innovative from this point of view, as it used a specific sample.
2. Literature Review
Based on statistical data published by the Ministry of the Interior of the Slovak Republic in 2020, the most frequent cause of traffic accidents in which a person was killed was a violation of the driver’s duty. Compared with the previous year, the number of deaths due to driver violations decreased by 14 to 54. The most common reasons were failure to drive fully and non-monitoring of the road situation (43 people killed), failure to yield to pedestrians who entered the road and passes through a pedestrian crossing (five killed), and driving if the driver’s ability to drive is reduced, especially by accident, illness, nausea, or fatigue (three killed). It is worth noting that the drivers’ reaction time is one of the basic parameters that has a very strong influence on the result in the analysis of the accident because modern transport systems include a large number of vehicles [11,12].
In general, driver response time means that when an emergency action signal is needed, the driver cannot act immediately because of one’s own functional limitation. It is only after a judgment is made that the driver thinks of the necessity of taking corresponding actions and starts taking related actions [13]. Vehicle drivers have different feelings while driving, and the response time to sudden situations differs [14].
From the perspective of traffic engineering, other scientists have focused on the drivers’ reaction time [15]. The authors elaborated a “study on drivers’ perception-reaction times against different types of traffic signals”. This publication delivered the differences in drivers’ response times reflected by different types of signals and their causes. For example, in ref. [7], the authors dealt with an analysis of drivers’ stress reaction time. This study showed that the best-fitting relationship between drivers’ reaction perception time and vehicle speed met an exponential distribution.
Similarly, the research of reaction time is described in ref. [16], where the characterization of the drivers’ perception reaction time was shown. The authors in this publication described the impact of driver gender, driver age, roadway grade, mean approach speed, platooning scenarios (leading, following, or alone), and time-to-intersection on the drivers’ perception–reaction time. When establishing the model, the driver’s reaction time varies according to different influencing factors [17]. These research studies show that the reaction speed to emergency situations is significantly reduced with age; in terms of emergency response capacity and the ability to cope with the complex external environment, female drivers are worse than male drivers and experienced drivers have faster reactions in emergency situations [18,19,20]. The most common distractions are talking to the passengers, controlling the behavior of transported children, animals, use of a mobile phone, and operation of devices in the car like air conditioning, radio, and navigation devices. On the other side, tiredness, stress, alcohol, drugs, malaise, or sickness can significantly increase the response time and lead to an accident, as well [21]. The authors dealt with the very problem of “test methods and reaction time of drivers” [16].
In ref. [22], the authors measured decision time in the laboratory by recording the difference in reaction time between four groups of subjects (zero-accident, zero-violation; high-accident, zero-violations; zero-accident, high-violations; high accident, high-violations). In ref. [8], the reaction time obtained ranged from 0.47 to 2.20 s. The overall mean time was 0.71 s, with a standard deviation of 0.16 s. The 85th percentile value was approximately 0.9 s. Another driving simulator study was performed to come up with a set of reaction times. The corresponding response times ranged from 0.32 s to 1.64 s. The 33rd, 50th, and 67th percentile values were selected from this distribution for simulation purposes. These three values were 0.52, 0.82, and 1.10 s, respectively [9].
In a simulator experiment, the author of ref. [23] found that accident-free drivers perceived danger more rapidly than drivers with a history of accident involvement. The analysis of the results of another research showed no relation between the period of possession of a driving license and the total reaction time parameter [21].
Previous research conducted in a driving simulator showed that participants in the middle-aged group had significantly longer reaction times to stimuli presented at the side of the road than did young participants. In addition, middle-aged participants had significantly higher reaction times to roadside stimuli than to stimuli in the middle of the road [24]. By comparing the average response times of individual age groups, the authors in ref. [4] determined that the differences were statistically significant. The average response time measured in the research was 0.965 s (0.932 for males and 1.002 s for females). The oldest groups achieved 12.3% worse results than the youngest on average. Age differences showed a complexity effect. However, differences between other age groups start increasing by the age of 40 [5]. It can be determined from this analyzed research that age will affect response time when thinking is required during driving. It can be seen from the previous research that the elderly group has a longer average response time than the middle-aged and young groups. It can be affirmed that thinking about other matters during driving has a greater impact on the response time of older drivers than younger ones [3]. Authors determined differences (13% and 20%) between 20 and 60-year-olds in their study of the simple reaction time [6,25]. A review of the evidence indicates that the slowing of behavior with age not only appears in motor responses and sensory processes but becomes more obvious with the increasing complexity of behavior. For this reason, the expression “slowness of behavior with age” is preferred to the more limited phrase “changes in reaction time with age” [6].
3. Methodology and Data
3.1. Participants of the Study
For the purpose of this study, two different studies with a total of 120 participants—professional drivers—were conducted on the simulator. Four drivers participated in the second experiment using eye-tracking technology. In our first study conducted on the simulator, 116 drivers participated, where we determined the reaction times of drivers aged 23 to 69 years. Not only active, professional drivers with a valid driver qualification card who have at least five years of experience in driving a truck or bus were involved in the study, but also first-time participants of qualification training courses were involved in the study with a minimum of two years of experience. According to regulation (EC) No 561/2006, it is obligatory for every driver working as a professional driver in road transport to have a qualification card and participate in a requalification course every five years. During this course in the training facility, each driver took a testing ride on the available simulator, what was part of their educational training. The youngest driver involved in the research was 23 years old, and the oldest driver was 69 years old. The average age of the drivers was 43.5 years (standard deviation 10.5 years); all volunteers were in good physical and mental condition without diseases that could negatively affect the correct course and implementation of the measurement. Table 1 lists the numbers of participants of the study, divided into three categories, according to their age.
3.2. Study Design
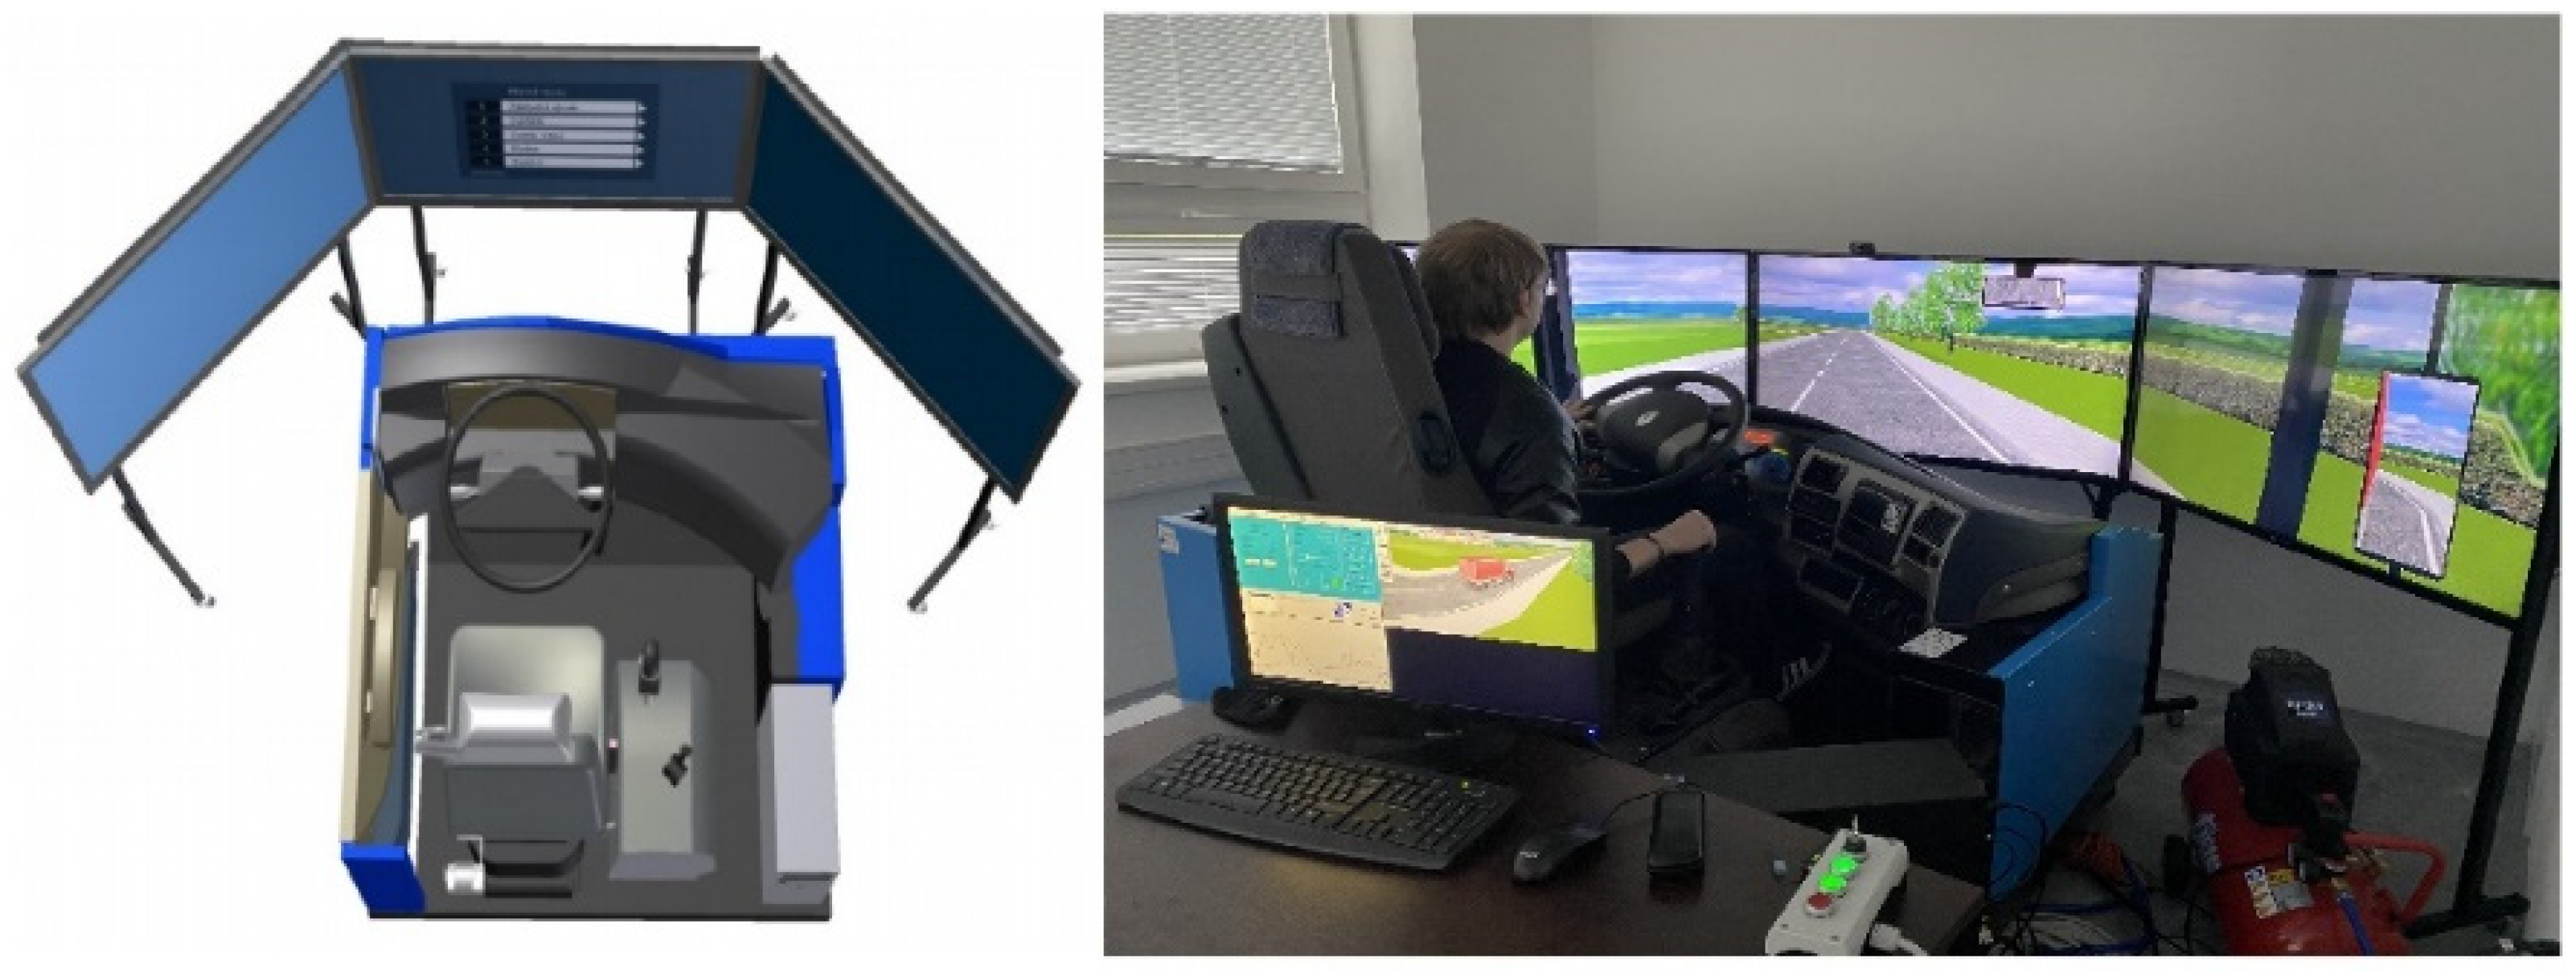
The cabin of this simulator was created as a structural model of a Renault truck type (it was not made up of a real truck cabin). The authors did not have any option to select the simulator used in this study. The training facility was equipped only with one type of simulator. The interior equipment of the simulator cabin copies the real cabin in terms of the layout of the controls and indicators. The engine servo, gear lever, pedals, handbrake, and steering wheel position adjustment provide the steering wheel features equipped with compressed air power simulations corresponding to the actual vehicle. The image is projected in front of the driver on a system of three large-screen projection screens and at the same time into rear-view views placed in the space of the projection screen. The simulator shown on the right side of Figure 1 is equipped with a teacher’s desk, which is used to control the system, and a panel for starting the electrical and other circuits of the simulator, and on left side of Figure 1 is a view of the simulator from above. At the same time, it is possible to run individual training lessons from the teacher’s desk. The computer image generator is located next to the driver’s seat and generates images of both front and rear views of the monitors about the landscape projected in front of the driver. The driver can watch the traffic behind the vehicle and perform, among other things, reversing training, as well.
All volunteers were familiarized with the simulator beforehand, and a trial braking was performed before the actual experiment. At the beginning of the measurement, before measuring the reaction time of the drivers, each driver was informed about the controls of the simulator and then drove the training environment for about five minutes to determine the correct operation of the pedals, steering wheel, clutch, and overall operation of the simulator. Pressure on the acceleration pedal started the computer program; afterwards, the dashboard displayed the rising velocity. The program showed various obstacles (animals, tractors, trees, etc.). The volunteer reacted by braking, which meant simultaneously using the brake and the clutch. The measurement stopped when the brake and clutch were used. We measured the simple reaction time, as there was only one stimulus and only one possible reaction, i.e., braking. When the driver responded by pressing the brake pedal, driver reaction time was displayed at the top left part of the screen, as shown in Figure 2. Ten consecutive measurements were performed on everyone. The first response time and the best response times were considered the result response time. The first response time came after an animal ran into the driver’s path. The program then projected another nine obstacles at different times at random speeds. The best response time for each driver was selected.
The last part of study design explains how different obstacles appeared on the screen before driver reaction was needed. After drivers were acquainted with the simulator and all its elements, the risk environment was launched. Drivers always started from the same beginning point and their first task was to increase the speed to 50 km/h. They were informed about various obstacles crossing, falling onto, or entering the road before they started the journey. When they observed an obstacle on the screen, their immediate response should follow by pressing the brake pedal. It is necessary to clearly indicate that the obstacle may appear in the image gradually and not suddenly. As is shown in Figure 3, the obstacle could be a tree falling down at the right side part of the screen but a similar situation was also happening at the left side. Naturally, with increasing the speed of the vehicle, driver response time to observe the obstacle appeared on the screen was shorter. If the driver’s response was too slow, then a crash with the obstacle resulted.
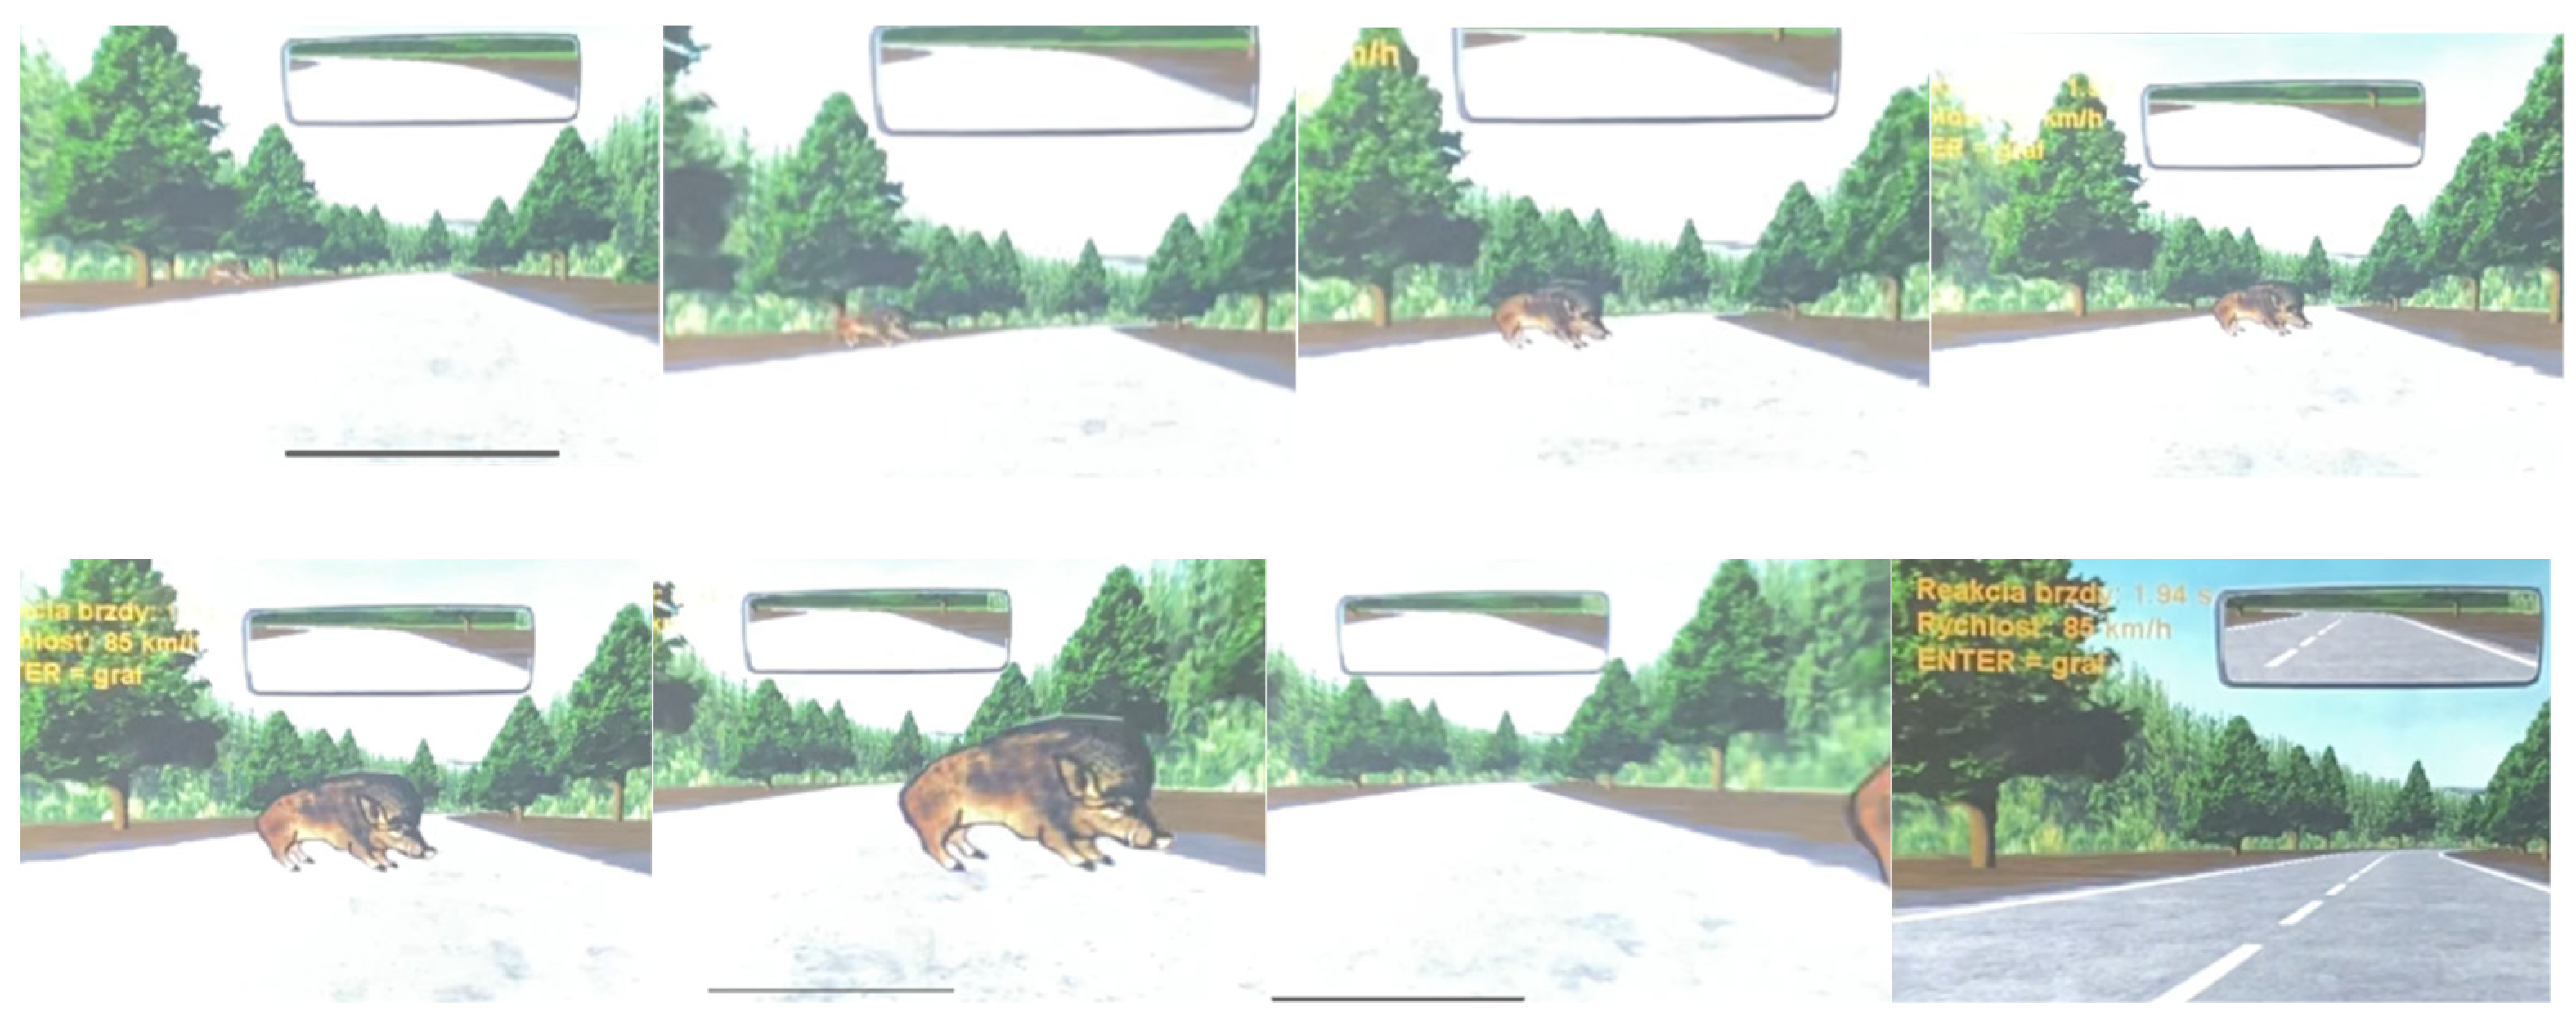
On the other side, a different obstacle like a wild boar could appear at the right side of the screen but a similar situation could also happen at the left side side of the screen, where, e.g., a wild boar could be crossing the road from the left to the right, as is shown in Figure 4.
Lastly in the study design, we note that only 10 consecutive driver responses were recorded because, then, the obstacles and the way they were displayed began to repeat. Unfortunately, only the drivers’ first response times and the best response times were shared with the authors by the training facility.
3.3. SMI Eye-Tracking 2
Eye-tracking is based on obtaining data on eye movement or eye pupils. These data were obtained by the eye tracker, which consists of two main components: a light source that emits infrared radiation and is aimed at the eye, and a camera that then captures infrared light reflections, including pupil movements. This device must be connected to a computer or other device that stores the scanned data [26].
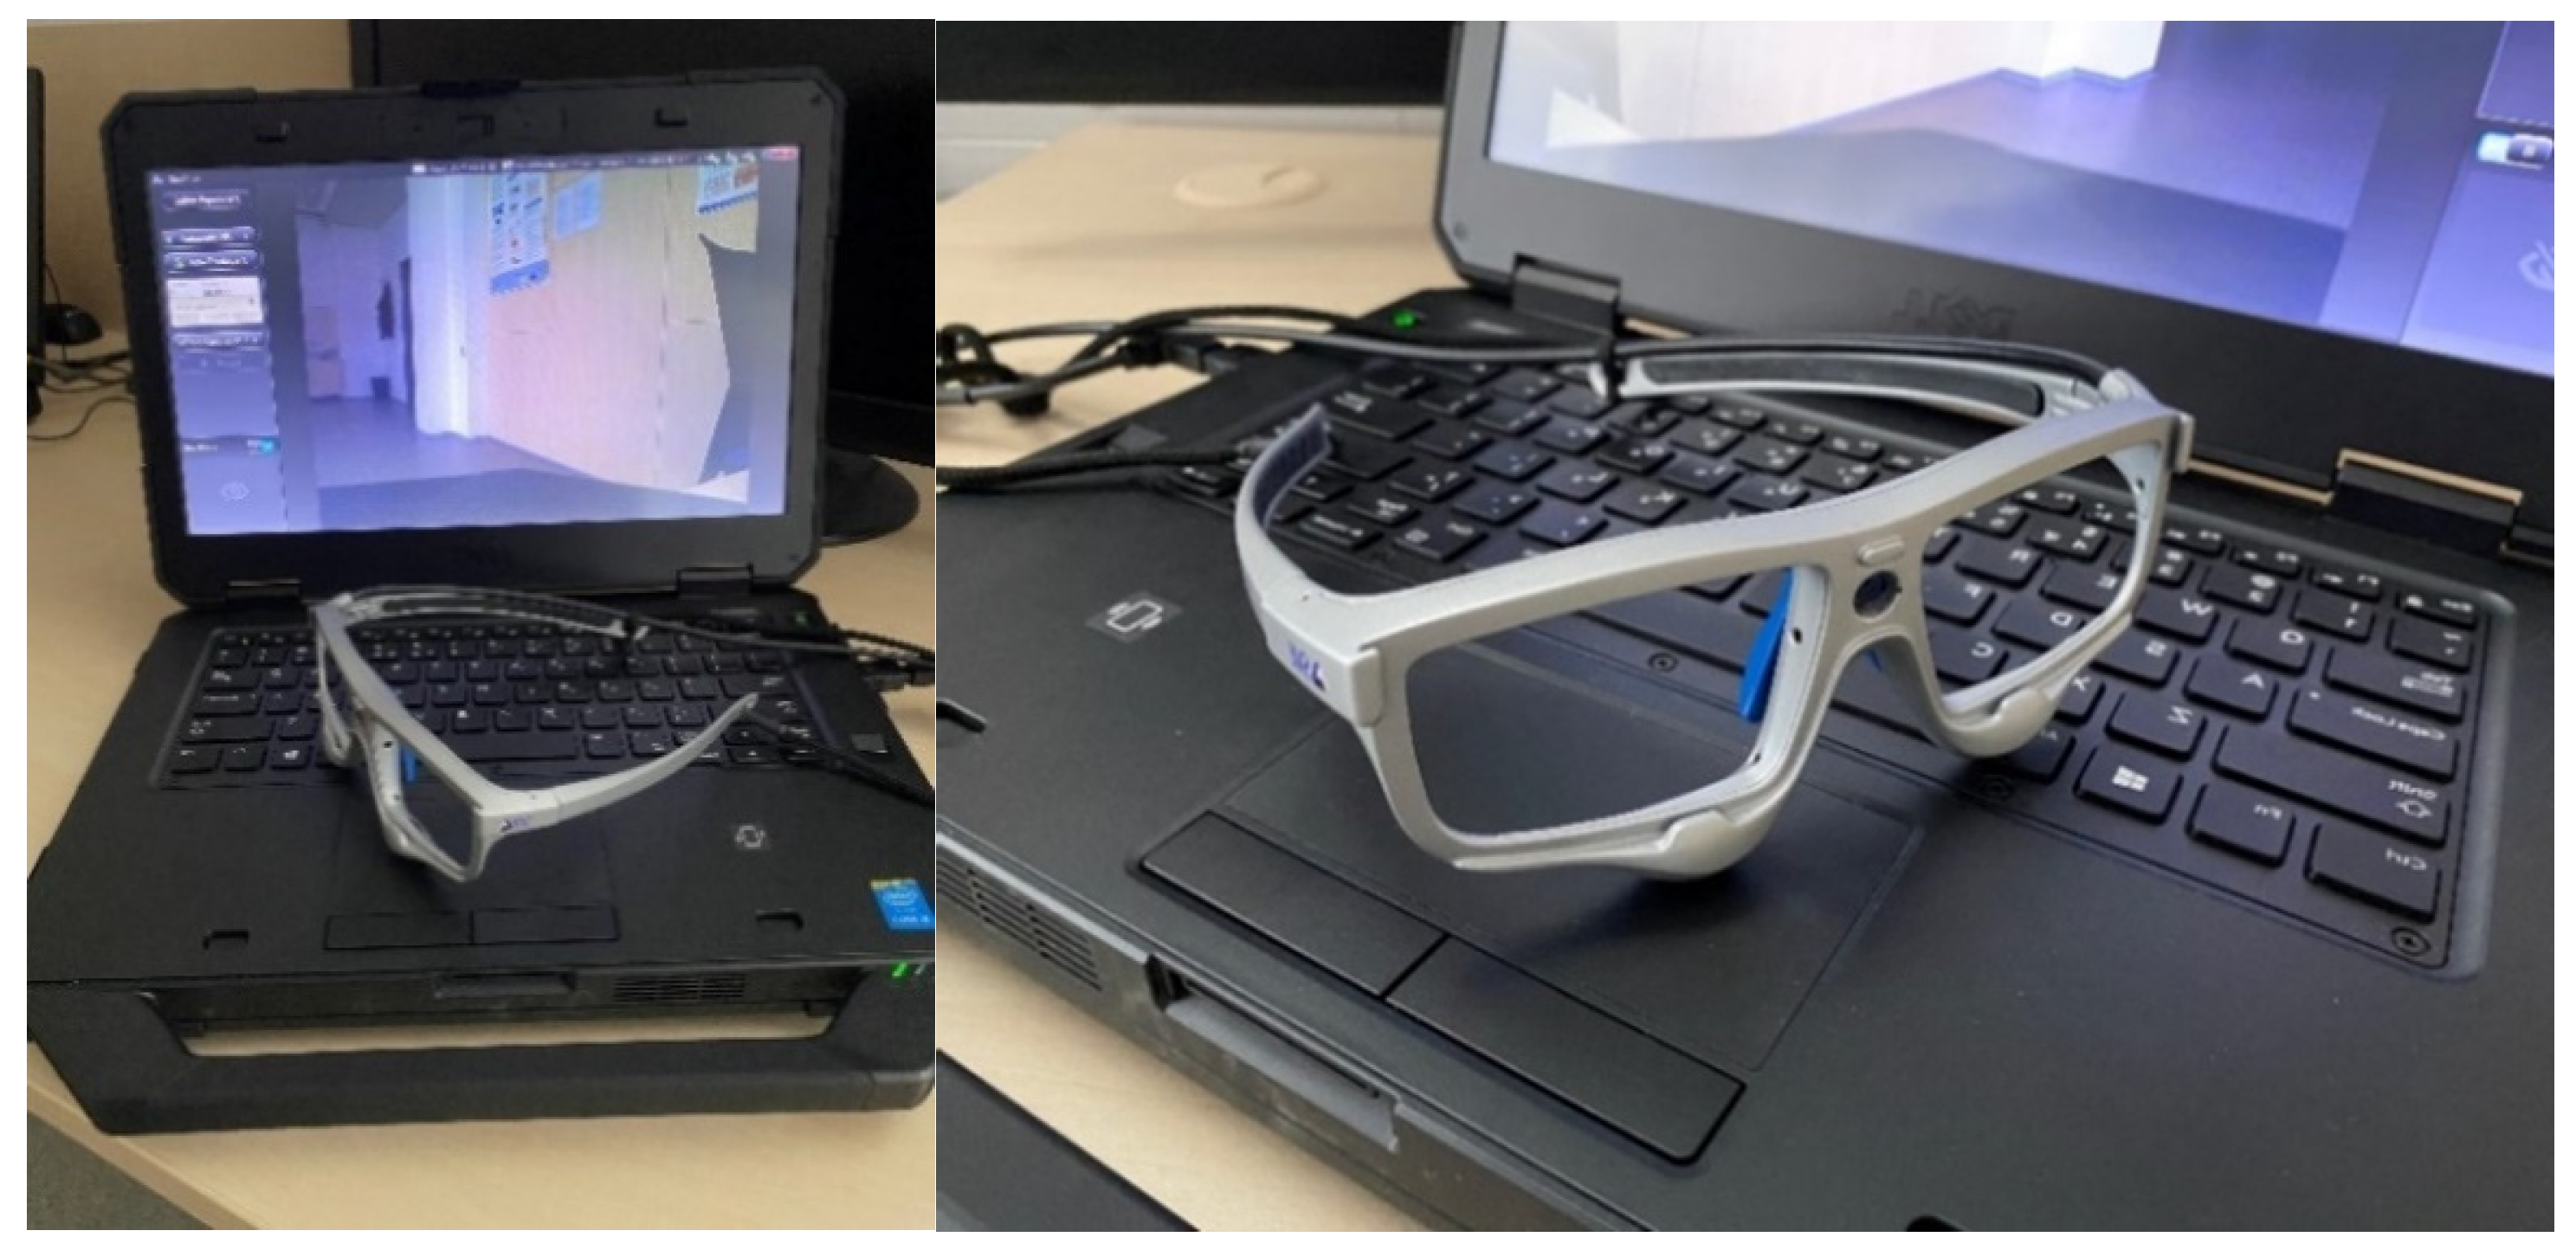
Our study used SMI Eye Tracking 2 Wireless, eye-tracking glasses from SMI Senso Motoric Instruments, presented on the right side of Figure 5, and on left side of the image is a view of driver using eye-tracking glasses presented. These glasses record a person’s natural behavior in real-time on a computer. The sampling frequency for eye movement is up to 120 Hz, and the viewing range is 80 degrees horizontally and 60 degrees vertically. In addition to recording images at a resolution of 1280 × 960 pixels at 24 fps or 960 × 780 pixels at 30 fps, the glasses also use an integrated microphone that picks up ambient sound. After using the Behavioural and Gaze Analysis software, the output data of the scan can be in the form of video or images.
3.4. Methodology of the Study
Regarding the review of the literature and the analyzed publications [17,18,19,20,21], the authors are aware of the fact that there are many factors that influence the reaction of drivers. Unfortunately, the authors were provided with information by training facility only on the age and reaction of the driver. Based on the data provided, it was only possible to assess the effect of age on the driver’s response and to find out the average response of all drivers involved. Data collected from the participants were analyzed using statistical methods. The main aim of the study was to verify whether the average reaction time of drivers is at the level of one second, which is the value used in the literature review or in practice for forensic purposes to evaluate the course of the traffic accidents and also to compare the reaction times of drivers in different age categories. To verify the first mentioned assumption, in this study, we focused on the descriptive characteristics of the reaction time of the drivers in our sample, but we also used statistical hypotheses testing. The null hypothesis in the one-sample t-test was that the mean value of the reaction time of the professional drivers is at the level of one second, with the one-sided alternative hypothesis that it is significantly higher than one second. We chose this one-sided alternative because if this study showed that the reaction time of the professional drivers was significantly higher than the value of one second used so far, we would consider it necessary to change this generally set level due to an increase of reaction times that can lead to longer decision-making processes and can increase the risk of being involved in a collision or a traffic accident. As the t-test has normality of the sample as the assumption of correct usage of the test, this fact was verified by the Kolmogorov–Smirnov normality test and graphical analysis using histogram and normal Q-Q plots [27].
The second aim of the study was to verify the findings resulting from previous studies on significant changes in drivers’ reaction times depending on their age or even on the increasing reaction time with the increasing age of the driver. In this case, we used correlation and regression analysis to verify the existence and strength of the linear relationship between age and reaction time of the driver, as well as cluster analysis. In the cluster analysis, we used Ward’s method to create clusters of the drivers based on their reaction time, and then we examined the age of the drivers thus included in the common cluster and compared the ages of the drivers in different clusters. We used hierarchical cluster analysis with the gradual merging of drivers into clusters, from the initial solution, where each driver is in a separate cluster, to the final solution, where they are all in one common cluster. From the hierarchical solution, we chose a step with three or four clusters, which is the best from a practical, application, and interpretation point of view. Then, the comparison of mean ages of drivers in the clusters was realized using analysis of variance (ANOVA) with the null hypothesis of insignificant differences between the ages. For the correctness of ANOVA usage, the assumptions of normality and homogeneity of variances were verified by the normality tests and graphical analysis and the Levene test of homoscedasticity [28].
All the statistical procedures were realized at the significance level of 0.05 and were processed using the IBM SPSS Statistics 26 software. The results of the hypothesis testing were evaluated using the p-values of the tests, whereas the p-value lower than the significance level 0.05 led to the rejection of the null hypothesis, and higher p-values led to the non-rejection of the null hypothesis.
4. Results
First, we focused on the results of the analysis of the average reaction time of the drivers. Table 2 shows the descriptive statistics of the drivers’ ages and reaction times.
Because the 1-s level is usually used in practice, we tested this value on a sample of drivers involved in this study to determine whether it is suitable for Slovak drivers to use this value of the reaction time. For this purpose, we used statistical testing; concretely, we used the one-sample t-test.
To verify the assumptions of using the t-test, we first examined whether the sample (variable reaction time) originated from the sample with normal distribution. The results of the normality test are shown in Table 3. Due to the sample size, we used the results of the Kolmogorov–Smirnov test, as the Shapiro–Wilk test is usually considered sensitive even to small deviations from normality in the case of larger samples (more than 50 cases).
According to the test result, we do not reject the null hypothesis of the normality (p-value = 0.144, which is > 0.05). Moreover, the normality was also examined using the histogram with the theoretical Gaussian bell curve (graph on the left side of Figure 6) and normal Q-Q plot (graph on the right side of Figure 6). Both of these graphs are shown in Figure 6.
All these results signified that the reaction time of the drivers can be considered a random sample from a normal probability distribution.
The result of the t-test of the equality of the mean value of the reaction time with the theoretical constant at the level of one second led to rejection of the null hypothesis and showed a significant difference in the mean reaction time of the Slovak drivers and these theoretical constants (t-statistic = 5.256; p-value < 0.05). Therefore, it can be said that the reaction time is significantly higher than this theoretical level used so far. For practical use of this result, it is very important to determine the right value of the average reaction time of the drivers. This value is used in forensic purposes when forensic experts remodel the course of a traffic accident, in practical purposes when planning the traffic, or in educational purposes where safety distance spacing between vehicles is explained. Therefore, we subsequently performed another t-test with a constant value of 1.1 s. This test resulted in non-rejection of the null hypothesis (t-statistic = −0.041; p-value = 0.967) and therefore showed that the mean reaction time of the drivers could be considered equal to this level. This result has practical benefits in forensic purposes, educational purposes, planning and placing variable traffic signs, modeling different traffic situations, and developing new autonomous systems in the vehicle.
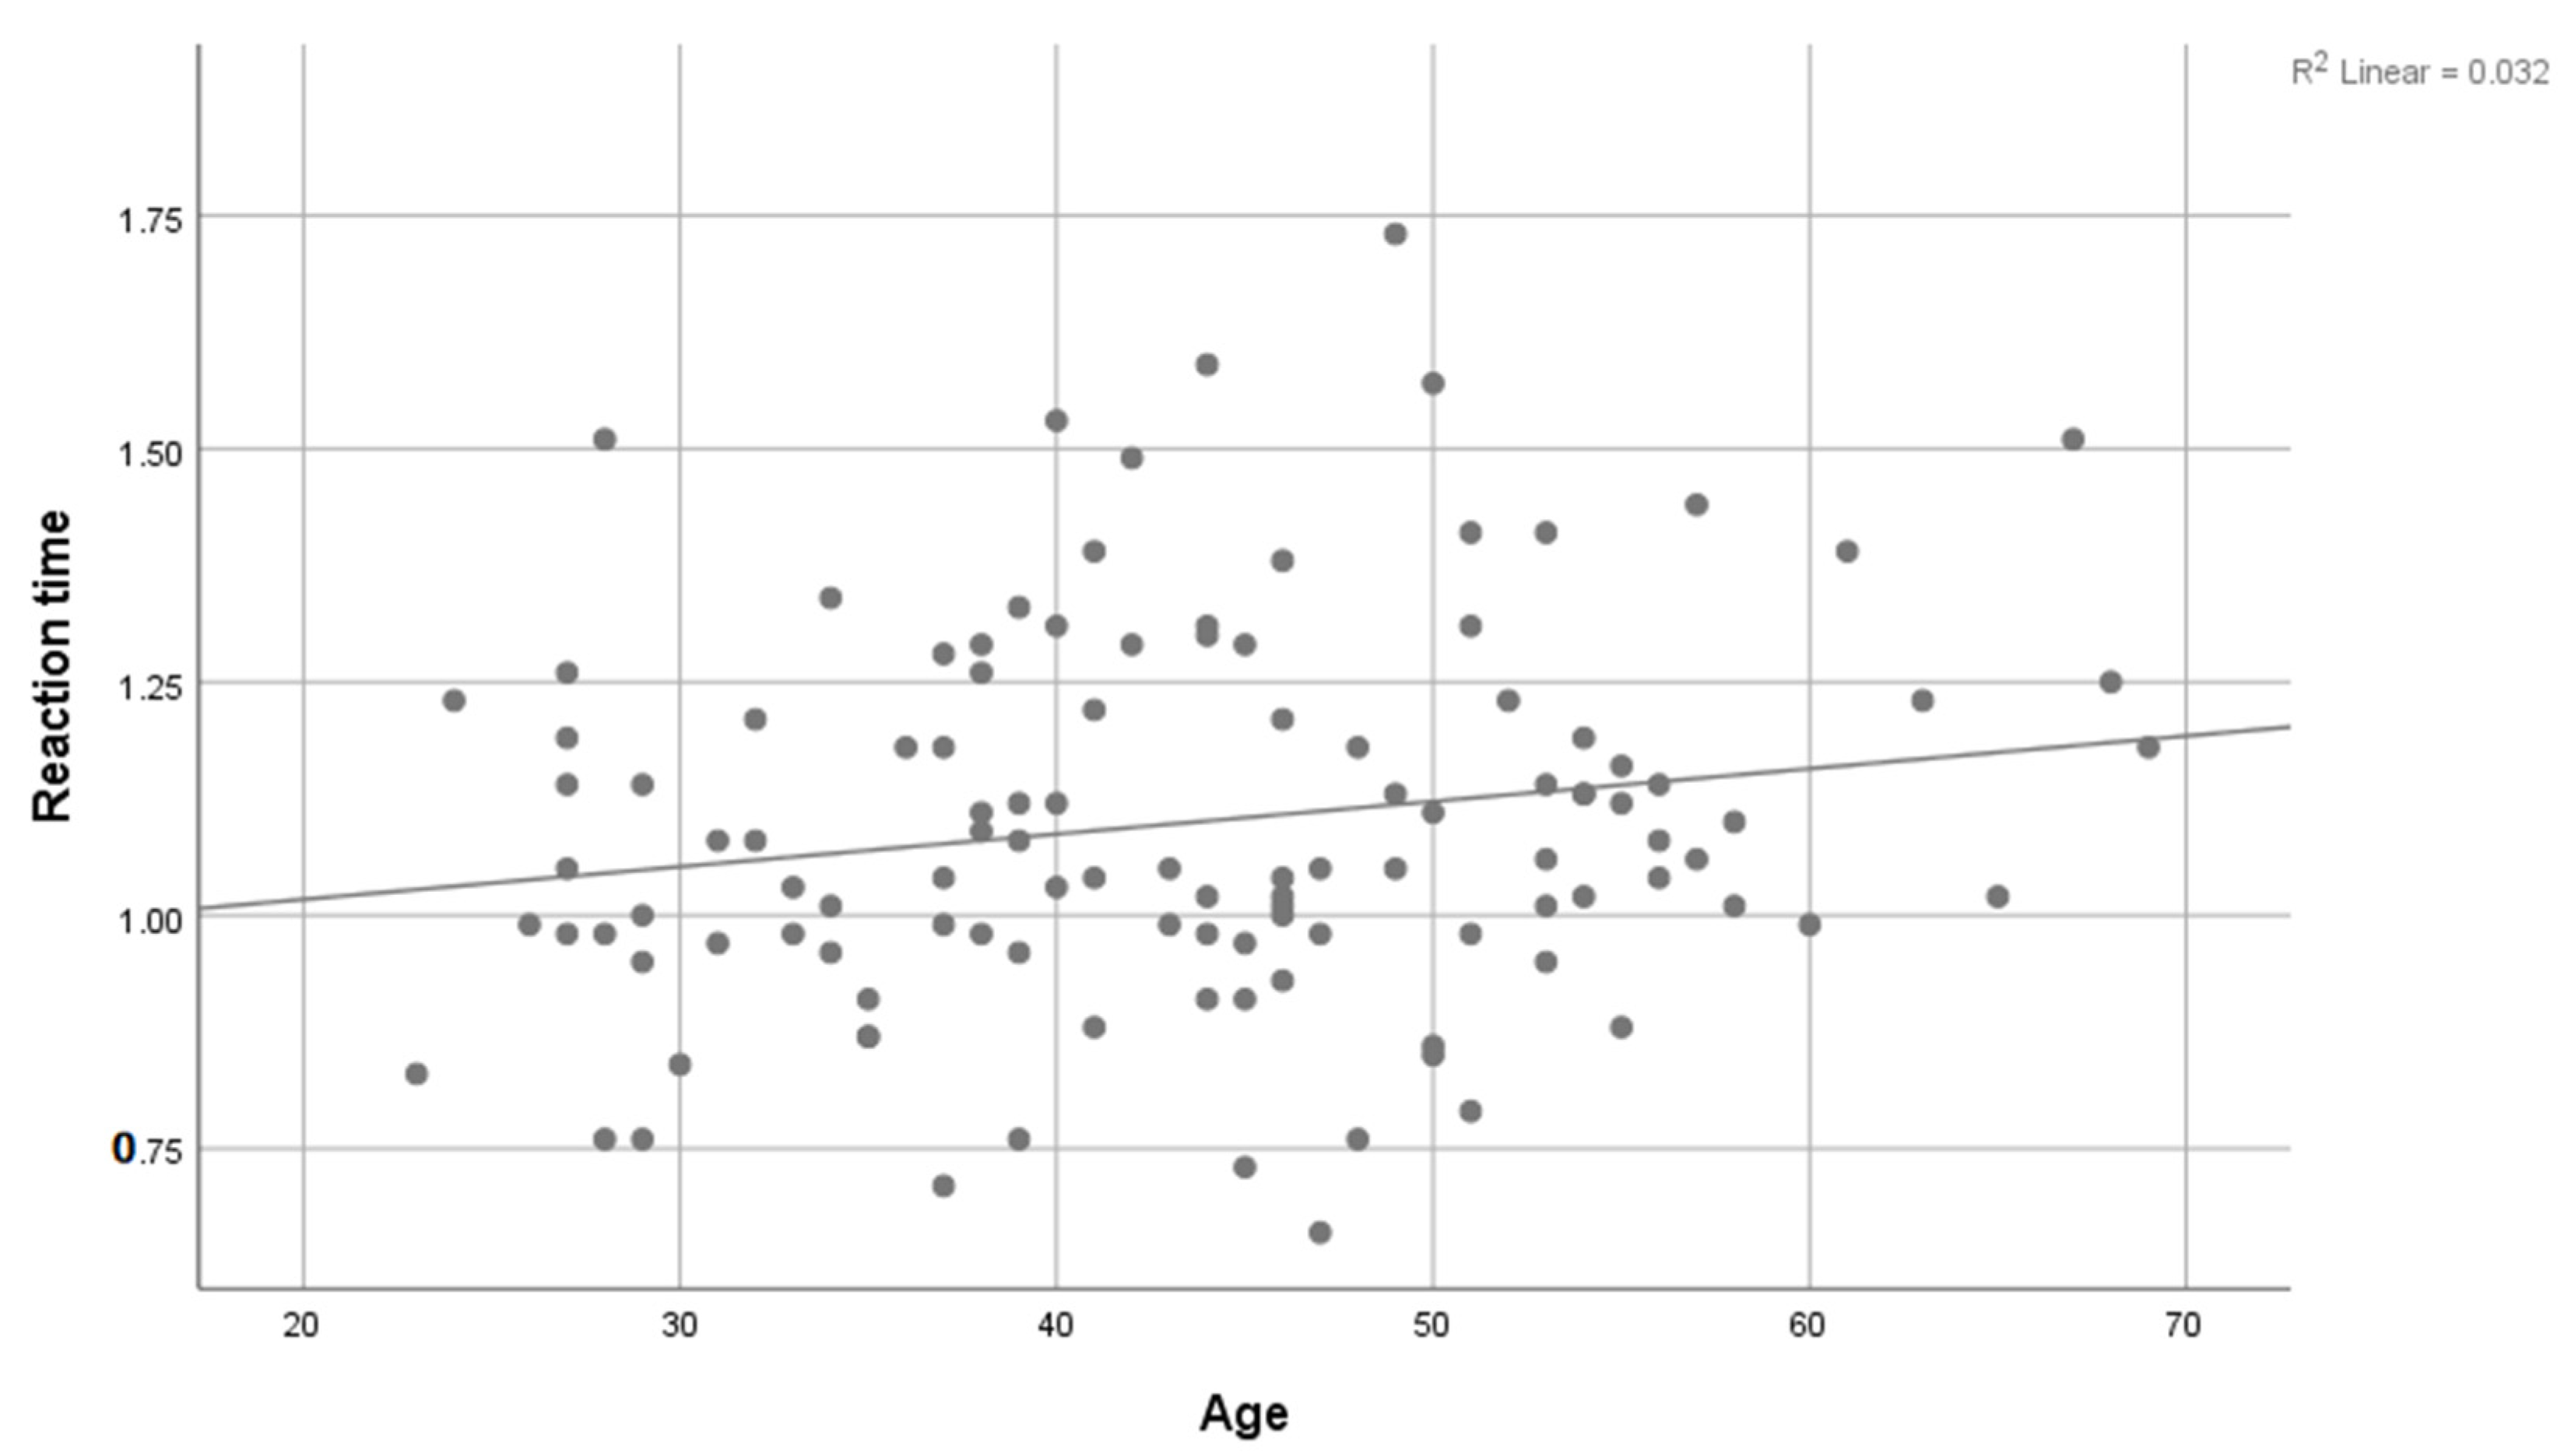
The second part of the analysis was focused on verifying the age impact of the drivers on their reaction time. The correlation coefficient did not prove the existence of a significant linear dependence of these variables (Pearson correlation r = 0.18; p-value = 0.053). Additionally, the regression analysis showed the insignificancy of the driver’s age impact on his reaction time. The results of the regression analysis are in Table 4.
Additionally, the characteristics of the model were quite weak. This model was insignificant (ANOVA p-value = 0.053) and only 3.2% of variability of dependent variable reaction time was explained by this model (R-square = 0.032; adjusted R-square = 0.024). Thus, we do not consider age a variable significantly explaining the reaction time of the drivers. This fact is also evident in Figure 7, where no trend of dependence between these two variables is apparent. The reaction time of the drivers is very likely influenced by other factors, but not by the driver’s age, or, at most, very weakly.
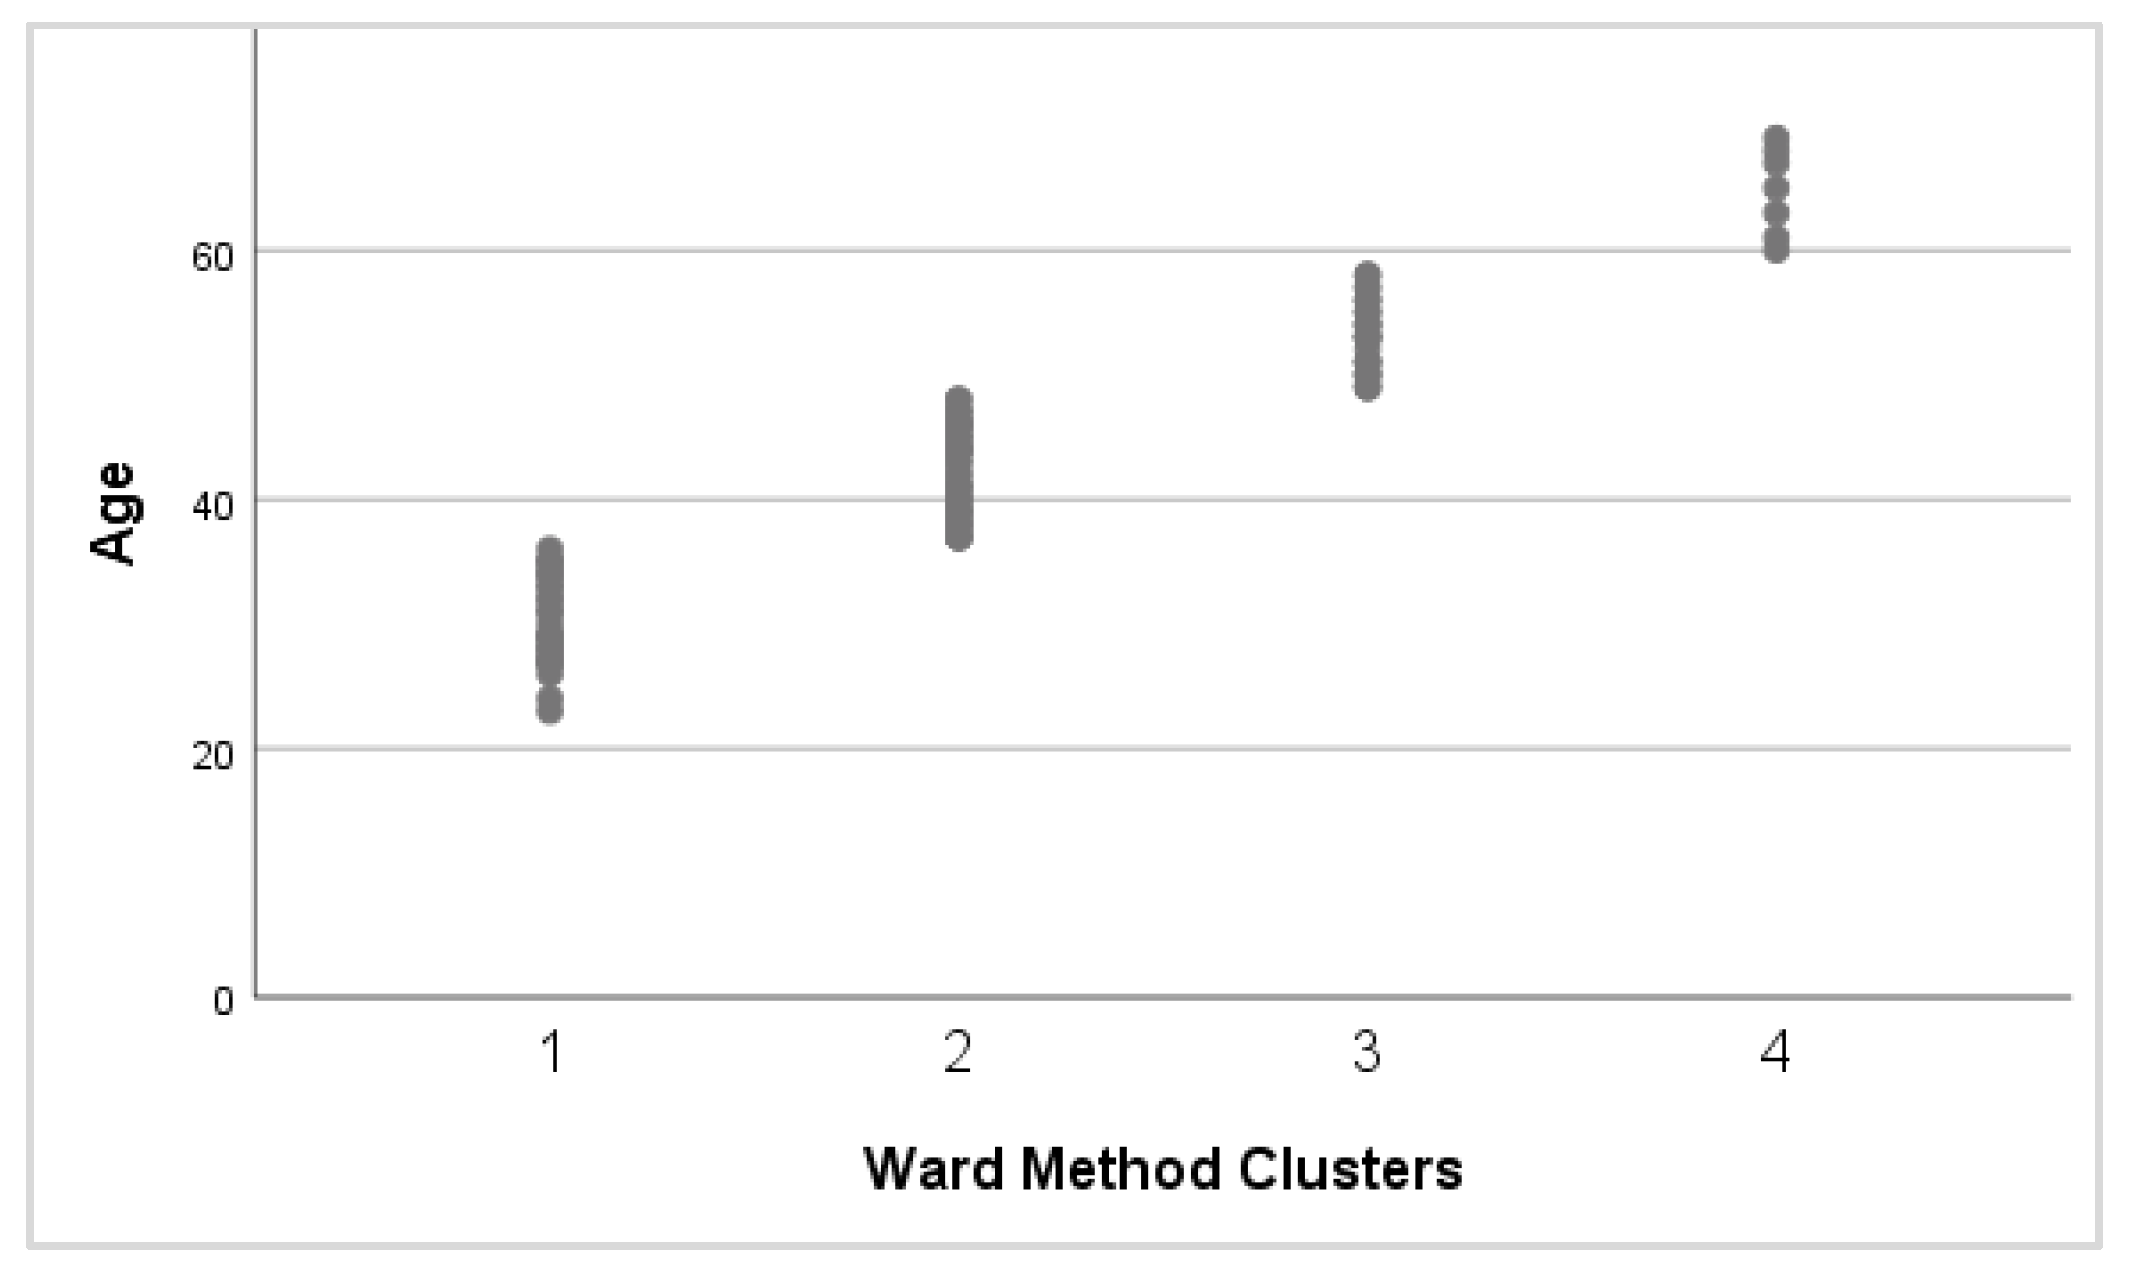
In addition, we applied cluster analysis to form groups of drivers that have a similar reaction time. We used Ward’s clustering method and the square Euclidean distance between cases. The result is visualized in a dendrogram showing the hierarchical clustering of drivers (Figure A1 in Appendix A). We chose a step with four clusters of drivers created based on their reaction time from the created solutions. The choice of three or five clusters would yield very similar results in further analysis of the drivers’ age in these clusters. Subsequently, based on the affiliation of each driver to the cluster, we compared the ages of drivers in the clusters. We assumed that if the reaction time of the driver changes, or even increases, with increasing age, then drivers with similar reaction times in one cluster would have approximately the same age. Conversely, drivers assigned to different clusters due to their different reaction times should differ in age. Figure 8 shows the ages of the drivers in the individual clusters, where a slight increase in age among the clusters is visible.
Mean reaction times and ages of the drivers in the created clusters are shown in Table 5.
Consequently, we compared the ages of the drivers in the created clusters using the ANOVA test. To verify the assumptions of this method, we applied the Shapiro–Wilk test and the Kolmogorov–Smirnov test of normality (according to the number of drivers in the clusters) in combination with graphical analysis of normality and also Levene’s test of homoscedasticity. This validation resulted into the fulfilment of the normality assumption (normality tests p-values > 0.05; Levene p-values > 0.05). Then, however, the comparison of the mean ages of the drivers in the created four clusters did not show significant differences (p-value = 0.443). The results are shown in Table 6.
This result follows that it is not possible in general to claim that, among the professional drivers in Slovakia, there exists a significant impact of their age on their reaction time. Although there were slight differences in their ages in the graphical representation of the age of the study participants included in the four different clusters based on their reaction time, these did not prove to be statistically significant and systematic.
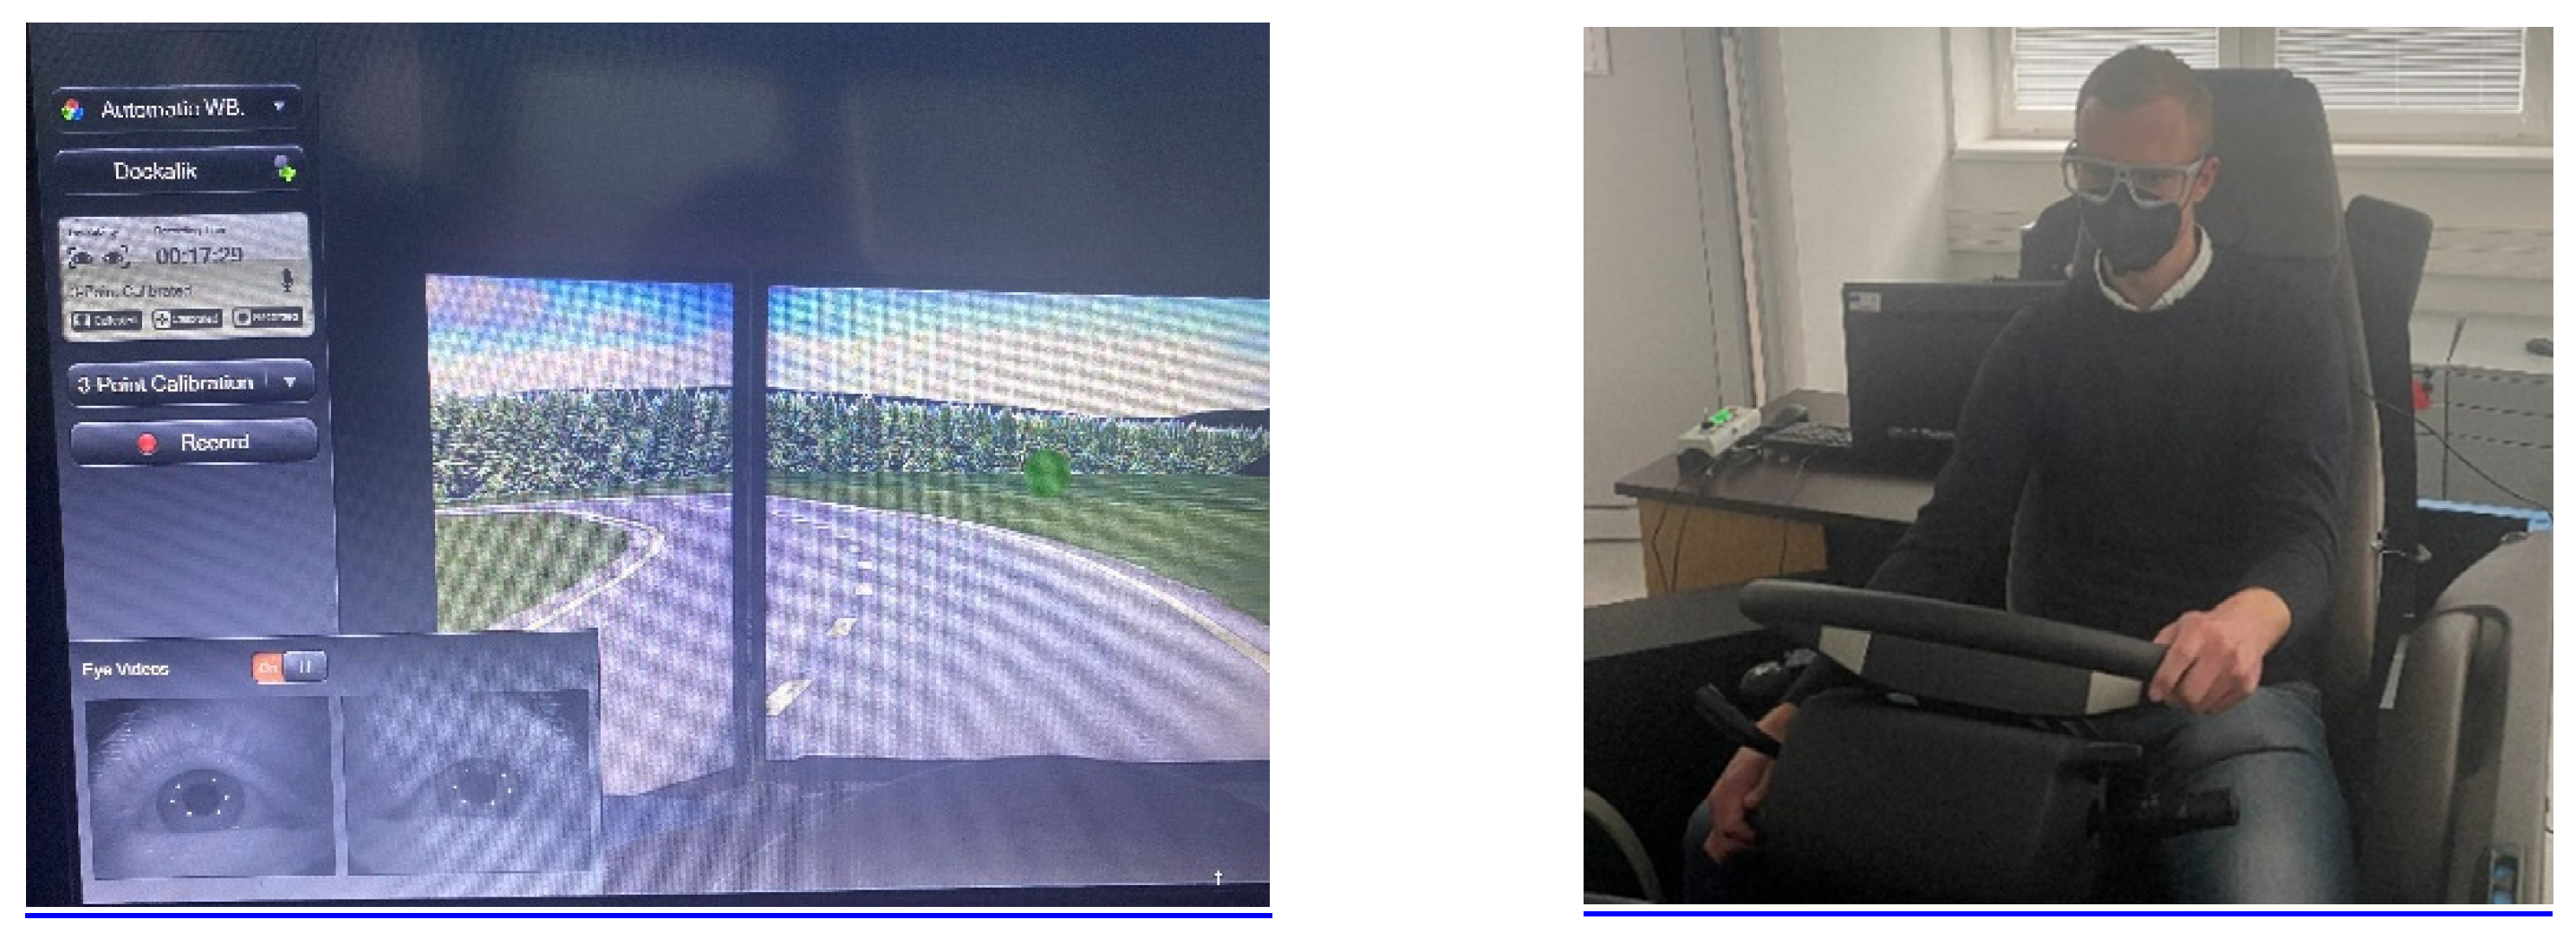
In contrast to our first study, we realized one more study that we consider to be more accurate due to the use of eye-tracking glasses, as shown in Figure 9, where the left part of the image shows a view from the driver’s perspective and the right side of the image shows the driver himself. This analysis resulted in recognition of the time, i.e., observing an obstacle and time of the decision to break.
Two drivers with a group “C” driving license and two drivers with a group “B” license took part in the measurement. All four candidates were 25 years old. The total driving time of one driver was 10 to 15 min, depending on the driving speed in a risky environment. The risk environment and obstacles shown were randomly generated by the computer, as was already mentioned in the methodology part for the first study. The risk environment for four drivers in the second study was the same as it was for 116 drivers in the first study. Obstacles that appeared while driving were a tractor entering the road, wild animals running across the road (image on the right side of Figure 10), or falling trees on the road (image on the left side of Figure 10), as shown in Figure 10.
Using eye-tracking glasses, we were not only able to determine the drivers’ reaction time in total as in the previous measurements, but were also able to divide this time into the obstacle observation time and the brake pedal depression time. Based on these data, we can say how long it takes the driver to react to a certain type of obstacle since it detects the obstacle, not since the obstacle appears on the screen. We decided to consider only the first 15 crisis responses for each driver because then the obstacles and the way they were displayed began to repeat. Table 7 presents an average of the drivers’ observation time and brake pedal reaction time.
If we compare the results of the drivers in the first measurement with the second measurement, we find that the results of the second measurement using eye-tracking glasses are more accurate than the data given in the literature review. In addition to those mentioned, the measurement showed opposite results on the driver reaction time. In comparison with results of the first measurements where reaction time was evaluated on 1.1 s, these results suggest that the reaction time of drivers is less than one second, which matches more with the literature review. However, it should be taken into account that these measurements were obtained for only four participants in the pilot study. Another important point to emphasize is that the first study involved only professional drivers, while the second study also involved holders of a classic car driving license. Without obtaining more data from the measurement using eye-tracking glasses, the results of this pilot study cannot be considered authoritative.
To summarize, in these studies, we found the insignificant impact of age on the drivers’ reaction time and also on the reaction time compared with the literature review (1.1 s compared with 1 s). We cannot apply these results to another group of drivers because our test group consisted of only professional drivers.
5. Discussion
Analyses performed in this study showed that, in Slovakia, it generally cannot be claimed that there is a significant impact of the ages of professional drivers on their reaction time. On the other hand, the presented results do not exclude the possibility that age has an impact on ordinary drivers who drive from time to time. This research focused only on the professional drivers who work in road freight transport and whose daily main work task is driving. In the literature review and also in the general scientific society, all the experiments were conducted with not only one specific driver group. The results obtained in this study are different from the evaluations carried out abroad. As we already mentioned, some authors have so far addressed the issue of the influence of the driver’s age on their reaction time. In ref. [18], the authors showed in their that the reaction speed to the emergency situation was significantly reduced with age, which is at odds with our results from the reactions of professional drivers. Previous research conducted in a driving simulator in ref. [24] also showed that participants in the middle-aged group had significantly longer reaction times than did young participants. In ref. [3], the authors showed that the elderly group had a longer average response time than the middle-aged and young groups. In ref. [4], the authors showed that the oldest groups achieved 12.3% worse results than the youngest on average. The differences between 20 and 60-year-olds (13% and 20%) were also determined by the authors of ref. [5] in their study of the simple reaction time. Compared to the mentioned presented studies and research, our study used bigger data on the specific group of professional drivers, which we consider to be more accurate to create the best possible analysis, leading to more accurate results of the evaluation of the influence of the driver’s age on their reaction time. In this type of study, it is necessary to specify the test group, because there are some differences in the reaction time between male and female drivers and also between more and less experienced drivers, as mentioned in [19,20]. In ref. [29], the authors showed that the drivers’ ages have some impacts, but, using the NeuroCom Complex, it was traced how drivers’ reaction time depends on the complexity of the situation the driver was exposed to. We consider obtained results to be the starting point for comparison with other methods and future experiments performed using eye-tracking glasses and electroencephalogram (EEG). Most authors do not consider this method to be very accurate as it only takes into account the values of final reaction time without considering other individual characteristics. Therefore, the results obtained by this method tend to be further refined using more sophisticated approaches to evaluation. This is the case, for example, with the electroencephalogram (EEG) device. In our case, however, it turned out that we obtained different results from other second measurements using eye-tracking glasses by evaluating reaction time with this approach. We highly recommend combining this measurement with other measurements and methods, especially those that use complex determination of driver reaction time defined to be information in-flow to the cerebral cortex, detection, and recognition of a stimulus, making a right decision, and respective reaction [29]. We consider the application of a combined method as a possible further direction of this study. We will also try to obtain enough data for the application of evaluation using eye-tracking glasses. In our first study, the reaction times of 116 professional drivers were evaluated, and in the second study with eye-tracking glasses, only four drivers’ response times were evaluated, as was already mentioned before in the paper. Even out of these four drivers, only two were drivers with a valid truck license and two remained only holders of the classic license to drive a regular car. As a reminder, we can realize that there are differences in results that could occur between the first and second study and positive results of reaction time of the drivers in the second study using eye-tracking glasses. We can see that drivers in this study responded to risky situations on the level of less than 90 hundredths of seconds, which is a reaction time presented in the ref. [8]. Compared with the participants in our first study, we can observe 20 hundredths of seconds of difference between drivers in our two studies. Most likely, the differences in reaction time are due to a different test group and as well as the small group of drivers in the second study using eye-tracking glasses. We cannot generalize these results to another group of drivers. It would also be possible to focus on determining the effects of driving experience on selected segments of participants, for example, by the level of education or region of permanent residence. In further studies, we would like to increase the number of the participants in studies using eye-tracking glasses, and to improve first study, as well. If we want to improve the first study, then we need to acquire new data on drivers with regular car licenses, but we can also divide future experiments into smaller studies where we can focus on the reaction time of the new young drivers, new older drivers, female and male drivers, and experienced and less-experienced drivers separately, and many more different influencing factors like alcohol or drugs [17,21].
6. Conclusions
In this study, we focused on the verification of whether the mean reaction time of the professional drivers is at the theoretical level of one second or is significantly different and also on comparing the reaction times of drivers in different age categories. The study is aimed at professional drivers who work as truck drivers in the road freight transport companies and aims to research the impact of age on drivers’ reaction time, which has a big impact on road accidents. The drivers’ reaction time is one of the basic parameters that have a very strong influence on the result in the analysis of the accident. As already mentioned, there are differences in the results obtained with results presented in the literature review by different authors in different studies. Our results obtained in the first study of the response time of professional drivers differed by 10 hundredths of a second as compared with various scientific papers. The evaluation of the impact of age on drivers’ reaction time was carried out using statistical testing, a regression model, and clustering. To summarize, in this study, we found the insignificant impact of age on the professional drivers’ reaction time. On the other hand, we cannot apply these results to another group of drivers, because our test group comprised only professional drivers.
However, it is also necessary to acknowledge the weakness of this method and thus of this study, namely the impact of the selection of individuals, where all participants were informed and acquainted with the possibilities of obstacles and risk situations. Therefore, in further analysis of the drivers’ reaction time measurements, we propose combining the method of computer software evaluation with other methods, such as eye-tracking glasses and electroencephalogram (EEG). This ensures all the necessary aspects in terms of accuracy because of the specification of processes data and also taking into account the effects of the driver’s awareness of crises.
The result of this study is very valuable for the preparation of future research programs for measuring drivers’ reaction time, which will provide the desired effect. For practical use of this result, it is very important to determine the right value of the average reaction time of the drivers. This value is used in forensic purposes when forensic experts remodel the course of a traffic accident, in practical purposes when planning traffic, or in educational purposes where safety distance spacing between vehicles is explained.
Author Contributions
Introduction M.P.; literature review J.B., E.D. and M.P.; materials and methods J.B. and L.S.; results M.P., L.S. and J.B.; discussion J.B., M.P. and E.D.; conclusion J.B. and E.D.; writing—original draft M.P. and J.B.; visualization J.B. and L.S. All authors have read and agreed to the published version of the manuscript.
Funding
This publication was realized with the support of Operational Program Integrated Infrastructure 2014–2020 of the Project: Innovative Solutions for Propulsion, Power and Safety Components of Transport Vehicles, code ITMS 313011V334, co-financed by the European Regional Development Fund.
Institutional Review Board Statement
Ethical review and approval were waived for this study due to the full anonymization of the data with no possibility of retrospective deanonymization of individuals.
Informed Consent Statement
Informed consent was obtained from all subjects involved in the study. All details about the participants were anonymized.
Data Availability Statement
The data presented in this study are available on request from the corresponding author.
Conflicts of Interest
The authors declare no conflict of interest.
Appendix A. Dendrogram of Hierarchical Cluster Analysis of Reaction Time Below
Figure A1.
Dendrogram of Hierarchical Cluster Analysis of Reaction Time.

References
- Vrabel, J.; Sarkan, B.; Vashisth, A. Change of Driver’s Reaction Time Depending on the Amount of Alcohol Consumed by the Driver—The Case Study. Arch. Automot. Eng. Arch. Motoryz. 2020, 87, 47–56. [Google Scholar] [CrossRef]
- Ghole, U.; Chavan, P.; Gandhi, S.; Gawde, R.; Fakir, K. Drowsiness Detection and Monitoring System. ITM Web Conf. 2020, 32, 03045. [Google Scholar] [CrossRef]
- Yan, Z.; Jun, Z. Simulation Research on Driver Response Time and Steering Stability Based on EPS System. In Proceedings of the 2019 4th International Conference on Intelligent Information Processing, Guilin, China, 16–17 November 2019; pp. 310–314. [Google Scholar]
- Bilban, M.; Vojvoda, A.; Jerman, J. Age Affects Drivers’ Response Times. Coll. Antropol. 2009, 33, 467–471. [Google Scholar] [PubMed]
- Myerson, J.; Hale, S.; Hirschman, R.; Hansen, C.; Christiansen, B. Global Increase in Response Latencies by Early Middle Age: Complexity Effects in Individual Performances. J. Exp. Anal. Behav. 1989, 52, 353–362. [Google Scholar] [CrossRef] [PubMed] [Green Version]
- Birren, J.E.; Woods, A.M.; Williams, M.V. Behavioral Slowing with Age: Causes, Organization, and Consequences. In Aging in the 1980s: Psychological Issues; American Psychological Association: Washington, DC, USA, 1980; pp. 293–308. ISBN 978-0-912704-15-9. [Google Scholar]
- Wei, Y.; Qi, Y.; Li, L. Analysis of Driver’s Stress Reaction Time. In Proceedings of the Book Series: ACSR-Advances in Comptuer Science Research; Atlantis Press: Zhengzhou, China, 2015; pp. 1849–1852. [Google Scholar]
- Fergenson, P.E. The Relationship between Information Processing and Driving Accident and Violation Record. Hum. Factors 1971, 13, 173–176. [Google Scholar] [CrossRef]
- Sugimoto, Y.; Sauer, C. Effectiveness Estimation Method for Advanced Driver Assistance System and Its Application to Collision Mitigation Brake System. In Proceedings of the 19th International Technical Conference on the Enhanced Safety of Vehicles (ESV), Washington, DC, USA, 6–9 June 2005; pp. 1–8. [Google Scholar]
- Transport Accident Commission. Road Safety Statistics. 2021. Available online: https://www.tac.vic.gov.au/road-safety/statistics/summaries/fatigue-statistics (accessed on 15 December 2021).
- Presidium of the Police Force Evaluation of the Traffic Safety Situation for 12 Months 2020. Available online: Https://www.minv.sk/swift_data/source/policia/dopravna_policia/dn/prezentacie_dbs/2020/Vyhonotenie%20DBS%20za%20rok%202020%20def.pdf (accessed on 21 January 2022).
- Vichova, K.; Veselik, P.; Heinzova, R.; Dvoracek, R. Road Transport and Its Impact on Air Pollution during the COVID-19 Pandemic. Sustainability 2021, 13, 11803. [Google Scholar] [CrossRef]
- Plochl, M.; Edelmann, J. Driver Models in Automobile Dynamics Application. Veh. Syst. Dyn. 2007, 45, 699–741. [Google Scholar] [CrossRef]
- Hess, R. Investigating Aircraft Handling Qualities Using a Structural Model of the Human Pilot. In Proceedings of the Guidance, Navigation and Control Conference, Monterey, CA, USA, 17–19 August 1987. [Google Scholar]
- Yang, J.; Kim, J.-T.; Kim, J. Study on Drivers’ Perception Reaction Times Against Different Types of Traffic Signals—Non-Declarative and Declarative Memories Affected by Colors and Combinations of Signal Lights. J. Korean Soc. Transp. 2018, 36, 240–250. [Google Scholar] [CrossRef]
- Jurecki, R.; Stanczyk, T. The Test Methods and the Reaction Time of Drivers. Eksploat. I Niezawodn. 2011, 51, 84–91. [Google Scholar]
- Zhao, X.; Wang, S.; Ma, J.; Yu, Q.; Gao, Q.; Yu, M. Identification of Driver’s Braking Intention Based on a Hybrid Model of GHMM and GGAP-RBFNN. Neural Comput. Applic 2019, 31, 161–174. [Google Scholar] [CrossRef]
- Gang, L.I.; Han, H.; Hang, Y.; Zhou, Z. Study on Classification and Identification Methods of Driver Steering Characteristics. J. Hebei Univ. Sci. Technol. 2015, 36, 559–565. [Google Scholar] [CrossRef]
- McDowell, A.; Begg, D.; Connor, J.; Broughton, J. Unlicensed Driving among Urban and Rural Māori Drivers: New Zealand Drivers Study. Traffic Inj. Prev. 2009, 10, 538–545. [Google Scholar] [CrossRef] [PubMed]
- Xu, Z.; Yang, X.; Zhao, X.; Li, L. Car Following Model under Emergency Evacuation Situation Based on the BP Artificial Neural Network. J. Beijing Univ. Technol. 2011, 37. Available online: https://trid.trb.org/view/1091884 (accessed on 20 March 2022).
- Drozdziel, P.; Tarkowski, S.; Rybicka, I.; Wrona, R. Drivers’ reaction Time Research in the Conditions in the Real Traffic. Open Eng. 2020, 10, 35–47. [Google Scholar] [CrossRef] [Green Version]
- Clark, N.; Pretty, R.L.; Robert, L. Transport Section. In Traffic Engineering Practice, 2nd ed.; Nicholas, C., Pretty, R.L., Eds.; Transport Section, Department of Civil Engineering, University of Melbourne: Melbourne, Australia, 1969. [Google Scholar]
- Currib, L. The Perception of Danger in a Simulated Driving Task. Ergonomics 1969, 12, 841–849. [Google Scholar] [CrossRef]
- Owens, J.M.; Lehman, R. The Effects of Distraction and Age on Reaction Time in a Driving Simulator. J. Vis. 2002, 2, 632. [Google Scholar] [CrossRef]
- Johnson, R.C.; McClearn, G.E.; Yuen, S.; Nagoshi, C.T.; Ahern, F.M.; Cole, R.E. Galton’s Data a Century Later. Am. Psychol. 1985, 40, 875–892. [Google Scholar] [CrossRef]
- Zehnder, E.C.; Schmölzer, G.M.; Van Manen, M.; Law, B.H.Y. Using Eye-Tracking Augmented Cognitive Task Analysis to Explore Healthcare Professionals’ Cognition during Neonatal Resuscitation. Resusc. Plus 2021, 6, 100119. [Google Scholar] [CrossRef]
- Svabova, L.; Durica, M. Being an Outlier: A Company Non-Prosperity Sign? Equilib. Q. J. Econ. Econ. Policy 2019, 14, 359–375. [Google Scholar] [CrossRef]
- Svabova, L.; Kramarova, K. An Analysis of Participation Factors and Effects of the Active Labour Market Measure Graduate Practice in Slovakia—Counterfactual Approach. Eval. Program Plan. 2021, 86, 101917. [Google Scholar] [CrossRef]
- Tcir, R.; Zhuk, M.; Kovalyshyn, V. Defining Duration of Driver Reaction Time Components Using the NeuroCom Complex. Econtechmod Int. Q. J. 2015, 4, 39–44. [Google Scholar]
Figure 1.
Driving simulator—study design. Source: own collaboration.

Figure 2.
Simulator with an obstacle on the screen. Source: own collaboration.

Figure 3.
Simulator with the appearance of a falling tree on the screen. Source: own collaboration.

Figure 4.
Simulator with the appearance of a wild boar on the screen. Source: own collaboration.

Figure 5.
SMI Eye Tracking 2 Wireless. Source: own collaboration.

Figure 6.
Graphical analysis of the normality. Source: own collaboration.

Figure 7.
Scatter plot of dependence of reaction time on driver’s age. Source: own collaboration.

Figure 8.
Age of drivers in clusters based on their reaction times. Source: own collaboration.

Figure 9.
Eye-tracking glasses—study design. Source: own collaboration.

Figure 10.
Examples of obstacles and view of the eye tracker. Source: own collaboration.


Table 1.
Number of participants according to their age.
| Age Group | Number of Participants | Percentile | The Average Age in the Group |
|---|---|---|---|
| young: 23–30 years | 16 | 13.8 | 25.5 |
| middle: 31–50 years | 69 | 59.5 | 41.3 |
| older: 50 and older | 31 | 26.7 | 54.3 |
| Total | 116 | 100 | 43.5 |
Source: own collaboration.
Table 2.
Descriptive characteristics of the variables used in the study.
| Characteristic\Variable | Age (Years) | Reaction Time (Seconds) | |
|---|---|---|---|
| Mean | 43.45 | 1.10 | |
| 95% Confidence Interval for Mean | Lower Bound | 41.53 | 1.06 |
| Upper Bound | 45.37 | 1.14 | |
| Median | 44.00 | 1.06 | |
| Variance | 109.14 | 0.04 | |
| Std. Deviation | 10.45 | 0.20 | |
| Minimum | 23 | 0.66 | |
| Maximum | 69 | 1.73 | |
| Range | 46 | 1.07 | |
| Interquartile Range | 15 | 0.25 | |
| Skewness | 0.17 | 0.51 | |
| Kurtosis | –0.50 | 0.31 | |
Source: own collaboration.
Table 3.
Normality tests of the reaction time.
| Reaction time | Kolmogorov–Smirnov a | Shapiro–Wilk | ||||
| Statistic | df | Sig. | Statistic | df | Sig. | |
| 0.084 | 116 | 0.144 | 0.981 | 116 | 0.105 | |
Source: own collaboration. a Lilliefors Significance Correction.
Table 4.
Regression model of reaction time.
| Coefficient | p-Value | t | Sig. | |
|---|---|---|---|---|
| (Constant) | 0.947 | 0.080 | 11.823 | <0.05 |
| age | 0.004 | 0.002 | 1.953 | 0.053 |
Source: own collaboration.
Table 5.
Reaction times and ages of the drivers in the created clusters.
| Cluster | Number of Drivers | Mean Reaction Time (Std. Deviation) | Mean Age |
|---|---|---|---|
| 1 | 20 | 0.8235 (0.0770) | 40.65 |
| 2 | 39 | 1.3912 (0.1231) | 42.79 |
| 3 | 31 | 1.0062 (0.0321) | 44.58 |
| 4 | 26 | 1.1494 (0.0488) | 45.23 |
Source: own collaboration.
Table 6.
ANOVA test for equality of mean ages.
| Age | Sum of Squares | df | Mean Square | F | Sig. |
|---|---|---|---|---|---|
| Between Groups | 295.617 | 3 | 98.539 | 0.901 | 0.443 |
| Within Groups | 12255.073 | 112 | 109.420 | ||
| Total | 12550.690 | 115 |
Source: own collaboration.
Table 7.
Eye-tracking evaluation of drivers’ reaction times.
| Driver 1 | Driver 2 | Driver 3 | Driver 4 | |
|---|---|---|---|---|
| Observation Time | 43.31 | 53.25 | 45.37 | 57.87 |
| Brake Pedal Time | 38.12 | 33.81 | 34.18 | 47.33 |
| Total | 81.43 | 87.06 | 79.55 | 105.2 |
Source: own collaboration.
Publisher’s Note: MDPI stays neutral with regard to jurisdictional claims in published maps and institutional affiliations. |
© 2022 by the authors. Licensee MDPI, Basel, Switzerland. This article is an open access article distributed under the terms and conditions of the Creative Commons Attribution (CC BY) license (https://creativecommons.org/licenses/by/4.0/).
Share and Cite
MDPI and ACS Style
Poliak, M.; Svabova, L.; Benus, J.; Demirci, E. Driver Response Time and Age Impact on the Reaction Time of Drivers: A Driving Simulator Study among Professional-Truck Drivers. Mathematics 2022, 10, 1489. https://doi.org/10.3390/math10091489
AMA Style
Poliak M, Svabova L, Benus J, Demirci E. Driver Response Time and Age Impact on the Reaction Time of Drivers: A Driving Simulator Study among Professional-Truck Drivers. Mathematics. 2022; 10(9):1489. https://doi.org/10.3390/math10091489
Chicago/Turabian StylePoliak, Milos, Lucia Svabova, Jan Benus, and Ebru Demirci. 2022. "Driver Response Time and Age Impact on the Reaction Time of Drivers: A Driving Simulator Study among Professional-Truck Drivers" Mathematics 10, no. 9: 1489. https://doi.org/10.3390/math10091489
Note that from the first issue of 2016, this journal uses article numbers instead of page numbers. See further details here.