
Confidence-Interval-Based Fuzzy Testing for the Lifetime Performance Index of Electronic Product

1
Department of Industrial Engineering and Management, National Chin-Yi University of Technology, Taichung 411030, Taiwan
2
Institute of Innovation and Circular Economy, Asia University, Taichung 413305, Taiwan
3
Department of Business Administration, Chaoyang University of Technology, Taichung 413310, Taiwan
4
Department of Finance, National Taichung University of Science and Technology, Taichung 404336, Taiwan
*
Authors to whom correspondence should be addressed.
Mathematics 2022, 10(9), 1405; https://doi.org/10.3390/math10091405
Submission received: 22 March 2022
/
Revised: 14 April 2022
/
Accepted: 20 April 2022
/
Published: 22 April 2022
(This article belongs to the Special Issue Fuzzy Applications in Industrial Engineering)
Abstract
:When the lifetime of an electronic component does not reach the required level, it can be enhanced by means of the paralleling current sharing backup system or the redundant backup system. The lifetime of the redundant backup system is the sum of lifetimes of all electronic components, which is the maximum of all the electronic components’ lifetimes, compared with the lifetime of the parallel current sharing backup system. For the purpose of enhancing products’ reliability, electronic goods are usually designed with spare electronic components. If it is assumed that there are redundant backup components for each electronic product, then the lifetime of the electronic product will be distributed as a Gamma distribution with two parameters— and , where is the mean for each lifetime of each electronic component. According to numerous studies, the sample size is not large, as it takes a long time to test the lifetime of an electronic product, and enterprises consider cost and timeliness. This paper concerns the performance index of the lifetime of the electronic product. Therefore, based on the confidence interval, this paper aims to develop a fuzzy testing model. As this model can integrate past data and expert experience, the testing accuracy can be retained despite small-sized samples. In fact, through adopting the testing model proposed by this paper, companies can make precise and intelligent decisions instantly with the use of small-sized samples to grasp the opportunities for improvement.
Keywords:
lifetime of the electronic product; redundant backup components; fuzzy testing method; gamma distribution; confidence intervalMSC:
62C05; 62C861. Introduction
According to some studies, electronic products are usually designed with spare electronic components to increase the product reliability [1,2,3,4,5]. When an electronic product has only one electronic component without any spare electronic components, improving the lifetime of the electronic component can help prolong the lifetime of the electronic product. If the lifetime of the electronic component cannot be leveled up to the required level in a short time, the parallel current-sharing backup system or redundant backup system can be used to increase the lifetime of the electronic product. Based on the research of Chen et al. [6], the concept of the parallel current sharing system is that all the backup batteries run together until the maximum battery lifetime fails and stops working. Such products include high-power battery pack testers and digital parallel high-efficiency water-cooled power supplies. The redundant backup system is activated when the primary electronic component fails, and then the product will immediately switch the primary electronic component to a spare. Such products include the time synchronization system and the channel analog multiplexer (high electrostatic discharge protection multiplexer). Moreover, Chen et al. [6] indicated that during the failure of the primary component, the redundant backup system will be activated instantaneously, and the system will automatically switch to the spare component. Assume that for each electronic product, there are m electronic components; then, the lifetime of the electronic product is for the redundancy backup system, where represents the lifetime of the electronic component, . The lifetime of the electronic component () follows an exponential distribution with mean λ [7,8]. Chen et al. [6] noted that the characteristic function of is , and the characteristic function of is . Therefore, is distributed as a Gamma distribution with two parameters— and , denoted by ~. The probability density function of is
Obviously, the lifetime of the electronic product belongs to the larger-the-best quality characteristic [9,10,11]. According to this condition, Chen et al. [6] proposed a lifetime performance index of the electronic product below:
where L represents the warranty period and is the expected value of . When the average lifetime of electronic products is , the lifetime performance index is 0; the larger the average lifetime value , the greater the value of the lifetime performance index . As the value of the lifetime performance index approaches infinity, the electronic component lifetime performance index also approaches 1 and 1. In addition, the product reliability is
Obviously, the product reliability is a function of index . The partial differentiation of by is bigger than zero as follows:
Therefore, is an increasing function of . The higher the value of the lifetime performance index , the higher the product reliability . It is clearly seen that the electronic product lifetime performance index can reflect product reliability, which is an excellent index for evaluating the lifetime performance of electronic products. Moreover, Chen et al. [6] discovered the uniformly minimum variance unbiased estimator (UMVUE) and the uniformly most powerful (UMP) test for index . As the data collection time of the electronic product lifetime is relatively long, some scholars have shortened the time of collecting sample data by means of accelerating tests. However, the shortcoming is that the lifetime data are not complete. In addition, according to various studies, the Internet of Things and big data analysis technologies have gradually matured, so fast, precise, and intelligent decision-making can help businesses grasp the opportunities for improvement [12,13,14,15]. To solve the above-mentioned problems, this paper proposes a fuzzy testing model built on the confidence interval of lifetime performance index . The advantages of this fuzzy test proposed in this paper are as follows:
- (1)
- The sample data obtained from this model are more complete than the sample data received from the accelerated tests.
- (2)
- Obtaining the lifetime sample data through the tests is easier than receiving the triangular fuzzy number data. Then, the fuzzy membership function is constructed with the confidence interval, and the fuzzy evaluation rules are established by calculating easy simple ratios, convenient for the industry to apply.
- (3)
- (4)
- This model can integrate past data and expert experience. Despite small-sized samples, the testing accuracy can still be maintained [18].
The remainder of this paper is organized as follows: In Section 2, we derive the 100(1 )% confidence interval of index . Next, we propose a confidence-interval-based fuzzy testing method to evaluate the electronic product lifetime performance and determine whether the performance needs to improve. Section 4 shows a numerical example, demonstrating the applicability of the approach proposed by this paper. Finally, Section 5 presents the conclusions.
2. Confidence Interval of Index
Assuming that is a random sample of with sample size n, the uniformly minimum variance unbiased estimator of can be shown below [6]:
where . Assuming that the characteristic function of is , is distributed as .
Furthermore, let
then is distributed as and
Let be the observed values of , then the observed value of is
where . Thus, the observed values of the lower confidence limit and upper confidence limit can be presented as follows:
3. Fuzzy Testing Method
As mentioned earlier, the fuzzy testing based on the confidence interval can still maintain the testing accuracy in the case of small samples. Therefore, based on the confidence interval of the lifetime performance index derived in Section 2, a fuzzy testing method is proposed to evaluate whether the lifetime performance of electronic products reaches the required level. If the lifetime performance index of electronic products is required to be at least k, then
(The lifetime performance of electronic products reaches the required level.)
(The lifetime performance of electronic products does not reach the required level.)
Based on Equations (10) and (11), using Buckley’s approach proposed by Buckley [19], the of the triangular-shaped fuzzy number with is
where
Thus, the triangular-shaped fuzzy number is , where
In addition, the membership function of is
where and are determined by
and
Before the fuzzy testing method was proposed, the statistical testing rules were first reviewed and are listed below:
- (1)
- If the upper confidence limit is , then do not reject ( ).
- (2)
- If the upper confidence limit is , then reject and assume that .
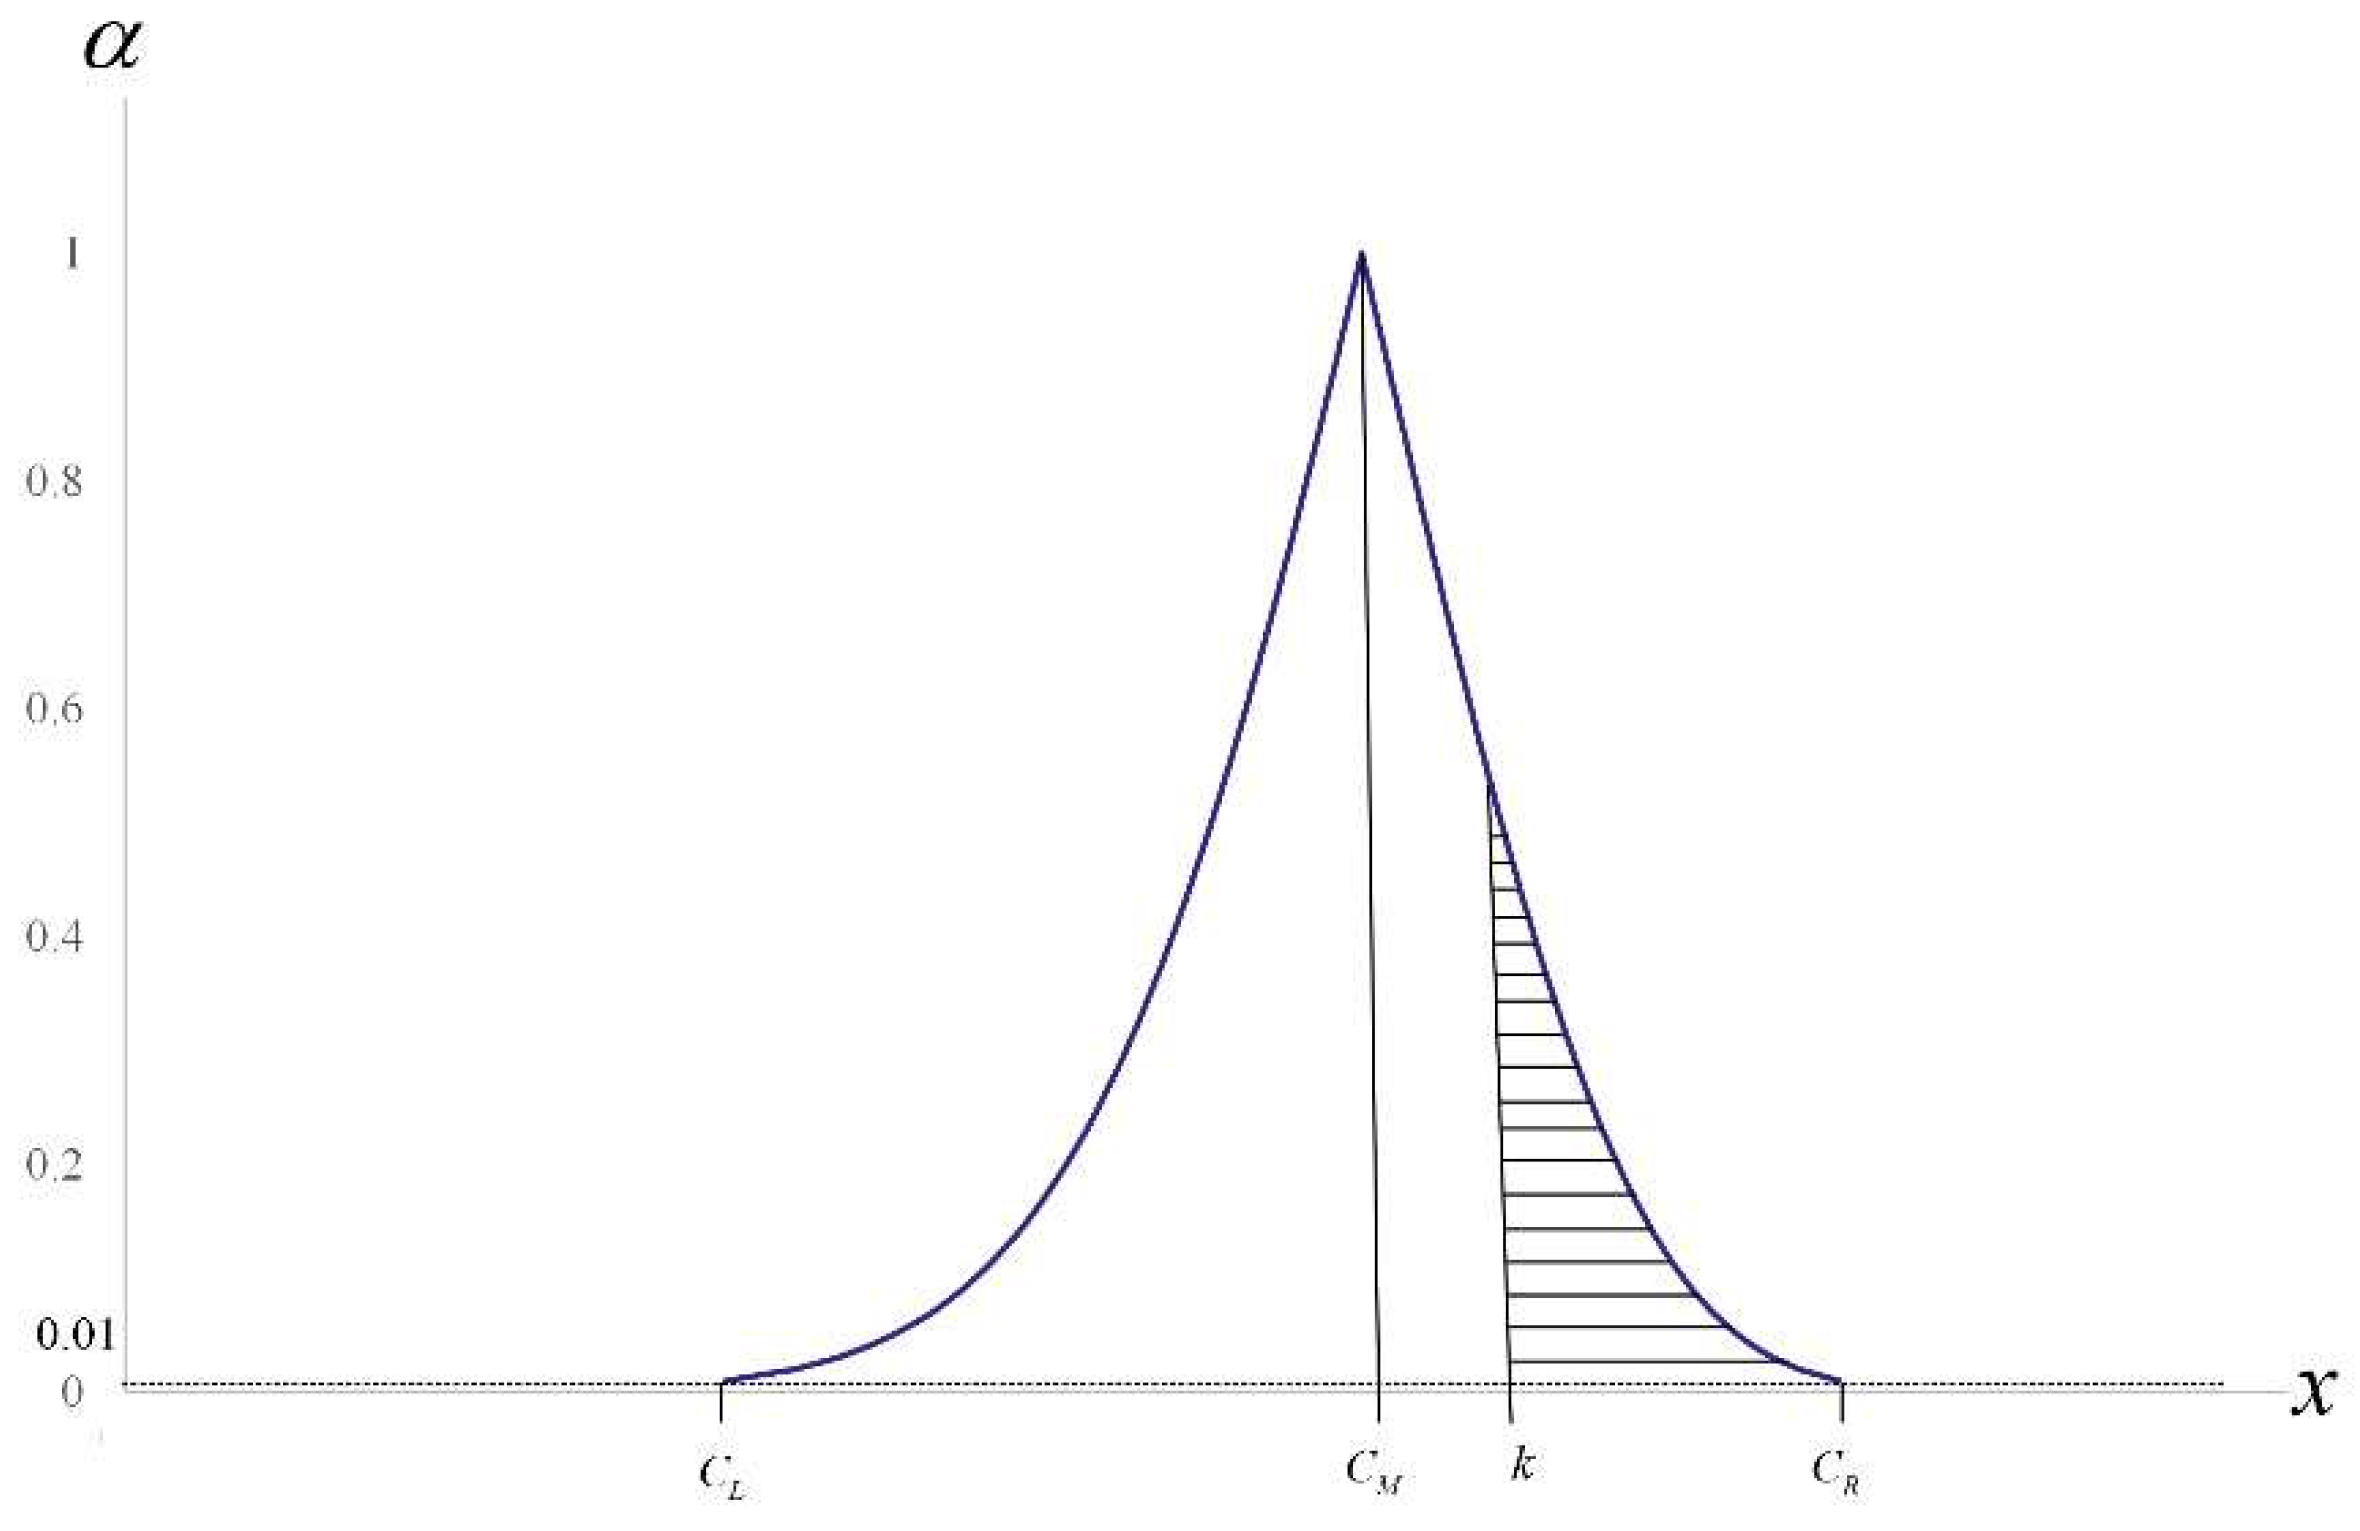
Next, this paper constructed a fuzzy testing method based on the above-mentioned statistical testing rules. Figure 1 presents a diagram of membership functions of with vertical line .
Then, let the set represent the area sandwiched between the membership function and the x-axis as follows:
Let denote the area of the set . Based on Buckley [19], it is difficult to calculate the area of directly via the integration. Therefore, this paper adopted the method of Chen et al. [20] to cut set into 100 approximately trapezoidal blocks, and let set represent the lth block of and , for , where represents the largest integer less than or equal to . Then, and cut set into 100 approximately trapezoidal blocks, and the lth block of can be shown as follows:
where
Let , then
Obviously, we have based on Equation (12) and based on Equation (25). Let denote the area of set , then the approximate area of is
Thus,
Let be the area in the graph of but to the right of the vertical line , then
where such that . Clearly, and cut set into blocks, and the lth block of can be shown as follows:
where . Let , then
Obviously, we have based on Equation (12) and based on Equation (30). Let the area of be , then the approximate area of is
Thus,
Based on Equations (27) and (31), we have
Note that we let , where the values of and can be determined based on the past accumulated production data or expert experience [21,22]. As noted by Yu et al. [23] and Buckley [19], we may obtain the following fuzzy testing rules:
- If , then reject and assume that .
- If , then do not make any decision on whether to reject or not.
- If , then do not reject and assume that .
4. Numerical Example
A numerical example is presented in this section to illustrate the fuzzy testing method outlined in Section 3. To determine whether the lifetime performance index value of an electronic product is bigger than or equal to 0.75, the null hypothesis and alternative hypothesis can be displayed as follows:
;
.
In this paper, we suppose that an enterprise adds an electronic component to the redundant backup system to increase the reliability of the electronic product, which means that the electronic product has a total of two electronic components (). Let be the observed values of , then the observed value of is
Thus, the triangular-shaped fuzzy number is , where
In addition, the membership function of with triangular-shaped fuzzy number is
where and are determined by
and
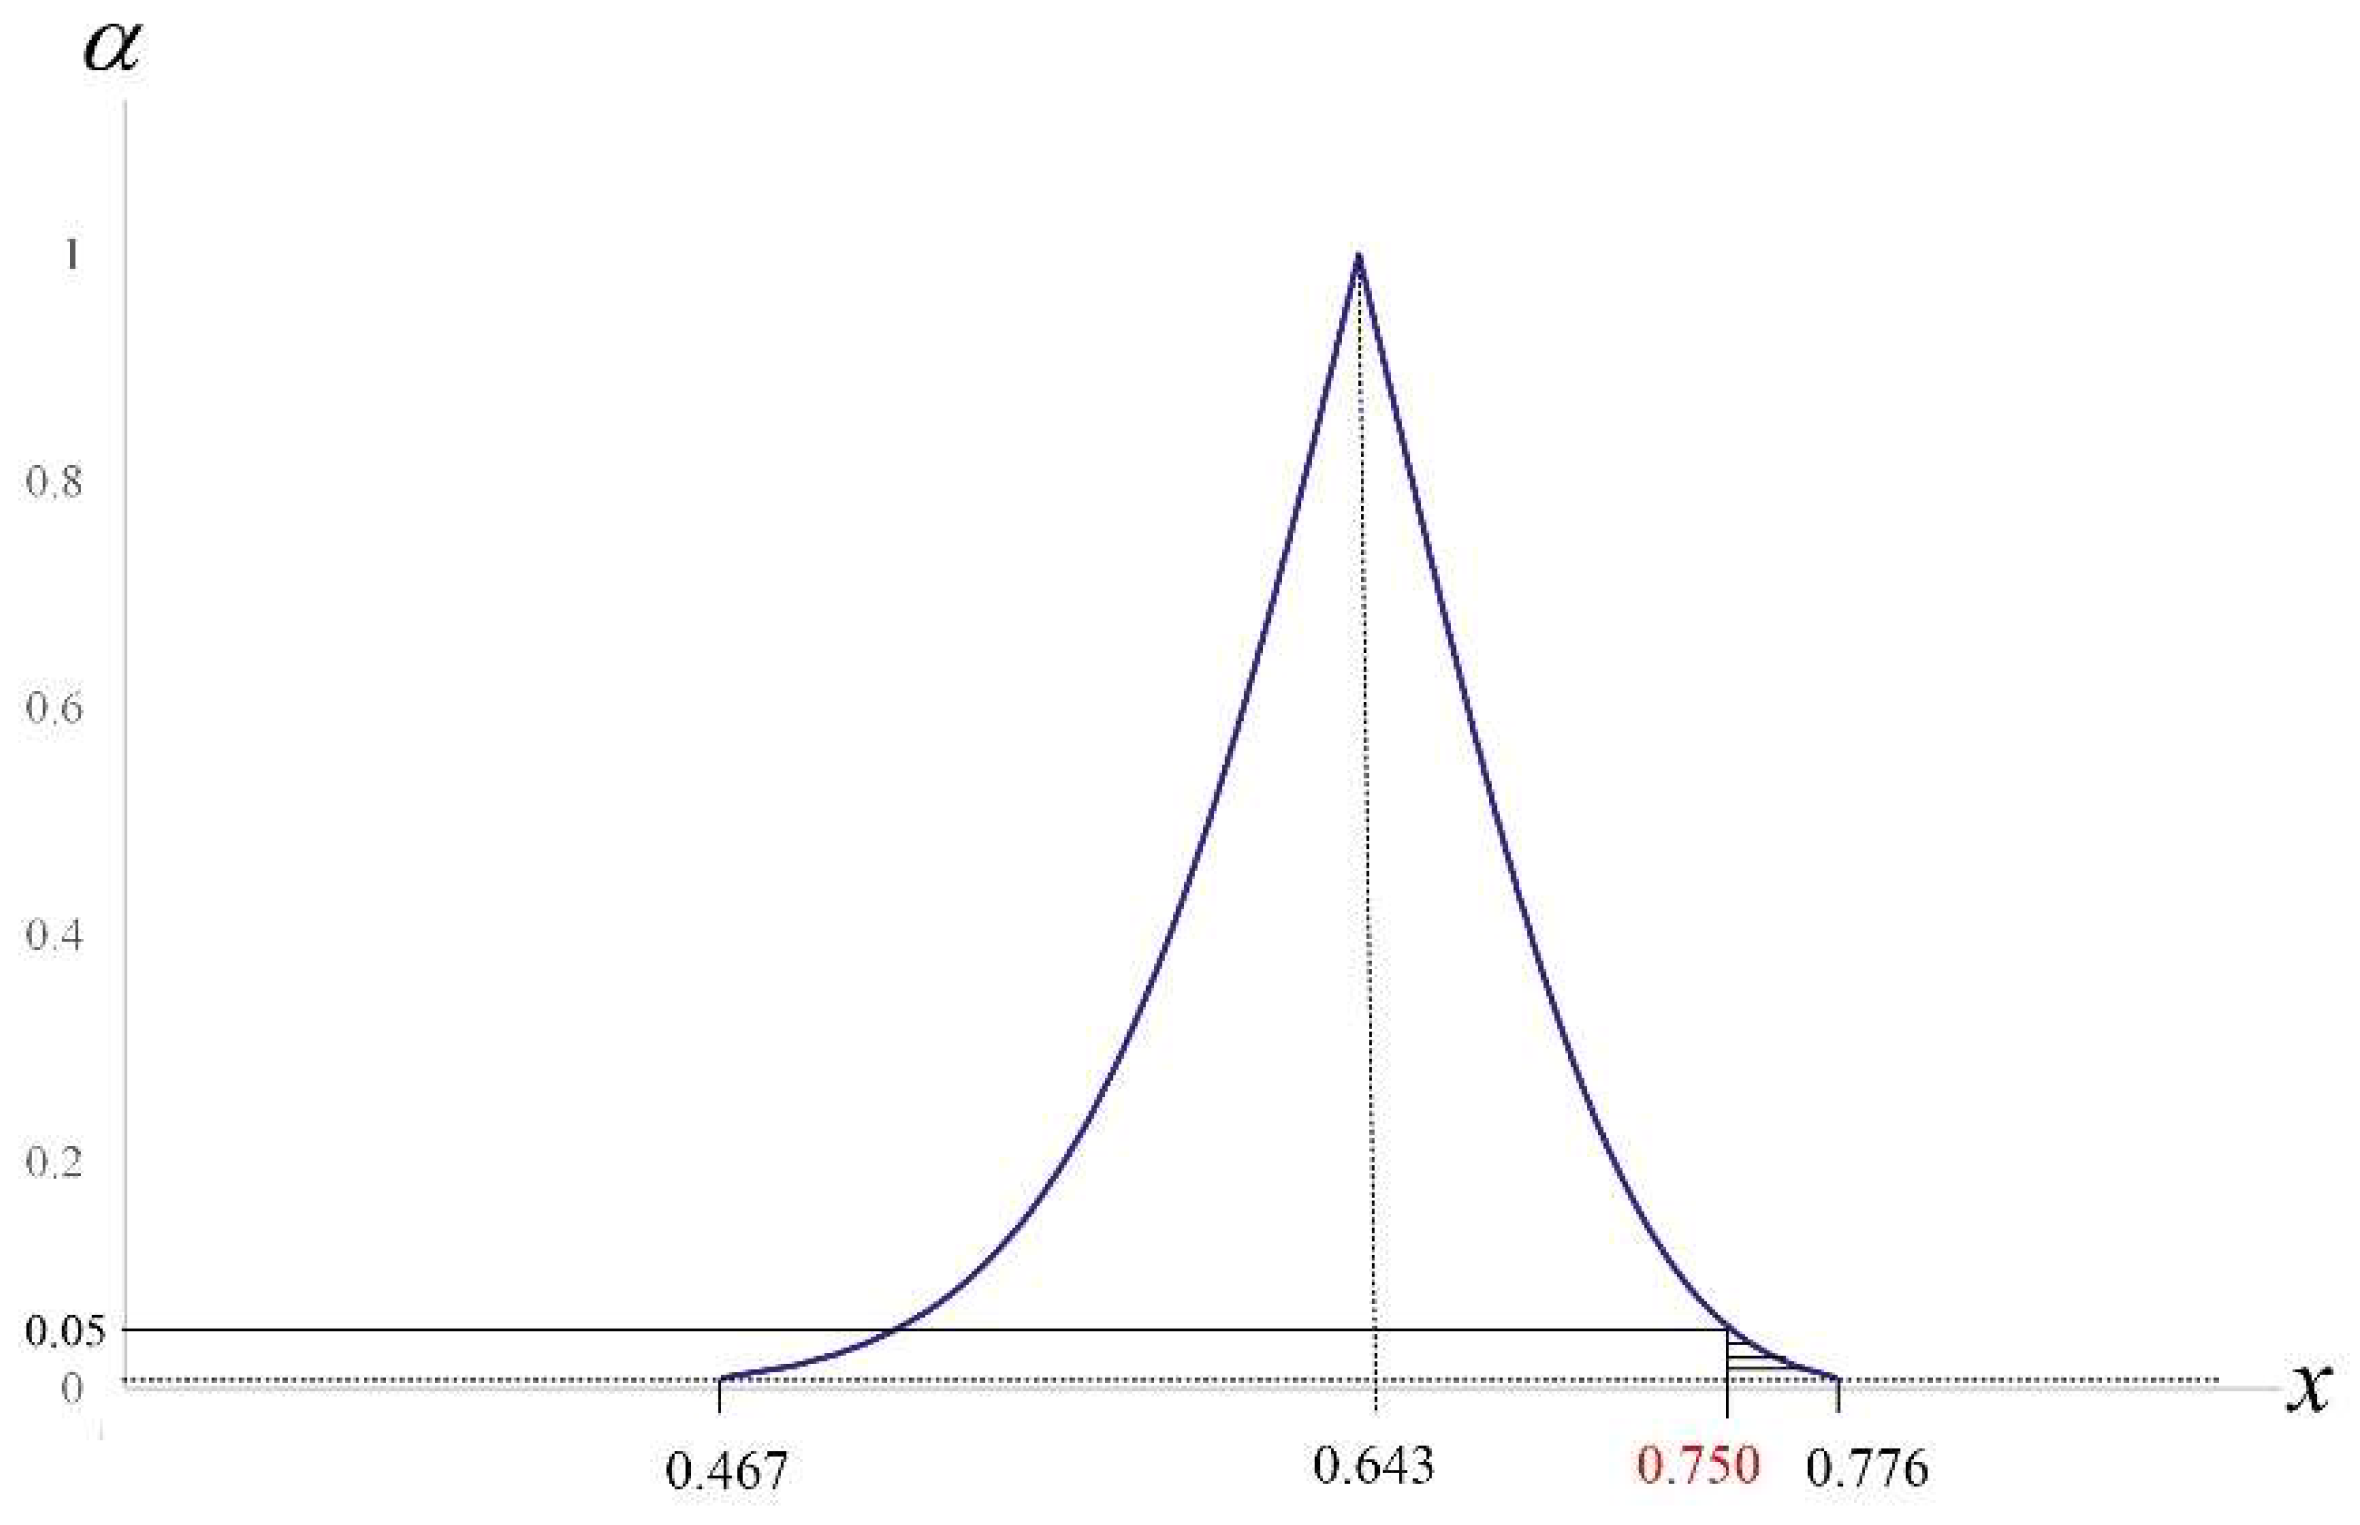
Figure 2 presents a diagram of membership functions of with triangular-shaped fuzzy number and vertical line x 0.75.
When , . Based on Equation (31), we have
According to Equation (27), we have
Thus,
Chen et al. [21] noted that the value of that can be obtained from practice is equal to 0.2 and the value of is 0.4. As 0.007, reject and conclude that 0.75, showing that the lifetime performance of the electronic product does not reach the required level. Consequently, the operation must be improved.
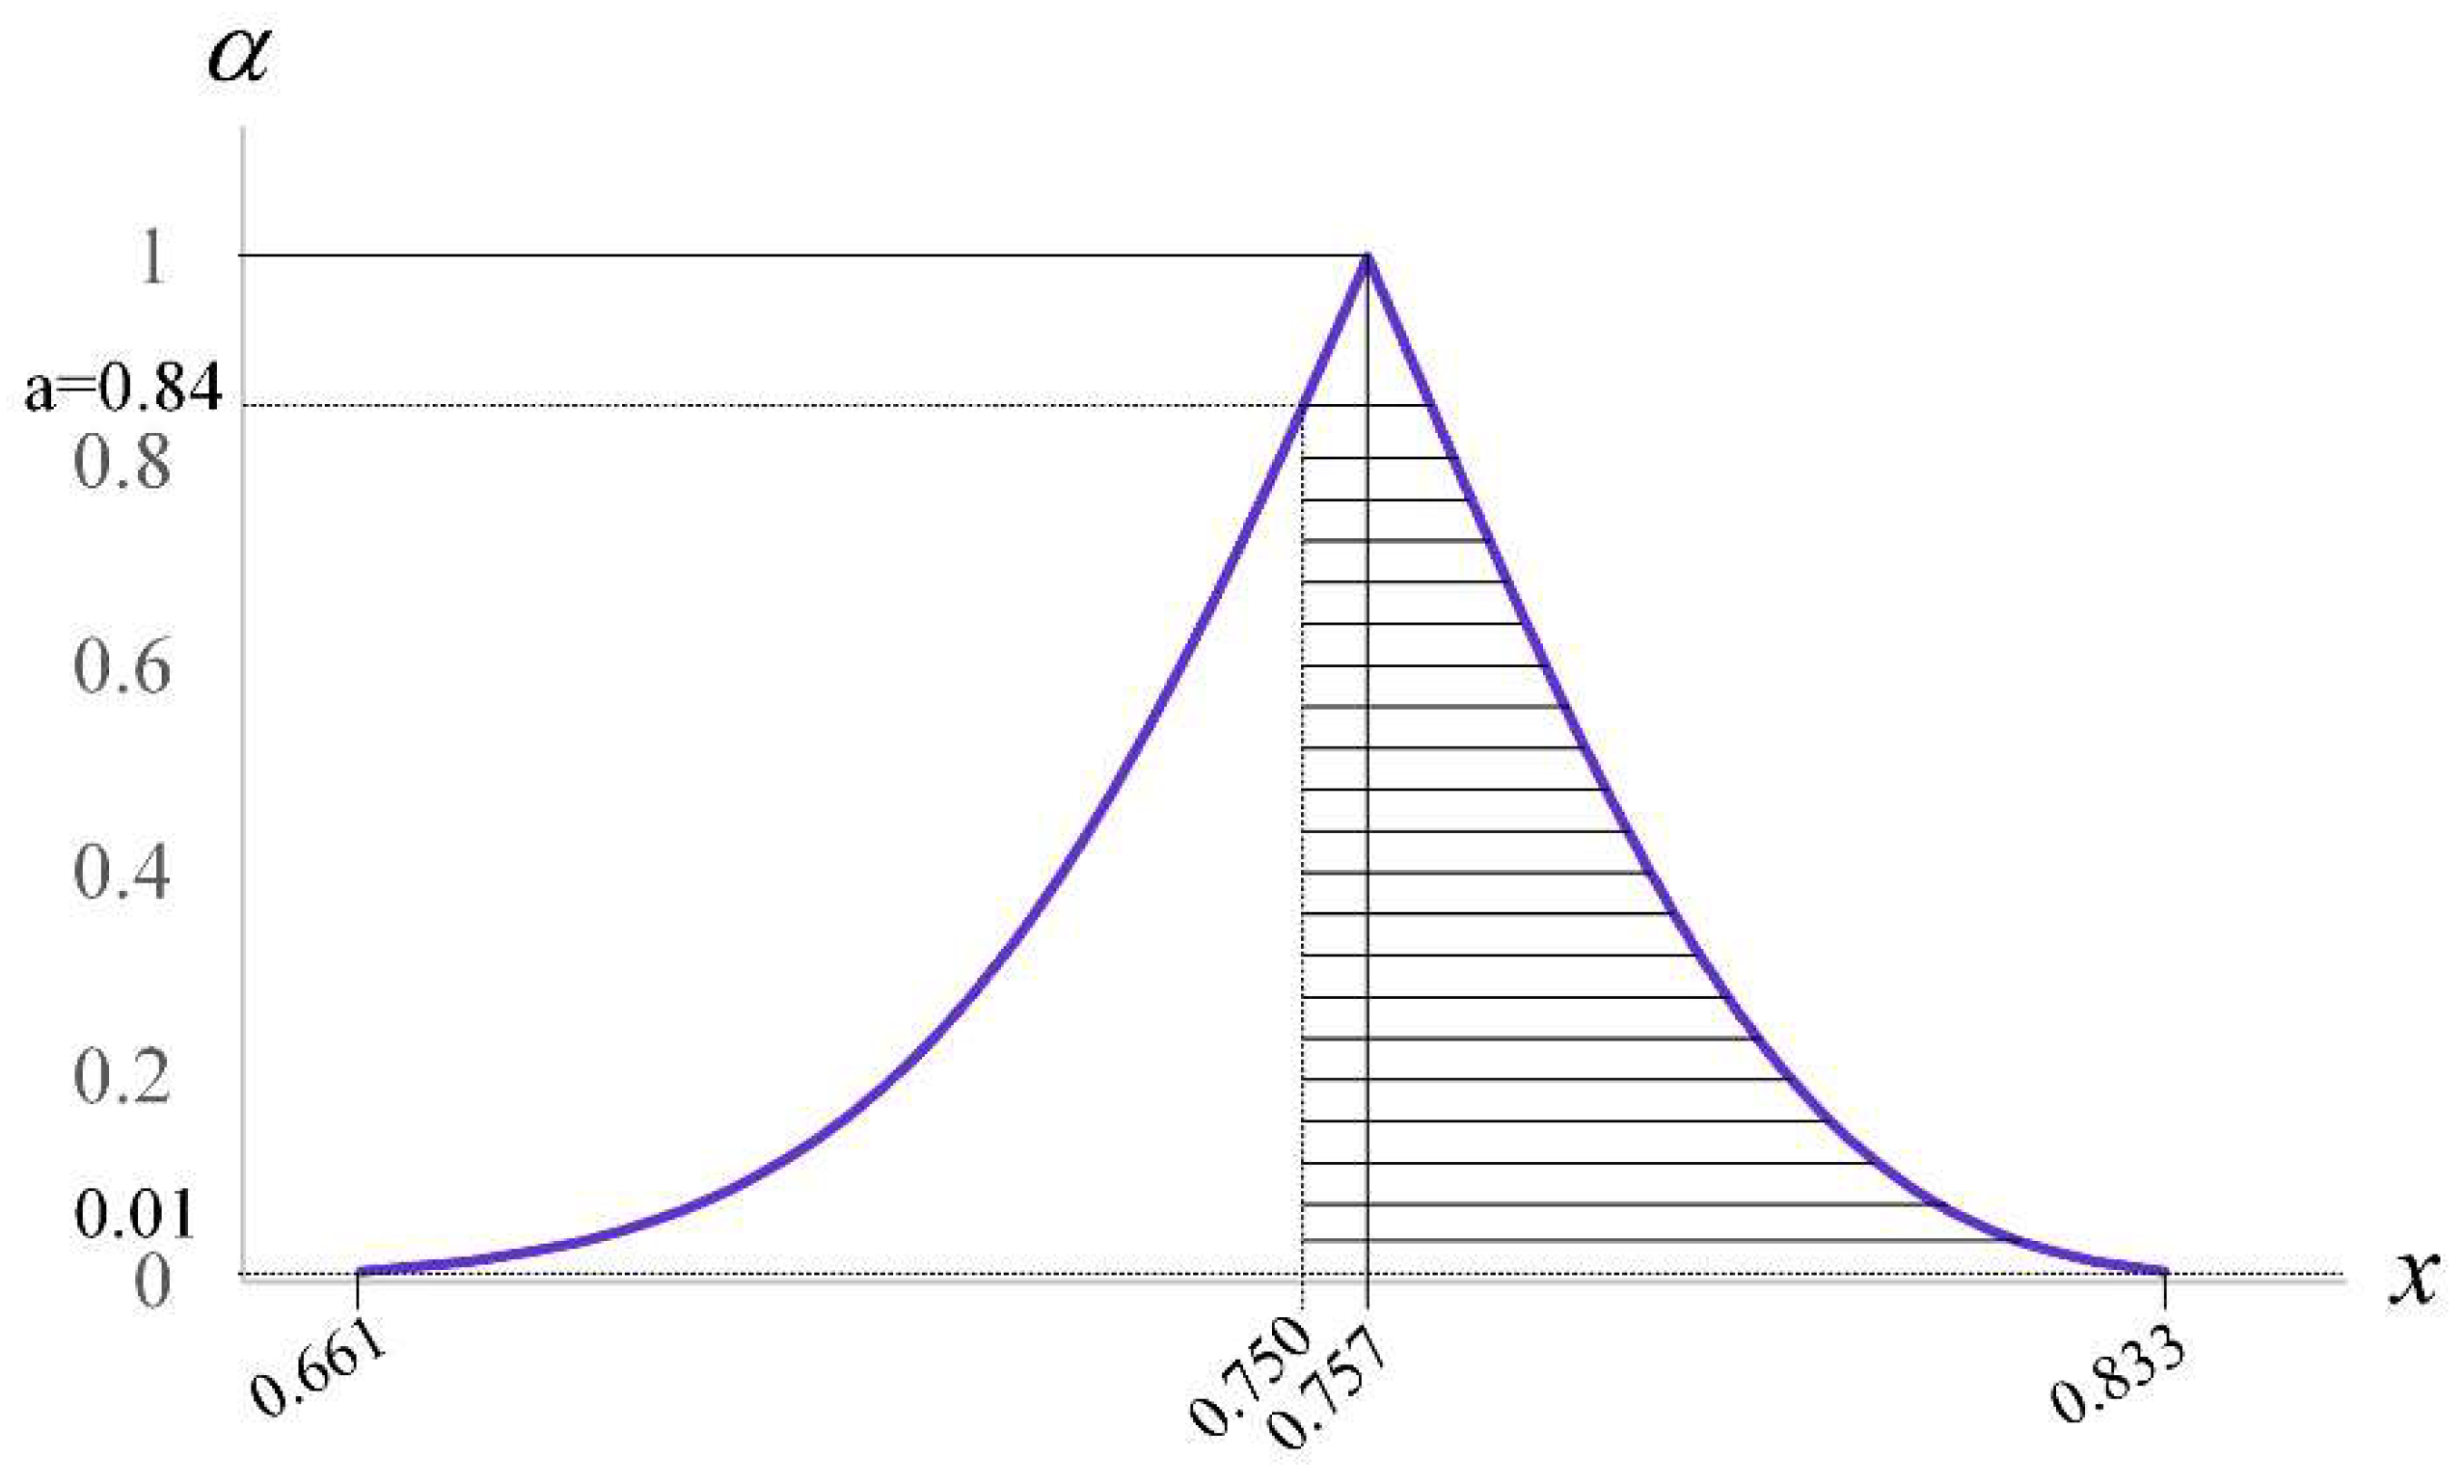
As 0.65 is smaller than the minimum required value of index 0.75, it is obvious that the fuzzy evaluation model of this paper is used so that the opportunity for improvement will not be missed. The reliability engineer decided to add a spare electronic component, that is, . Let be the observed values of , then the observed value of is
Thus,
Then, the triangular-shaped fuzzy number is , and the membership function of is
where and are determined by
and
Figure 3 presents a diagram of membership functions of with triangular-shaped fuzzy number and vertical line x 0.750.
When , . Based on Equation (31), we have
According to Equation (27), we have
Thus,
As 0.579 >, do not reject , and conclude that with , showing that the lifetime performance of the electronic product reaches the required level.
5. Conclusions
Several studies have noted that for the purpose of enhancing product reliability, electronic goods are usually designed with spare electronic components. In consideration of generality, this paper assumed that there are m electronic components for each electronic product. According to Chen et al. [6], during the failure of the primary component, the redundant backup system will be activated instantaneously, and the system will automatically switch to the spare component. Therefore, the lifetime of each electronic component follows an exponential distribution with mean λ, and the lifetime of the electronic products is distributed as . Based on the above, this paper derived the 100() confidence interval of an electronic product lifetime performance index. Next, this paper proposed a confidence-interval-based fuzzy testing method to evaluate whether the reliability of the electronic product reaches the required level. This fuzzy evaluation method is based on the confidence interval of the index and thus can reduce the probability of misjudgment due to sampling error. In addition, according to many studies, this model can incorporate the past accumulated data or expert experience, so that the testing accuracy can still be maintained despite small-sized samples. Finally, a numerical example was provided to demonstrate the application of the fuzzy testing model proposed in this paper in order to help enterprises apply this fuzzy testing model to make fast, accurate, and intelligent decisions in the case of small samples, as well as grasp opportunities for improvement.
In fact, using the past accumulated data experience or expert experience to evaluate the data of small samples can meet companies’ expectations of rapid response, as well as maintain the accuracy of the evaluation. However, the limitation of the study is that this paper did not explore the reliability of data experience or expert experience verified by scientific methods, so a future research direction can focus on exploring the reliability of the verified data experience or expert experience. Meanwhile, when the lifetime is neither an exponent nor a Gamma distribution, it is also an important issue worth discussing in the future.
Author Contributions
Conceptualization, C.-M.Y. and K.-S.C.; methodology, C.-M.Y. and K.-S.C.; software, T.-H.H.; validation, T.-H.H.; formal analysis, C.-M.Y. and K.-S.C.; resources, T.-H.H.; data curation, T.-H.H.; writing—original draft preparation, C.-M.Y., K.-S.C. and T.-H.H.; writing—review and editing, C.-M.Y. and K.-S.C.; visualization, T.-H.H.; supervision, K.-S.C.; project administration, C.-M.Y. All authors have read and agreed to the published version of the manuscript.
Funding
This research received no external funding.
Institutional Review Board Statement
Not applicable.
Informed Consent Statement
Not applicable for studies not involving humans.
Conflicts of Interest
The authors declare no conflict of interest.
References
- Ebling, C.E. An Introduction to Reliability Engineering; McGraw-Hill: New York, NY, USA, 1997. [Google Scholar]
- Tavakkoli-Moghaddam, R.; Safari, J.; Sassani, F. Reliability optimization of series-parallel systems with a choice of redundancy strategies using a genetic algorithm. Reliab. Eng. Syst. Saf. 2008, 93, 550–556. [Google Scholar] [CrossRef]
- Livni, H. Life cycle maintenance costs for a non-exponential component. Appl. Math. Model. 2022, 103, 261–286. [Google Scholar] [CrossRef]
- Mi, J.; Li, Y.F.; Beer, M.; Broggi, M.; Cheng, Y. Importance measure of probabilistic common cause failures under system hybrid uncertainty based on bayesian network. Eksploat. Niezawodn. 2020, 22, 112–120. [Google Scholar] [CrossRef]
- Jamroziak, K.; Kwasniowski, S.; Kosobudzki, M.; Zajac, P. Intelligent forecasting of automatic train protection system failure rate in china high-speed railway. Eksploat. Niezawodn. 2019, 21, 567–576. [Google Scholar] [CrossRef]
- Chen, K.S.; Chiou, K.C.; Yu, C.M. Lifetime performance index of electronic products. Microelectron. Reliab. 2020, 113, 113941. [Google Scholar] [CrossRef]
- Anderson, D.R.; Sweeney, D.J.; Williams, T.A. Statistics for Business and Economics; West Publishing Company: Saint Paul, MN, USA, 1990. [Google Scholar]
- Keller, G.; Warrack, B.; Bartel, H. Statistics for Management and Economics; Duxbury Press: Belmont, CA, USA, 1994. [Google Scholar]
- Wu, S.F.; Chang, W.T. Power comparison of the testing on the lifetime performance index for rayleigh lifetime products under progressive type I interval censoring. Commun. Stat.-Simul. Comput. 2021. [Google Scholar] [CrossRef]
- Wu, J.W.; Hong, C.W. The assessment of quality performance of lifetime index of exponential products with fuzzy data under progressively type ii right censored sample. ICIC Express Lett. Part B Appl. 2018, 9, 1101–1107. [Google Scholar] [CrossRef]
- Lee, H.M.; Wu, J.W.; Lei, C.L. Assessing the lifetime performance index of exponential products with step-stress accelerated life-testing data. IEEE Trans. Reliab. 2013, 62, 296–304. [Google Scholar] [CrossRef]
- Chirumalla, K. Building digitally-enabled process innovation in the process industries: A dynamic capabilities approach. Technovation 2021, 105, 102256. [Google Scholar] [CrossRef]
- Gopalakrishnan, S.; Kumaran, M.S. Iiot framework based ml model to improve automobile industry product. Intell. Autom. Soft Comput. 2022, 31, 1435–1449. [Google Scholar] [CrossRef]
- Lin, K.P.; Yu, C.M.; Chen, K.S. Production data analysis system using novel process capability indices-based circular economy. Ind. Manag. Data Syst. 2019, 119, 1655–1668. [Google Scholar] [CrossRef]
- Liu, J.; Ma, C.; Gui, H.; Wang, S. A four-terminal-architecture cloud-edge-based digital twin system for thermal error control of key machining equipment in production lines. Mech. Syst. Signal Proc. 2022, 166, 108488. [Google Scholar] [CrossRef]
- Wu, C.H.; Hsu, Y.C.; Pearn, W.L. An improved measure of quality loss for notching processes. Qual. Reliab. Eng. Int. 2021, 37, 108–122. [Google Scholar] [CrossRef]
- Chen, K.S.; Yu, C.M. Lifetime performance evaluation and analysis model of passive component capacitor products. Ann. Oper. Res. 2021, 311, 51–64. [Google Scholar] [CrossRef]
- Chen, K.S. Fuzzy testing decision-making model for intelligent manufacturing process with Taguchi capability index. J. Intell. Fuzzy Syst. 2020, 38, 2129–2139. [Google Scholar] [CrossRef]
- Buckley, J.J. Fuzzy statistics: Hypothesis testing. Soft Comput. 2005, 9, 512–518. [Google Scholar] [CrossRef]
- Chen, K.S.; Wang, C.H.; Tan, K.H. Developing a fuzzy green supplier selection model using Six Sigma quality indices. Int. J. Prod. Econ. 2019, 212, 1–7. [Google Scholar] [CrossRef]
- Chen, K.S.; Yu, C.M. Fuzzy test model for performance evaluation matrix of service operating systems. Comput. Ind. Eng. 2020, 140, 106240. [Google Scholar] [CrossRef]
- Yu, C.M.; Luo, W.J.; Hsu, T.H.; Lai, K.K. Two-Tailed Fuzzy Hypothesis Testing for Unilateral Specification Process Quality Index. Mathematics 2020, 8, 2129. [Google Scholar] [CrossRef]
- Yu, C.M.; Chen, K.S.; Lai, K.K.; Hsu, C.H. Fuzzy Supplier Selection Method Based on Smaller-The-Better Quality Characteristic. Appl. Sci. 2020, 10, 3635. [Google Scholar] [CrossRef]
Figure 1.
Membership functions of with vertical line .

Figure 2.
Membership functions with and vertical line 0.75.

Figure 3.
Membership functions with and vertical line 0.750.

Publisher’s Note: MDPI stays neutral with regard to jurisdictional claims in published maps and institutional affiliations. |
© 2022 by the authors. Licensee MDPI, Basel, Switzerland. This article is an open access article distributed under the terms and conditions of the Creative Commons Attribution (CC BY) license (https://creativecommons.org/licenses/by/4.0/).
Share and Cite
MDPI and ACS Style
Yu, C.-M.; Chen, K.-S.; Hsu, T.-H. Confidence-Interval-Based Fuzzy Testing for the Lifetime Performance Index of Electronic Product. Mathematics 2022, 10, 1405. https://doi.org/10.3390/math10091405
AMA Style
Yu C-M, Chen K-S, Hsu T-H. Confidence-Interval-Based Fuzzy Testing for the Lifetime Performance Index of Electronic Product. Mathematics. 2022; 10(9):1405. https://doi.org/10.3390/math10091405
Chicago/Turabian StyleYu, Chun-Min, Kuen-Suan Chen, and Ting-Hsin Hsu. 2022. "Confidence-Interval-Based Fuzzy Testing for the Lifetime Performance Index of Electronic Product" Mathematics 10, no. 9: 1405. https://doi.org/10.3390/math10091405
Note that from the first issue of 2016, this journal uses article numbers instead of page numbers. See further details here.