
Modelling Deprivation Level and Multimorbidity in a Health District
by
 and
and
María Pilar Botija Yagüe
1,*, 
Sofía Sorbet-Santiago
2,
Javier Díaz-Carnicero
2,
Silvia González-de-Julián
2 and
Ruth Usó-Talamantes
3 1
Hospital Valencia Clínico—La Malvarrosa, 46011 Valencia, Spain
2
Research Unit for Health Economics and Management, Universitat Politècnica de València, 46022 Valencia, Spain
3
Conselleria de Sanitat i Salut Pública, Generalitat Valenciana, 46010 Valencia, Spain
*
Author to whom correspondence should be addressed.
Mathematics 2022, 10(4), 659; https://doi.org/10.3390/math10040659
Submission received: 12 January 2022
/
Revised: 11 February 2022
/
Accepted: 17 February 2022
/
Published: 20 February 2022
(This article belongs to the Special Issue Mathematical Prediction Models Applied to Health Management)
Abstract
:Deprivation is associated with an increased risk of developing chronic health conditions and with worse outcomes in multimorbidity. The goal of our study was to develop an integrated population index of deprivation (IPID) to observe the influence of deprivation on morbidity and the subsequent use of healthcare resources in one health district, using the socioeconomic, clinical and geographical data from its administrative health records. Eight socioeconomic indicators were identified and weighted using the methodology of two-phase principal component analysis, providing an index that allowed each census section to be classified into seven deprivation groups. Secondly, the possible relation between the IPID and the variables for multimorbidity and healthcare resources was analysed using the theory of multiple comparisons. It was observed that places with a greater proportion of healthy people presented lower values of deprivation and that, at lower levels of deprivation, there were fewer hospital admissions. The results show that living in an area with a higher deprivation index is associated with greater consumption of healthcare resources and disease burden. Identifying areas of sociosanitary vulnerability can help to identify health inequalities and allow intervention by clinical practices and healthcare management to reduce them.
1. Introduction
In recent years, many strategies have been developed to detect and deal with social inequalities. In fact, this field of study presents a great impact on healthcare management, where one of the main research topics has been based on determining how inequality affects health. In healthcare, the term inequality is closely related to sociosanitary vulnerability [1], which can be defined as a complex multidimensional concept that needs to take into account the vulnerability produced by material deprivation, social deprivation and the burden of disease, or to healthcare deprivation, which in turn requires the development of tools that can measure them. In this context, it is a priority to understand what the main dimensions involving sociosanitary vulnerability are, and what their impact on society is.
Multiple studies highlight the importance of the area of residence in sociosanitary vulnerability [2,3,4,5,6,7]. In the field of healthcare management, it is increasingly necessary to discover how a determined residential area affects health, as the effect of this may be different to the impact of other individual factors or determinants [8]. The development of geographical context indicators is a challenge for monitoring the sociosanitary determinants [9,10], and a tool that can be used by healthcare managers to prioritise interventions. In order to implement this monitoring using socioeconomic indicators, one can use simple indicators such as unemployment rates, or compound indicators such as deprivation indices [2,3,11].
Deprivation indices measure the lack of economic and social resources and are applied to small geographical areas, which allows their classification from least to greatest deprivation. Their use began in the 1980s, with the best-known being the indices of Towsend [4], Carstairs [12], Morris [5] and the Index of Multiple Deprivation in the United Kingdom [6]. All of these were developed using different socioeconomic indicators weighted using theoretical weights or the result of a multivariant statistical model. If the number of variables is very high, methods for the reduction of variables are used, such as principal component analysis (PCA), which allows the dimensions to be reduced while minimising the loss of information [2,3,12,13]. This technique allows the final index to be obtained as a linear combination of the variables introduced, offering the advantage of giving a greater weight to those variables with greater variability. In these studies, the census section is used as the territorial unit for analysis. This is a partition of the municipal area, with clearly identifiable limits and a population no greater than 2500 inhabitants, and where the characteristics of the resident population are considered to be homogeneous. In Spain, important studies have been carried out on social inequalities in health using deprivation indices compiled from census data [2,3] and obtained from the National Institute of Statistics [7].
The importance of sociosanitary vulnerability has been widely discussed in different healthcare plans [2,3,12]. In Spain, the National Public Health System organises care by areas or healthcare districts (HD) [14,15]. As the healthcare system is one of the social determinants of health, the areas comprising the HDs are ideal for the study of health inequalities [9,16]. In its Health Plan for the Valencian Community (2016–2020), the autonomous government of the Valencian Community, a region in the East of Spain, established among its strategies the reinforcement of gender equality, the reduction of inequalities in health and the encouragement of participation [17]. One of the actions to implement this is to reinforce interventions in the most affected or vulnerable groups in order to reduce the detected inequality.
Furthermore, the COVID-19 pandemic has demonstrated that its impact has not been equal on everybody. A recent publication from the Spanish Ministry of Health distinguishes, firstly, the social vulnerability produced by the deprivation of resources and public and community structures that can lead to individuals or communities suffering a lack of material, emotional and relational protection. It also notes the clinical vulnerability related to characteristics of the individual such as age, certain chronic diseases or cancer and, thirdly, the epidemiological vulnerability related to greater epidemiological risk due to greater exposure to infection, delay in diagnosis or difficulty in implementing protective measures and self-isolation [18].
The socioeconomic indicators that measure social inequalities in health can be linked to robust measurements of health, such as death rate or morbidity [2,3]. While the concept of morbidity refers to the proportion of people who suffer disease [19], a person can, however, suffer from various diseases, and therefore have multiple relations between different pathologies. These relations can, in turn, be structured or classified in a single patient [20]. One of the classification systems used to classify patients according to burden of disease is that of clinical risk groups (CRG) [21], based on the approved diagnostic codes according to the International Classification of Disease [22]. Since 2013, the Valencian Community has used a patient classification system which stratifies the population using a morbidity indicator according to the burden of disease and clinical risk, using the CRG grouper, giving 9 health states and 6 severity states [20].
The Valencian Health District of Clínico—La Malvarrosa, where the study was conducted, includes areas of Valencia city and another 14 rural municipalities of the surrounding area (l’Horta Nord). The sociodemography of this HD shows a progressive increase over recent years in complex chronic patients and the existence of vulnerable population groups, such as the mentally ill, the homeless, people with difficulty in paying for medication, completing the treatment, or feeding themselves adequately, dependants, or people with no socioeconomic resources [1]. Identifying areas and people in a vulnerable situation or requiring more intensive care helps to plan, reorganise resources and prioritise interventions fairly in order to lessen social inequalities in health.
The goal of this work was to develop an Integrated Population Index of Deprivation (IPID) to observe the influence on morbidity and the use of healthcare resources in a health district, using the variables available digitally in administrative and clinical databases so that they can be automatically updated on a regular basis.
2. Materials and Methods
2.1. Scope of Study and Information Sources
This was an analytical, observational, cross-sectional population-based study. We used the database from the Valencia Clínico—La Malvarrosa, HD of the Valencian Regional Health System corresponding to the year 2015. The database is available for research and managerial purposes with approval from the Regional Health Authority. The study included all patients registered with the Population Information System and who were assigned a primary healthcare (PH) doctor in this district, which gave a total of 232,515 subjects. Four sources of information were used, including SIP (Population Information System), APSIG (geographically integrated segmented population analysis), and CRG (clinical risk groups). The geographic information on the census areas was obtained from the National Institute of Statistics.
The main dimensions of this study were obtained from the APSIG database, used by the Valencian Ministry of Health (Conselleria de Sanitat Universal i Salut Pública) since 2009 [23] and formed by dimensions with sociodemographic information taken from the Population Information System (SIP).
The software used to perform these analyses were Matlab® 2017b (MathWorks, Portolla Valle, CA, USA) and R® 3.6.3 (R Core Team, Vienna, Austria).
2.2. Method of Reducing Dimensionality
Multivariate techniques for reducing the dimensionality were used in this study in order to obtain an index, the IPID, allowing the measurement of the deprivation associated with the census sections belonging to the HD under consideration.
The first step consisted of selecting those variables that could provide information on deprivation through a bibliographical review [2,3,7]. A key variable in this step was the identification of each patient with a census section. This allowed aggregating the information for each variable by census level in an indicator. This indicator was calculated using the proportion of people who met the condition in question for each census section (e.g., the proportion of people without Spanish nationality per census section). The calculation of each indicator is detailed in Table 1.
All the variables included in the study were standardised by age and sex using the direct method. The considered age groups were: <15, 15 to 44, 45 to 64, 65 to 74 and >74 years old, as this division was considered suitable to reflect the differences in burden of disease, healthcare resource consumption and associated level of vulnerability. Furthermore, the relation between the chosen variables was evaluated, with the goal of avoiding redundancies that might make interpretation of the results difficult.
The principal hypothesis postulated is that those indicators that show greater variability between census sections are those associated with greater probability of suffering from deprivation. In order to associate a deprivation level with each census section, a method combining the multidimensionality of the indicators in a single index is needed. Given these two requirements of reducing dimensionality and of considering the variability as an indicative element of deprivation, it was decided to use principal component analysis (PCA).
This is a method that allows an originally correlated set of variables to be projected on a space whose axes are orthogonal to each other, and represents the maximum possible variance [24]. The PCA obtains as many principal components as dimensions presented by the data. However, as the idea of this study is to reduce the dimensionality to one single index, we are only interested in keeping the first principal component, which represents the higher amount of variability of the data. Formally, let be a -dimensional data set of observations, with a sample mean equal to zero. The direction associated with the first component of the matrix W is the result of projecting the data onto a line. This can be expressed as , where represents the coefficient associated with observation . The optimal set of coefficients can be found by minimising the square error by:
Partially deriving from these, clearing up, and keeping in mind that , equality is reached: .
This method allowed the dimensionality of the initial indicators to be reduced to a single index, after the appropriate descriptive analysis of each indicator was performed. This final index was developed after two consecutive steps. Firstly, all the indicators were included and the factor loadings () associated with the first component were analysed. Those indicators that presented a sufficiently low weight were eliminated and the first component recalculated for this subset. This first component became the final IPID. The advantage of this method is that it provides a greater weight to those indicators that have greater variability between census sections.
Once the IPID was obtained, its range was divided into 7 intervals of equal length. Each of these was called a “septile of deprivation”. Those census sections classified with septile 1 refer to the lowest levels of deprivation, while 7 represents the most deprived. The septile was selected instead of another interval partition as it was the interval which allowed the best identification of those vulnerable regions. A higher number (e.g., decile) leads to intervals containing no census region, whereas lower numbers (e.g., quintiles) were not suitable for identifying vulnerable areas.
2.3. Relation of the Integrated Population Index of Deprivation with the Variables for Multimorbidity and Resource Use
The model was validated using the theory of multiple comparisons. The statistical relation between the IPID and the variables for multimorbidity and clinical resource use was studied.
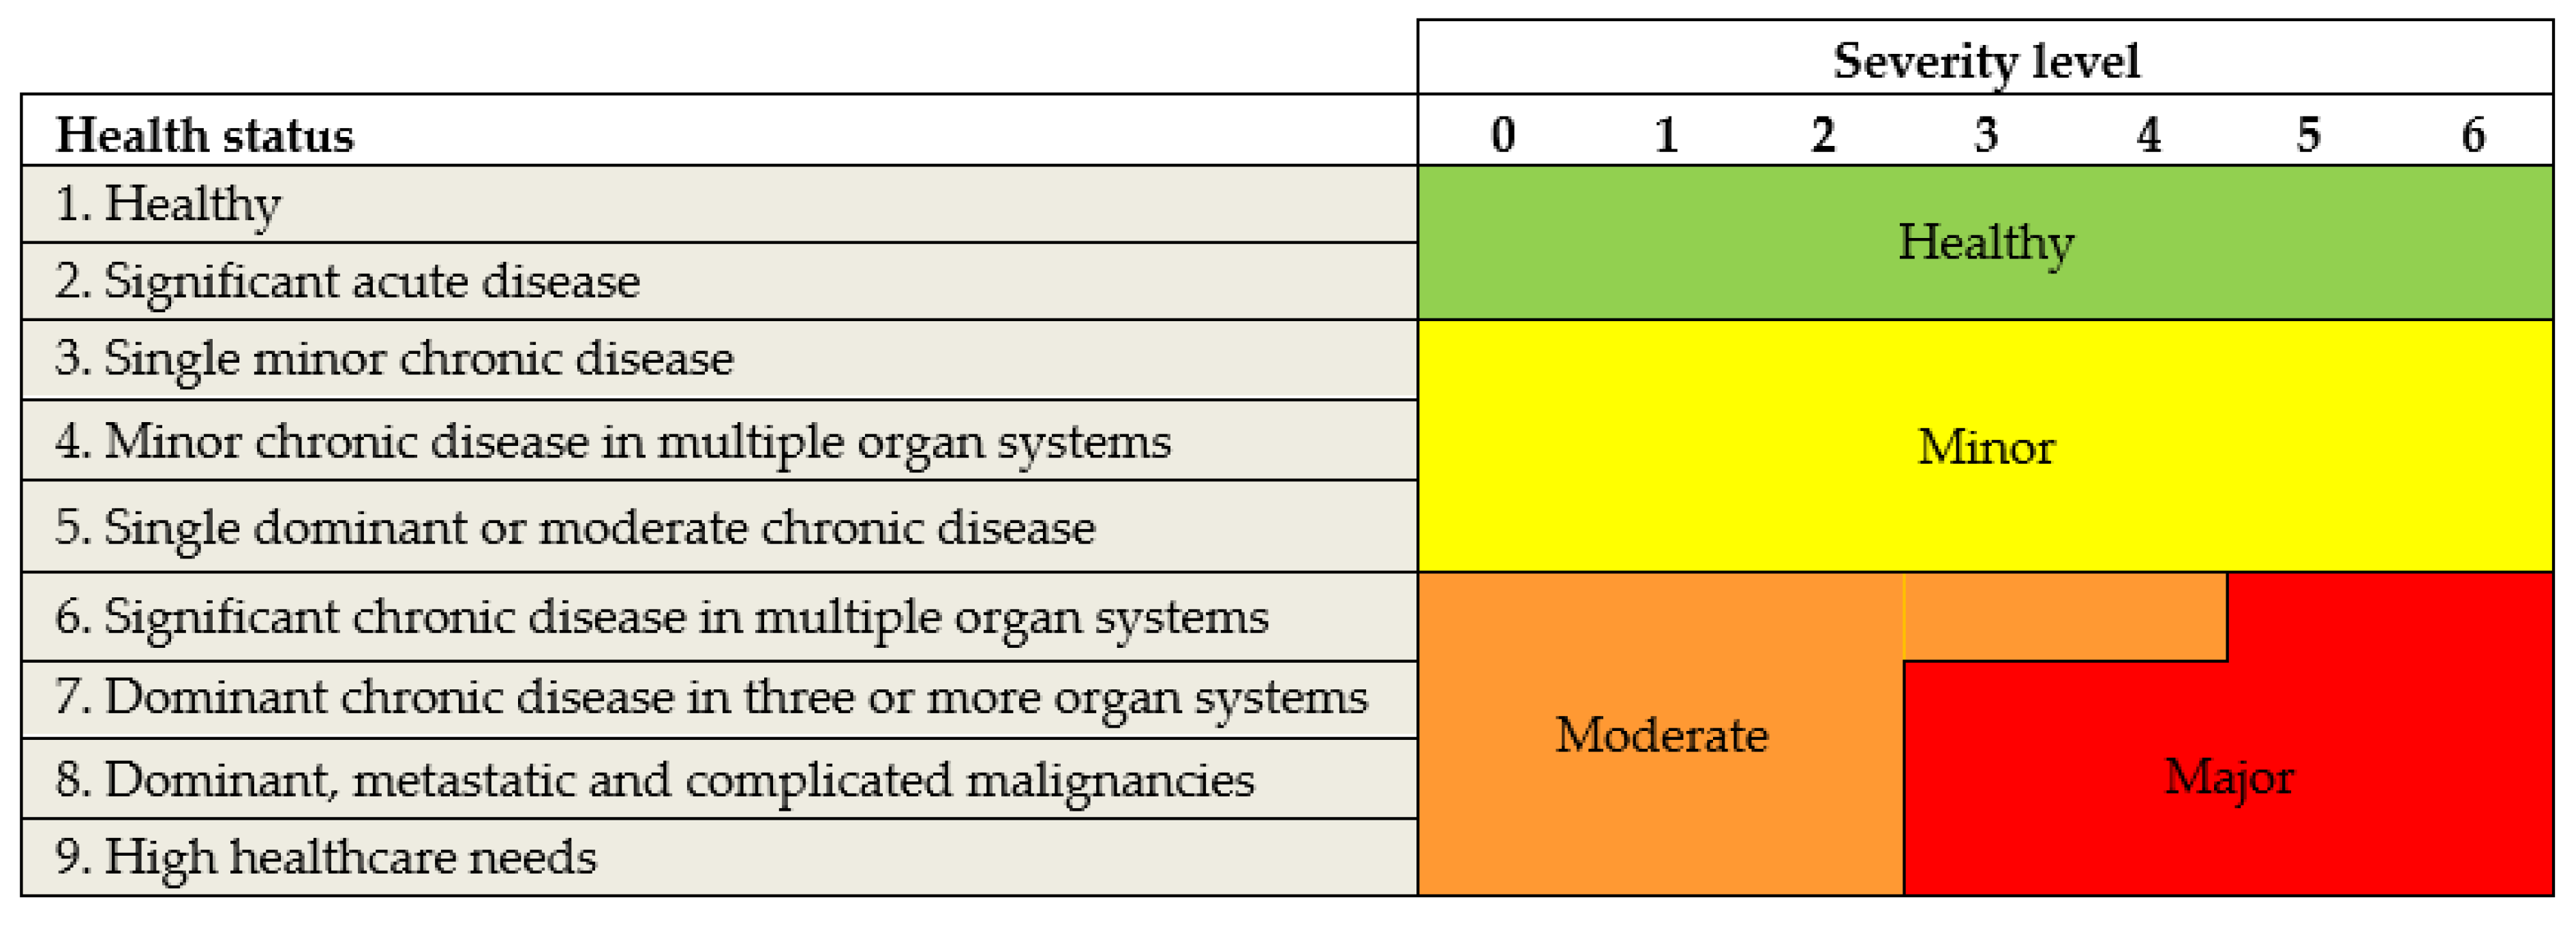
The clinical variables used that related to morbidity were developed by calculating the percentage of people with good health (healthy), minor health problems, moderate health problems and major health problems for each census section (Figure 1).
Those variables related to the use of clinical resources were calculated in a similar manner, averaging out the information for all the patients in a census section on the costs for laboratory, pharmacy, diagnostic tests and primary healthcare (PH) personnel, as well as the number of hospital emergencies, hospital admissions and duration of stay.
We examined whether there were differences in clinical resources across census areas according to septile. Firstly, ANOVA was applied to each variable, with the objective of knowing if there was at least one measurement that was statistically different to the others per septile. As the number of samples per variable was sufficiently high and considering the central limit theorem, normality in the mean could be assumed. This allowed use of the Tukey HDS test as a post-hoc analysis method, using a 95% family-wise confidence level.
Finally, we examined if there were differences in morbidity according to the septile, in order to find out if there were some relation between material deprivation and the health status of the inhabitants of the septiles. In this case, the variables that were compared were categorical. For this, we used Pearson’s chi-squared test. Furthermore, in order to avoid inflation of type I error, a Bonferroni correction was performed.
3. Results
From the revised deprivation indices, and bearing in mind the limitations of available information, seven variables were used, including two variables related to income, one to employment, one demographical and three to family composition. In order to correct the severe positive asymmetry of the indicator for income >100,000, a logarithmic transformation was applied.
The majority of the correlation values between the chosen socioeconomic indicators and those related to resource use were not statistically significant (see Table 2), except for the income variables, which only presented two non-significant correlation values. Significant correlation was found between various indicators and the morbidity index. Thus, it is worth highlighting the value of negative correlation between the indicators of good state of health (healthy) and low income, as opposed to that of high income (r = −0.79 y r = 0.73, respectively). It can be seen that those census sections associated with greater burden of morbidity showed a negative correlation coefficient with the high-income variable, while the tendency was the opposite for low income.
It is also interesting to see the relation between these two variables and the associated costs, as well as the number of consultations, with a tendency to an increase in healthcare resources being observed for those census sections with the greatest presence of low income. A similar tendency can be seen for the migrant and unemployment variables.
In Table 3, the weights associated with each variable for the first principal component can be seen. The variable with the least contribution when computing this component was “single-parent families”. For this reason, it was discarded in the second phase of calculating components. In this second phase, it can be seen that the greatest weight was positively associated with low income (0.633), implying a greater deprivation was more related to areas where the proportion of people with income lower than EUR 18,000 was greater. The same intensity of relation, but this time negative, appeared with the “high income” variable (−0.606). The total variance explained by this first component of the second phase was 38.8%. The IPID showed a mean of 0 and a standard deviation of 14.5. Due to the way the variables were aggregated, a higher value of IPID implies a greater deprivation and therefore a lower socioeconomic level. This is similarly reflected in the correlation values between the value of the first component of the PCA and each of the indicators, wherein greater correlation values are associated with those variables that contribute most to the compiling of the index.
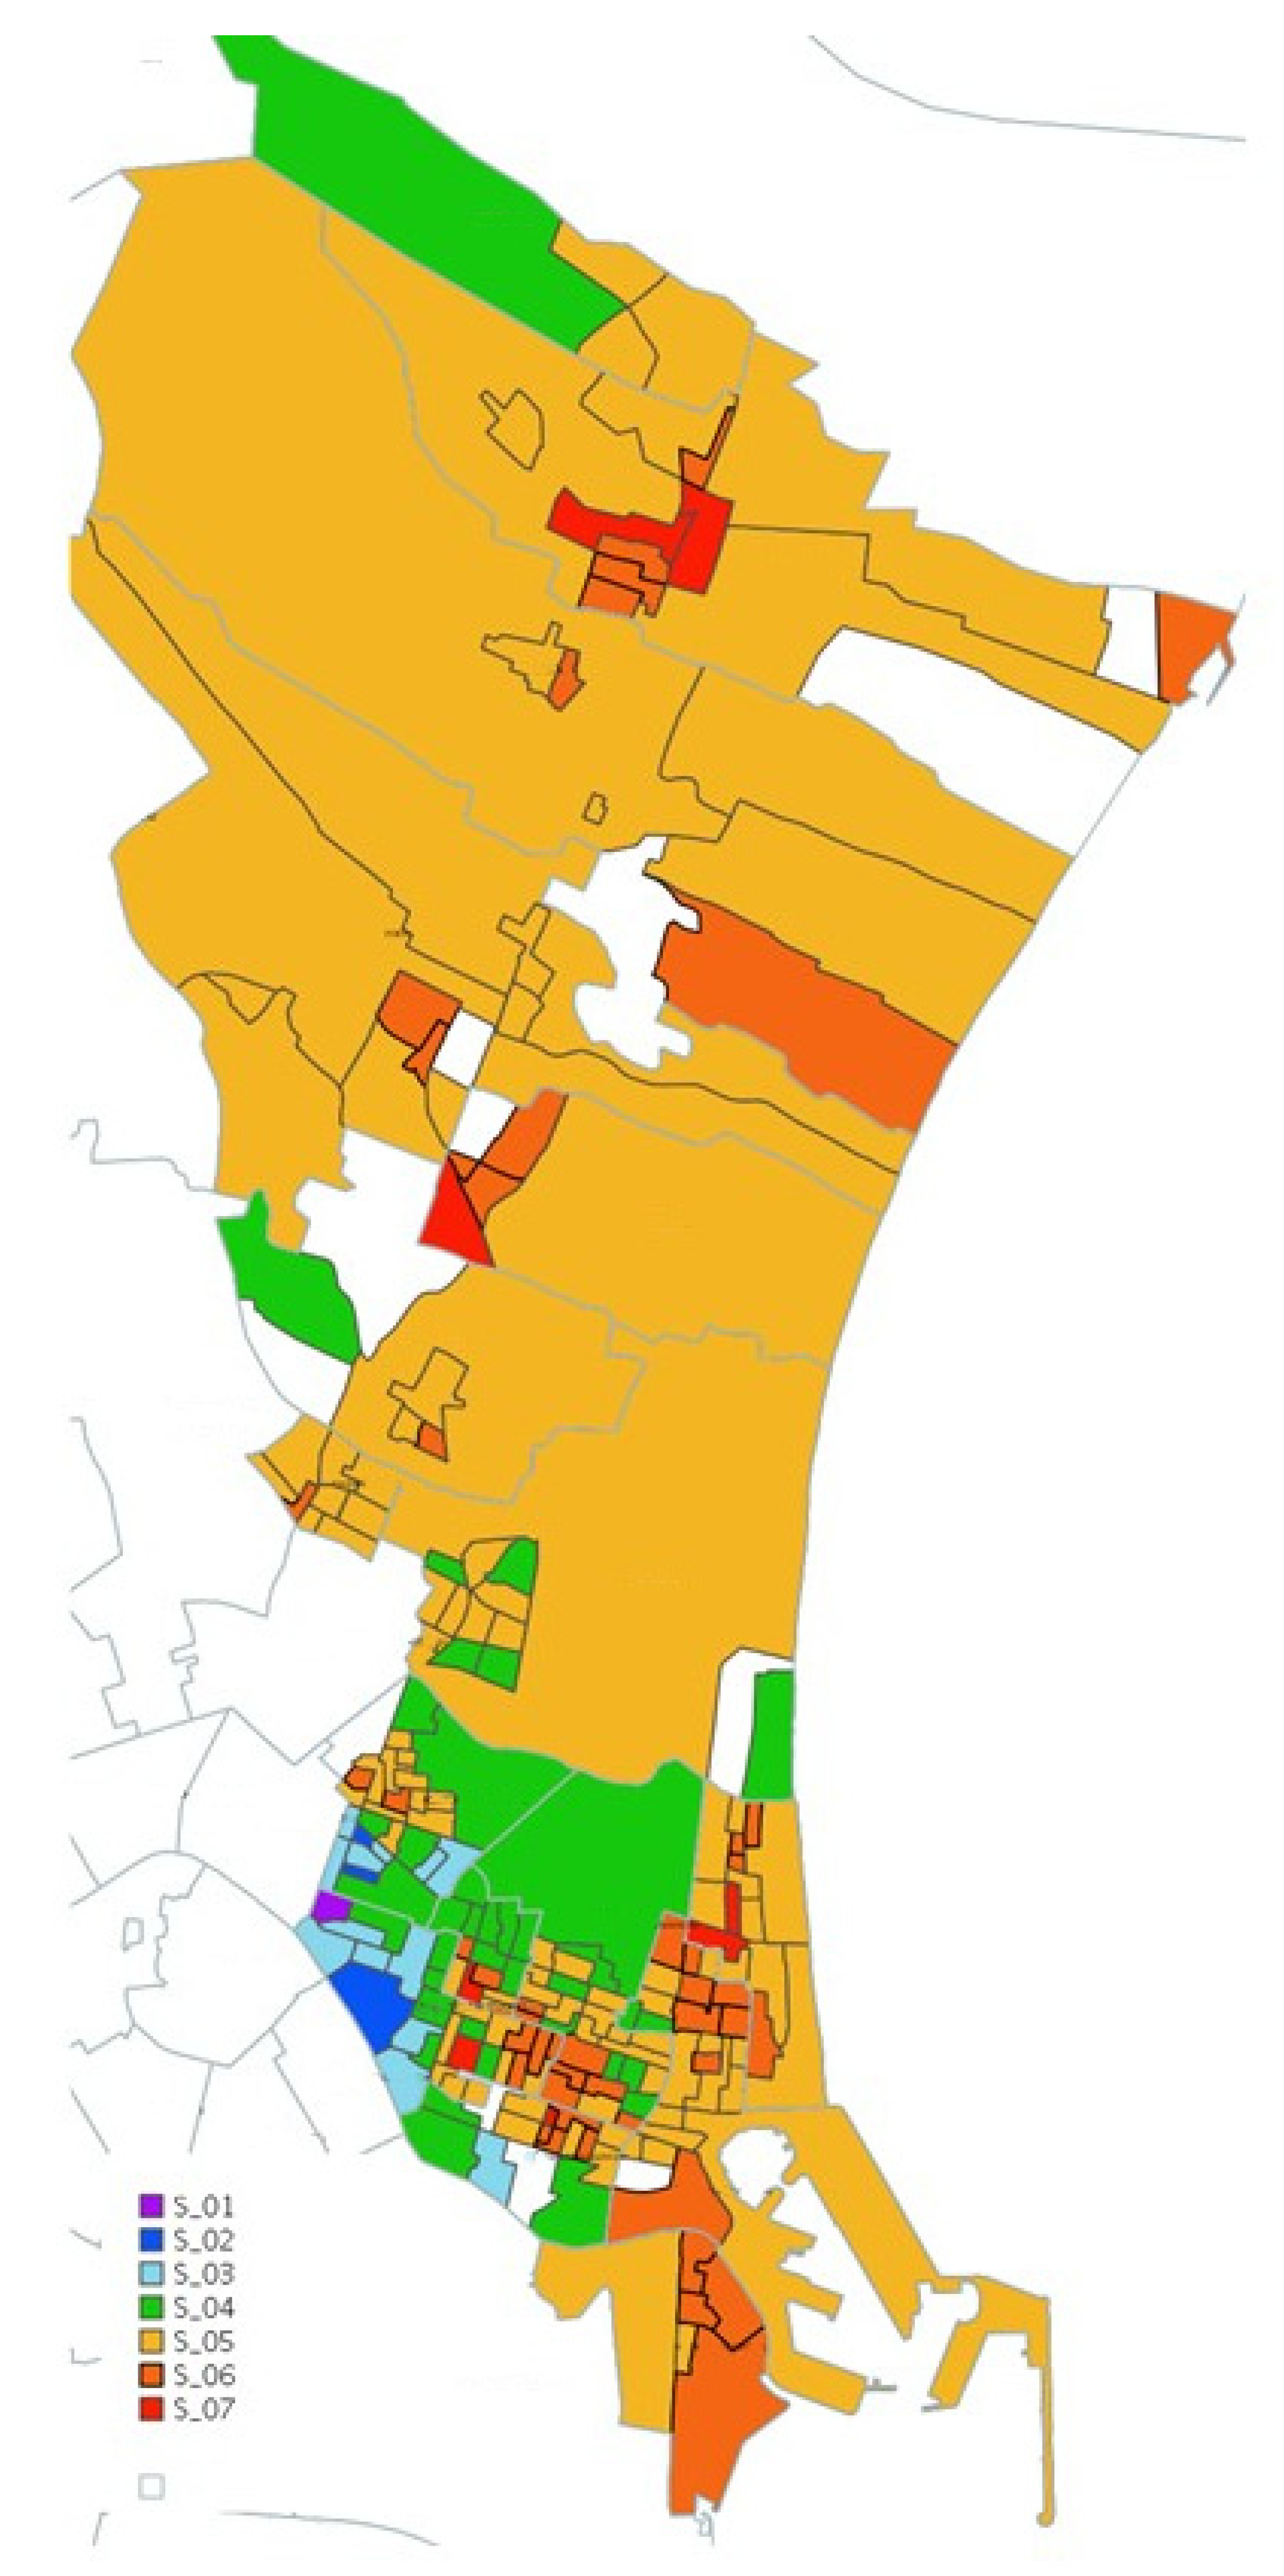
The septiles obtained from the IPID for each census section are represented graphically in the health district map in Figure 2. The map representation is in itself a useful tool created for use in the clinical and health management of the National Health System. It allows the identification of deprivation within the same area, and this information, made available to healthcare professionals and managers, can help to prioritize resources and plan more specific actions to reduce inequalities.
Of the census sections in the district, 88.2% were deprived (septiles 5, 6 and 7). Severe deprivation (septile 7) was found in 5.2% of the sections.
The location of the septiles on the map shows that a greater number of census sections with septile 5 were concentrated in the northern part of the health district (l’Horta Nord). These areas corresponded mostly to rural areas, which have a greater geographic extension, but lower population density. Therefore, although it seems that this septile is dominant in the graphic representation, its population impact is not so high.
Regarding analysis of the relation between the IPID and morbidity and healthcare resource use, it can be seen in Table 2 that the greatest correlation value was with the morbidity variable “healthy”. This implies that the places with a greater number of healthy people showed lower values of deprivation. Furthermore, an increase in the proportion of population with greater morbidity was associated with higher values of deprivation. These results are reflected in outpatient costs, where higher values of deprivation are associated with an increase in costs for all services, being especially high on calculating the total costs (r = 0.57). In the case of number of consultations, the highest correlation value was obtained for hospital emergencies, with a value near 0.3.
The IPID improves the correlation value with the morbidity and the clinical resource variables with respect to the majority of the variables that constitute it, with the difference for the indicators relating to costs being especially large (Table 2).
The Chi-square test value for morbidity by septile obtained a p-value of 2.2 × 10⁻¹⁶, which allowed us to reject the null hypothesis postulating that both variables were independent, as it was below the significance level 0.05. Table 4 shows the results of the p-value adjusted using the Bonferroni correction. In this case, it could be observed how, generally, the septiles associated with lower deprivation (1, 2, 3 and 4) showed a significantly greater number of people in the category ‘healthy’ than expected, while only septile 6 showed a statistically significant lower value than expected. It can also be seen that the expected number of patients with minor, moderate and major health problems was lower for septiles 1, 2, 3 and 4, while septiles 5 and 6 gave higher values than expected for these categories. This demonstrates, therefore, a correlation between the IPID and the burden of disease, as living in an area—in this health district—of greater deprivation involves a greater burden of disease. This shows that both variables were not independent, as well as the way in which they relate to each other. There were no statistically significant differences from the expected value for septile 7, which may be explained by the lower number of people associated with these sections.
Table 5 presents the differences found in resource use by septile, wherein all the values were lower than 0.05 for all the revised variables, implying that at least the mean of one of the septiles differed from another. Table 6 includes the value of the p-value adjusted by pairs, for each variable in the study. The septiles that showed a statistically significant difference for all the variables were: S_06-S_02, S_05-S_03, S_06-S_03, S_07-S_03, S_06-S_04, S_07-S_04 and S_06-S_05, where, in the majority of cases, the comparison was carried out between a low septile and one related to a greater level of deprivation. The number of doctors, as well as the number of inter-consultations and personnel costs were the variables that allowed a greater differentiation between septiles. In these cases, the only pairs that did not show statistically significant differences were those which compared S_01 with S_02, S_03 or S_04; S_02 and S_03; and S_07 with S_05 and S_06. That is, they were variables that presented the same mean for those septiles that belonged to a similar degree of deprivation, and when the degree of deprivation was significantly different, they were highly sensitive when establishing differences in resource use.
4. Discussion
The main contribution of this study constitutes the development of an index, called the Integrated Population Index of Deprivation, consisting of a database containing segmented population information regarding clinical and socioeconomic real-world data that are integrated and geographical. The data available in the databases are real, individual data, unlike other deprivation indices whose information is obtained from health surveys, and therefore use subjective data, or use data from the National Institute of Statistics [2,3]. This is an important advantage, since aggregated data can induce some errors in studies, especially when crossing different data coming from multiple databases [12], and can make detecting how small changes will impact the results of a specific area more difficult [7]. Furthermore, all the data used in this study to compute the index were obtained from the APSIG database. As this is a centralized database managed by the HD, the information is more accessible and is updated much more frequently than that of the census. Lastly, it is the only Spanish index (within our knowledge) that includes morbidity data in the analysis, including internationally standardized CRG groups.
The IPID in our study explains 38.8% of variance, which is a lower result than those of the articles taken as reference, where values were obtained of 75% [2] and 65% [7]. Adding other variables, such as education level or characteristics of the dwelling, could increase the value of the explained variance.
The methodology employed has allowed verification of how the PCA satisfactorily resolves the problem of the multidimensionality of deprivation, as shown in other studies [2]. Not only was an appropriate classification of the different census sections according to deprivation level achieved, but also results were obtained that agreed with the hypothesis initially proposed.
The use of this index allowed the value of the correlation with healthcare resource use and morbidity to be increased for all the variables of the study, obtaining significantly different values from zero for a significance level of 0.05, as occurred in the studies carried out by other authors [2,7,25].
The analysis of healthcare resource use by septile showed that the differences were especially concentrated when comparing the mean resource use for areas of greater deprivation with less vulnerable areas. This, combined with the information obtained from the correlation analysis, allows the conclusion that, generally, greater deprivation is associated with an increase in costs and in the number of personnel involved in the area. These results coincide with the studies carried out by other authors [26].
Regarding the variable of population members older than 65 who live alone, it can be noted that there was small but negative correlation with all the indicators, except that of major health problems. This leads us to think that these people are making less use of the healthcare system, being people in a situation of vulnerability, as described by the authors of “The inverse care law” [27].
In the results obtained, the census sections with high deprivation septiles 6 or 7 in the l’Horta Nord municipalities stand out. This could be explained by these areas having lower levels of income and, given that this indicator is the most weighted in the IPID, could have resulted in these areas being the most marked. Other authors have indicated the need to develop specific deprivation indices for rural areas [3,28]. It is therefore necessary to carry out a study in greater depth to analyse which factors determine there being a larger proportion of the population with low income or unemployment in the areas of l’Horta Nord.
The main limitation of this study is the variable for income, which gives the highest score for the index but nevertheless presents certain deficiencies. Firstly, having large intervals, it encompasses a very wide population group between the income ranges of EUR 18,000 and EUR 100,000, grouping together very different population profiles. This is due to the original source of the data, obtained from the pharmaceutical co-payment, which has already been shown in previous studies in Spain [7]. Furthermore, there were a group of people for whom income level was not available for different reasons (members of mutuals, pensioners, etc.). Thirdly, there is a possibility that other economic factors, unregistered in the information sources used, affected the result, such as the number of children in the family/household. One way of mitigating these limitations, at least partially, in addition to adding narrower income ranges, would be to use an indicator of equivalent income, according to which all income entering a family unit is calculated and divided between all its members. However, with the data currently available it is not possible to group households for these calculations.
Another difficulty found in the research regards the availability of all the variables for all the population assigned to the study. In this case, it was necessary to perform the analysis with the population assigned to the health district in 2015 in order to be able to count on the maximum information for each individual from the databases of the Regional Health Ministry (APSIG, SIP, SIA and CRG), and it would be desirable to repeat the study with more current data, when available.
Our index obtained the same conclusions as other indices [2,3,11,29], where more deprived areas were related to higher morbidity, and therefore higher consumption of resources [3]. The results obtained with the IPID have to be interpreted cautiously, given the characteristics mentioned above. Nevertheless, they are highly relevant to clinical practice and healthcare management in helping to design actions or programmes and prioritise resources to one area or another.
In future lines of research, it will be necessary to validate the data for other HDs and other years, and analyse the importance of other variables, such as level of education, characteristics of the dwelling, and other social and clinical determinants, such as the prevalence of specific diseases (mental illness, cancer, pregnancy in minors, chronic diseases, addictions, sexually transmitted diseases). Other authors have measured deprivation considering material, social and health indicators [30]. These authors analysed multimorbidity and deprivation and found age to be a determinant clearly associated with deprivation.
The IPID is a starting point for further research into identifying population profiles and aggregated census areas with sociosanitary vulnerability. Measuring sociosanitary vulnerability is complex due to the multidimensionality of its determinant factors. The development of an index that takes into account material deprivation, social deprivation, the burden of disease and resource use will give us a more realistic approximation of this sociosanitary vulnerability.
5. Conclusions
This study has shown that living in an area of the health district Valencia Clínico—La Malvarrosa, with a higher index of deprivation is associated with greater consumption of healthcare resources and a greater burden of disease. In the field of healthcare management, it is important to introduce socioeconomic indicators and measure their impact on healthcare outcomes, such as morbidity, mortality and resource use. Therefore, it is valuable to identify sociosanitary vulnerable areas and those people in a sociosanitary vulnerable position, as this will contribute to identifying health inequalities, allowing them to be reduced through the intervention of clinical practice and healthcare management. The development of this IPID, which identifies census sections with deprivation, allows these health inequalities to be determined when correlated with multimorbidity and resource-use indicators. This index represents the concept of multidimensional vulnerability by aggregating multiple variables, giving the greatest weight to income-related variables. However, to further improve our knowledge of health inequalities it is necessary to introduce other variables identifying sociosanitary vulnerability which were not available in the database of study.
Author Contributions
Conceptualization, M.P.B.Y. and R.U.-T.; methodology, S.S.-S., J.D.-C. and S.G.-d.-J.; software, S.S.-S., J.D.-C. and S.G.-d.-J.; validation, M.P.B.Y. and R.U.-T.; formal analysis, S.S.-S. and J.D.-C.; investigation, M.P.B.Y. and S.S.-S.; resources, M.P.B.Y. and S.S.-S.; data curation, S.S.-S. and J.D.-C.; writing—original draft preparation, M.P.B.Y., S.S.-S. and J.D.-C.; writing—review and editing, S.G.-d.-J. and R.U.-T.; visualization, M.P.B.Y., S.S.-S., J.D.-C., S.G.-d.-J. and R.U.-T.; supervision, M.P.B.Y. and R.U.-T.; project administration, M.P.B.Y. and R.U.-T. All authors have read and agreed to the published version of the manuscript.
Funding
This research received no external funding.
Institutional Review Board Statement
The study was conducted according to the guidelines of the Declaration of Helsinki and approved by the Ethics Committee of HOSPITAL CLINICO UNIVERSITARIO DE VALENCIA (protocol code 2018/125 and date of approval 28 June 2018).
Data Availability Statement
Not applicable.
Acknowledgments
The authors would like to thank the INCLIVA FUNDATION, Manager Health District Valencia Clínico—La Malvarrosa, Insurance Services Conselleria Sanitat Universal i Salut Pública. We would like to thank John Wright for help with English editing.
Conflicts of Interest
The authors declare no conflict of interest.
References
- Botija, P.; Botija, M.; Navarro, J. Implementación de estrategias y herramientas de coordinación sociosanitaria en un departamento de salud [Implementation of strategies and tools of sociosanitary coordination in a health department]. Gac. Sanit. 2018, 32, 386–389. [Google Scholar] [CrossRef]
- Domínguez-Berjón, M.F.; Borrell, C.; Cano-Serral, G.; Esnaola, S.; Nolasco, A.; Pasarín, M.I.; Ramis, R.; Saurina, C.; Escolar-Pujolar, A. Construcción de un índice de privación a partir de datos censales en grandes ciudades españolas (Proyecto MEDEA). Gac. Sanit. 2008, 22, 179–187. [Google Scholar] [CrossRef] [Green Version]
- Duque, I.; Domínguez-Berjón, M.F.; Cebrecos, A.; Prieto-Salceda, M.D.; Esnaola, S.; Calvo Sánchez, M.; Marí-Dell’Olmo, M. Índice de privación en España por sección censal en 2011 [Deprivation index by enumeration district in Spain, 2011]. Gac. Sanit. 2021, 35, 113–122. [Google Scholar] [CrossRef] [PubMed]
- Townsend, P.; Phillimore, P.; Beattie, A. Health and Deprivation: Inequality and the North; Routledge: London, UK, 1988. [Google Scholar]
- Morris, R.; Carstairs, V. Which deprivation? A comparison of selected deprivation indexes. J. Public Health 1991, 13, 318–326. [Google Scholar] [CrossRef]
- Mclennan, D.; Noble, S.; Noble, M.; Plunkett, E.; Wright, G.; Gutacker, N. The English Indices of Deprivation 2019; Technical Report; Ministry of Housing, Communities and Local Government: London, UK, 2019.
- Colls, C.; Mias, M.; García-Altés, A. A deprivation index to reform the financing model of primary care in Catalonia (Spain). Gac. Sanit. 2020, 34, 44–50. [Google Scholar] [CrossRef] [PubMed]
- Diez Roux, A.V. Investigating neighborhood and area effects on health. Am. J. Public Health 2001, 91, 1783–1789. [Google Scholar] [CrossRef] [PubMed]
- Espelt, A.; Continente, X.; Domingo-Salvany, A.; Domínguez-Berjón, M.F.; Fernández-Villa, T.; Monge, S.; Ruiz-Cantero, M.T.; Perez, G.; Borrell, C. La vigilancia de los determinantes sociales de la salud. Gac. Sanit. 2016, 30, 38–44. [Google Scholar] [CrossRef] [PubMed] [Green Version]
- Commision on Social Determinants of Health. A Conceptual Framework for Action on the Social Determinants of Health; Commision on Social Determinants of Health: Geneva, Switzerland, 2010. [Google Scholar]
- Ocaña-Riola, R.; Saez, M.; Lertxundi Manterola, A.; Saurina Canals, C. Construcción de un índice de privación material para los municipios de la Región Sanitaria de Girona. Estud. Econ. Apl. 2005, 23, 243. [Google Scholar]
- Carstairs, V.; Morris, R. Deprivation and health in Scotland. Health Bull. 1991, 48, 162–175. [Google Scholar]
- de la Fuente Crespo, L. Análisis Componentes Principales; Universidad Autónoma de Madrid. Fac. Ciencias Económicas y Empresariales: Madrid, Spain, 2011. [Google Scholar]
- Jefatura del Estado [Head of State]. Ley 14/1986, de 25 de abril, General de Sanidad. Boletín Oficial del Estado, 1986; Volume 1855, pp. 1–24. Available online: https://www.boe.es/buscar/doc.php?id=BOE-A-1986-10499 (accessed on 12 April 2021).
- Generalitat Valenciana. Ley 10/2014, de Salud de la Comunitat Valenciana. Boletín Oficial del Estado, 2014. Available online: https://www.boe.es/buscar/pdf/2015/BOE-A-2015-1239-consolidado.pdf (accessed on 12 April 2021).
- Hernández-Aguado, I.; Santaolaya Cesteros, M.; Campos Esteban, P. Las desigualdades sociales en salud y la atención primaria. Informe SESPAS 2012. Gac. Sanit. 2012, 26, 6–13. [Google Scholar] [CrossRef] [PubMed] [Green Version]
- Conselleria de Sanitat Universal i Salut Pública. Generalitat Valenciana IV Plan de Salud de la Comunitat Valenciana (2016–2020). Salud en todas las edades. In Salud en Todas las Políticas; Conselleria de Sanitat Universal i Salut Pública: Valencia, Spain, 2016; ISBN 9788448260842. [Google Scholar]
- Ministerio de Sanidad Equidad en salud y Covid-19. Análisis y Propuestas Para Abordar la Vulnerabilidad Epidemiológica Vinculada a las Desigualdades Sociales; Ministerio de Sanidad: Madrid, Spain, 2020.
- Real Academia de la Lengua. RAE 23 Edición. Available online: https://dle.rae.es/morbilidad (accessed on 12 April 2021).
- Usó-Talamantes, R. Análisis y Desarrollo de un Modelo Predictivo del Gasto Farmacéutico Ambulatorio Ajustado a Morbilidad y Riesgo Clínico. Ph.D Thesis, Universitat Poliècnica de València, Valencia, Spain, 2015. [Google Scholar]
- Inoriza, J.M.; Coderch, J.; Carreras, M.; Vall-Llosera, L.; García-Goñ, M.; Lisbona, J.M.; Ibern, P. La medida de la morbilidad atendida en una organización sanitaria integrada. Gac. Sanit. 2009, 23, 29–37. [Google Scholar] [CrossRef] [Green Version]
- Ministerio de Sanidad. Servicios Sociales e Igualdad. Dirección General de Salud Pública Calidad e Innovación; Sanitaria Subdirección General de Información Clasificación Internacional de Enfermedades. eCIE9MC.Edición Electrónica de la CIE-9-MC. 9a Edición 9.a Revisión, Modificación Clínica. Available online: https://eciemaps.mscbs.gob.es/ecieMaps/browser/index_9_mc.html (accessed on 12 April 2021).
- Dirección General de Asistencia Sanitaria Informe: Códigos APSIG. Análisis Poblacional Segmentado Integrado y Geográfico; Guía Técnica; Conselleria de Sanitat Universal i Salut Pública: Valencia, Spain, 2019. [Google Scholar]
- García-Gómez, J.M.; Tortajada, S.; Sáez, C. Sistemas de Ayuda a la Decisión Médica; Universitat Politècnica de València: Valencia, Spain, 2019; ISBN 978-84-9048-780-8. [Google Scholar]
- Chamberlain, A.M.; Sauver, J.L.S.; Finney Rutten, L.J.; Fan, C.; Jacobson, D.J.; Wilson, P.M.; Boyd, C.M.; Rocca, W.A. Associations of Neighborhood Socioeconomic Disadvantage With Chronic Conditions by Age, Sex, Race, and Ethnicity in a Population-Based Cohort. Mayo Clin. Proc. 2022, 97, 57–67. [Google Scholar] [CrossRef] [PubMed]
- Kontopantelis, E.; Mamas, M.A.; van Marwijk, H.; Ryan, A.M.; Bower, P.; Guthrie, B.; Doran, T. Chronic morbidity, deprivation and primary medical care spending in England in 2015-16: A cross-sectional spatial analysis. BMC Med. 2018, 16, 19. [Google Scholar] [CrossRef] [PubMed]
- Tudor Hart, J. The inverse care law. Lancet 1971, 297, 405–412. [Google Scholar] [CrossRef] [Green Version]
- Aguilar Palacio, I. Desigualdades en la Distribución de Salud y Enfermedad: Influencia de Factores Socioeconómicos. Ph.D. Thesis, Universidad de Zaragoza, Zaragoza, Spain, 2015. [Google Scholar]
- Chamberlain, A.M.; Finney Rutten, L.J.; Wilson, P.M.; Fan, C.; Boyd, C.M.; Jacobson, D.J.; Rocca, W.A.; St Sauver, J.L. Neighborhood socioeconomic disadvantage is associated with multimorbidity in a geographically-defined community. BMC Public Health 2020, 20, 1412. [Google Scholar] [CrossRef]
- Leiser, S.; Déruaz-Luyet, A.; N’Goran, A.A.; Pasquier, J.; Streit, S.; Neuner-Jehle, S.; Zeller, A.; Haller, D.M.; Herzig, L.; Bodenmann, P. Determinants associated with deprivation in multimorbid patients in primary care—A cross-sectional study in Switzerland. PLoS ONE 2017, 12, e0181534. [Google Scholar] [CrossRef] [PubMed] [Green Version]
Figure 1.
Indicator of morbidity: classification in four groups resulting from the combination of CRG and severity level. Source: Adapted from [20].
Figure 1.
Indicator of morbidity: classification in four groups resulting from the combination of CRG and severity level. Source: Adapted from [20].

Figure 2.
Deprivation map of the health district.


Table 1.
Definition of the 7 indicators chosen as determinants of deprivation for each census section.
Table 1.
Definition of the 7 indicators chosen as determinants of deprivation for each census section.
| Name of Indicator | Numerator | Denominator |
|---|---|---|
| Foreign population without Spanish nationality | No. of foreigners without Spanish nationality | Total population |
| Population with income < EUR 18,000 | No. of people with income < EUR 18,000 | Total population |
| Population with income > EUR 100,000 | No. of people with income > EUR 100,000 | Total population |
| Unemployed population | No. of people unemployed | Active population |
| Population with single parent families | No. of single parent families | Total population |
| Population >65 who live alone | No. of people over 65 who live alone | Total population |
| Population with >4 people in the family unit | No. of people who live in large families of more than 4 people | Total population |
Table 2.
Pearson correlation between the morbidity index and healthcare resources, and the socioeconomic indicators.
Table 2.
Pearson correlation between the morbidity index and healthcare resources, and the socioeconomic indicators.
| Indicator Name | Foreigners without Spanish Nationality | Income < EUR 18,000 | Income > EUR 100,000 | Unemployed Population | Single- Parent Families | >65 Years Old Who Live Alone | >4 People in the Family Unit | IPID |
|---|---|---|---|---|---|---|---|---|
| Morbidity indicator (out of one) | ||||||||
| Healthy | −0.079 | −0.787 a | 0.733 a | −0.269 a | 0.053 | −0.034 | 0.290 a | −0.768 a |
| Minor | −0.159 b | 0.370 a | −0.443 a | 0.208 a | −0.036 | −0.036 | −0.276 a | 0.386 a |
| Moderate | 0.172 a | 0.575 a | −0.413 a | 0.154 a | 0.032 | −0.048 | −0.078 | 0.495 a |
| Major | 0.164 b | 0.316 a | −0.199 a | 0.053 | 0.005 | 0.215 a | −0.019 | 0.284 a |
| Costs (euros per patient) | ||||||||
| Laboratory | 0.116 b | 0.390 a | −0.341 a | 0.259 a | −0.165 b | 0.046 | −0.146 b | 0.338 a |
| Pharmacy | 0.01 | 0.254 a | −0.211 a | 0.126 | 0.03 | −0.06 | −0.099 | 0.229 a |
| Diagnostic tests | 0.148 b | 0.165 a | −0.178 a | 0.097 | 0.002 | 0.013 | 0 | 0.192 a |
| PH personnel | −0.019 | 0.006 | −0.07 | −0.001 | 0.072 | −0.033 | −0.056 | 0.276 a |
| Total | 0.054 | 0.231 a | −0.227 a | 0.044 | 0.021 | −0.009 | −0.061 | 0.574 a |
| Resource use (average per patient) | ||||||||
| Emergencies | 0.156 b | 0.285 a | −0.254 a | 0.036 | 0.033 | 0.008 | −0.063 | 0.281 a |
| Inter- consultations | 0.039 | 0.241 a | −0.248 a | 0.033 | 0.004 | −0.066 | −0.163 b | 0.241 a |
| Nursing | 0.053 | 0.263 a | −0.234 a | 0.117 b | 0.037 | −0.025 | −0.091 | 0.253 a |
| Doctors | 0.023 | 0.186 a | −0.204 a | 0.026 | 0.067 | −0.027 | −0.105 b | 0.188 a |
| Admissions | −0.01 | −0.05 | −0.025 | −0.041 | 0.08 | −0.057 | −0.056 | −0.023 |
| Days of stay | 0.163 b | 0.288 a | −0.222 a | 0.028 | 0.048 | 0.072 | −0.023 | 0.271 a |
Where: p < 0.01 a, 0.01 < p < 0.05 b.
Table 3.
Results and parameters for compiling the deprivation index by census sections for all Spain, for the first component (1st P.C.). Where: p < 0.01 a.
Table 3.
Results and parameters for compiling the deprivation index by census sections for all Spain, for the first component (1st P.C.). Where: p < 0.01 a.
| First-Phase PCA | Second-Phase PCA | |||
|---|---|---|---|---|
| Weights (1st P.C.) | Correlation with IPID | Weights (1st P.C.) | Correlation with IPID | |
| Foreigner population without Spanish nationality | 0.295 | 0.426 a | 0.293 | 0.424 a |
| Population with income < EUR 18,000 | 0.633 | 0.915 a | 0.633 | 0.914 a |
| Population with income > EUR 100,000 | −0.608 | −0.879 a | −0.606 | −0.876 a |
| Unemployed population | 0.209 | 0.282 a | 0.212 | 0.284 a |
| Population of single-parent families | −0.023 | −0.033 | - | - |
| Population >65 y.o. living alone | 0.195 | −0.356 a | 0.197 | −0.360 a |
| Population with >4 people in the family unit | −0.246 | 0.303 a | −0.249 | 0.307 a |
| Explained variance (%) (1st P.C.) | 29.842 | - | 38.801 | - |
Table 4.
Results of the residuals of the Chi-square test, where: p < 0.05 a.
| Dimension | Healthy | Minor | Moderate | Major |
|---|---|---|---|---|
| S_01 | 6.211 a | −5.365 a | −1.851 | 0.269 |
| S_02 | 10.450 a | −5.983 a | −6.638 a | −1.768 |
| S_03 | 18.639 a | −10.943 a | −10.384 a | −5.941 a |
| S_04 | 20.080 a | −9.343 a | −14.560 a | −6.781 a |
| S_05 | −3.106 | 6.092 a | −2.795 | −3.224 a |
| S_06 | −20.306 a | 7.056 a | 17.316 a | 9.065 a |
| S_07 | −0.207 | −1.478 | 1.378 | 2.781 |
Table 5.
Results for the p-value of the ANOVA test for all variables in the study, where: p < 0.05 a.
Table 5.
Results for the p-value of the ANOVA test for all variables in the study, where: p < 0.05 a.
| Variables | Value |
|---|---|
| Resource use | |
| Emergencies | 1.7 × 10−182 a |
| Doctors | 0 a |
| Nursing | 6.2 × 10−144 a |
| Inter-consultations | 3 × 10−277 a |
| Admissions | 1.84 × 10−53 a |
| Days of stay | 2.26 × 10⁻¹⁸ a |
| Costs | |
| PH Personnel | 0 a |
| Laboratory | 2.15 × 10−82 a |
| Pharmacy | 1.7 × 10−131 a |
| Diagnostic tests | 1.04 × 10⁻¹³ a |
| Totals | 3.6 × 10−189 a |
Table 6.
Results of the p-value adjusted using the Tukey test for multiple comparisons of means, where: p < 0.05 a.
Table 6.
Results of the p-value adjusted using the Tukey test for multiple comparisons of means, where: p < 0.05 a.
| Resource Use | Costs | ||||||||||
|---|---|---|---|---|---|---|---|---|---|---|---|
| Name | Emergencies | Doctors’ Consultations | Nursing Consultations | Inter- consultations | Admissions | Days of Stay | Personnel | Laboratory | Pharmacy | Diagnostic Tests | Total |
| S_02-S_01 | 5.91 × 10−01 | 2.71 × 10−01 | 1.00 × 10+00 | 9.98 × 10−01 | 9.83 × 10−01 | 1.00 × 10+00 | 9.82 × 10−02 | 9.78 × 10−01 | 9.97 × 10−01 | 1.00 × 10+00 | 9.04 × 10−01 |
| S_03-S_01 | 5.45 × 10−01 | 4.00 × 10−02 a | 1.00 × 10+00 | 8.79 × 10−01 | 1.00 × 10+00 | 1.00 × 10+00 | 7.72 × 10−07 a | 9.62 × 10−01 | 9.34 × 10−01 | 9.83 × 10−01 | 9.92 × 10−01 |
| S_04-S_01 | 1.09 × 10−01 | 2.78 × 10−05 a | 9.49 × 10−01 | 2.79 × 10−02 a | 9.98 × 10−01 | 1.00 × 10+00 | 1.00 × 10+00 | 6.84 × 10−02 | 9.99 × 10−01 | 8.86 × 10−01 | 4.35 × 10−01 |
| S_05-S_01 | 4.91 × 10−04 a | 1.07 × 10⁻¹³ a | 9.24 × 10−02 | 5.15 × 10−08 a | 6.84 × 10−01 | 9.99 × 10−01 | 3.01 × 10−06 a | 3.04 × 10−03 a | 7.49 × 10−01 | 6.73 × 10−01 | 1.05 × 10−03 a |
| S_06-S_01 | 1.46 × 10−07 a | 4.74 × 10⁻¹⁴ a | 2.92 × 10−03 a | 2.19 × 10⁻¹⁰ a | 2.22 × 10−01 | 9.45 × 10−01 | 6.76 × 10−05 a | 1.45 × 10−04 a | 1.89 × 10−01 | 3.93 × 10−01 | 3.59 × 10−06 a |
| S_07-S_01 | 2.79 × 10−08 a | 6.89 × 10⁻¹⁴ a | 1.28 × 10−03 a | 1.35 × 10−07 a | 3.00 × 10−01 | 9.14 × 10−01 | 2.80 × 10⁻¹⁴ a | 5.29 × 10−04 a | 2.64 × 10−01 | 3.72 × 10−01 | 1.76 × 10−05 a |
| S_03-S_02 | 1.00 × 10+00 | 6.84 × 10−01 | 1.00 × 10+00 | 7.25 × 10−01 | 1.98 × 10−01 | 9.93 × 10−01 | 7.97 × 10−09 a | 1.00 × 10+00 | 9.39 × 10−01 | 9.66 × 10−01 | 9.02 × 10−01 |
| S_04-S_02 | 3.66 × 10−01 | 9.52 × 10−09 a | 6.57 × 10−02 | 1.85 × 10−09 a | 9.88 × 10−01 | 9.99 × 10−01 | 2.18 × 10⁻¹⁰ a | 2.19 × 10−05 a | 1.00 × 10+00 | 4.05 × 10−01 | 5.22 × 10−01 |
| S_05-S_02 | 1.32 × 10−08 a | 0.00 × 10+00 a | 3.64 × 10⁻¹² a | 0.00 × 10+00 a | 4.91 × 10−01 | 7.41 × 10−01 | 0.00 × 10+00 a | 2.04 × 10⁻¹² a | 5.53 × 10−07 a | 3.28 × 10−02 a | 7.11 × 10⁻¹² a |
| S_06-S_02 | 6.43 × 10⁻¹⁴ a | 0.00 × 10+00 a | 6.17 × 10⁻¹⁴ a | 0.00 × 10+00 a | 2.15 × 10−03 a | 3.68 × 10−02 a | 0.00 × 10+00 a | 6.78 × 10⁻¹⁴ a | 1.10 × 10⁻¹³ a | 5.09 × 10−04 a | 6.94 × 10⁻¹⁴ a |
| S_07-S_02 | 6.91 × 10⁻¹⁴ a | 0.00 × 10+00 a | 6.29 × 10⁻¹⁴ a | 0.00 × 10+00 a | 3.28 × 10−02 a | 5.35 × 10−02 | 0.00 × 10+00 a | 5.55 × 10⁻¹³ a | 6.01 × 10⁻¹⁰ a | 2.70 × 10−03 a | 6.41 × 10⁻¹⁴ a |
| S_04-S_03 | 2.89 × 10−02 a | 4.57 × 10⁻¹⁰ a | 5.52 × 10−04 a | 1.47 × 10⁻¹¹ a | 6.21 × 10−02 | 4.66 × 10−01 | 0.00 × 10+00 a | 2.79 × 10⁻¹¹ a | 1.96 × 10−01 | 7.70 × 10−01 | 4.38 × 10−05 a |
| S_05-S_03 | 8.43 × 10⁻¹⁴ a | 0.00 × 10+00 a | 0.00 × 10+00 a | 0.00 × 10+00 a | 7.24 × 10⁻¹² a | 5.39 × 10−03 a | 0.00 × 10+00 a | 0.00 × 10+00 a | 6.85 × 10⁻¹⁴ a | 2.70 × 10−02 a | 0.00 × 10+00 a |
| S_06-S_03 | 0.00 × 10+00 a | 0.00 × 10+00 a | 0.00 × 10+00 a | 0.00 × 10+00 a | 6.79 × 10⁻¹⁴ a | 1.89 × 10−08 a | 0.00 × 10+00 a | 0.00 × 10+00 a | 0.00 × 10+00 a | 1.53 × 10−05 a | 0.00 × 10+00 a |
| S_07-S_03 | 0.00 × 10+00 a | 0.00 × 10+00 a | 0.00 × 10+00 a | 0.00 × 10+00 a | 5.03 × 10⁻¹² a | 2.59 × 10−05 a | 0.00 × 10+00 a | 5.47 × 10⁻¹⁴ a | 7.04 × 10⁻¹⁴ a | 2.28 × 10−03 a | 0.00 × 10+00 a |
| S_05-S_04 | 6.88 × 10⁻¹⁴ a | 0.00 × 10+00 a | 0.00 × 10+00 a | 0.00 × 10+00 a | 1.06 × 10⁻¹⁰ a | 1.35 × 10−01 | 0.00 × 10+00 a | 9.23 × 10−09 a | 0.00 × 10+00 a | 1.22 × 10−01 | 0.00 × 10+00 a |
| S_06-S_04 | 0.00 × 10+00 a | 0.00 × 10+00 a | 0.00 × 10+00 a | 0.00 × 10+00 a | 0.00 × 10+00 a | 1.44 × 10⁻¹⁰ a | 0.00 × 10+00 a | 0.00 × 10+00 a | 0.00 × 10+00 a | 2.22 × 10−07 a | 0.00 × 10+00 a |
| S_07-S_04 | 0.00 × 10+00 a | 0.00 × 10+00 a | 0.00 × 10+00 a | 5.88 × 10⁻¹⁴ a | 9.70 × 10−09 a | 8.08 × 10−04 a | 0.00 × 10+00 a | 1.25 × 10−06 a | 6.03 × 10⁻¹⁴ a | 1.55 × 10−02 a | 0.00 × 10+00 a |
| S_06-S_05 | 0.00 × 10+00 a | 4.74 × 10⁻¹⁴ a | 5.97 × 10⁻¹⁴ a | 9.41 × 10⁻¹⁴ a | 4.60 × 10⁻¹² a | 2.10 × 10−07 a | 3.57 × 10−08 a | 7.13 × 10⁻¹¹ a | 8.96 × 10⁻¹⁴ a | 8.47 × 10−04 a | 0.00 × 10+00 a |
| S_07-S_05 | 1.28 × 10⁻¹³ a | 1.96 × 10−01 | 9.70 × 10−07 a | 1.00 × 10+00 | 1.28 × 10−01 | 6.11 × 10−02 | 0.00 × 10+00 a | 3.43 × 10−01 | 1.80 × 10−02 a | 4.05 × 10−01 | 1.16 × 10−03 a |
| S_07-S_06 | 5.88 × 10−01 | 8.68 × 10−01 | 8.70 × 10−01 | 1.06 × 10−02 a | 1.00 × 10+00 | 9.98 × 10−01 | 0.00 × 10+00 a | 9.91 × 10−01 | 1.00 × 10+00 | 1.00 × 10+00 | 9.92 × 10−01 |
Publisher’s Note: MDPI stays neutral with regard to jurisdictional claims in published maps and institutional affiliations. |
© 2022 by the authors. Licensee MDPI, Basel, Switzerland. This article is an open access article distributed under the terms and conditions of the Creative Commons Attribution (CC BY) license (https://creativecommons.org/licenses/by/4.0/).
Share and Cite
MDPI and ACS Style
Botija Yagüe, M.P.; Sorbet-Santiago, S.; Díaz-Carnicero, J.; González-de-Julián, S.; Usó-Talamantes, R. Modelling Deprivation Level and Multimorbidity in a Health District. Mathematics 2022, 10, 659. https://doi.org/10.3390/math10040659
AMA Style
Botija Yagüe MP, Sorbet-Santiago S, Díaz-Carnicero J, González-de-Julián S, Usó-Talamantes R. Modelling Deprivation Level and Multimorbidity in a Health District. Mathematics. 2022; 10(4):659. https://doi.org/10.3390/math10040659
Chicago/Turabian StyleBotija Yagüe, María Pilar, Sofía Sorbet-Santiago, Javier Díaz-Carnicero, Silvia González-de-Julián, and Ruth Usó-Talamantes. 2022. "Modelling Deprivation Level and Multimorbidity in a Health District" Mathematics 10, no. 4: 659. https://doi.org/10.3390/math10040659
Note that from the first issue of 2016, this journal uses article numbers instead of page numbers. See further details here.