Article

Intelligent Optimization Based Multi-Factor Deep Learning Stock Selection Model and Quantitative Trading Strategy

1
School of Management Science and Engineering, Nanjing University of Information Science and Technology, Nanjing 210044, China
2
School of Finance, Central University of Finance and Economics, Beijing 100081, China
*
Author to whom correspondence should be addressed.
Mathematics 2022, 10(4), 566; https://doi.org/10.3390/math10040566
Submission received: 30 December 2021 / Revised: 7 February 2022 / Accepted: 10 February 2022 / Published: 12 February 2022
(This article belongs to the Topic Engineering Mathematics)

Abstract

:
With the rapid development of financial research theory and artificial intelligence technology, quantitative investment has gradually entered people’s attention. Compared with traditional investment, the advantage of quantitative investment lies in quantification and refinement. In quantitative investment technology, quantitative stock selection is the foundation. Without good stock selection ability, the effect of quantitative investment will be greatly reduced. Therefore, this paper builds an effective multi-factor stock selection model based on intelligent optimization algorithms and deep learning and proposes corresponding trading strategies based on this. First of all, this paper selects 26 effective factors of financial indicators, technical indicators and public opinion to construct the factor database. Secondly, a Gated Recurrent Unit (GRU) neural network based on the Cuckoo Search (CS) optimization algorithm is used to build a stock selection model. Finally, a quantitative investment strategy is designed, and the proposed multi-factor deep learning stock selection model based on intelligent optimization is applied to practice to test its effectiveness. The results show that the quantitative trading strategy based on this model achieved a Sharpe ratio of 127.08%, an annualized rate of return of 40.66%, an excess return of 13.13% and a maximum drawdown rate of −17.38% during the back test period. Compared with other benchmark models, the proposed stock selection model achieved better back test performance.

1. Introduction

In recent years, with the rapid development of financial market and artificial intelligence technology, quantitative investment has attracted more and more attention from investors and securities investment practitioners. Quantitative investment is an investment technology that combines mathematics, statistics, computer, finance and other knowledge to establish transaction models and strategies, find effective investment opportunities in the market, and finally achieve the goal of rational investment and income maximization [1]. Compared with traditional securities investment, quantitative investment uses mathematical models to provide investors and practitioners with scientific trading decisions, so as to realize rational investment and improve the efficiency and stability of securities trading with the help of computer technology. In the financial field, the operation of the market is affected by many factors. There is a high-dimensional and complex nonlinear relationship between the rise and fall of stocks and various factors. Deep learning has unique advantages in dealing with the high-dimensional characteristics of big data and solving complex problems [2,3,4]. In recent years, deep learning has achieved remarkable results in many fields, such as trend prediction, unstructured text processing, improving transaction strategies, and so on [5,6,7]. Therefore, how to use deep learning to build a multi-factor stock selection model that can be effectively applied to the actual market, and to study stock selection strategies, has important research significance.
The representative quantitative stock selection research can be traced back to the Markowitz model proposed by American economist Markowitz in 1952. This method uses the mean-variance model to quantify the return and risk in securities investment [8]. After that, Sharpe et al. proposed the Capital Asset Pricing Model (CAPM) based on the Markowitz model, which described the relationship between asset returns and risks with linear expression, and further improved the financial theory research [9]. At present, the mainstream multi-factor stock selection model mainly draws lessons from the “Fama–French three-factor model” proposed by Fama and French in 1993 [10], and continues to innovate and explore on this basis. Carhart [11] found that the momentum factor can explain the excess return of individual stocks based on the “Fama–French three-factor model”. In 2015, Fama and French found that the company’s profitability and investment preference can further explain the excess return, so they put forward a more perfect “five-factor model” [12]. Wang et al. [13] proposed an eight-factor stock selection model index system, which predicted the rise and fall of 200 stocks in April 2013 and achieved good results. Shang [14] comprehensively considered the heterogeneity of property rights and investor sentiment factors to explore their impact on managers’ investment behavior. However, in the existing quantitative stock selection studies, the construction of a factor pool still has some limitations. In the selection of stock factor data, many scholars are mostly limited to fundamental indicators or technical indicators, and few people combine the two. In addition, the research on investor sentiment is not sufficient, and there is still a research gap.
In terms of the stock selection model, the arrival of the era of big data and artificial intelligence has provided new opportunities for quantitative investment [15,16]. More and more scholars have begun to use machine learning algorithms for modeling, so as to effectively overcome the limitations of traditional statistical models that are difficult to describe the complex nonlinear relationship between stock returns and factors and are not suitable for high-dimensional problems [17,18,19,20]. Rasekhschaffe et al. [21] respectively applied four machine learning algorithms such as gradient boosting classification regression tree and support vector machine to the stock markets in the United States, Japan, Europe and Asia (except Japan) for empirical research. The experimental results show that a machine learning algorithm can be used by investors to predict stock returns and limit the risk of over fitting. Deng [22] used the gradient boosting tree model in machine learning to perform technical analysis on the deviation of stock factor data and established a multi-factor stock selection model based on factor deviation and gradient boosting tree. The simulated trading results show that the Alpha excess return of the stock selection model reaches about 25%. Luo [23] combined random forest, extreme gradient boosting and other machine learning algorithms based on the Stacking method, and established an integrated multi-factor stock selection model with strong learning capabilities. The back test performance of this model on the CSI 300 is significantly better than other comparisons models. Although machine learning models such as random forest and gradient lifting tree have achieved good prediction performance in the modeling application of stock factor data, traditional shallow learning algorithms such as random forest also have defects such as insufficient deep-level learning and over fitting [24,25]. Deep learning has stronger learning ability and adaptability. Many scholars have also made many attempts in the application of deep learning in recent years [26]. Liu et al. [27] proposed a stock selection algorithm that combines gray wolf optimization and support vector regression and conducted empirical research on the performance of the hybrid algorithm through transaction and financial data from the US and Chinese stock markets. Experimental results show that the proposed algorithm can stably achieve excess returns. Zhang et al. [28] combined traditional multi-factor analysis and established a multi-factor stock selection model based on long short-term memory (LSTM) algorithm. In the empirical analysis, LSTM is used to predict stock returns and portfolio classification. The results show that the multi-factor stock selection model based on LSTM has good profit prediction ability and profitability. Sun and Bi [29] combined deep learning with high-frequency trading, and selected Convolutional Neural Networks (CNN) and LSTM neural networks to construct the ups and downs classification models of the main asphalt futures contracts. Fischer and Krauss [30] used the LSTM neural network model to predict the movement direction of the S&P500 component stocks from 1992 to 2015. Research shows that the deep learning model has better stock selection capabilities than random forest, support vector machine (SVM) and logistic regression classification device. Zhao et al. [31] used three different recurrent neural network frameworks, namely Recurrent Neural Network (RNN), LSTM, and GRU, to predict stock fluctuations based on the memory of stock data, and it is concluded that the prediction performance of LSTM and GRU is obviously better than RNN.
However, the selection of parameters in deep learning has a great impact on the calculation results, and there are many difficulties, such as a large number of parameters and high calculation cost [32,33]. The intelligent optimization algorithm can solve this problem well. In particular, the Cuckoo Search optimization algorithm has significant advantages in optimization problems and has achieved remarkable results in parameter optimization [34], image signal processing [35], scheduling optimization [36], combinatorial optimization [37].
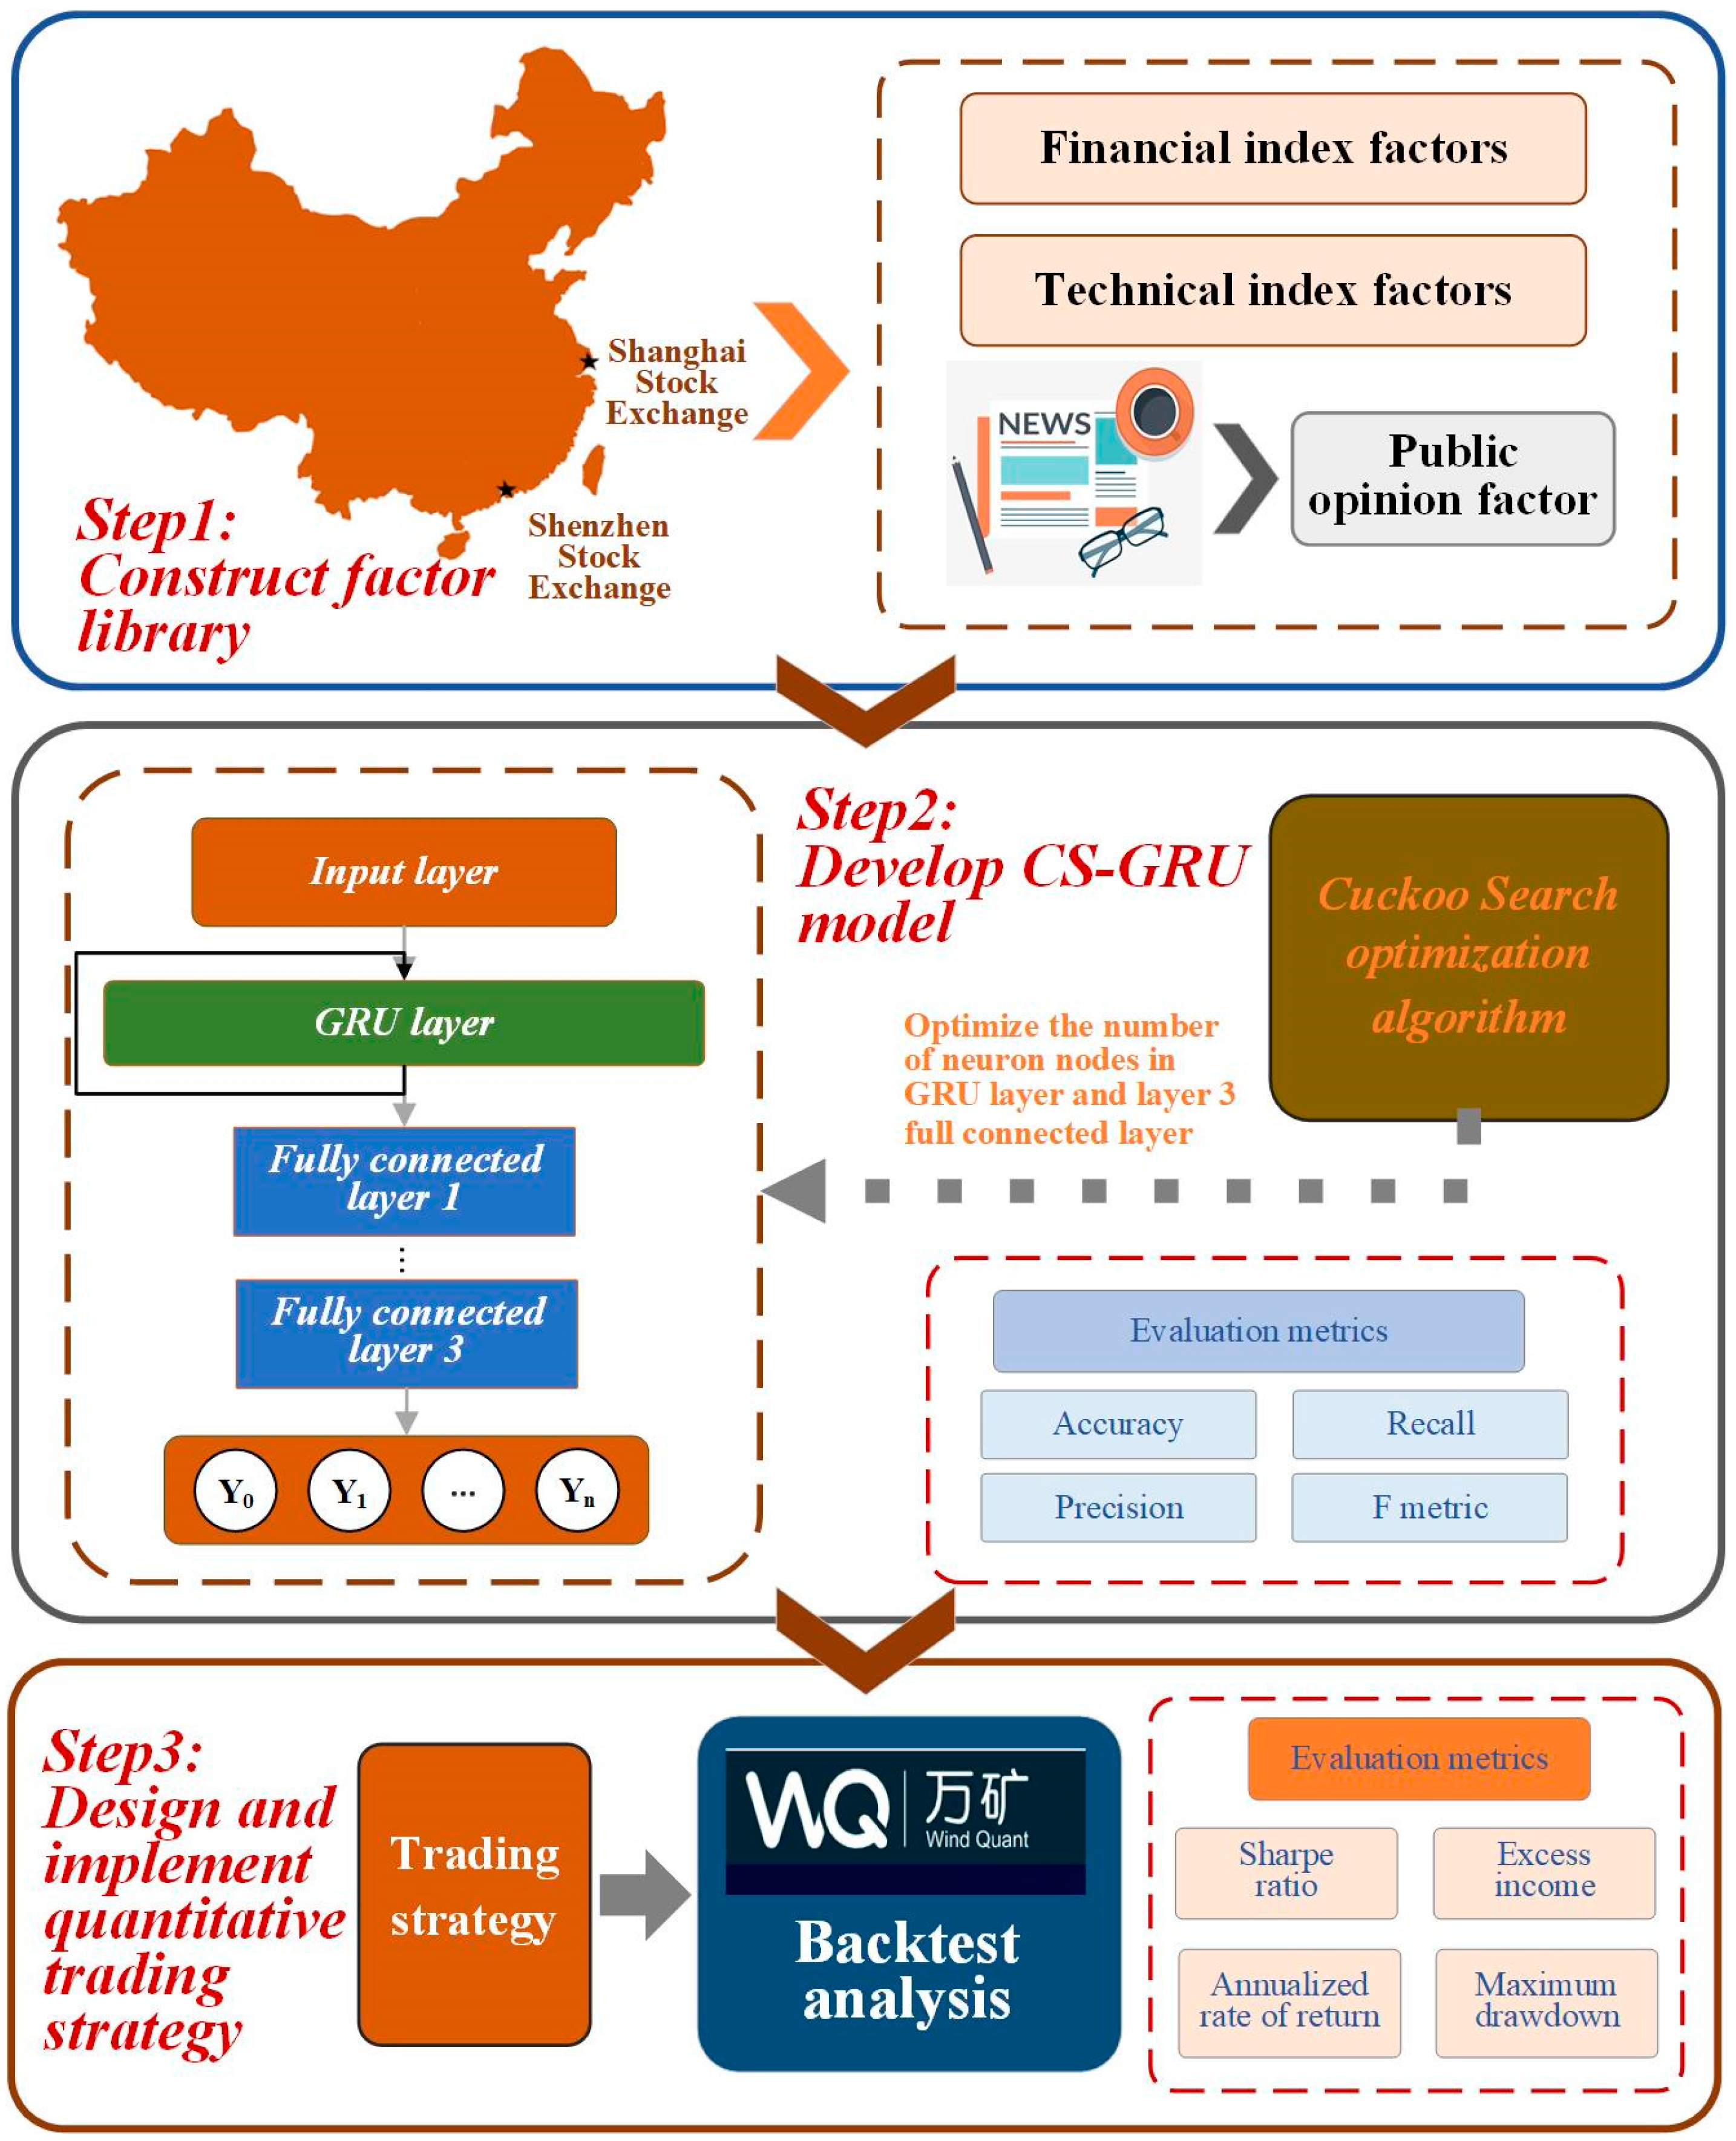
In order to describe the complex relationship between stock factors and individual stock excess returns, according to the previous research and the characteristics of quantitative investment, this paper designs 16 financial index factor data such as circulation market value, 9 technical index factor data such as 20 day annualized return variance, and sentiment index factor based on public opinion, innovatively proposed a multi-factor deep learning stock selection model based on intelligent optimization algorithms, and finally proposed a quantitative trading strategy, using the test set data and the established CS-GRU stock selection model.
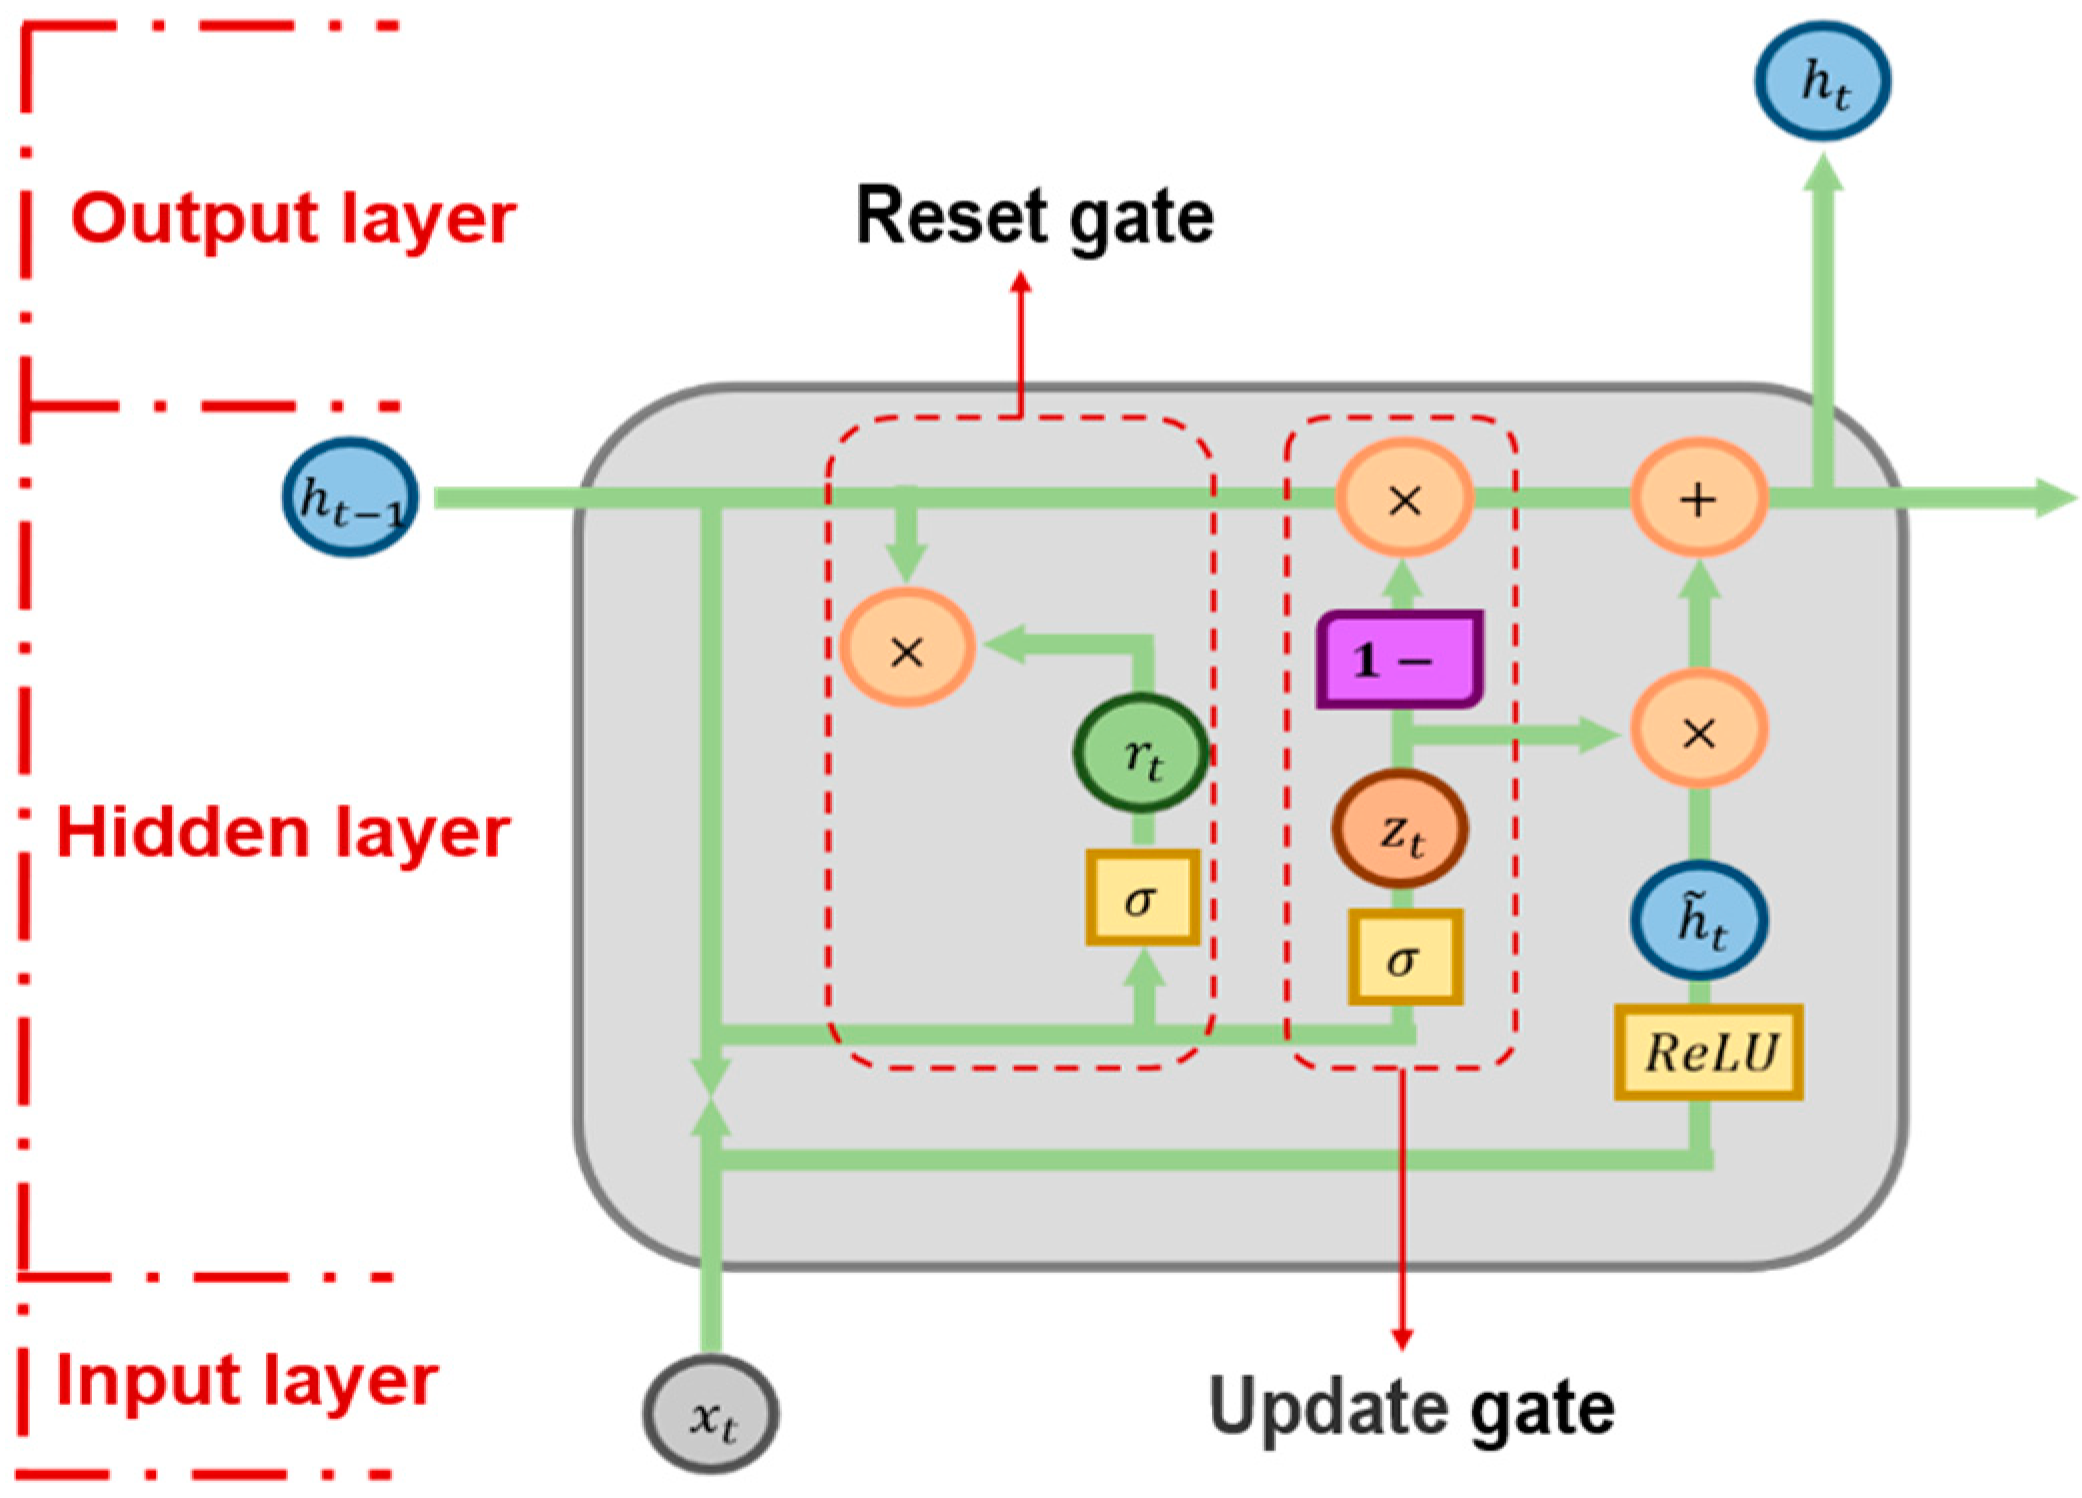
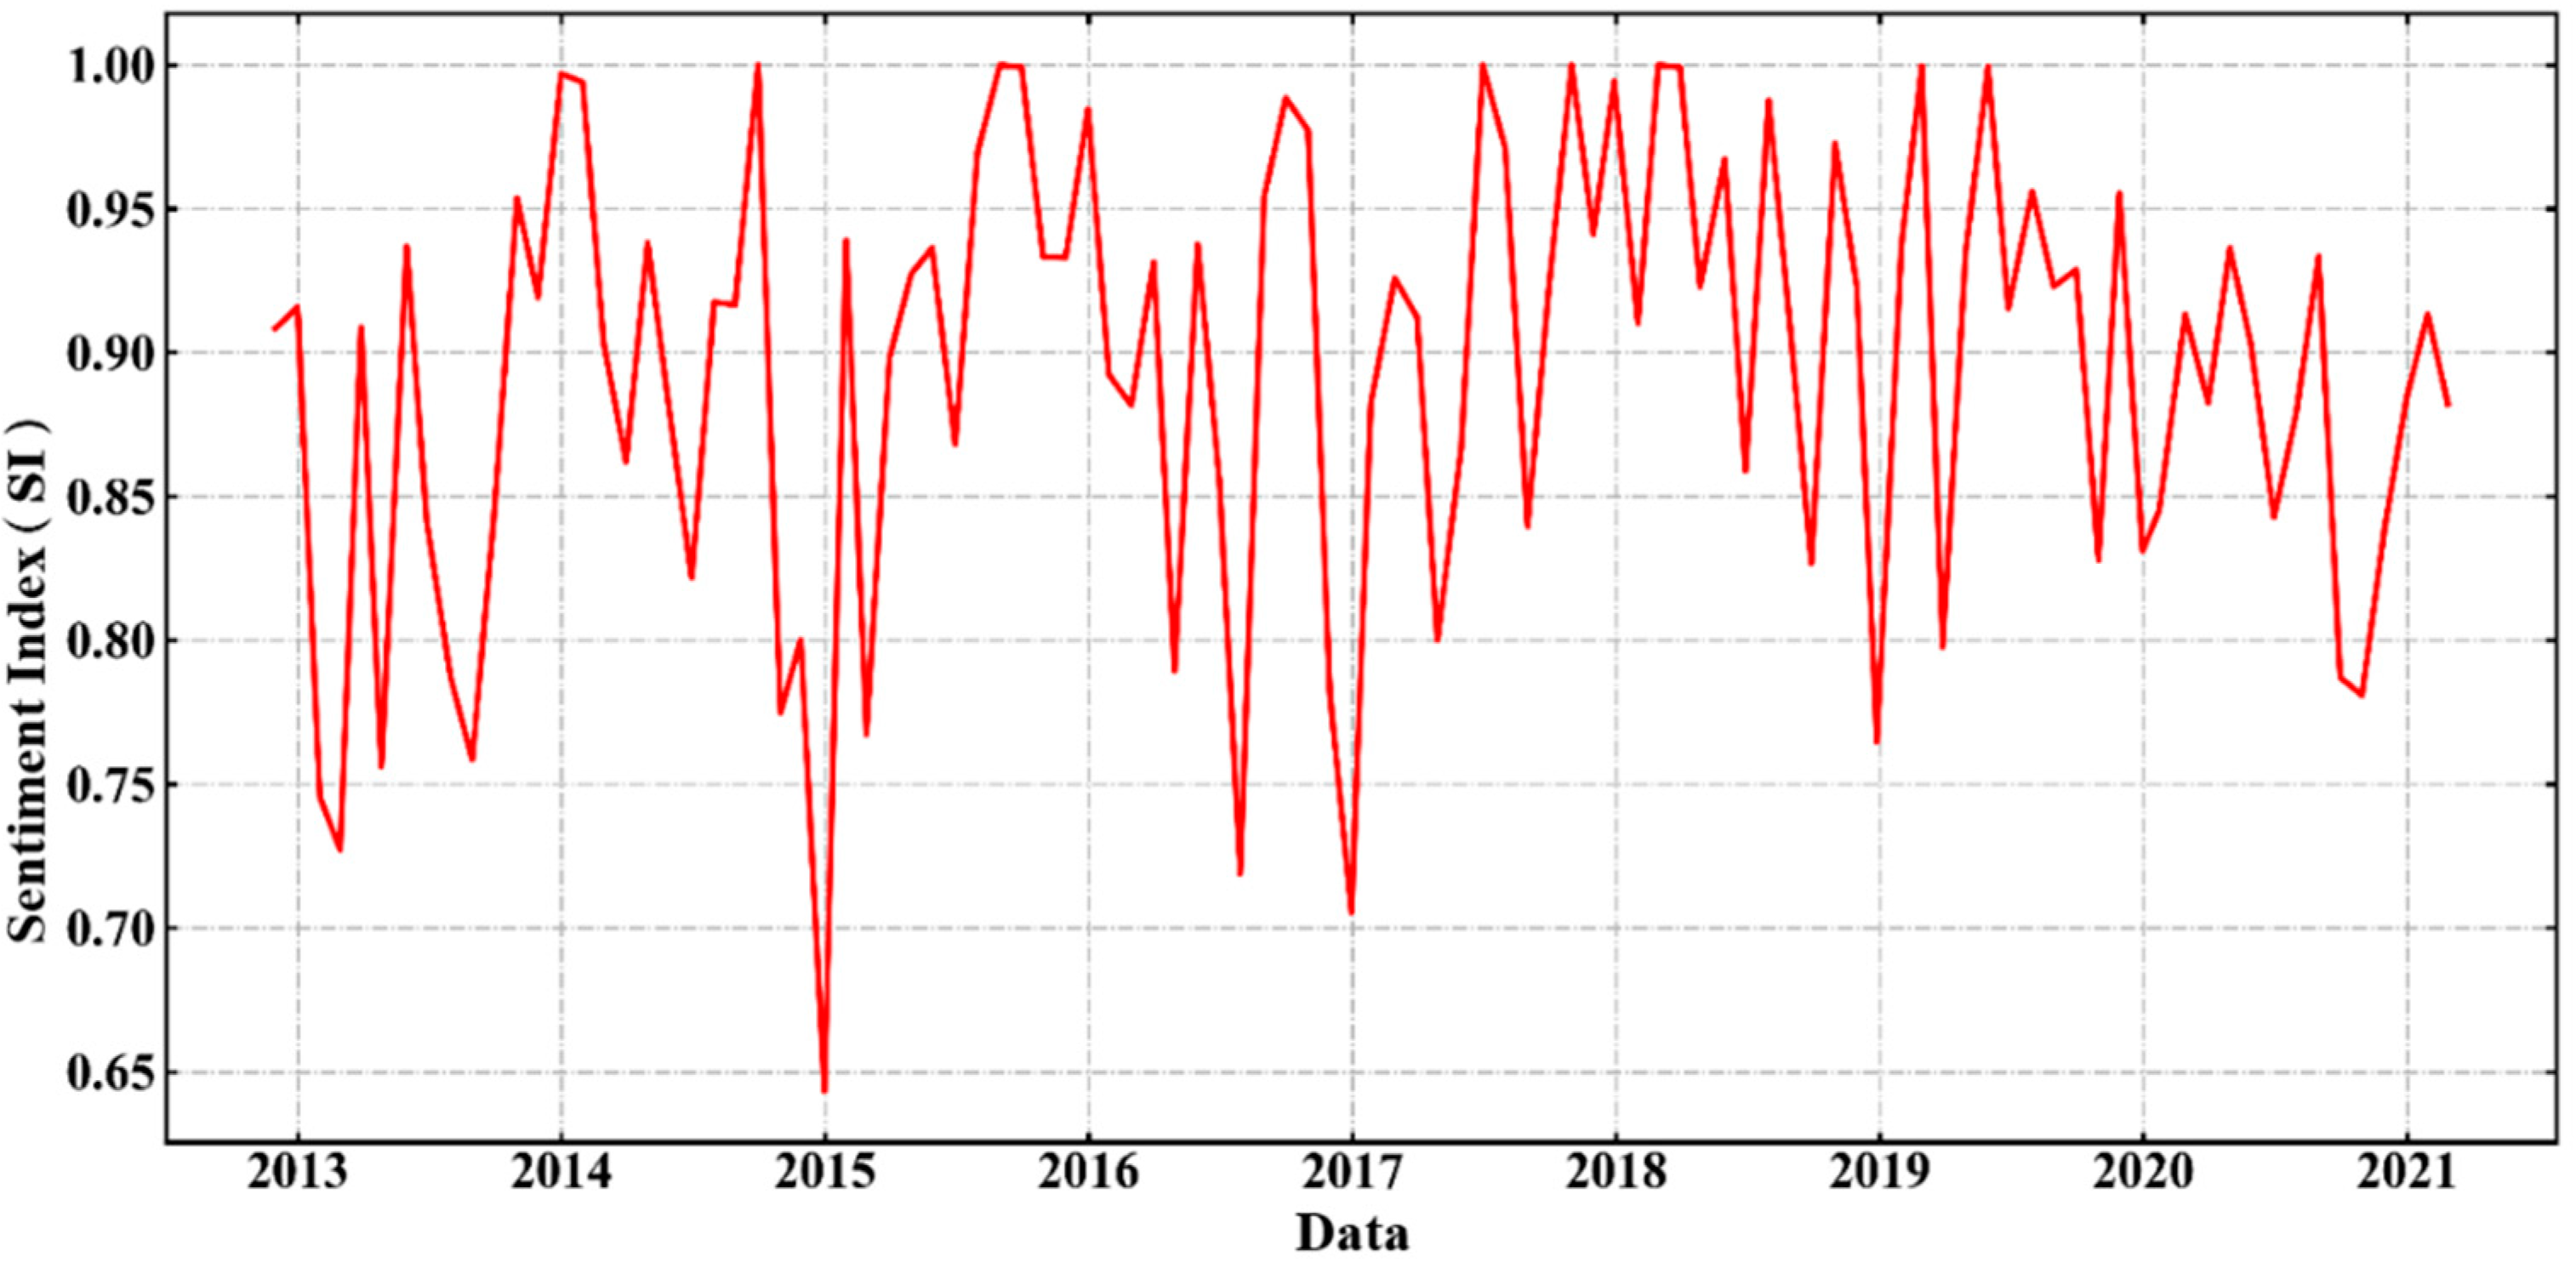
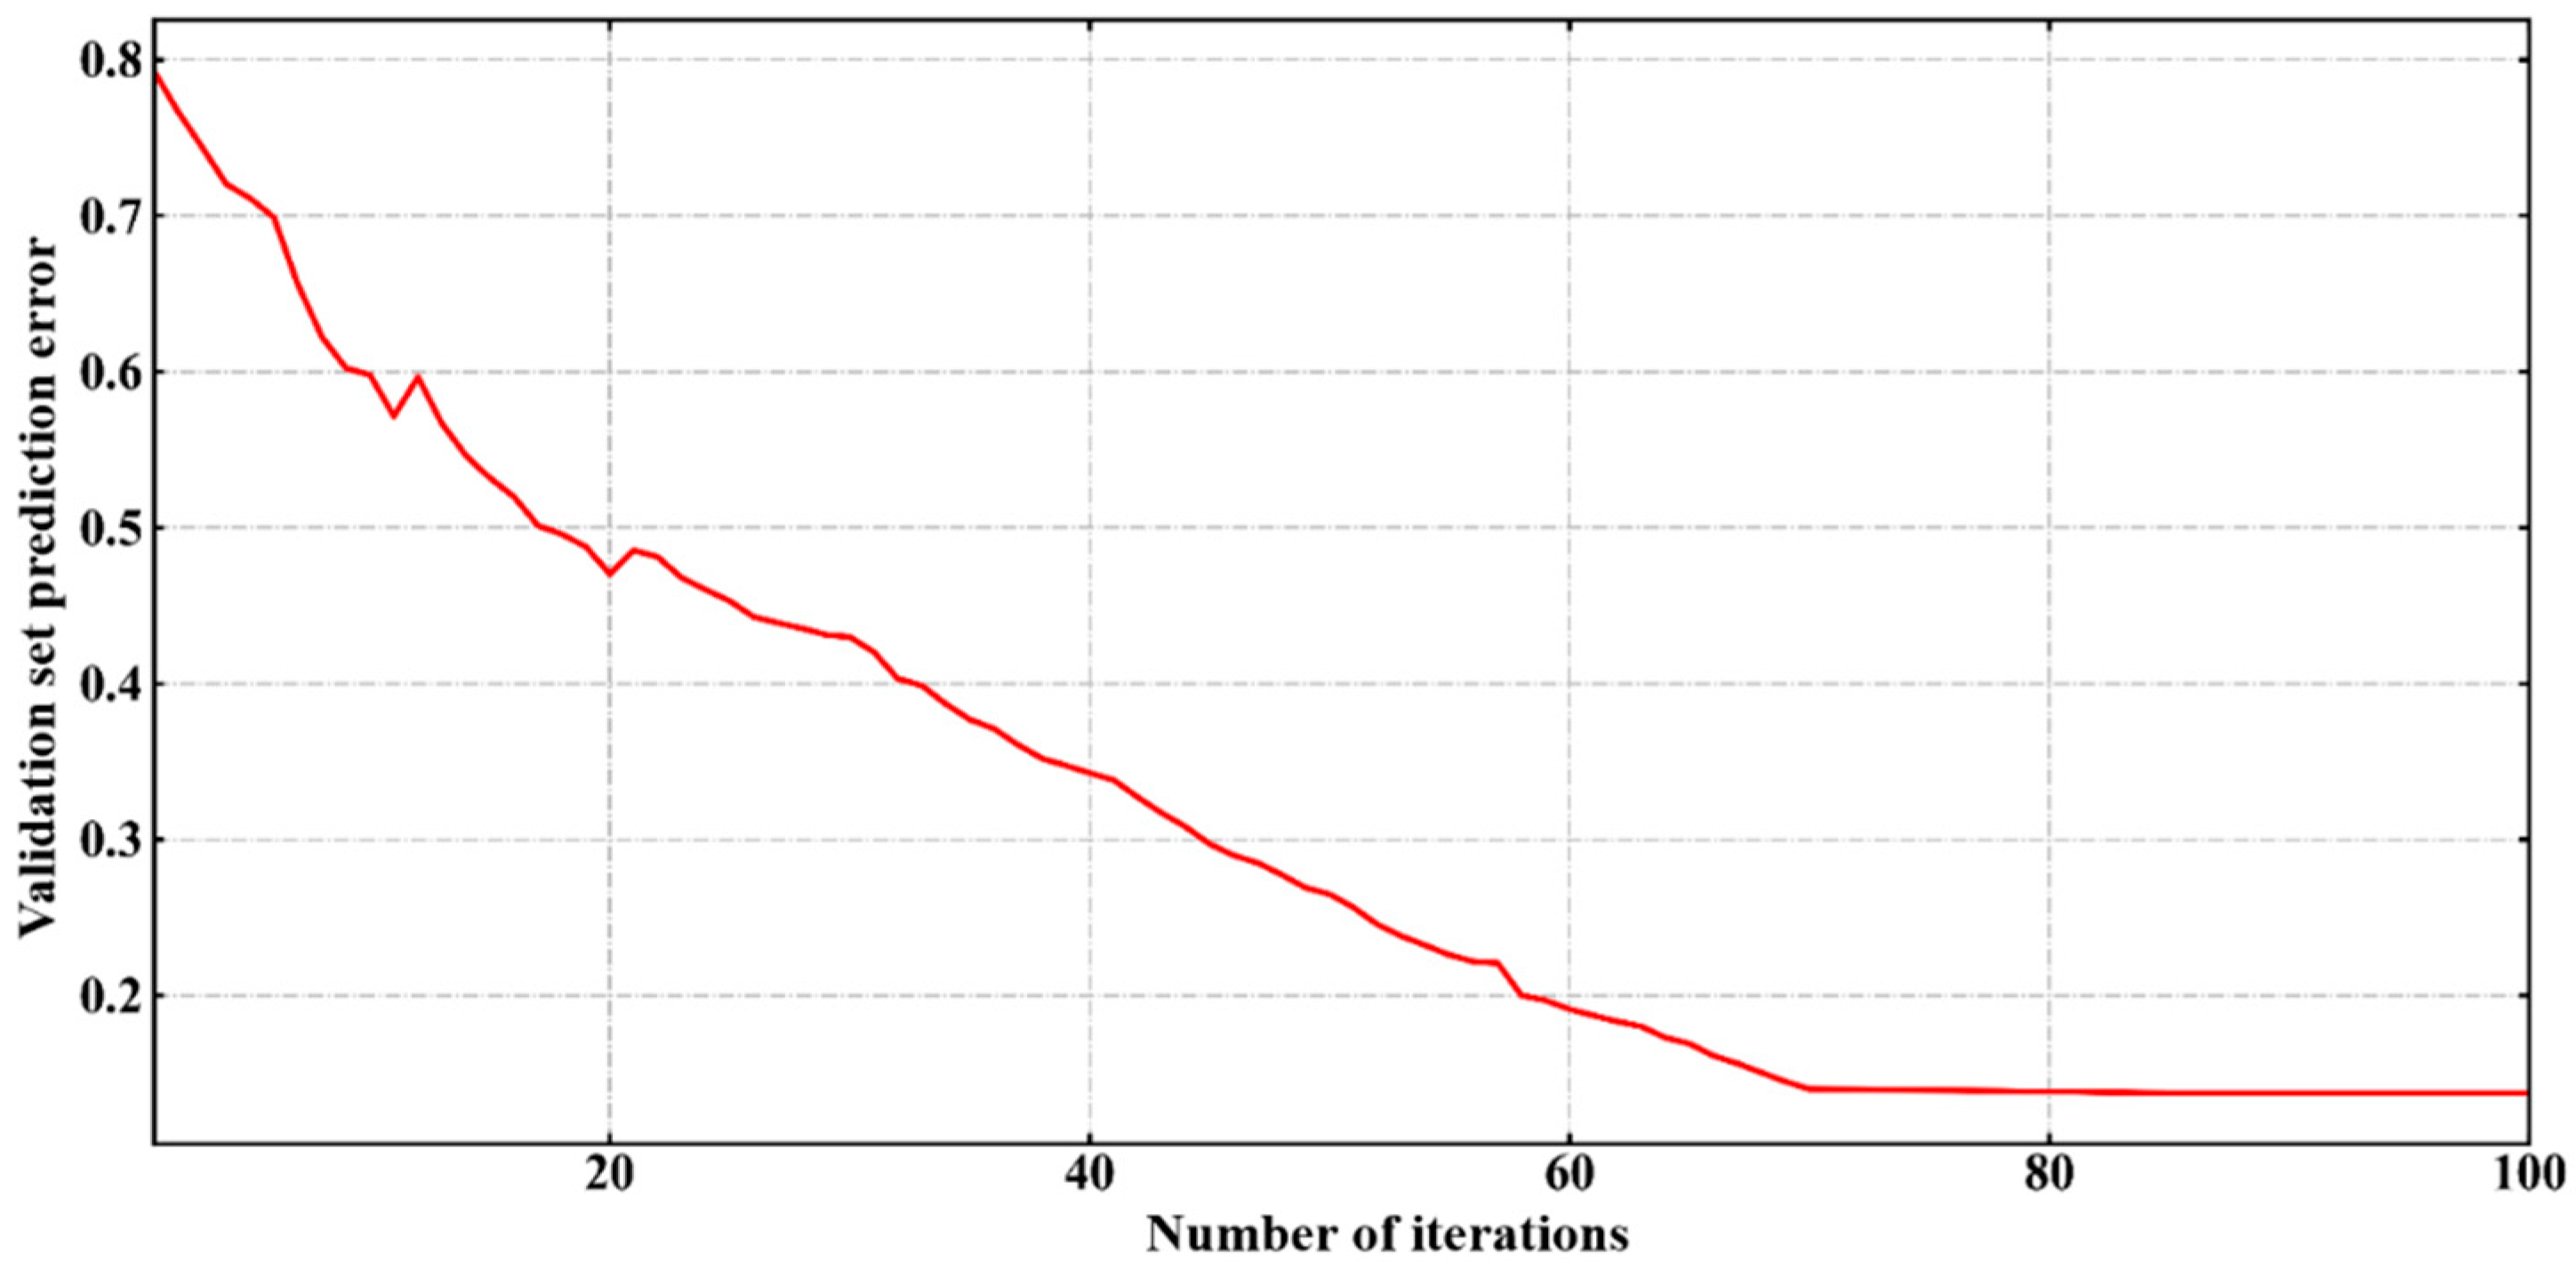
The contributions of this paper are mainly reflected in the following aspects. Firstly, in the construction of the factor database, this paper considers the impact of public opinion on investors and practitioners and constructs an innovative sentiment index factor based on the sentimental analysis of news broadcast text data. Secondly, in the construction of a multi-factor stock selection model, in order to solve the problem of nonlinear and high-dimensional stock price series prediction, this paper designs a GRU neural network architecture with multiple hidden layers as the core classification model of the multi-factor stock selection model. Thirdly, because the selection of parameters has a great impact on the prediction effect of the deep learning model, this paper creatively puts forward the CS-GRU stock selection model. Among them, the Cuckoo Search algorithm is used to optimize the number of neuron nodes in multiple hidden layers in GRU neural network architecture, so as to further improve the classification and prediction effect.
The rest of this paper is organized as follows. Section 2 introduces the methodological principles of this research. Section 3 presents and analyzes the empirical results. Comparisons and discussions are given in Section 4 and Section 5 provides some summaries and outlooks based on the results of the empirical study.

2. Material and Methods

2.1. Background

2.1.1. Cuckoo Search Optimization Algorithm

The Cuckoo Search optimization algorithm was proposed by Yang and Deb [38] in 2009. It is an innovative algorithm that imitates the cuckoo’s brooding behavior in nature. In this algorithm, the process of the cuckoo looking for the best nest to hatch eggs is equivalent to the process of looking for the optimal solution in d-dimensional space, and the quality of the nest symbolizes the quality of the solution. Compared with the ant colony algorithm and other population optimization algorithms, the Cuckoo Search optimization algorithm has been proved to be more effective in various fields [39].
The Cuckoo Search optimization algorithm has the following three assumptions:
(1)
Each cuckoo will lay an egg and stack it randomly in the selected nest;
(2)
The optimal nest will be transferred to the next generation;
(3)
The number of nests available is fixed, and the probability P a of host discovering foreign eggs in nest is in the range of [0, 1].
Based on these three assumptions, Levy’s flight formula is used to update the Cuckoo Search path and location:
X t + 1 = X t + α L e v y ( β )
where X t + 1 represents the updated nest position at time t + 1, X t represents the nest position at time t, α is the step size scaling factor, L e v y ( β ) is the Levy flight random path, and represents the point multiplication operation.
Levy flight belongs to the Markov process. For the general power-law step size distribution, due to the existence of the generalized central limit theorem, the distance distribution from the starting point tends to be stable after multiple steps. Therefore, many random walk processes can be described by Levy flight.
In addition, after the host bird finds an alien egg with a certain probability P a , the formula for reconstructing the position of the nest is defined as follows:
X t + 1 = X t + r H e a v i s i d e ( P a ε ) ( X i X j )
H e a v i s i d e ( x ) = { 1 , x 0 0 , x < 0
where r and ε are random numbers subject to uniform distribution, H e a v i s i d e ( x ) represents jump function, P a represents the probability that the host bird finds eggs inside and outside the nest, and X i and X j are any two other nests.

2.1.2. Gated Recurrent Unit Neural Network

A Gated Recurrent Unit (GRU) neural network is a kind of RNN, which has a strong learning ability in the prediction of time series data [40]. Compared with the traditional multi-layer perceptron (MLP) model, the RNN model considers the time sequence of samples in the training process, so it is more suitable for the prediction of stock price series [41,42]. However, in the process of calculation error back propagation of the RNN model, due to the continuous derivation of activation function, derivative multiplication will occur, which may lead to the problem of “gradient disappearance” or “gradient explosion”. To solve this problem, an LSTM neural network based on the forgetting mechanism of the human brain is proposed [32]. The LSTM model introduces the input gate, output gate and forgetting gate to solve the two problems of RNN. The cell state is used to carry the information of all previous states and is updated every new time. LSTM model selectively memorizes information through the states of input gate, output gate and forgetting gate, and realizes the function of long-term memory and forgetting. Although the prediction effect of the LSTM model is ideal, its training is slow and its calculation efficiency is not high due to too many parameters.
As an improved model of LSTM, GRU neural network can not only overcome the defects of RNN in long-time series prediction but also simplify the structure of the model and reduce parameters without reducing the prediction performance of LSTM [31,43]. The principle of the GRU model is shown in Figure 1. Compared with the LSTM neural network, the GRU neural network has only two gates: update gate and reset gate. Set the current input as x t and the status of the previous hidden node as h t 1 , including the relevant information of the previous node. Through the information in x t and h t 1 , GRU can obtain the output of the hidden node through gate control and transfer the information to the next hidden layer node.
First, the status z t and r t of the door can be updated and reset at any time according to the following formula:
z t = f s ( w z [ x t , h t 1 ] + b z )
r t = f s ( w r [ x t , h t 1 ] + b r )
where w z and w r are the neuron connection weights, x t   is the input data of the time t , h t 1 is the state of the hidden node at time t − 1, f S is the sigmoid activation function (the value can be controlled between 0 and 1 to obtain the gating signal), b z and b r are the bias vectors.
After obtaining the gating signal, firstly, use the reset gate to obtain the reset data, and combine it with the R e L U activation function to obtain the cell memory h ˜ t at the time t . The calculation formula is as follows:
h ˜ t = f R ( w [ r t × h t 1 , x t ] )
where w is the neuron connection weight, r t is the state information of the reset gate at t , x t is the input data at t , h t 1 is the state of the hidden node at t 1 , and f R is the R e L U activation function. It can be seen that h ˜ t not only includes the input data but also controls the hidden information.
Then in the update phase, the update gate is used to obtain the final output data h t at time t , and the calculation formula is as follows:
h t = ( 1 z t ) × h t 1 + z t × h ˜ t
where z t is the state information of the update gate at time t , h t 1 is the state of the hidden node at time t 1 , and h ˜ t is the cell memory at time t .

2.2. Data Definition

In this paper, the stock pool selects the constituent stocks of CSI 300, and excludes the stocks suspended in each cross-section period and the stocks with the current date of ST. The retrospective time is from 1 November 2012 to 28 February 2021. Among them, 1 November 2012 to 31 December 2019 are the training set, and 1 January 2020 to 28 February 2021 are the test set. The factor data of constituent stocks of CSI 300 index comes from the Join Quant factor database (https://www.joinquant.com/help/api/help#name:factor_values, accessed on 1 April 2021), the market data come from Join Quant historical market database, and the daily public opinion data come from Join Quant public opinion database.

2.3. Methodological Issues

This research proposes an intelligent optimization-based multi-factor deep learning stock selection model and quantitative trading strategy to guide stock market investment. The research framework of this paper mainly includes the construction of factor library, the construction of deep learning stock selection model and the design and implementation of quantitative trading strategy. Figure 2 shows the research framework of this paper.

2.3.1. Selection of Variables

Based on the previous research experience, this paper selects 16 financial index factors such as circulation market value and price-earnings ratio from the basic indicators to describe the valuation level, profitability, growth ability and financial level of individual stocks; From the technical indicators, 9 technical indicators such as 20 day annualized return variance and 10 day average turnover are selected to describe the volatility, trading volume and momentum of individual stocks. The detailed information of specific financial index factors and technical index factors are given in Table 1 and Table 2, respectively.

2.3.2. Construction of the Model

The selection of parameters has a great impact on the prediction effect of the neural network model, and intelligent optimization algorithm can solve this problem. In this paper, the Cuckoo Search algorithm with strong optimization ability is selected to optimize the architecture of the GRU neural network, and an innovative CS-GRU stock selection model is proposed. The construction steps of the CS-GRU stock selection model are as follows:
The first step is to build the initial GRU neural network architecture. In the initial GRU neural network architecture, four hidden layers are built in this paper, including one GRU layer and three full connection layers. In order to prevent over-fitting during the training process, this paper adds the D r o p O u t operation between the 4 hidden layers and chooses the D r o p O u t ratio to be 0.5. The R e L U type activation function is used between the GRU layer and the first fully connected layer, the R e L U type activation function [44] is also used between the 3 fully connected layers, and the S o f t m a x type activation function [44] is used between the last fully connected layer and the output layer. In terms of the number of neuron nodes in each layer, the number of input layer nodes is the number of samples in the training set, the number of output layer nodes is the number of classification label categories, and the number of neuron nodes in the four hidden layers is the optimization object of Cuckoo Search optimization algorithm. The number of initial neuron nodes in the four hidden layers is set to 10, 30, 20 and 15, respectively.
The second step is to optimize the parameters of the GRU neural network model. As the selection of the number of hidden layer neuron nodes has no established law to follow and has a great impact on the prediction performance of the neural network, in the CS-GRU stock selection model, the Cuckoo Search optimization algorithm is used to optimize the number of four hidden layer neuron nodes in the GRU neural network architecture. In addition, in the Cuckoo Search optimization algorithm, set the probability P a of the host bird to find foreign eggs in the nest to be 0.25, the step scaling factor α in Levy’s flight is 0.1, the β coefficient is 1.5, and the population size is 18.

2.3.3. Determination of Trading Strategy

In terms of stock selection, since the CS-GRU stock selection model can output the prediction probability of each category, on each position adjustment day in the back test period, 10 stocks with the largest rise probability are selected to form the portfolio according to the rise probability in the sample prediction results of the test set. In terms of position change, on each position adjustment day in the back test period, sell the stocks currently held (for example, individual stocks do not withdraw their positions among the 10 stocks with the highest rising probability), and adjust the positions of the new 10 stocks. Finally, the back test results of this strategy compared with the CSI 300 index during the back test period can be obtained.

2.3.4. Methodology

(1)
Design of public opinion factor
In addition to financial index factors and technical index factors, this paper also considers the impact of public opinion on investment confidence and investment sentiment of investors and securities practitioners and uses SnowNLP [5] in Python to analyze the sentiment of daily news broadcast text data. Thus, an innovative public opinion factor—sentiment index (SI) is obtained.
Based on Chinese text data, SnowNLP will give a result with a value in the range of [0, 1]. The closer to 1, the more positive sentiment, and the closer to 0, the more negative sentiment. This paper uses SnowNLP to analyze the sentiment of each news text in the cross-sectional news broadcast and takes the average value of several sentiment analysis results on that date as the sentiment index factor value. The obtained sentiment index factor is utilized as the input variable of the forecasting model together with the financial index factors and the technical index factors. Figure 3 shows the sentiment index factor values for each cross-sectional period in the backtracking time.
(2)
Feature engineering and label extraction
This paper takes the last trading day of each natural month within the backtracking time (November 2012 to February 2021) as the cross-sectional period. In each cross-sectional period, the individual stock factor data in the stock pool in the cross-sectional period is extracted as the characteristic data of this paper. All cross-sectional periods are traversed to obtain the final characteristic data set, and the number of the data set points is 29,049.
In terms of label extraction, this paper uses the excess return of individual stocks in the cross-sectional stock pool in the next natural month to form the initial label data set. Among them, the market return of the CSI 300 index is taken as the benchmark return. The calculation method of the excess return of individual stocks in the next natural month is as follows:
r i , t = p i , t + 1 e p i , t + 1 b p i , t + 1 b p 300 , t + 1 e p 300 , t + 1 b p 300 , t + 1 b
where r i , t represents the excess return rate of the next natural month of the t th month of the individual stock i , p i , t + 1 e represents the last trading day of the t + 1 th month of the individual stock i , p i , t + 1 b represents the closing price of the first trading day of the t + 1 th month of the individual stock i , P 300 , t + 1   e represents the closing price of the last trading day of the CSI 300 index in the t + 1 th month, P 300 , t + 1 b represents the closing price of the first trading day of the CSI 300 Index in t + 1 th month.
After obtaining the initial label dataset, this paper performs missing value filling and extreme value removal, and then discretizes it, so as to transform the multi-factor stock selection problem into a stock classification problem. For the classification model, this paper divides the individual stocks in the training set into two categories: rising and falling. The top 25% stocks of the next natural month’s excess return rate in the training set data sample are labeled as “rising”, and the bottom 25% stocks of the next natural month’s excess return rate in the training set data sample are labeled as “falling”. The middle 50% of stocks do not have obvious differentiation, so this paper removes them in the training model. Finally, the number of data samples in the training set is 12,430. In addition, this paper uses the One-Hot encoding method [45] to encode the label data, that is, the rise is [1, 0], and the fall is [0, 1].
(3)
Evaluation metrics
  • Classification evaluation metrics
In this paper, accuracy, recall, precision and F metric are used to evaluate the classification effect of CS-GRU stock selection model. In the two-classification problem, the confusion matrix is used to explain the meaning of these four classification evaluation indicators, as shown in Table 3.
In Table 3, TP represents the number of samples with label [1, 0] that are predicted to be [1, 0], FN represents the number of samples with label [1, 0] that are predicted to be [0, 1], and FP represents the number of samples with the label [0, 1] is predicted to be the number of [1, 0], and TN means the number of samples with the label [0, 1] is predicted to be the number of [0, 1].
The calculation formulas of the four classification evaluation metrics utilized in this paper are as follows.
A c c u r a c y = T P + T N T P + F N + F P + T N
R e c a l l = T P T P + F N
P r e c i s i o n = T P T P + F P
F = 2 p r e c i s i o n r e c a l l p r e c i s i o n + r e c a l l
b.
Back test evaluation metrics
From the perspective of risk and return, this paper selects the Sharpe ratio, annualized rate of return ( r p ), excess return (Alpha) and maximum drawdown rate to determine the performance of the strategy in the back testing process. The calculation formulas are shown in Equations (13)–(16).
S h a r p e   R a t i o = r p r f σ p        
r p = ( ( 1 + P ) 250 n 1 ) 100 %  
A l p h a = r p [ r f + β p ( r m r f ) ]
M a x   D r a w d o w n = Max ( V x V y ) V x
where r p is the strategy’s annualized rate of return, r f is the risk-free interest rate, σ p is the strategy’s return volatility, P is the profit of the strategy, n is the number of days the strategy is executed, α is the strategy’s excess return, r m is the benchmark annualized rate of return, β p is the strategy’s beta value, and V x and V y are the equity of the strategy on day x and y (y > x).

3. Results

3.1. Stock Classification Forecast

3.1.1. Model Training Settings

This paper uses the train_ test_ split function (https://scikit-learn.org/stable/, accessed on 10 April 2021) in the scikit-learn machine learning toolkit to randomly extract 20% of the data samples from the training set data to test the classification prediction effect of the CS-GRU stock selection model, that is, the number of training samples is 9944 and the number of verification samples is 2486.
In the training process of the GRU neural network, this paper selects cross-entropy as the loss function of the model, and its calculation formula is shown in Equation (17). Among them, L is the cross-entropy of the model, N is the number of samples, y i is the indicator variable (the prediction category and the category of sample i are the same, otherwise it is 0), p i is the probability that sample i is predicted to rise.
L = 1 N i [ y i log ( p i ) + ( 1 y i ) log ( 1 p i ) ]
In the selection of optimizer, this research selects Adam optimizer [46], and in order to prevent over fitting, the learning rate is set to 0.005. This research also sets the number of training rounds of GRU neural network to 500, and the batch size in each round of training is 50.

3.1.2. Model Parameter Optimization

In the CS-GRU stock selection model, the Cuckoo Search optimization algorithm is used to optimize the number of neuron nodes in the GRU layer and full connection layer in GRU neural network architecture. In the process of parameter optimization, this paper sets the maximum number of optimization iterations to 100, and the value range of the four parameters to be optimized is [0, 200]. Figure 4 shows the parameter optimization process of the Cuckoo Search optimization algorithm. It can be seen from Figure 4 that when the number of iteration rounds is about 70, the Cuckoo Search optimization algorithm is close to reaching global optimization. The minimum value of the objective function (prediction error of the verification set) is 0.1375, and the optimal solution of the parameter combination is [6,9,32], that is, 6 neuron nodes in the GRU layer, 49 neuron nodes in the first fully connected layer, 32 neuron nodes in the second fully connected layer and 9 neuron nodes in the third fully connected layer.

3.1.3. Model Classification Results

As shown in Figure 5, this research also shows the classification effect of the CS-GRU stock selection model in the form of a confusion matrix. The value in the first row and column of the confusion matrix represents 1226 samples whose real value is falling and predicted correctly, the value in the second column of the first row represents 26 samples whose real value is falling and predicted incorrectly, the value in the first column of the second row represents 101 samples whose real value is rising and predicted incorrectly, and the value in the second column of the second row represents 1133 samples whose real value is rising and predicted correctly. It can also be seen from Figure 5 that the CS-GRU stock selection model proposed in this paper has superior prediction performance.
In this paper, Accuracy, Recall, Precision and F metric are also used to evaluate the classification effect of the CS-GRU stock selection model. The GRU neural network architecture with the smallest verification set prediction error during the parameter optimization process was selected as the final CS-GRU stock selection model. It can be observed from Table 4 that in this research, the proposed model achieves excellent Accuracy, Recall, Precision, and F metric values, with 94.89%, 97.92%, 92.38%, and 95.07%, respectively. This shows that the model has a correct prediction rate of 94.89% in the overall sample, a correct prediction rate of 97.92% of the true rising sample, and a correct prediction rate of 92.38% of the predicted value of the rising sample. Furthermore, the F metric, the harmonic means of recall and precision, obtained by evaluating the proposed model, achieved a result of 95.07%. In other words, when recall and precision are equally important, the correct prediction ability of the CS-GRU model reaches 95.07%.

3.2. Strategy Back Testing Research

3.2.1. Back Test Environment Settings

After proving that the CS-GRU stock selection model has excellent stock classification prediction performance, this paper designs relevant quantitative trading strategies, and puts the stock selection model into the actual environment for back test analysis. Based on the Wind Quant quantitative trading platform (https://www.windquant.com/, accessed on 1 May 2021), this paper establishes a trading environment with a back test period from 1 January 2020 to 28 February 2021. The initial capital of the back test is set to RMB 1 million, the start time is 1 January 2020, and the end time is 28 February 2021. The position adjustment cycle is the last trading day of each natural month, and the benchmark income is the CSI 300 index.

3.2.2. Analysis of Back Test Results

Figure 6 shows the trading strategy of the multi-factor stock selection model based on CS-GRU and the specific return of the CSI 300 index during the back test period, in which the red line represents the net value of the strategy and the black line represents the benchmark return. It can be seen from the figure that the net value of the proposed trading strategy is significantly higher than the benchmark return in the back test period.
Furthermore, from the perspective of risk and return, this paper selects the Sharpe ratio, annualized rate of return, excess return, and maximum drawdown rate to determine the performance of the strategy in the back testing process. As shown in Table 5, during the back testing period, the Sharpe ratio, annualized rate of return, Alpha excess return and maximum drawdown rate of the quantitative trading strategy based on CS-GRU’s multi-factor stock selection model were 127.08%, 40.66%, 13.13% and −17.38%, respectively. Specifically, during the back test period, the excess return of each unit of risk borne by the investment portfolio implemented according to the trading strategy proposed in this study reached 127 08%. From the results of the annualized rate of return measuring the profitability of the strategy, it can be seen that the trading strategy based on the CS-GRU model can achieve relatively good returns. In addition, in this research, investors were able to obtain returns unrelated to market fluctuations, that is, the part where the actual return of the stock exceeds the expected return, reaching 13.13%. From the maximum drawdown rate, it can be found that the worst loss of the strategy during the back testing period is −17.38%. Therefore, it can be considered that the multi-factor stock selection model based on CS-GRU proposed in this paper has achieved relatively good risk and return performance in the actual trading environment.

4. Comparison and Discussion

4.1. Comparison with Other Models

In order to prove the effectiveness and superiority of the proposed multi-factor stock selection model based on CS-GRU, this paper compares its stock classification prediction effect and trading strategy back test performance with RNN and SVM models.
(1)
Stock classification comparison
Table 6 shows the evaluation results of the stock classification. Figure 7 and Figure 8 describe the confusion matrix of the stock classification results of the RNN and SVM stock selection models. In terms of stock classification, the RNN stock selection model realizes an accuracy of 91.31%, a recall rate of 93.84%, an precision rate of 89.42%, and an F metric of 91.58%; the SVM stock selection model realizes an accuracy of 83.30%, a recall rate of 86.42%, an precision rate of 81.53%, and an F metric of 83.90%.
In addition, it has been observed from previous financial market forecasting studies that the accuracy of existing quantitative investment models ranges from approximately 45% to 60% [30,47,48]. As can be seen from Table 6, the accuracy of the model proposed in this study is 94.89%, which is significantly better than the evaluation value of previous studies. Therefore, the proposed model is an effective and excellent stock price prediction tool.
(2)
Strategy back testing comparison
Table 7 shows the evaluation results of the strategy back test of each stock selection model. The stock selection strategy back test results based on RNN and SVM stock selection model is shown in Figure 9 and Figure 10. In terms of strategy back testing, the quantitative trading strategy based on the RNN stock selection model achieved a Sharpe ratio of 98.84%, an annualized rate of return of 32.61%, an Alpha excess return of 4.90%, and a maximum drawdown of −21.37% during the back test period. During the back test period, the quantitative trading strategy based on the SVM stock selection model achieved a Sharpe ratio of 75.79%, an annualized rate of return of 25.39%, an Alpha excess return of −2.18%, and a maximum drawdown rate of −21.37%.
Compared with the trading strategy based on the two comparative models, the trading strategy based on the CS-GRU stock selection model has significantly achieved better back test performance in all evaluation indicators. In addition to the maximum pullback rate, the trading strategy based on the RNN stock selection model is also better than that based on the SVM stock selection model. Both have the same maximum pullback rate, indicating that both strategies have suffered an equally bad loss in the back testing period.

4.2. Discussion

Based on the results of the above empirical research, the functions of each part of this study are further discussed and analyzed.
This study constructs a stock selection model based on multi-factors for quantitative investment. Unlike most previous stock forecasting studies that only consider fundamental indicators or technical indicators, the research presented in this paper considers both factors. In addition, this paper creatively constructs a sentiment index based on news text, which provides richer potential information for stock classification prediction. Furthermore, the empirical study of the proposed CS-GRU model is carried out by using the CSI 300 constituent stocks, and the results show that the prediction performance of this method is better than other models. This is because the internal architecture design of the GRU neural network can effectively capture the relationship characteristics between time series, and can inhibit gradient disappearance or gradient explosion. Moreover, as a metaheuristic search algorithm with strong optimization ability, the CS optimization algorithm solves the problem of parameter selection of deep learning model, so as to further improve the prediction ability of the model. Finally, this paper proposes a trading strategy, which can be used for stock selection and investment according to trading strategy and the results of the CS-GRU model. In this study, the Wind Quant platform was used to conduct a strategy back testing research, and it was finally found that the prediction model and trading strategy of this study could achieve relatively good investment returns. Therefore, it can be considered that the intelligent optimization-based multi-factor deep learning stock selection model and quantitative trading strategy proposed in this study can be used as an effective tool for individual consumers to invest.

5. Conclusions

This paper makes an in-depth study on the multi-factor quantitative stock selection based on China’s stock market from three aspects: the construction of the factor library, the construction of the deep learning stock selection model, the design and implementation of quantitative trading strategy, and provides a research route from data to model and then to practice. The research results are summarized as follows.
Firstly, this paper constructs a comprehensive library of quantitative factors. This paper selects 16 financial indicators such as circulation market value from the basic indicators to describe the valuation level, profitability, growth ability and financial level of individual stocks. From the technical indicators, nine technical indicators such as the 10 day average turnover rate are selected to describe the volatility, trading volume, momentum and so on. In addition, from the perspective of the impact of public opinion on the investment behavior of investors and employees, this paper makes a sentimental analysis on the text data of news broadcast and constructs an innovative public opinion factor, sentiment index.
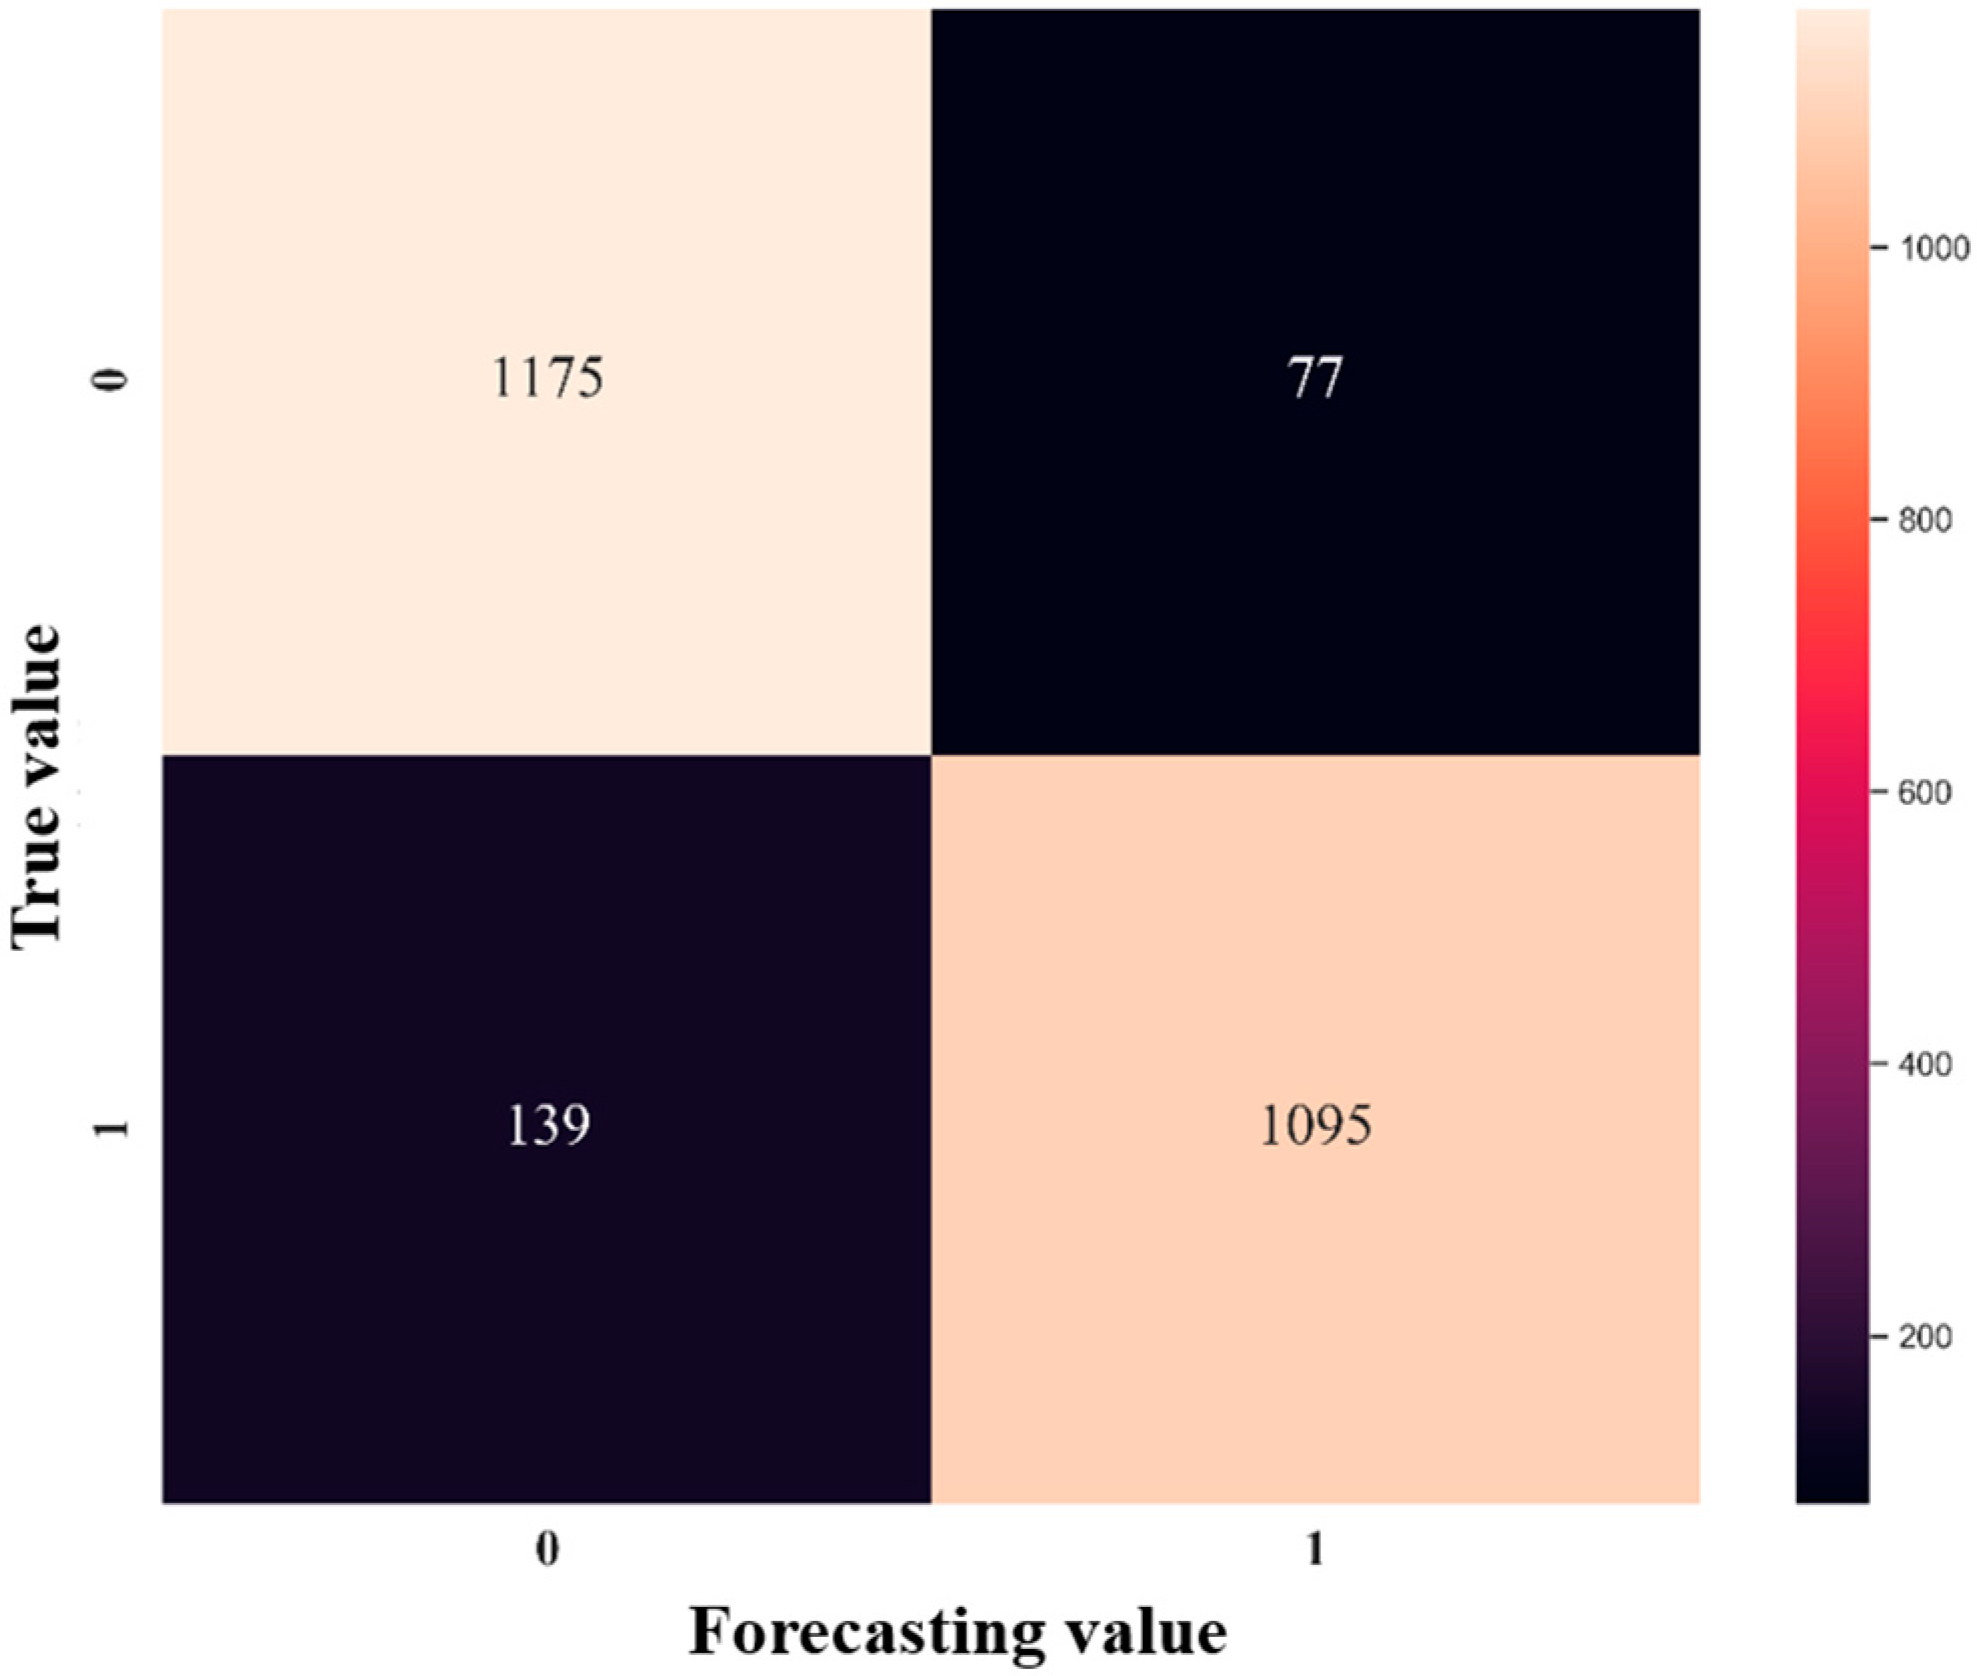
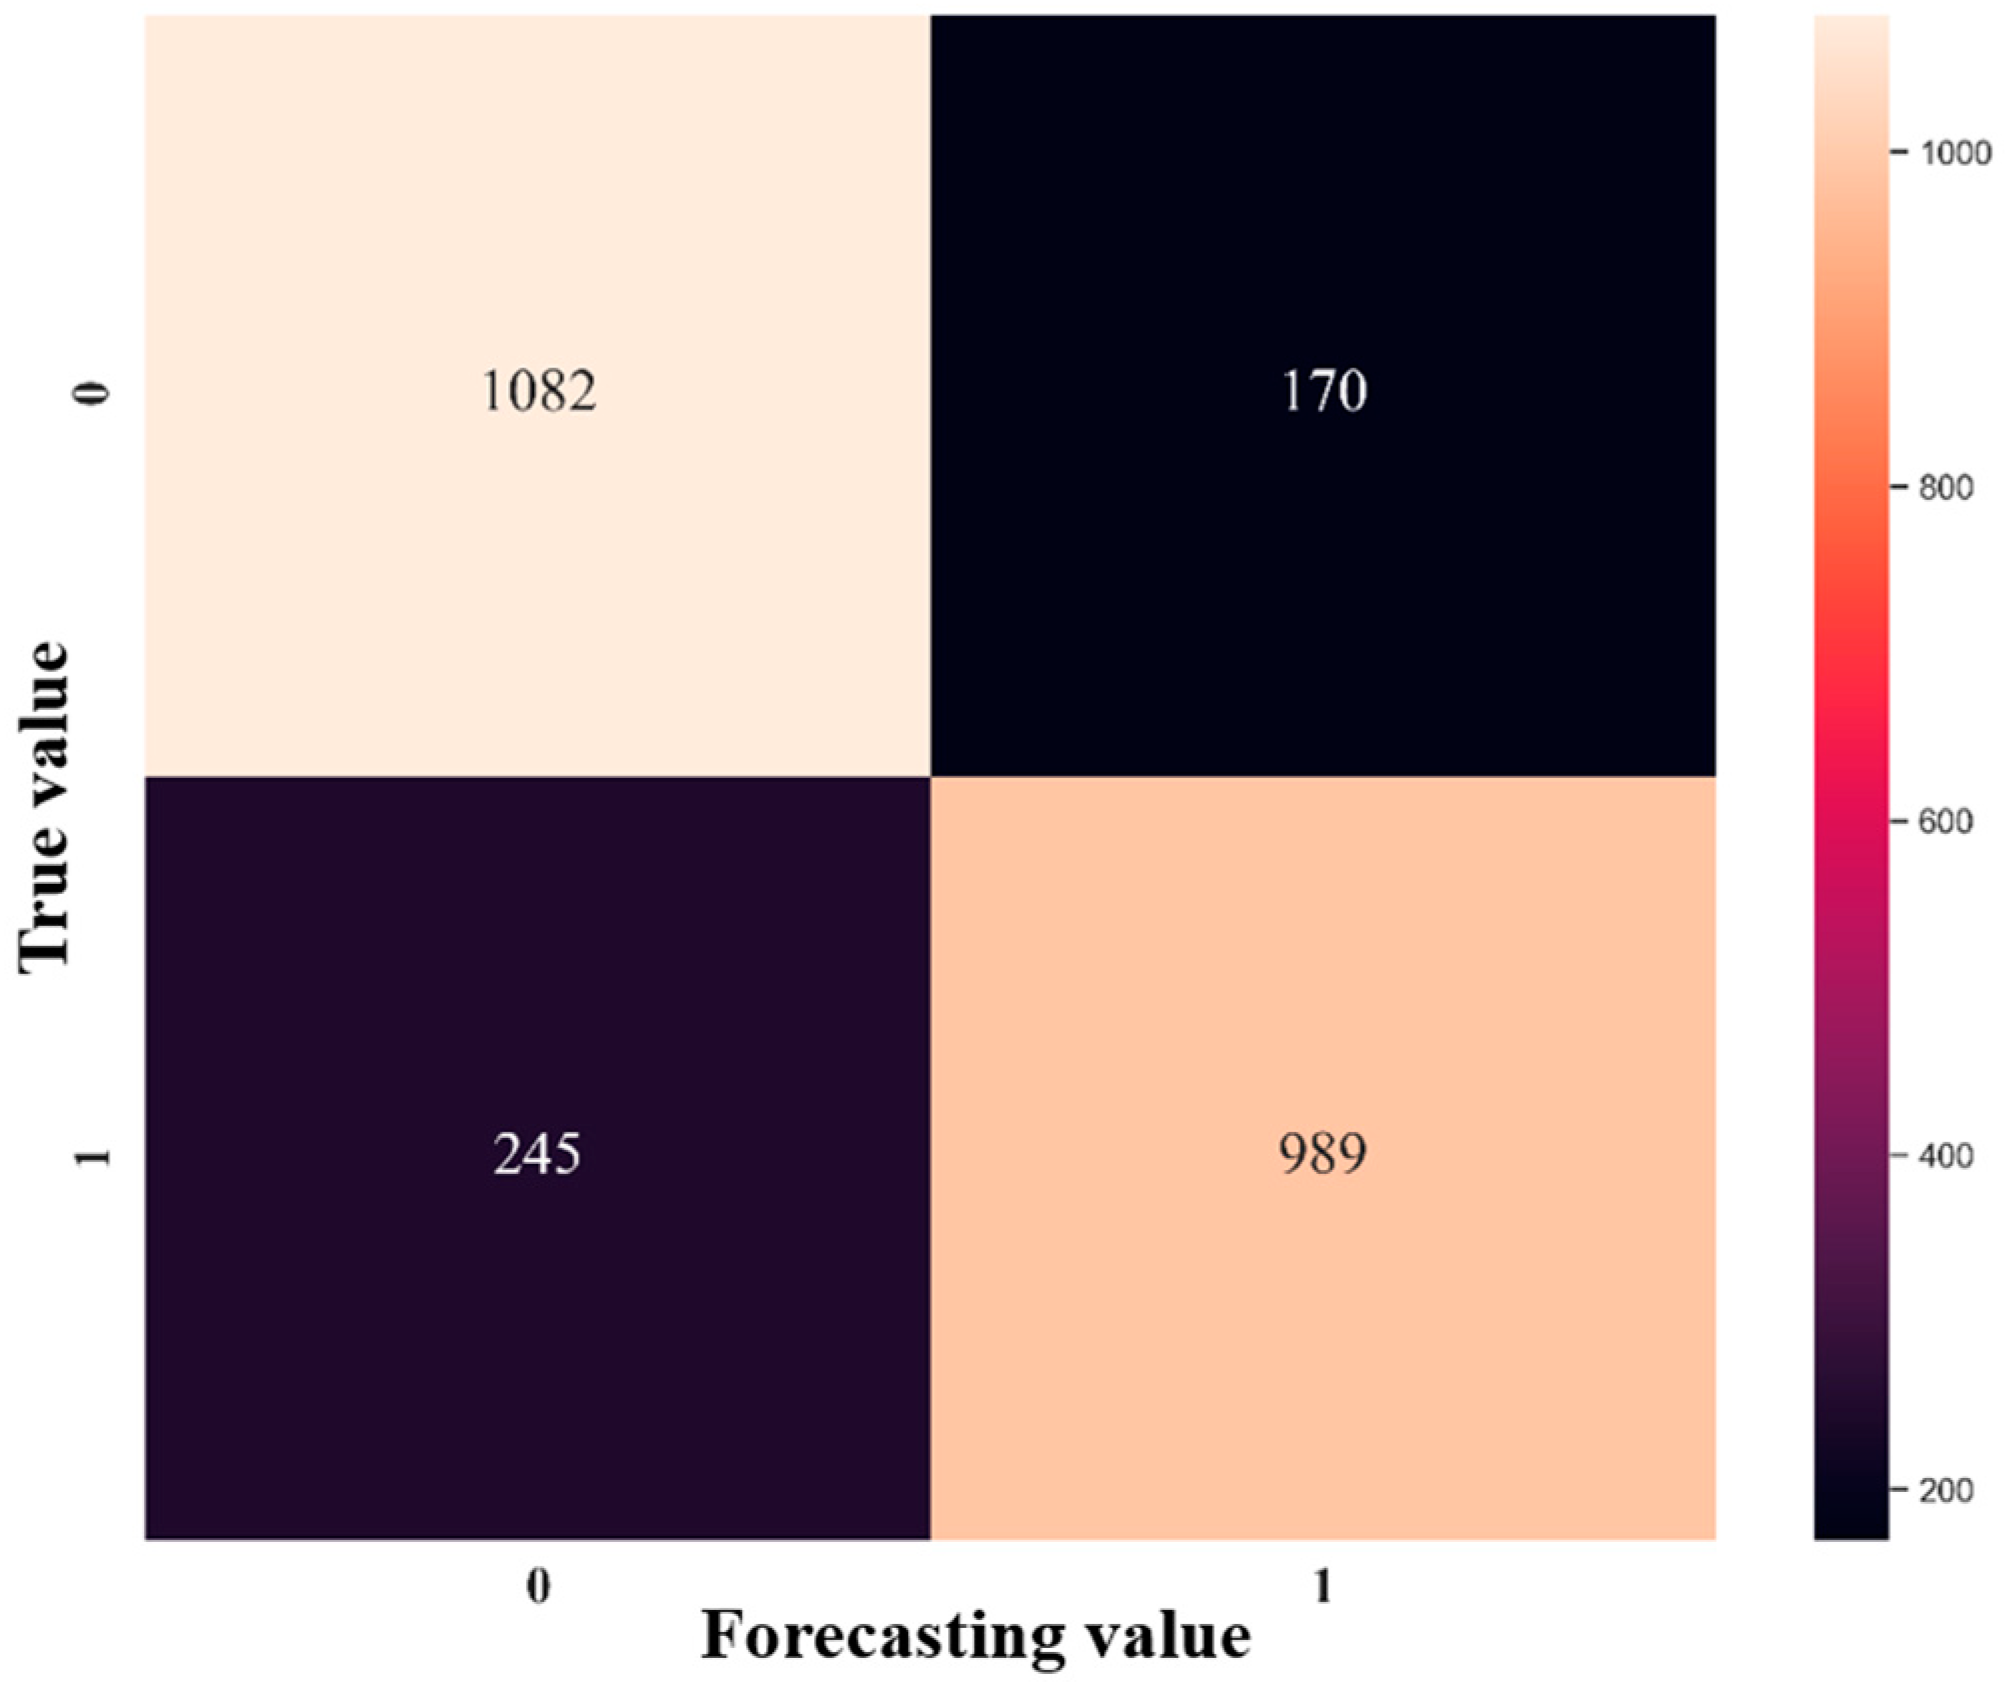
Secondly, this research builds a deep learning stock selection model based on intelligent optimization. Aiming at the complex nonlinear relationship between each factor and individual stock excess return, this paper proposes an innovative multi-factor deep learning stock selection model based on intelligent optimization to solve the multi-factor stock selection problem with high dimension and nonlinear characteristics. Compared with the traditional linear regression model and shallow machine learning model, the GRU neural network architecture in this model can more effectively describe the nonlinear relationship between factors and excess return, so as to achieve better prediction performance; Compared with RNN and other deep learning models, the GRU neural network can further improve the computational efficiency on the basis of improving the prediction performance. In the CS-GRU stock selection model, the Cuckoo Search optimization algorithm is also used to optimize the number of neuron nodes in the multi-layer hidden layer of the GRU neural network, so as to build a CS-GRU stock selection model with the best prediction performance. Finally, the CS-GRU stock selection model proposed in this paper achieved an accuracy of 94.89%, a recall rate of 97.92%, an precision rate of 92.38% and an F metric of 95.07%, and achieved excellent stock classification prediction results.
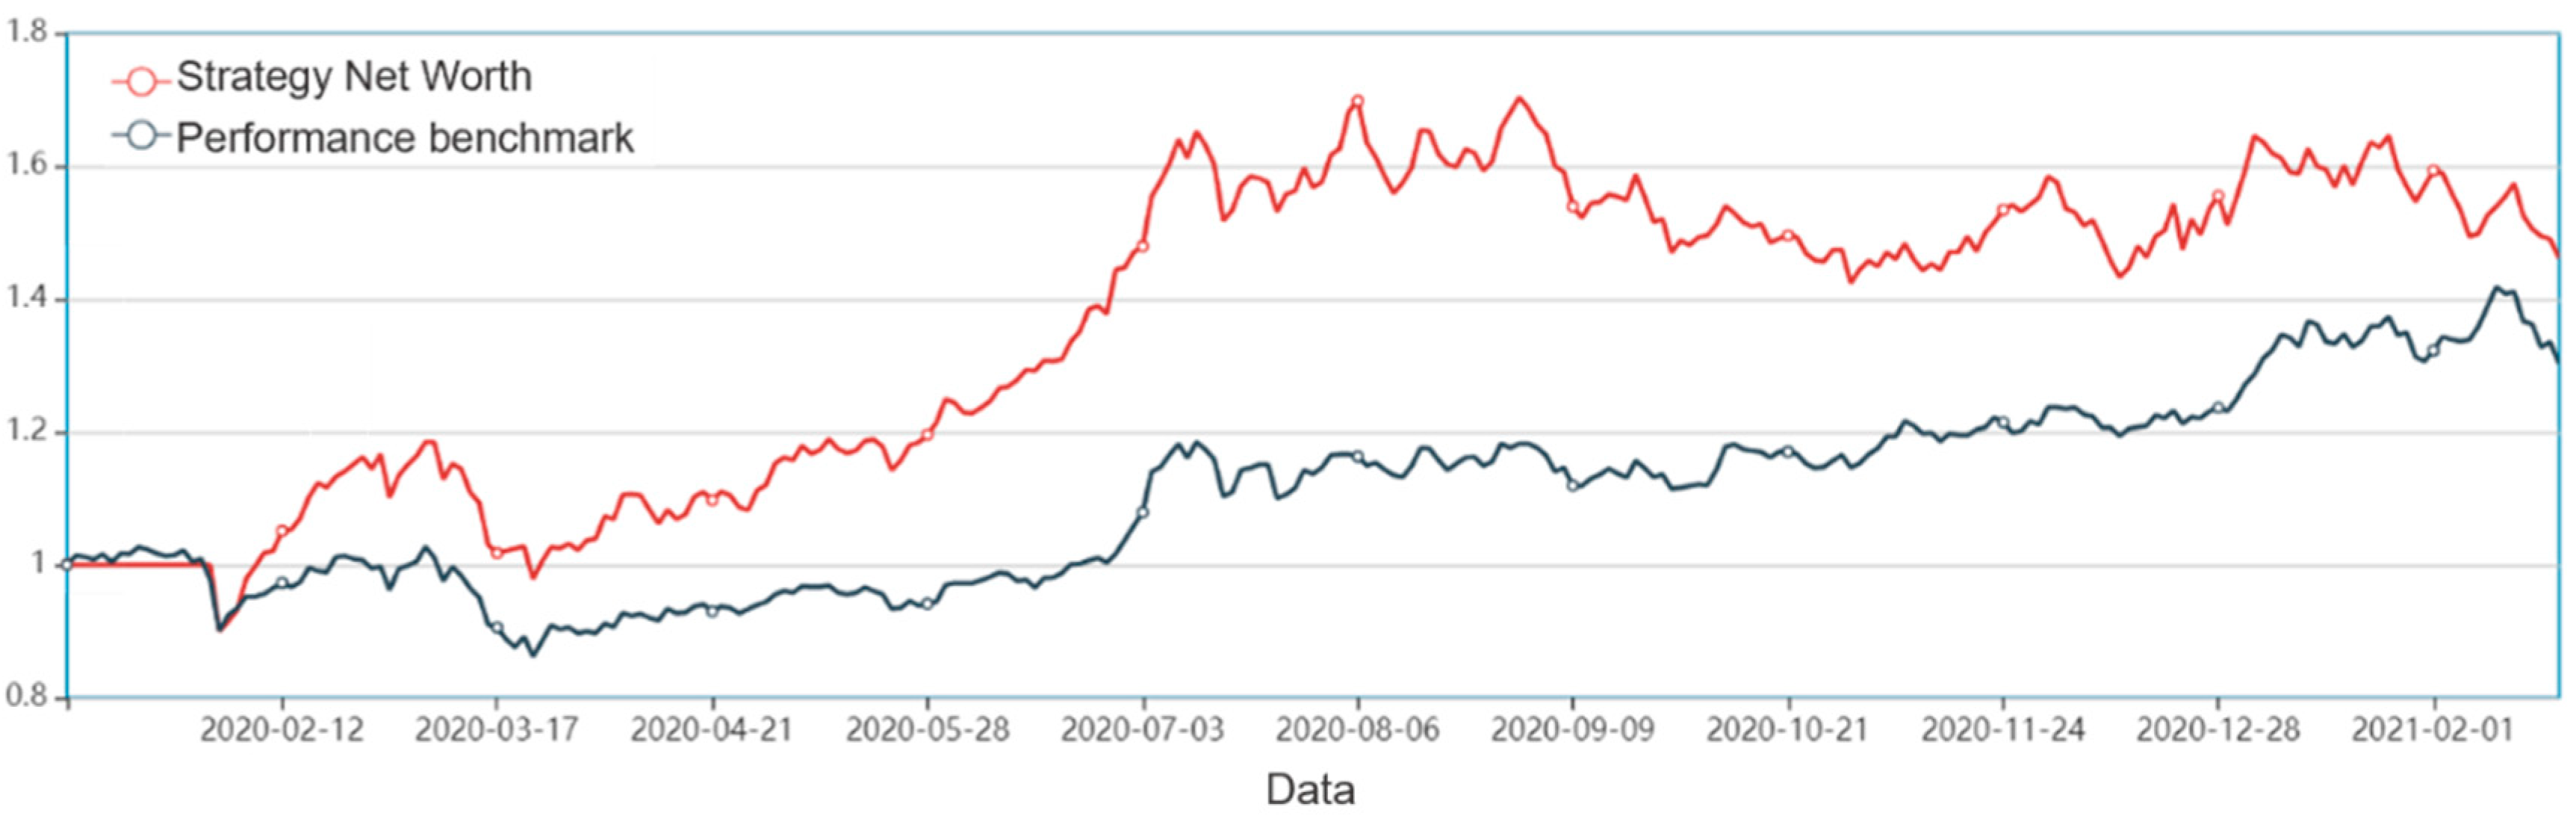
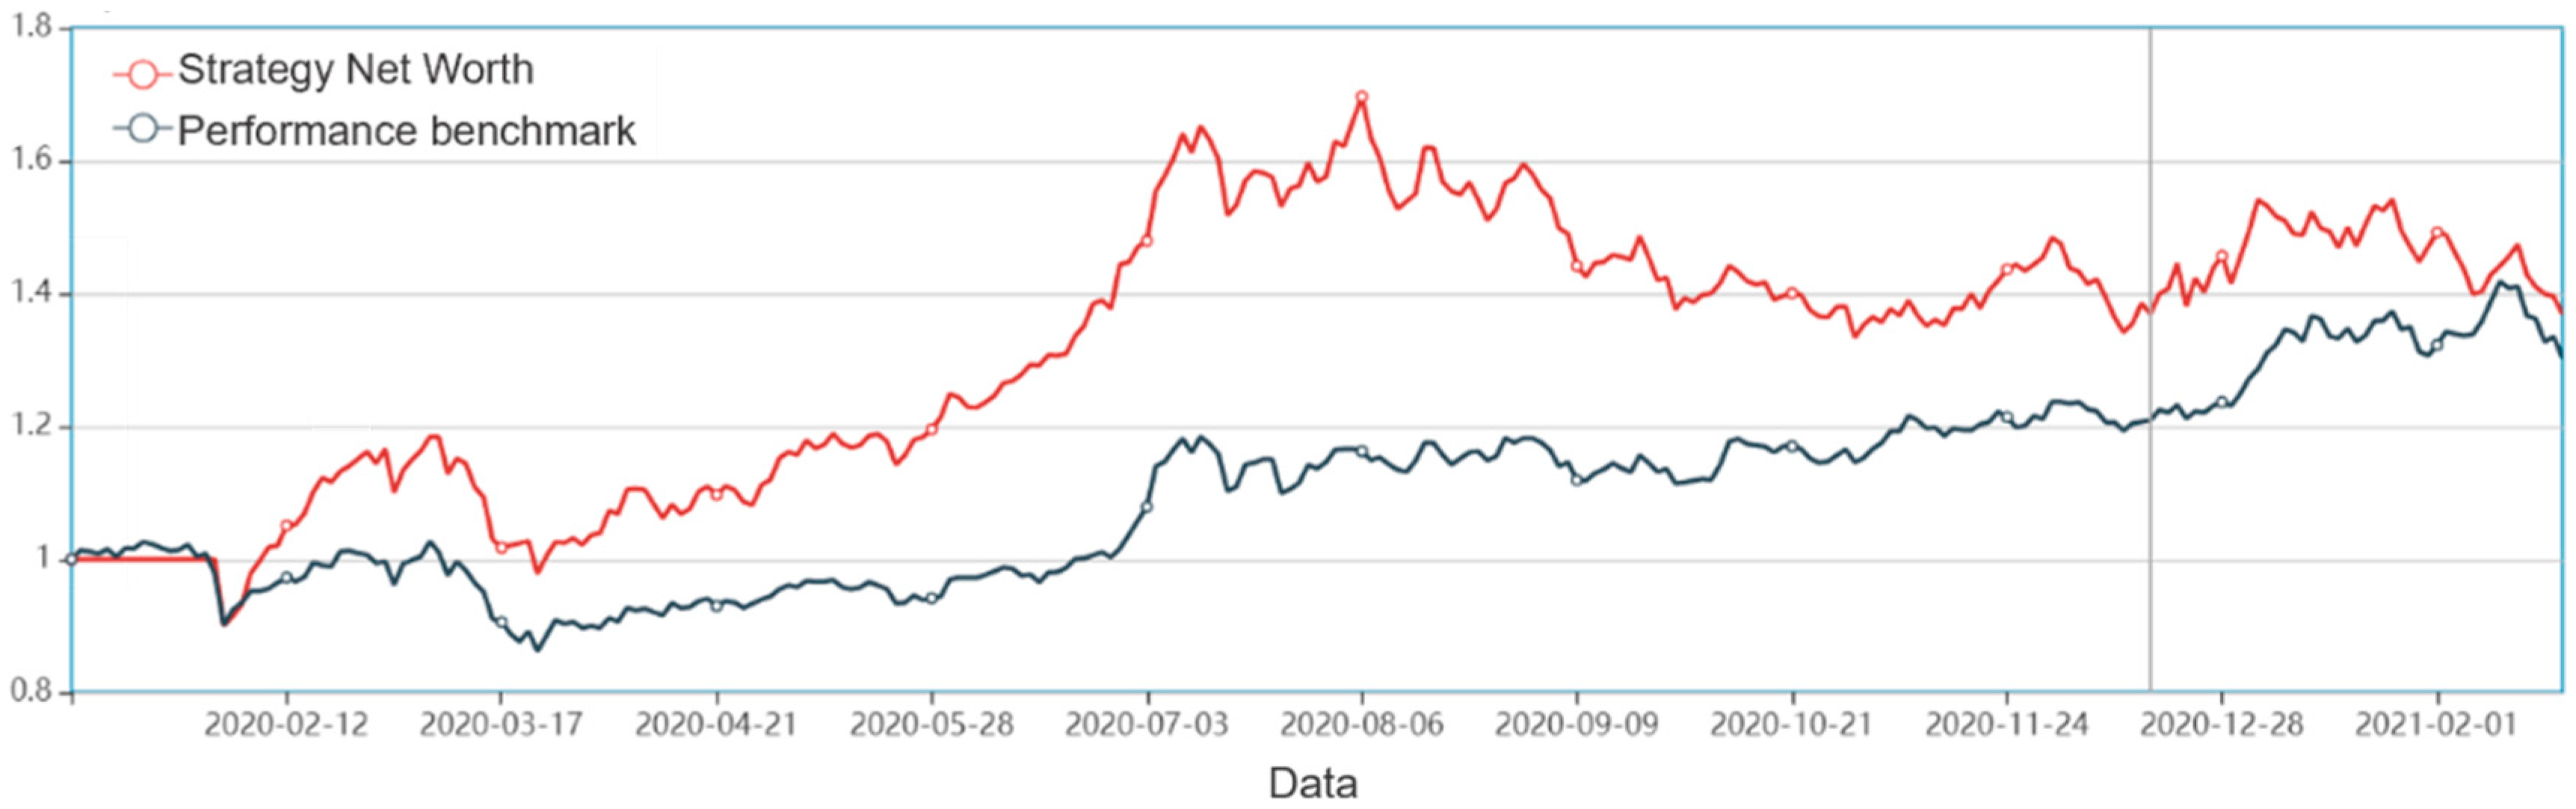
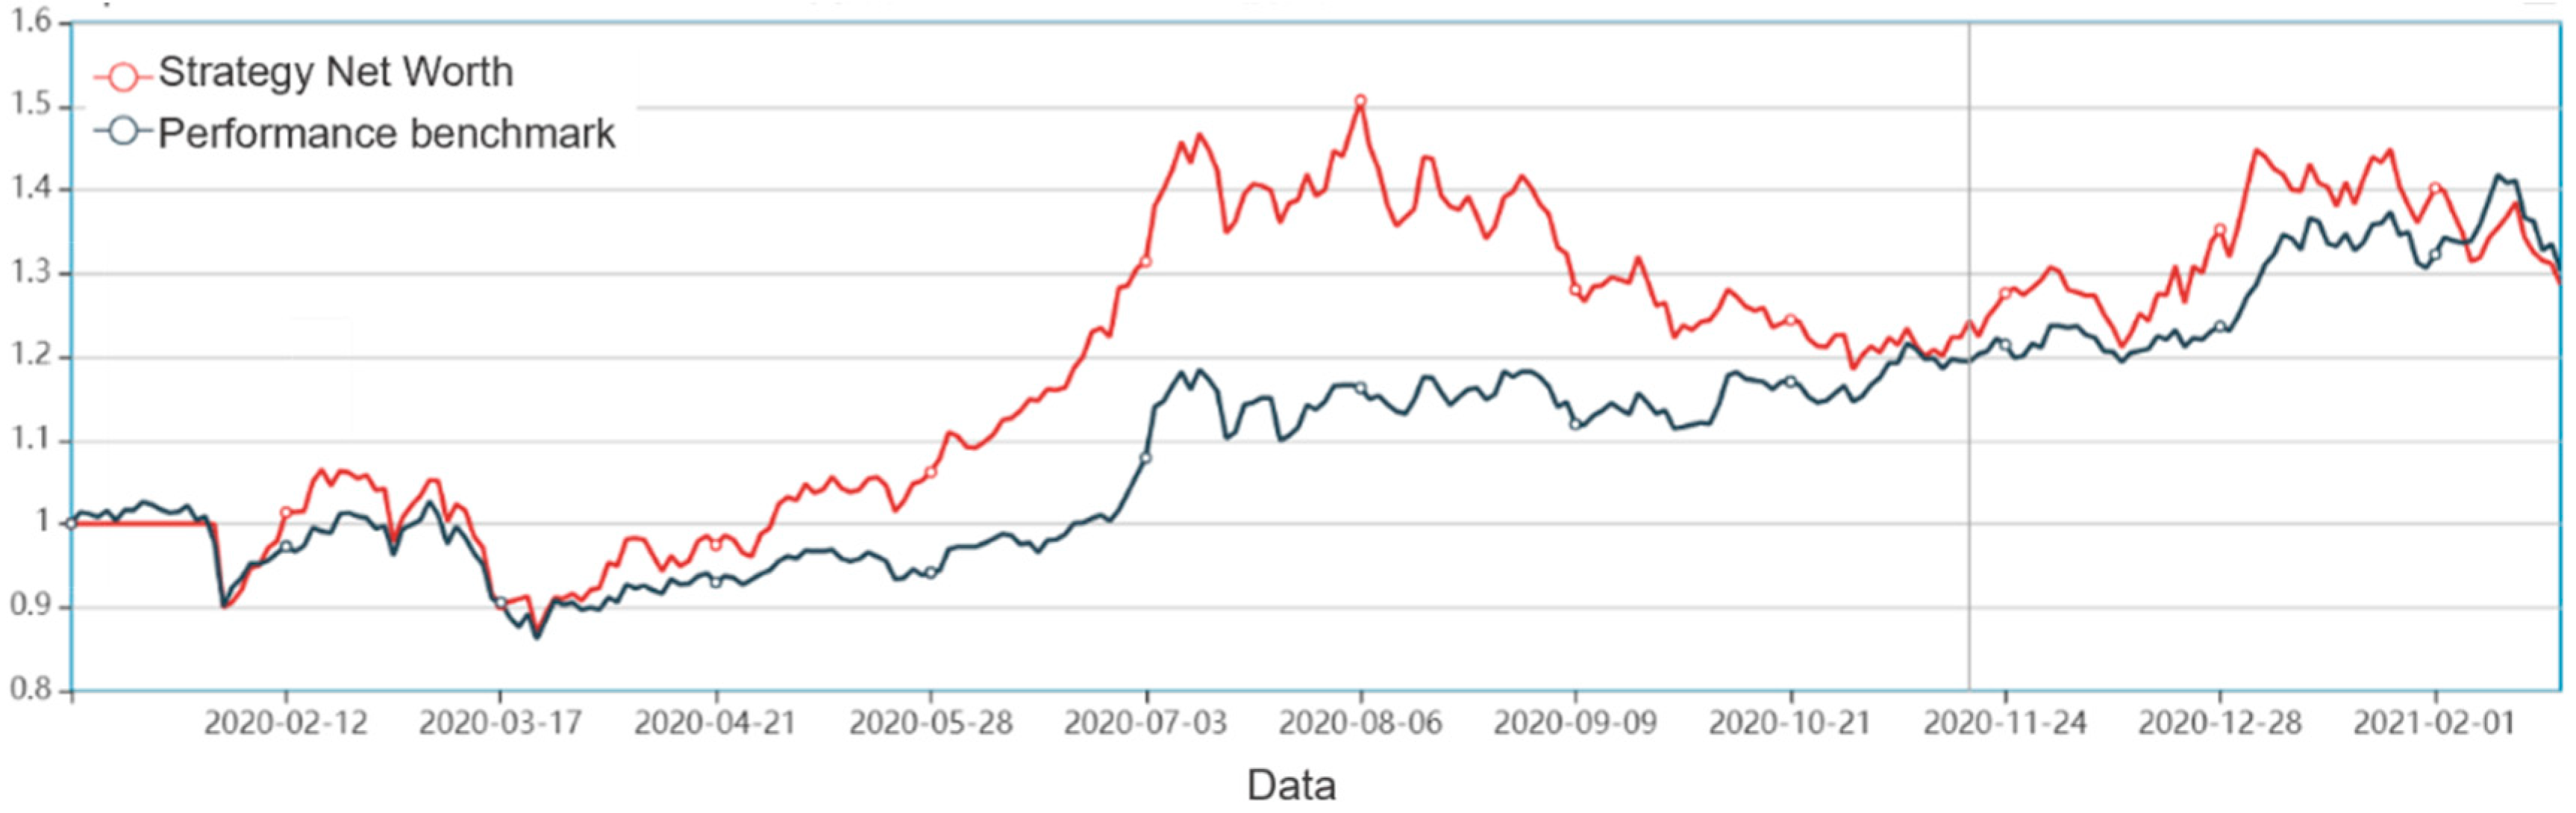
Thirdly, this paper designs and implements a quantitative trading strategy. Based on the CS-GRU stock selection model, this paper designs and implements a quantitative trading strategy. The sharp ratio of 127.08%, the annualized rate of return 40.66%, the Alpha excess return of 13.13%, and the maximum drawdown rate of −17.38% of the back test results show that the CS-GRU-based multi-factor stock selection model proposed in this article is effective for the Chinese stock market. Trading strategy research is very meaningful.
In the future, we can expand the work from the following aspects to enhance the performance of the proposed model: (1) Some social media text data can be deeply mined to further improve the ability of the model to select stocks. (2) The number of hidden layers, activation function type, learning rate and other parameters of the GRU neural network can be further optimized.

Author Contributions

J.W., Z.Z. and L.F.: conceived of the presented idea, developed the theory and performed the computations, discussed the results, wrote the paper and approved the final manuscript. All authors have read and agreed to the published version of the manuscript.

Funding

This research was supported by the National Natural Science Foundation of China (Grant No. 71971122 and 71501101).

Institutional Review Board Statement

Not applicable.

Informed Consent Statement

Not applicable.

Data Availability Statement

Not applicable.

Conflicts of Interest

The authors declare no conflict of interest.

References

  1. Zhang, H.; Shen, H.L.; Liu, Y.C. The Study on Multi-factor Quantitative Stock Selection Based on Self-attention Neural Network. J. Appl. Stat. Manag. 2020, 39, 556–570. [Google Scholar]
  2. Sun, X.L.; Hao, J.; Li, J.P. Multi-objective optimization of crude oil supply portfolio based on interval prediction data. Ann. Oper. Res. 2020, 309, 611–639. [Google Scholar] [CrossRef]
  3. Feng, Q.Q.; Sun, X.L.; Hao, J.; Li, J.P. Predictability dynamics of multifactor-influenced installed capacity: A perspective of country clustering. Energy 2021, 214, 118831. [Google Scholar] [CrossRef]
  4. Zhu, X.Q.; Ao, X.; Qin, Z.D.; Chang, Y.P.; Liu, Y.; He, Q.; Li, J.P. Intelligent financial fraud detection practices in post-pandemic era. Innovation 2021, 2, 100176. [Google Scholar] [CrossRef] [PubMed]
  5. Zhang, D.; Wei, J.B. Emotion-Driven Data Analysis of Mainstream Media Epidemic Information and Discourse Guidance Strategies. Libr. Inf. Serv. 2021, 65, 101–108. [Google Scholar]
  6. Chen, Y.; Hao, Y. A novel framework for stock trading signals forecasting. Soft Comput. 2020, 24, 12111–12130. [Google Scholar] [CrossRef]
  7. Moghar, A.; Hamiche, M. Stock Market Prediction Using LSTM Recurrent Neural Network. Procedia Comput. Sci. 2020, 170, 1168–1173. [Google Scholar] [CrossRef]
  8. Markowitz, H. Portfolio Selection. J. Financ. 1952, 12, 71–91. [Google Scholar]
  9. Sharpe, W.F. Capital asset prices, a theory of market equilibrium under conditions of risk. J. Financ. 1964, 19, 425–442. [Google Scholar]
  10. Fama, E.F.; French, K.R. Common risk factors in the returns on stocks and bonds. North-Holland 1993, 33, 3–56. [Google Scholar] [CrossRef]
  11. Carhart, M.M. On persistence in mutual fund performance. J. Financ. 1997, 52, 57–82. [Google Scholar] [CrossRef]
  12. Fama, E.F.; French, K.R. A five-factor asset pricing model. J. Financ. Econ. 2015, 116, 1–22. [Google Scholar] [CrossRef] [Green Version]
  13. Wang, S.Y.; Cao, Z.F.; Chen, M.Z. Research on Application of Random Forests in the Quantitative Stock Selection Model. Oper. Res. Manag. Sci. 2016, 25, 163–168. [Google Scholar]
  14. Shang, Y. Relationship Between Ownership, Investor Sentiment and Managerial Investment Behavior. Res. Econ. Manag. 2019, 40, 135–144. [Google Scholar]
  15. Li, J.P.; Hao, J.; Sun, X.L.; Feng, Q.Q. Forecasting China’s sovereign CDS with a decomposition reconstruction strategy. Appl. Soft Comput. 2021, 105, 107291. [Google Scholar] [CrossRef]
  16. Li, J.P.; Li, G.W.; Liu, M.X.; Zhu, X.; Wei, L. A novel text-based framework for forecasting agricultural futures using massive online news headlines. Int. J. Forecast. 2022, 38, 35–50. [Google Scholar] [CrossRef]
  17. Ouyang, H.B.; Huang, K.; Yan, H.J. Prediction of Financial Time Series Based on LSTM Neural Network. Chin. J. Manag. Sci. 2020, 28, 27–35. [Google Scholar]
  18. Yang, C.H.; Shao, Z.; Liu, C.; Fu, C. A Hybrid Modeling Framework and Its Application for Exchange Traded Fund Options Pricing. Chin. J. Manag. Sci. 2020, 28, 44–53. [Google Scholar]
  19. Hu, N.; Xue, F.J.; Wang, H.N. Does Managerial Myopia Affect Long-term Investment? Based on Text Analysis and Machine Learning. Popul. Res. 2021, 37, 139–156. [Google Scholar]
  20. Li, J.P.; Hao, J.; Feng, Q.Q.; Sun, X.L.; Liu, M.X. Optimal selection of ensemble strategies of time series forecasting with multi-objective programming. Expert Syst. Appl. 2021, 166, 114091. [Google Scholar] [CrossRef]
  21. Rasekhschaffe, K.C.; Jones, R.C. Machine learning for stock selection. Financ. Anal. J. 2019, 75, 70–88. [Google Scholar] [CrossRef]
  22. Deng, J. GBDT Multi-Factor Stock Selection Model Based on Factor Deviation Degree. Softw. Guide 2021, 20, 109–112. [Google Scholar]
  23. Luo, Z.N. Stacking Quantitative Stock Selection Strategy Research Based on Integrated Tree Model. China Price 2021, 2, 81–84. [Google Scholar]
  24. Bustos, O.; Pomares-Quimbaya, A. Stock market movement forecast, A Systematic review. Expert Syst. Appl. 2020, 156, 113464. [Google Scholar] [CrossRef]
  25. Fang, Y.; Chen, J.; Xue, Z. Research on quantitative investment strategies based on deep learning. Algorithms 2019, 12, 35. [Google Scholar] [CrossRef] [Green Version]
  26. He, Y.Y.; Li, P.; Han, J.B. Research on Prediction Modeling on Stock Market Index Based on CEEMDAN-LSTM. Stat. Inf. Forum 2020, 35, 34–45. [Google Scholar]
  27. Liu, M.; Luo, K.; Zhang, J.; Chen, S. A stock selection algorithm hybridizing grey wolf optimizer and support vector regression. Expert Syst. Appl. 2021, 179, 115078. [Google Scholar] [CrossRef]
  28. Zhang, R.; Huang, C.; Zhang, W.; Chen, S. Multi factor stock selection model based on LSTM. Int. J. Econ. Financ. 2018, 10, 1–36. [Google Scholar] [CrossRef]
  29. Sun, D.C.; Bi, X.C. High-frequency trading strategies based on deep learning algorithms and their profitability. J. Univ. Sci. Technol. China 2018, 48, 923–932. [Google Scholar]
  30. Fischer, T.; Krauss, C. Deep learning with long short-term memory networks for financial market predictions. Eur. J. Oper. Res. 2018, 270, 654–669. [Google Scholar] [CrossRef] [Green Version]
  31. Zhao, J.; Zeng, D.; Liang, S.; Kang, H.; Liu, Q. Prediction model for stock price trend based on recurrent neural network. J. Ambient. Intell. Humaniz. Comput. 2021, 12, 745–753. [Google Scholar] [CrossRef]
  32. Yadav, A.; Jha, C.; Sharan, A. Optimizing LSTM for time series prediction in Indian stock market. Procedia Comput. Sci. 2020, 167, 2091–2100. [Google Scholar] [CrossRef]
  33. Zhang, S.; Chen, Y.; Xiao, J.; Zhang, W.; Feng, R. Hybrid wind speed forecasting model based on multivariate data secondary decomposition approach and deep learning algorithm with attention mechanism. Renew. Energy 2021, 174, 688–704. [Google Scholar] [CrossRef]
  34. Chen, K.; Laghrouche, S.; Djerdir, A. Health state prognostic of fuel cell based on wavelet neural network and cuckoo search algorithm. ISA Trans. 2021, 113, 175–184. [Google Scholar] [CrossRef]
  35. Zhu, H.L.; Li, G.P. Image segmentation algorithm based on improved cuckoo search algorithm. Comput. Eng. Des. 2018, 39, 1428–1432. [Google Scholar]
  36. Saari, J.; Martinez, C.M.; Kaikko, J.; Sermyagina, E.; Mankonen, A.; Vakkilainen, E. Techno-economic optimization of a district heat condenser in a small cogeneration plant with a novel greedy cuckoo search. Energy 2022, 239, 122622. [Google Scholar] [CrossRef]
  37. Bajaj, A.; Sangwan, O.P. Discrete cuckoo search algorithms for test case prioritization. Appl. Soft Comput. 2021, 110, 107584. [Google Scholar] [CrossRef]
  38. Yang, X.S.; Deb, S. Cuckoo search via Lévy flights. In Proceedings of the 2009 World Congress on Nature & Biologically Inspired Computing (NaBIC), Coimbatore, India, 9–11 December 2009; pp. 210–214. [Google Scholar]
  39. Cuong-Le, T.; Minh, H.L.; Khatir, S.; Wahab, M.A.; Tran, M.T.; Mirjalili, S. A novel version of Cuckoo search algorithm for solving optimization problems. Expert Syst. Appl. 2021, 186, 115669. [Google Scholar] [CrossRef]
  40. Liu, J.X.; Chen, S.C. Non-Stationary Multivariate Time Series Prediction with MIX Gated Uint. J. Comput. Res. Dev. 2019, 56, 1642–1651. [Google Scholar]
  41. Berradi, Z.; Lazaar, M. Integration of principal component analysis and recurrent neural network to forecast the stock price of casablanca stock exchange. Procedia Comput. Sci. 2019, 148, 55–61. [Google Scholar] [CrossRef]
  42. Hewamalage, H.; Bergmeir, C.; Bandara, K. Recurrent neural networks for time series forecasting: Current status and future directions. Int. J. Forecast. 2021, 37, 388–427. [Google Scholar] [CrossRef]
  43. Wei, D.X.; Wang, J.Z.; Niu, X.S.; Li, Z.W. Wind speed forecasting system based on gated recurrent units and convolutional spiking neural networks. Appl. Energy 2021, 292, 116842. [Google Scholar] [CrossRef]
  44. Jiang, A.B.; Wang, W.W. Research on optimization of ReLU activation function. Transducer Microsyst. Technol. 2018, 37, 50–52. [Google Scholar]
  45. Li, Q.; Xiong, Q.; Ji, S.; Yu, Y.; Wu, C.; Gao, M. Incremental semi-supervised Extreme Learning Machine for Mixed data stream classification. Expert Syst. Appl. 2021, 185, 115591. [Google Scholar] [CrossRef]
  46. Khan, A.H.; Cao, X.; Li, S.; Katsikis, V.N.; Liao, L. BAS-ADAM: An ADAM based approach to improve the performance of beetle antennae search optimizer. IEEE/CAA J. Autom. Sin. 2020, 7, 461–471. [Google Scholar] [CrossRef]
  47. Li, B.; Lin, Y.; Tang, W.X. ML-TEA: A set of quantitative investment algorithms based on machine learning and technical analysis. Syst. Eng. Theory Pract. 2017, 37, 1089–1100. [Google Scholar]
  48. Nobre, J.; Neves, R.F. Combining principal component analysis, discrete wavelet transform and XGBoost to trade in the financial markets. Expert Syst. Appl. 2019, 125, 181–194. [Google Scholar] [CrossRef]
Figure 1. Principle of the GRU neural network.
Mathematics 10 00566 g001
Figure 2. The framework of the proposed model.
Mathematics 10 00566 g002
Figure 3. Sentimental index factor value of each section period.
Mathematics 10 00566 g003
Figure 4. Parameter optimization process.
Mathematics 10 00566 g004
Figure 5. Confusion matrix of classification results of the CS-GRU stock selection model.
Mathematics 10 00566 g005
Figure 6. Trading strategy back test process of multi-factor stock selection model based on CS-GRU.
Mathematics 10 00566 g006
Figure 7. Confusion matrix of the classification results of the RNN stock selection model.
Mathematics 10 00566 g007
Figure 8. Confusion matrix of the classification results of the SVM stock selection model.
Mathematics 10 00566 g008
Figure 9. Back testing process of trading strategy based on RNN stock selection model.
Mathematics 10 00566 g009
Figure 10. Back testing process of trading strategy based on SVM stock selection model.
Mathematics 10 00566 g010
Table 1. Summary of financial index factors.
Factor NameFactor AbbreviationFactor Description
Circulation market valueCMCclosing price of individual shares * number of circulating shares of individual shares
P/E ratioPE(closing price of individual shares on the specified trading date * total share capital of the company as of that day)/net profit attributable to shareholders of the parent company
Price to book ratioPB (closing price of individual shares on the specified trading date * total share capital of the company as of that day)/equity attributable to shareholders of the parent company
Price to sales ratioPS(closing price of individual shares on the specified trading date * total share capital of the company as of that day)/total operating revenue
Increase rate of business revenue annulusIRA((current operating income value—previous operating income value)/previous operating income value) * 100%
Increase rate of net profit attributable to shareholders of the parent company annulusINPTSA((net profit attributable to shareholders of the parent company in the current period—net profit attributable to shareholders of the parent company in the previous period)/net profit attributable to shareholders of the parent company in the previous period) * 100%
Increase rate of net profit annulusINPA((net profit value of the current period—net profit value of the previous period)/net profit value of the previous period) * 100%
Return on equityROE(net profit attributable to shareholders of the parent company * 2)/(net assets attributable to shareholders of the parent company at the beginning of the period and net assets attributable to shareholders of the parent company at the end of the period)
Return on assetsROA(net profit * 2)/(total assets at the beginning and total assets at the end of the period)
Net profit margin on salesNPRnet profit/operating income
Earnings per shareEPSnet profit/closing share capital
Retained earnings per shareRPPSretained profit/closing share capital
Net asset value per shareNAPSnet assets/closing share capital attributable to shareholders of the parent company
Capital reserve per shareCRFPScapital reserve/closing share capital
Net cash flow per shareCPSnet cash flow/ending equity
Quick ratioQR(total current assets—inventory)/total current liabilities
Table 2. Summary of technical index factors.
Factor NameFactor AbbreviationFactor Description
20 day annualized return varianceV20Variance of annualized returns of individual stocks in the last 20 days
20 day return kurtosisK2020 day kurtosis of individual stock returns
10 day average turnover rateVOL10Average turnover rate of individual stocks in the last 10 days
Moving average of 12 day trading volumeVEMA12Moving average of 12 day trading volume of individual stocks
Standard deviation of 20 day trading volumeVSTD20Standard deviation of trading volume of individual stocks in the last 20 days
Buying and selling momentum rateAR(sum of 26 days (highest price of the day—opening price of the day)/sum of 26 days (opening price of the day—lowest price of the day) * 100%
Willingness to buy rateBR(sum of 26 days (the highest price of the day - yesterday’s closing price)/sum of 26 days (yesterday’s closing price—the lowest price of the day) * 100%
Arron upAU((calculation period days—days after the highest price)/calculation period days) * 100%
Arron downAD((calculation period days—days after the lowest price)/calculation period days) * 100%
Table 3. Confusion matrix for the two-classification problem.
Forecasting Value
RiseFall
True ValueRise T P F N
Fall F P T N
Table 4. Classification results of CS-GRU stock selection model.
AccuracyRecallPrecisionF Metric
CS-GRU stock selection model94.89%97.92%92.38%95.07%
Table 5. Back test results of trading strategy based on the CS-GRU stock selection model.
Sharpe Ratio r p AlphaMax Drawdown
Trading strategies based on the CS-GRU stock selection model127.08%40.66%13.13%−17.38%
Table 6. Comparison results of stock classification.
AccuracyRecallPrecisionF metric
CS-GRU stock selection model94.89%97.92%92.38%95.07%
RNN stock selection model91.31%93.84%89.42%91.58%
SVM stock selection model83.30%86.42%81.53%83.90%
Table 7. Comparison results of strategy back testing.
Sharpe Ratio r p α Max Drawdown
Trading strategies based on the CS-GRU stock selection model127.08%40.66%13.13%−17.38%
Trading strategies based on the RNN stock selection model98.84%32.61%4.90%−21.37%
Trading strategies based on the SVM stock selection model75.79%25.39%−2.18%−21.37%
Publisher’s Note: MDPI stays neutral with regard to jurisdictional claims in published maps and institutional affiliations.

