1. Introduction
In the early days of nuclear reactors, nuclear power plants (NPPs) were mainly used for military purposes. As a result of the industry’s continuous development and progress, NPPs began to be used primarily for nuclear power generation. However, following the widespread establishment and use of NPPs, nuclear accidents have highlighted the dangers of nuclear reactors. After the Chernobyl nuclear accident, people began to pay attention to nuclear safety and study the safety issues associated with nuclear reactors. In addition, issues such as waste and the economy also affect social and environmental acceptability [
1]. For nuclear energy, promoting strengths and avoiding weaknesses has become a problem to be considered.
At present, the pressurized water reactor (PWR) is the most competitive reactor used in NPPs, and accounts for the largest proportion. The core system of the PWR is the main coolant system (MCS), also known as the primary loop system. It is composed of two to four identical cooling loops according to its capacity. Its main functions include transferring energy and cooling the core. In addition, because the water in the primary circuit is closed and the heat exchange is carried out through the heat transfer of the tube wall, the MCS can also prevent the leakage of radioactive materials. On 28 March 1979, a serious nuclear leakage occurred at the Three Mile Island nuclear power station in the United States, namely the Three Mile Island nuclear accident. At the time, the MCS was not functioning due to human errors. This accident resulted in serious consequences, and the clean-up cost of reactor two alone reached USD 1 billion [
2].
Due to the setting of redundant components, failure of some components may not cause the failure of the whole MCS, but some degradation in the system performance. In addition, failed components may have a negative effect on the components to which they are connected, possibly leading to cascading effects with more serious consequences. At this time, maintenance is essential for managing system reliability, preventing system failures, and improving the effectiveness of system operations [
3]. Therefore, this paper considers the preventive maintenance of the remaining operational components while maintaining the failed components, to restore the system performance to a great extent. By combining resilience with importance measures, the recovery process of the MCS after an accident can be better guided. Specifically, in this paper, the resilience of the MCS is represented by the loss and recovery of system performance. The loss importance measure (LIM) is proposed to indicate the maintenance priority of the MCS components under different failure conditions. Considering the limited maintenance cost, we determined the preventive maintenance components set to maximize the system performance. Then, the resilience importance measures (RIMs) for single component failure and multiple component failures were used to evaluate the recovery efficiency of the MCS.
The rest of this paper is organized as follows.
Section 2 presents some relevant works.
Section 3 introduces the MCS of a nuclear reactor and presents the problem descriptions.
Section 4 presents the component maintenance priority and proposes the resilience measure of the MCS.
Section 5 uses a case study to illustrate the proposed method. Finally,
Section 6 presents the conclusions.
2. Relevant Work
System resilience is the ability of a system to respond and recover quickly from an external disruptive event. In recent years, studies have been undertaken to analyze system resilience. Panteli and Mancarella [
4] introduced a new sequential Monte-Carlo-based time-series simulation model to assess the resilience of power systems. Mao et al. [
5] developed two metrics, including the resilience of cumulative performance loss and the resilience of restoration rapidity, to measure the resilience of the supply chain networks. Ali et al. [
6] proposed an approach that considers the resilient behavior of collaborative Cyber-Physical systems to achieve the fail-operational goal in autonomous platooning systems. Zarei et al. [
7] developed a fuzzy hybrid multi-criteria decision-making model for quantifying resilience. Hajializadeh and Imani [
8] presented a new framework for building a resilience and vulnerability-informed decision support system. Kim et al. [
9] established a resilience assessment model by quantifying the relationship between resilience and resilience components in the recovery from emergency accidents in NPPs. Combining the Markov model with dynamic Bayesian networks, Cai et al. [
10] developed a novel evaluation methodology for resilience evaluation under the influence of various external disasters. Zeng et al. [
11] developed a non-homogeneous semi-Markov reward process model for resilience analysis of multi-state systems.
The above research on system resilience shows that there is no unanimous measurement standard and method for the concept of system resilience. The study of the resilience of the MCS should focus on restoring the system to normal operation to the greatest extent as soon as possible, that is, determining how to quickly improve the efficiency recovery of the MCS, to avoid more serious consequences.
For the study of reactor reliability, Mullor et al. [
12] described a general method for optimal reliability and imperfect maintenance activities of repairable equipment. The proposed procedure was illustrated using a real data example of an NPP. Rejc and Cepin [
13] proposed an advanced method for common cause failure modeling and estimation, allowing more detailed reliability analyses. Ma et al. [
14] investigated the reliability analysis and maintenance optimization approaches of two-unit warm standby cooling equipment. He et al. [
15] used the methodology to assess the reliability of squib valves in pressurized water NPPs. Hu and Peng [
16] developed a dynamic reliability model with random and dependent transition probabilities for a non-repairable discrete-time multi-state system. Mamdikar et al. [
17] devised a reliability analysis framework validated with 32 safety-critical system instances of the NPP. Wakankar et al. [
18] proposed an architecture model to quantitatively evaluate the reliability of the large reactor safety system. Tripathi et al. [
19] used the dynamic flowgraph methodology to study the NPP and analyze its reliability. Most research regarding the reactor relates to its reliability evaluation and analysis, and the different costs of the MCS are not considered.
Importance measures can quantitatively describe the importance of each component of the system, which is valuable for design and failure analysis. In recent years, increasing research has been conducted on the importance theory [
20,
21,
22]. For example, Xu et al. [
23] proposed a new component importance measure for multi-state networks based on resilience from the perspective of the post-disaster recovery process. Chybowska et al. [
24] developed methods for evaluating the importance of events during disasters. Fu et al. [
25] proposed a new time-dependent importance measure for degrading components to address the component reassignment problem of degrading components. Fang et al. [
26] used importance measure methods in the complex project risk management field and established priorities for further decision making. Kala [
27] presented a new importance measure in a reliability-oriented global sensitivity analysis. Dui et al. [
28] proposed a joint importance to identify components or component groups that can be used for preventive maintenance. Dui et al. [
29] proposed a resilience importance measure to quantify the contribution of a component to the loss of system performance.
The main concerns of NPPs relate to their high cost, uncertainty, and severe aftermath of accidents. However, the above studies did not focus on these issues. In addition, when some components of the MCS fail, there is a lack of an appropriate importance measure to reflect the change in the maintenance priority of other components so as to guide the recovery process of the system. In order to prevent further escalation of the accident, determining how to quickly recover the system performance in the case of component failure has become a crucial issue to be considered. In the process of recovery, the quantitative expression of the resilience of the MCS is an open and challenging question.
In this paper, we address these questions by proposing a loss importance measure (LIM) that can indicate the maintenance priority of the MCS components under different failure conditions, in addition to resilience importance measures (RIMs) for single component failure and multiple component failures that can be used to evaluate the recovery efficiency of the MCS.
3. MCS and Problem Descriptions
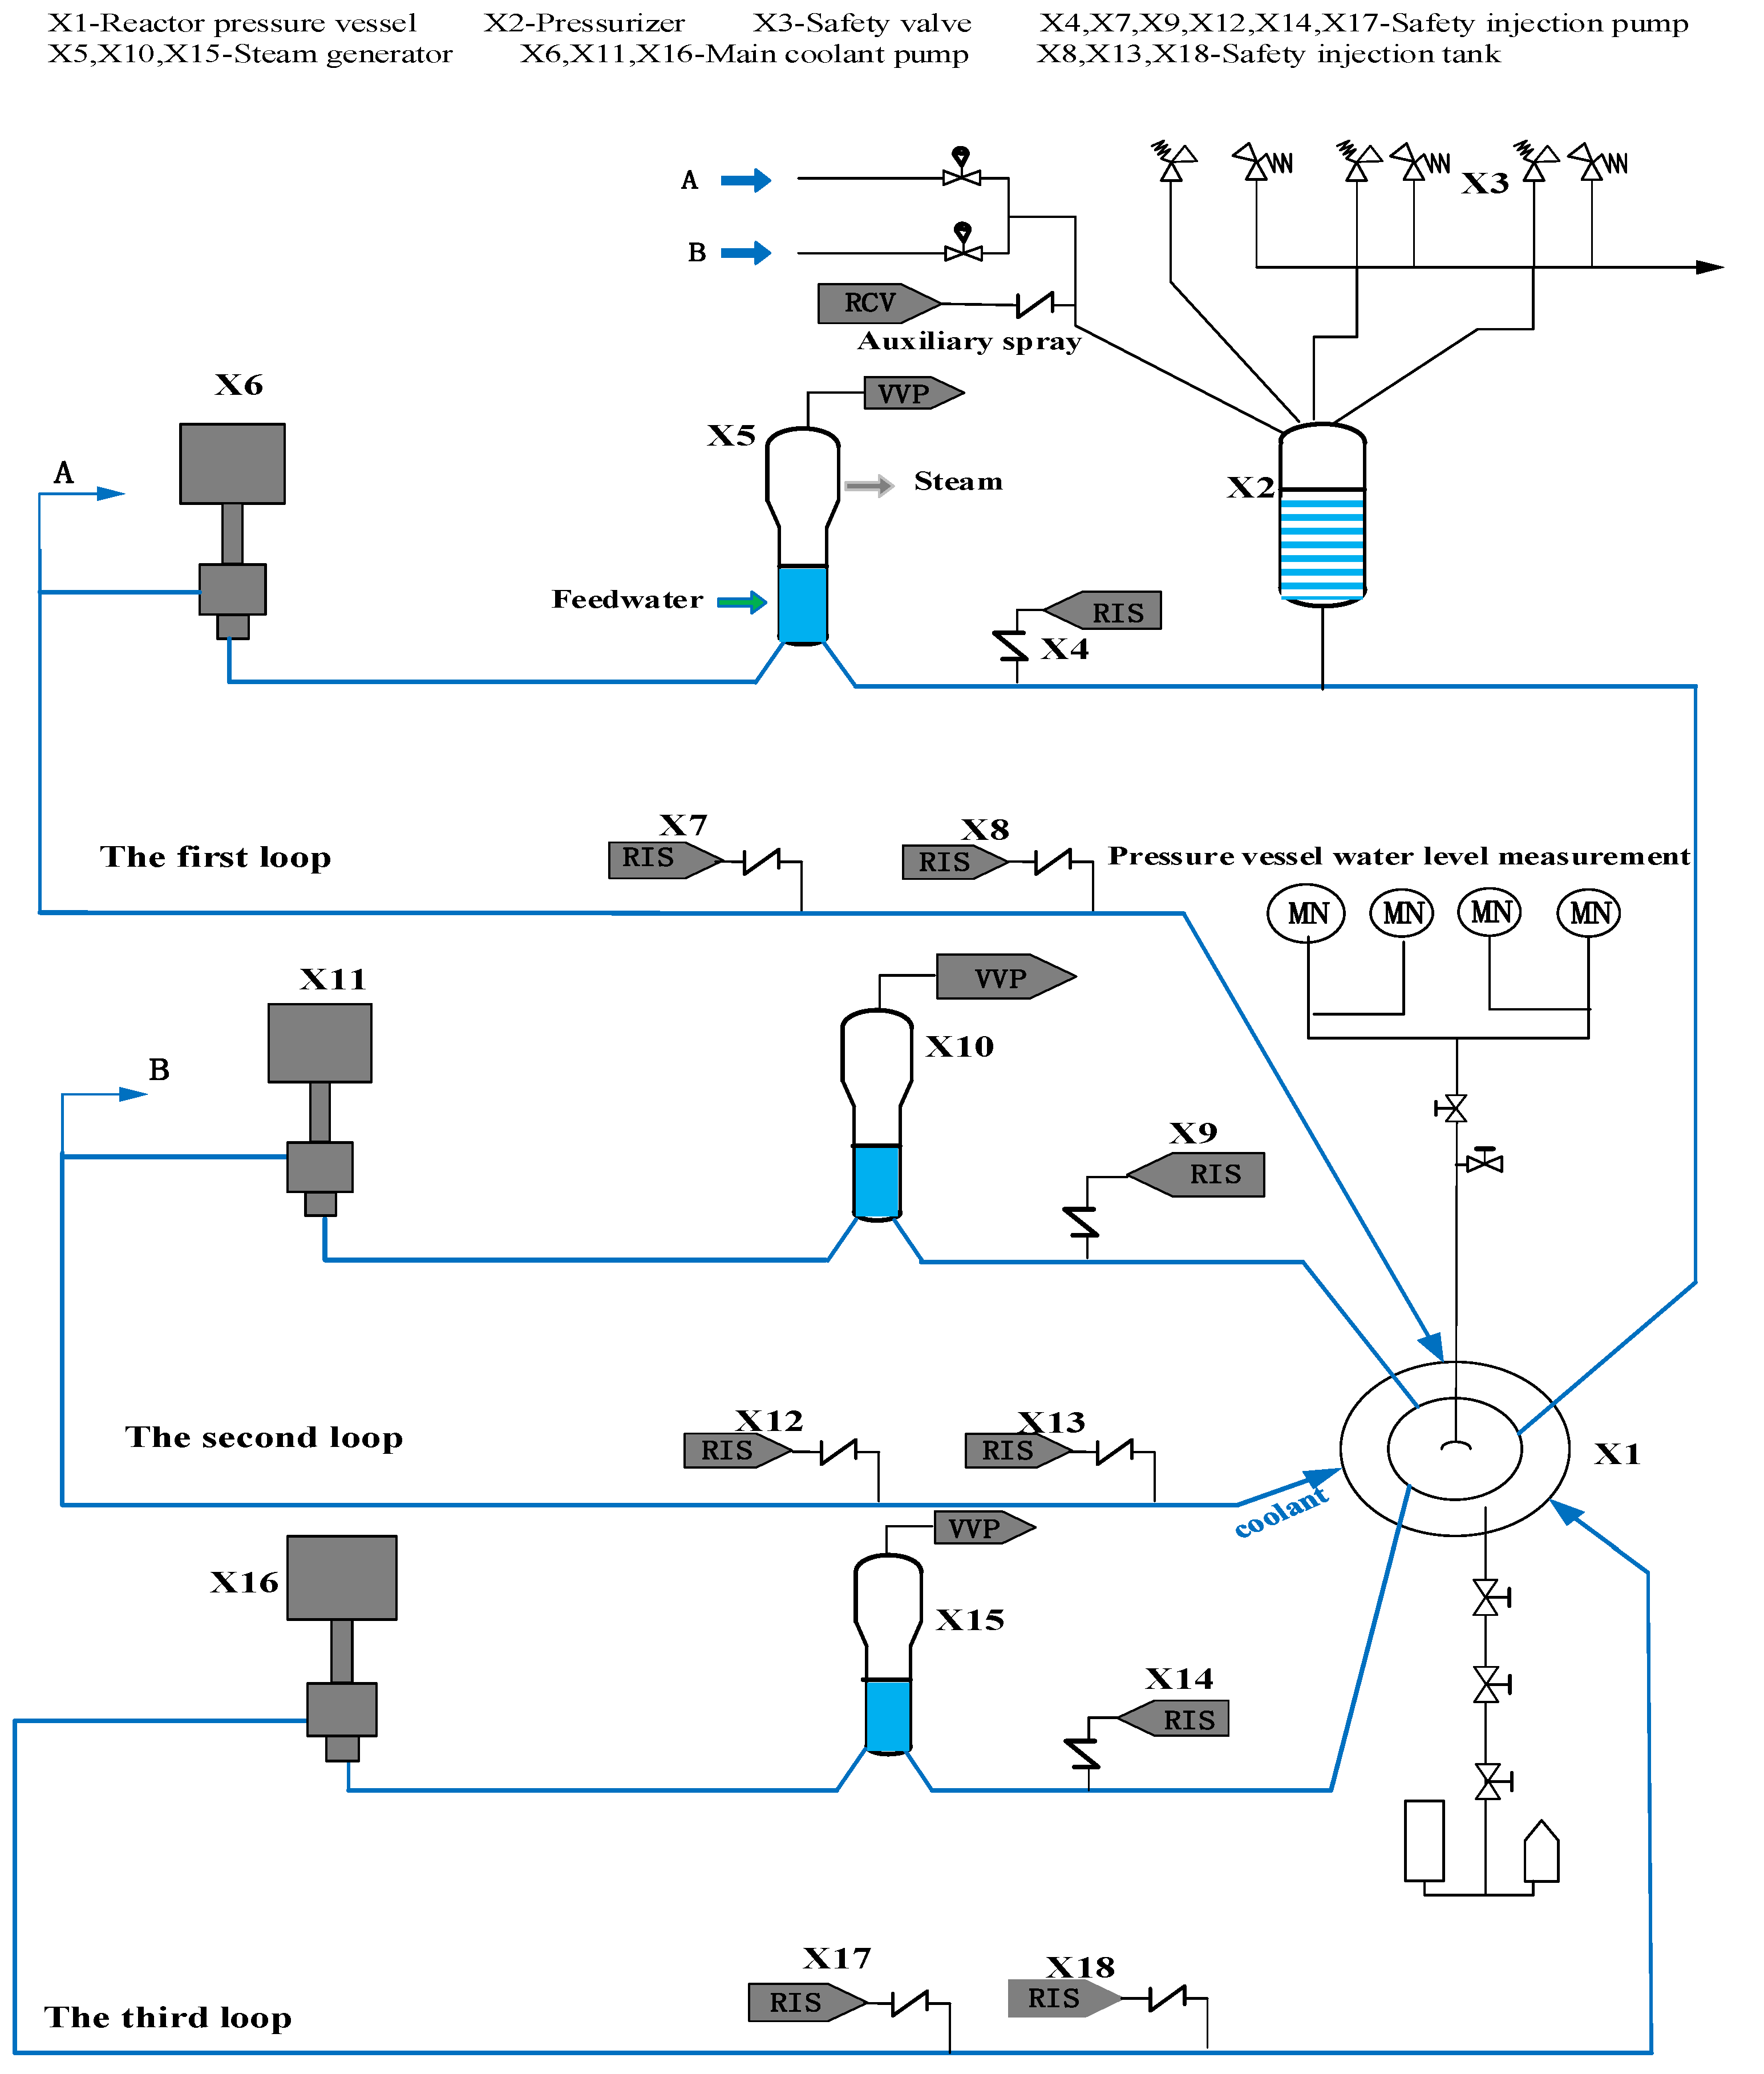
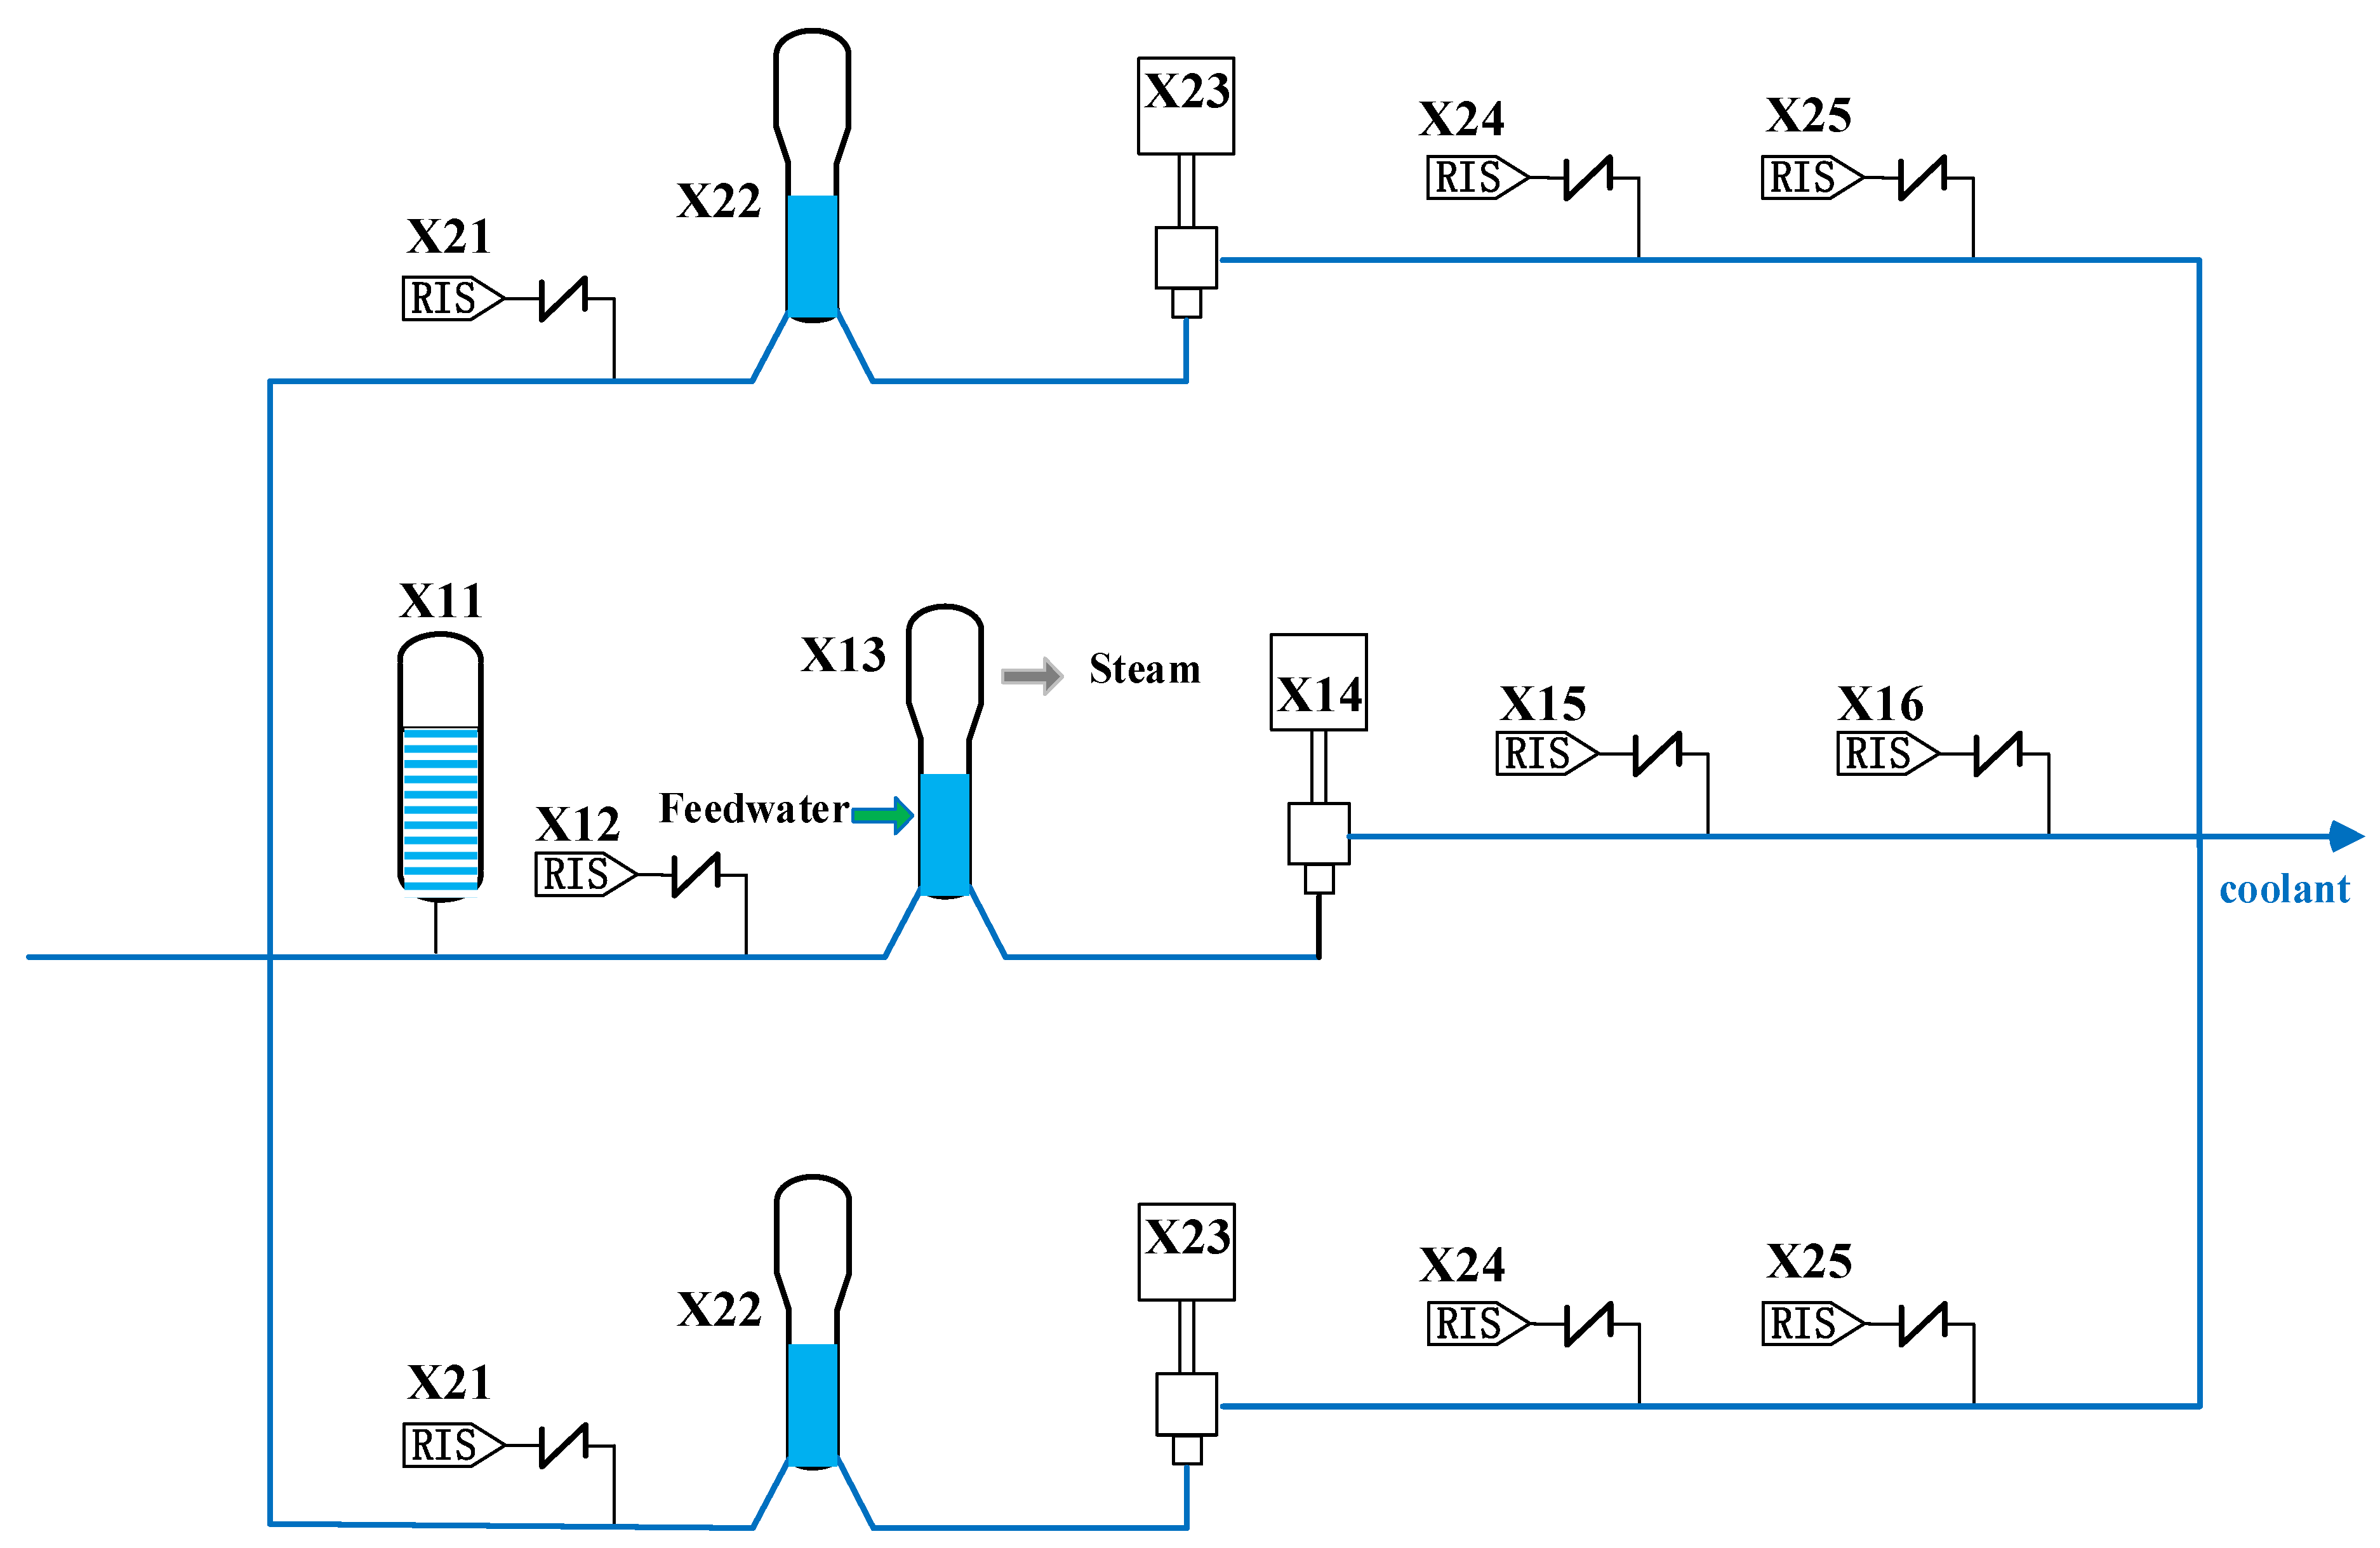
This section analyzes the working principle and system structure of the reactor MCS, and describes the structure and function of the main components. The schematic diagram of the reactor coolant system is shown in
Figure 1. The system consists of three similar loops. Each loop has a steam generator and a main pump connected with the reactor by the main pipe to form a closed cooling circuit. The nuclear fuel in the reactor releases much heat energy through the nuclear fission reaction. The coolant takes away the heat generated and cools the fuel assembly. Driven by the reactor coolant pump (PCR), the coolant flows into the steam generator through the pipe. The heat is transferred to the secondary circuit’s main feedwater through the U-tube’s wall heat transfer. The main feedwater is heated into steam and led into the main steam pipe, thus causing the steam turbine to generate power. A pressurizer is set in the first loop to compensate and adjust the volume and pressure of the system coolant. When the pressure is lower than a specific set value, the heater at the bottom of the pressurizer operates to heat the water in the pressurizer and generate steam, making the pressure rise. When the pressure is too high, the spray system is adjusted, and the coolant is introduced from the cold pipe of the system. The saturated steam in the pressurizer is condensed into water after being sprayed by the coolant to reduce the pressure value of the system. The pressure relief valve and safety valve are installed on the top of the pressurizer to protect the system from overpressure. When the system pressure exceeds a specific set value, the pressure relief valve and safety valve open, and part of the steam is sent to the pressure relief tank to reduce the system pressure. A safety injection pump and safety injection tank are set in each loop to form a safety injection system (RIS). When a loss of coolant accident (LOCA) occurs in the reactor coolant system (RCP) or the main steam system piping (VVP) breaks, the RIS can complete the core emergency cooling function so that the residual heat of the core can be discharged in time to ensure the integrity of the containment and limit the further development of the accident [
30].
In this paper, the main components of MCS are analyzed and studied, and their influences on the system reliability are considered. It is assumed that the failure time of each component follows the Weibull distribution
, and components of the same type have the same parameters. The scale and shape parameters of each component are shown in
Table 1.
Table 2 lists the names and codes of the main components. During the system’s working process, the steam generator and main coolant pump are in operation most of the time. According to engineering experience, they are prone to failures during the system’s service life, so they are most likely to be the vulnerable components.
In the MCS, there are three loops in the system. When a component in one of the loops fails, the other two loops are not affected by the faulty component. The whole system continues to run, but the system performance is degraded. When one component and its backups fail, the whole loop may fail. For example, when LOCA occurs and both X4 and X7 fail, the safety injection system cannot operate normally, and the whole first loop fails. The remainder of the components without backup are key components, and the failure of any key component can cause the whole system to crash. The specific problems to be solved in this paper are as follows.
As a multi-state system, different states of components will lead to different performance levels of the MCS; how can the impact of the status change in other components on the system performance, when some components of the MCS fail, be evaluated?
Under the constraints of maintenance resources, how can the combination of maintenance components to achieve the highest system performance, when one or more components of the MCS fail, be determined?
In the current competitive energy market, the nuclear industry is committed to reducing maintenance costs while maintaining safe and reliable operations. Therefore, how can the maintenance efficiency of optimal preventive maintenance policies corresponding to different total maintenance costs at a certain time be measured so as to control maintenance costs and improve recovery efficiency?
4. Component Maintenance Priority and Resilience Measure for the MCS
The failure process of the system is the superposition of the failure processes of all components. Moreover, due to the comprehensive effects of each component state, the system presents different utilities. Therefore, we consider using system performance to quantitatively represent the loss of system performance caused by component failure. We use
to represent the performance levels corresponding to the state space
of the system. It is assumed that all the components of the MCS have two states: perfect function and failure (1 and 0). The state of component
i is indicated by
; a system state represents a combination of all system component states, the state of the MCS is indicated by
, and
is the state space of all MCS components. By default,
when the MCS is at state 0 (complete failure). Thus, the performance of the system can be measured by the system utility expectation of different system states, which is expressed as:
where
is the performance level of the MCS when the system state is
j. The states and corresponding performance level parameters of the MCS are shown in
Appendix A.
4.1. LIM and Determining Component Maintenance Priority
We define the LIM in this section. LIM refers to the impact of other non-failed components on system performance when some components of MCS fail. The higher the LIM value of a component, the more the system performance will recover when the component is repaired, so the higher maintenance priority of the component. It can provide a theoretical basis for the determination of component maintenance priority.
- 1.
When component
i fails, the state of component
i becomes 0, and the system performance can be expressed as:
In this case, the LIM of component
k is expressed in the form of a partial derivative. The LIM of component
k is:
- 2.
Similarly, when multiple components fail, the system performance is:
where
is the set of failed components.
At this point, the LIM of component
k is equal to:
When each component has the same maintenance cost, the preventive maintenance priority of the components can be determined by the ranking of their importance measures. However, in practice, the limited maintenance cost constraints should be considered, and each component’s maintenance cost is often different (a component with a high importance measure may need a higher maintenance cost). Therefore, to maximize the expected system performance under cost constraints, the integer programming method can be used to determine the set of preventive maintenance components.
When a single component
i fails, the following integer programming problem needs to be solved:
where
is the set of system components,
is the maintenance cost of component
i,
is the preventive maintenance cost of component
k, and
is the decision variable indicating whether to repair component
k.
is a 0–1 variable.
represents the total maintenance cost constraint.
When multiple components fail, the following integer programming problem needs to be solved:
where
is the cost required to repair the failed components.
For the integer programming model above, the optimal solution is (for the single component failure case) and (for the multi-component failures case). Thus, the optimal component maintenance priority set is .
4.2. RIM
After determining the preventive maintenance component set based on LIM, in order to measure the recovery efficiency of preventive maintenance when one or more components fail, this section proposes the RIM based on the system resilience.
Firstly, based on Equation (1), we can obtain:
where
is the reliability of component
i,
,
n is the number of system components.
Because
and
, then we have:
where
is the Integrated importance measure of component
i. The loss of system performance per unit time when components fail is expressed as a performance loss importance measure (PLIM). The improvement of system performance per unit time in the case of component maintenance is expressed as a performance recovery importance measure (PRIM). Then the RIM of the maintenance component set is discussed in two cases.
The loss of system performance per unit time is equal to the loss of system performance caused by the failure of component
i. Based on Equation (9), PLIM of component u is obtained as follows:
where
is the Integrated importance measure of component
u.In the process of repairing the failed component u and preventively maintaining component set
, the improvement of system performance per unit time is equal to the sum of PRIM of all non-failed components in the system:
where
is the contribution of the set of preventively maintained components to system performance improvement while repairing component
u.
represents system performance after the preventive maintenance,
represents system performance before the preventive maintenance.
Based on Equations (10) and (11), we can define and evaluate the RIM of component
k as:
That, is, the RIM of component k is equal to the ratio of the sum of PRIM values of all preventively maintained components to PLIM. The larger RIM of components, the higher the recovery efficiency of system performance when they are repaired, which means that higher maintenance priority should be provided for these components for the best return in improving the system performance.
- 2.
Multiple components failures
The failed components are represented as the set
. The loss of system performance per unit time is equal to the loss of performance caused by the failure of components
to state 0. The PLIM for the set is:
Based on Equation (11), the PRIM for multi-component failure is:
Based on Equations (13) and (14), the RIM for the failed component
k is defined and evaluated as:
In addition, an illustration using the parallel-serial structure of the MCS is shown in
Appendix C to indicate the specific calculation process of the above formula.
5. Case Study
This section takes the MCS in
Figure 1 to illustrate the proposed method in
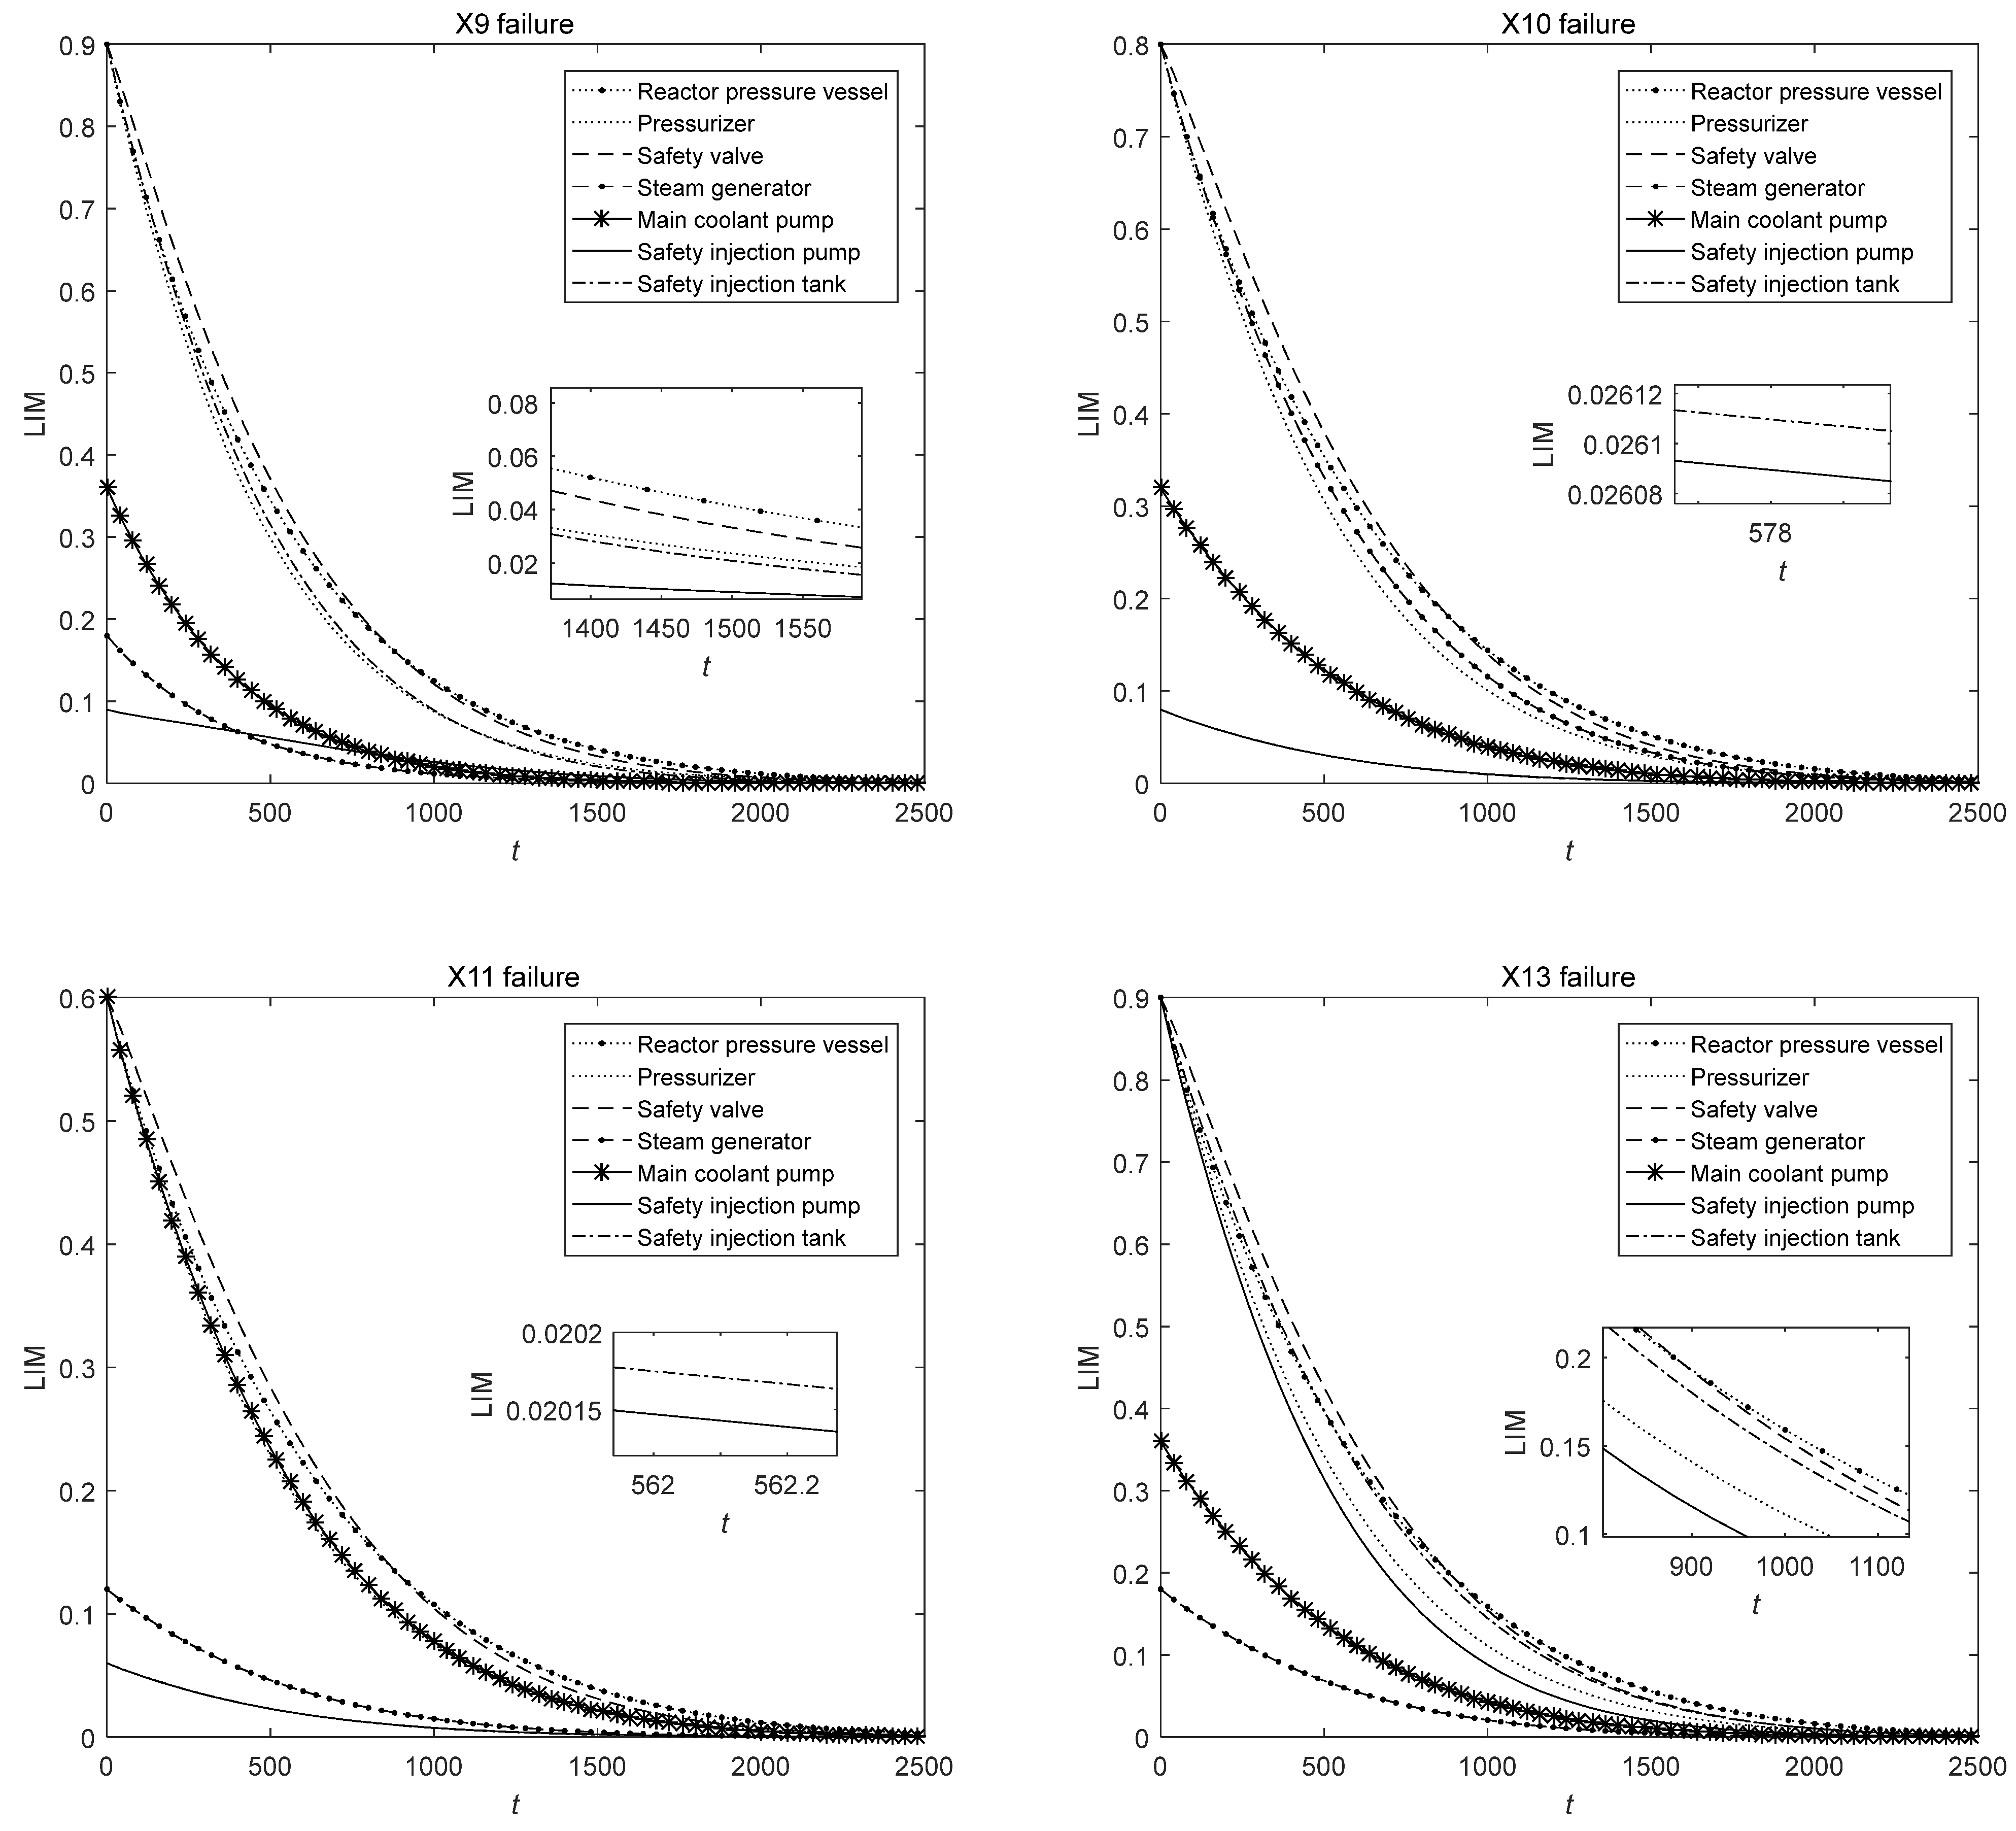
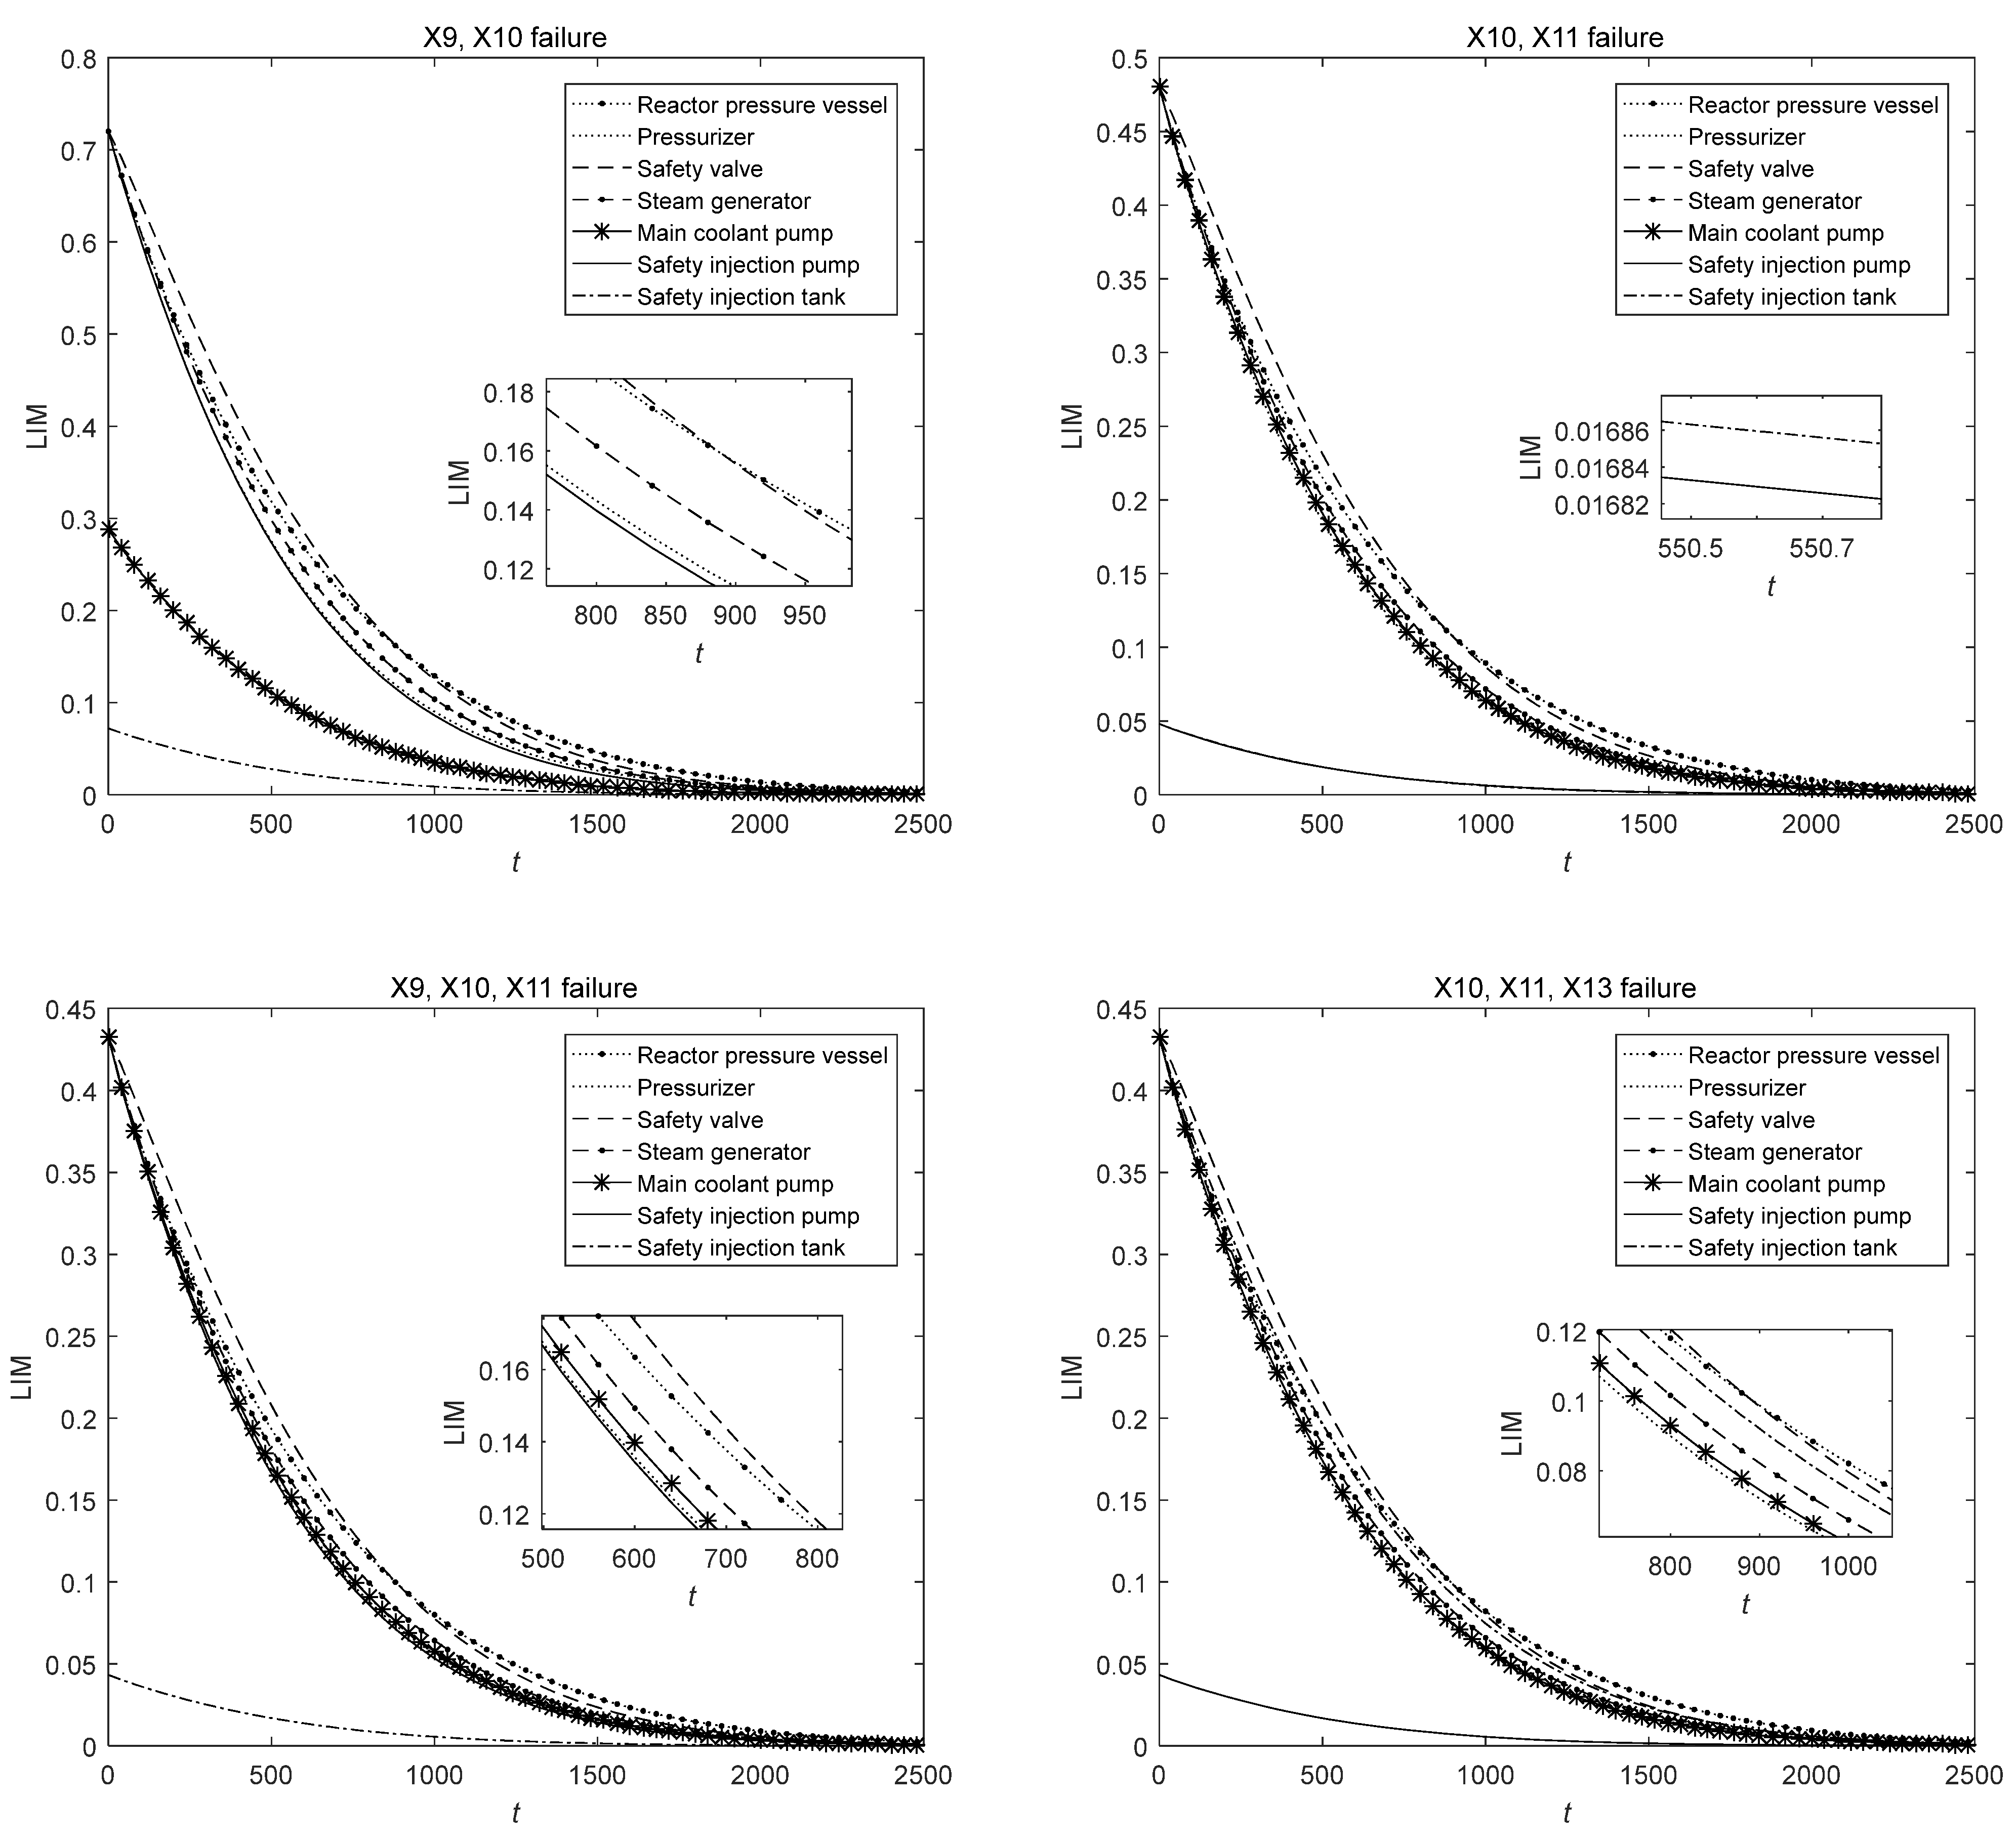
Section 4. The component maintenance priority based on the LIM under different illustrative failure conditions is shown in
Figure 2 and
Figure 3.
The maintenance priority of each component under different conditions can be shown by the LIM values of the MCS components. It can be seen from
Figure 2 and
Figure 3 that LIM values decrease rapidly before 1000 h and then decrease slowly to 0. It can also be observed that the maintenance priority of the reactor pressure vessel, pressurizer, and safety valve are always high because they are the key components of the MCS, and the failure of these components may lead to the failure of the whole system. Therefore, we should focus on the maintenance of these components. Safety injection pumps and safety injection tanks always have the lowest maintenance priority; thus, they have a lower chance of receiving preventive maintenance. Therefore, the high reliability of these two components should be strictly maintained to ensure the normal operation of the reactor.
When the MCS starts to operate, the maintenance priority of the safety valve is higher than that of the reactor pressure vessel, but the slope of the safety valve curve is larger. The maintenance priorities of the two components change as time proceeds. Therefore, the maintenance focus needs to be adjusted over time. In addition, comparing the curves under different conditions, it can be seen that the impact of the backup components corresponding to the failed components on the system performance will become greater, so the preventive maintenance priority of the backup components will also become higher. Therefore, when a component fails, more attention should be paid to its redundant components in other loops to ensure their normal operation.
After determining the maintenance priority of each component under different conditions, considering the cost constraints, different total maintenance costs will have corresponding different preventive maintenance policies. The maintenance and preventive maintenance costs of each component are shown in
Table 3.
Solving the optimization problems of Equations (6) and (7), the optimal preventive maintenance component set at a specific time under different cost constraints can be obtained. Four cases are selected to analyze the impact of different maintenance cost constraints on the selection of preventive maintenance components. The results are shown in
Table 4,
Table 5,
Table 6 and
Table 7, where 1 means the component is selected for preventive maintenance, and 0 means the component is not selected for maintenance. Considering the maintenance cost and maintenance priority, it can be seen that, due to the lower preventive maintenance cost and higher maintenance priority, the safety valve has priority among the preventive maintenance components in different situations. Considering the influence of time, at 600 h, the choice of the reactor pressure vessel or safety valve for preventive maintenance is preferred due to the large gap between the maintenance priority curves of key components and other components. At 1000 h, the gap between the repair priority curves of each component becomes smaller, and the low maintenance costs of the safety injection pump and safety injection tank make them the preferred choice for preventive maintenance. In addition, the failure of different components will also result in the selection of their preferred components for preventive maintenance. When X10 fails, the pressurizer is more likely to be selected for preventive maintenance due to the increase in total maintenance cost. When X11 fails, the reactor pressure vessel is more likely to be selected. In the case of X9 and X10 failures, preventive maintenance for safety injection pump is preferred. When X10, X11, and X13 fail, preventive maintenance for safety injection tank is preferred.
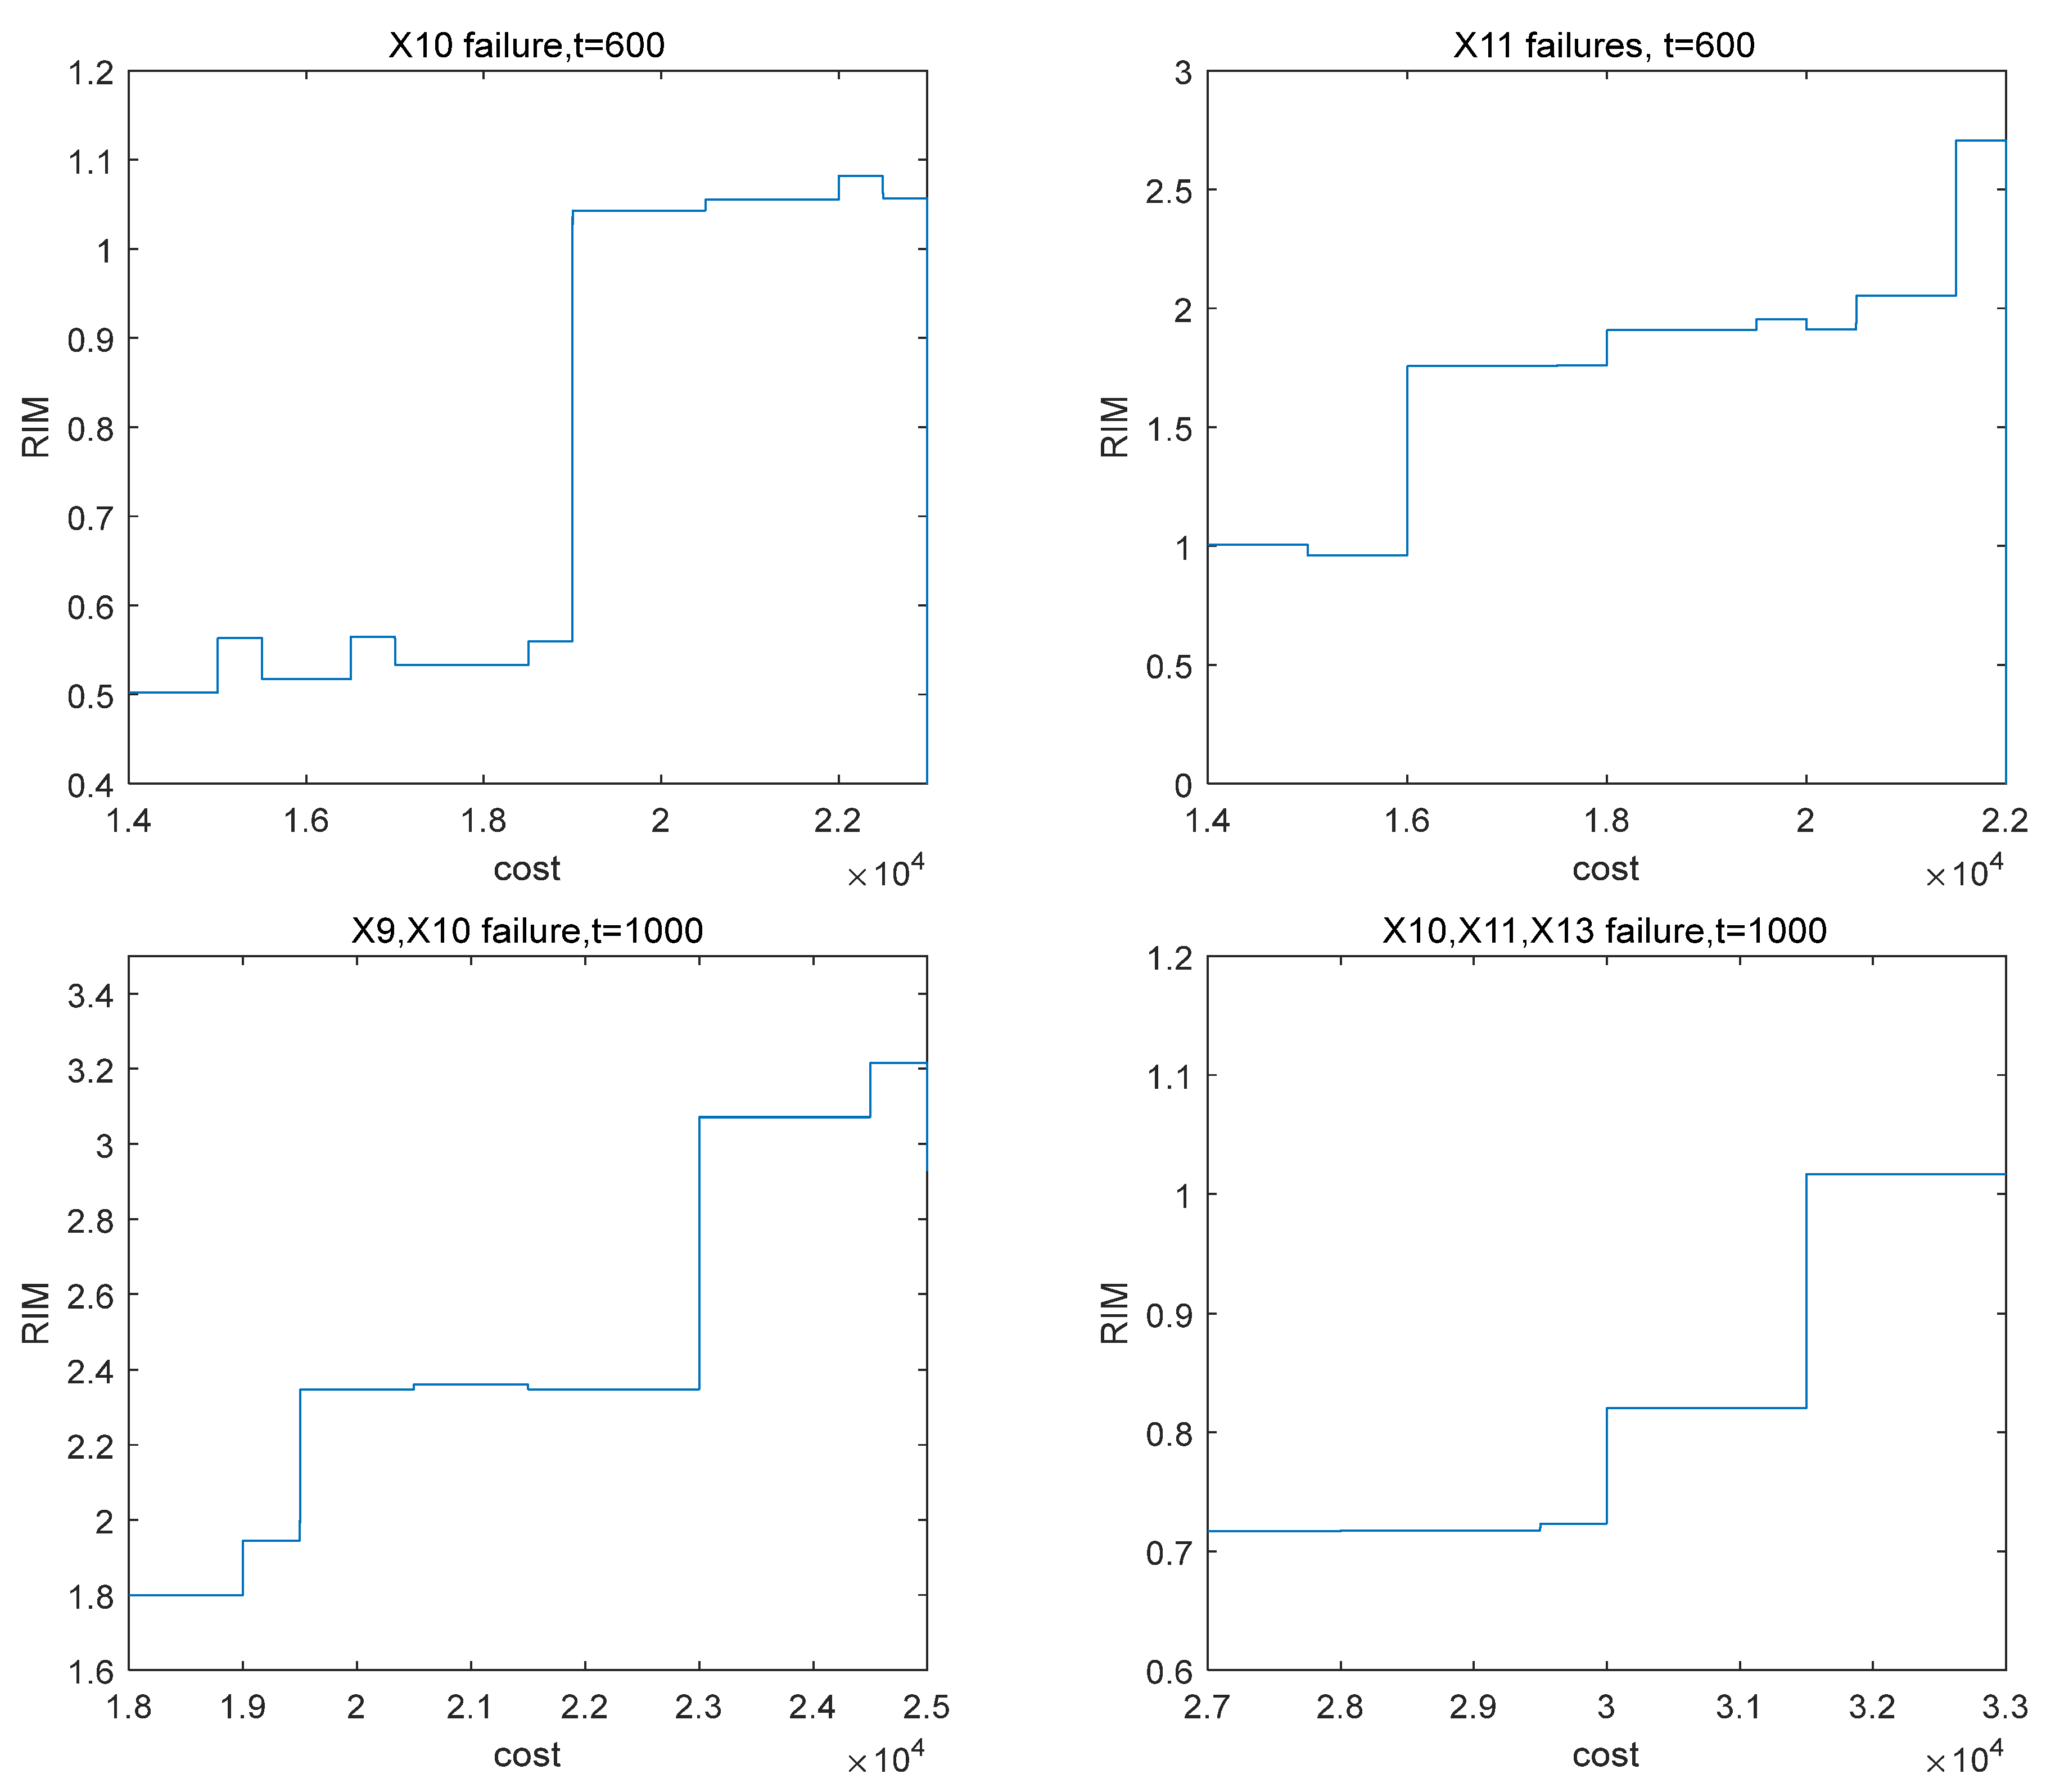
Finally, the RIM values corresponding to the optimal preventive maintenance policies with different total maintenance costs are calculated when some components fail at a specific time. The results are shown in
Figure 4. With the increase in the total maintenance cost, the number of components selected for preventive maintenance increases, and then the RIM value increases continuously in the form of a ladder. When X10 fails at 600 h, the RIM value does not increase significantly in the early stage but increases rapidly when the total maintenance cost is 19,000, and the subsequent increase is no longer obvious. In view of this situation, the total maintenance cost of 19,000 is the best, and can result in high recovery efficiency and control the total maintenance cost. When X11 fails, and the total maintenance cost is 16,000 and 21,500, the RIM value increases rapidly at 600 h. The appropriate maintenance cost should be selected according to the actual cost and performance requirements. When multiple components fail, the set of components corresponding to different maintenance costs changes less, so the change in the RIM value is less than that of a single component. The total maintenance cost also needs to be controlled according to the actual situation.
6. Conclusions
This paper proposes a novel LIM measure to evaluate the effect of the failure of one or multiple components on the system performance in the case of different failure conditions. The evaluation of the LIM can facilitate the determination of the maintenance priority of the MCS components. Based on the LIM, the optimal preventive maintenance component set under a cost constraint is calculated. Then, we propose the RIM of preventive maintenance to quantitatively evaluate the loss of system performance caused by component failure and the recovery of system performance after preventive maintenance of components so as to calculate the recovery efficiency.
For the case study conducted on the MCS, based on the LIM evaluation, it is verified that the key components of the MCS are the reactor pressure vessel, pressurizer, and safety valve. The case study also demonstrates that a component failure can lead to higher maintenance priority of its redundant components in other loops. The simulation results for the RIM show that, with the increase in the total maintenance cost, the RIM value increases continuously in the form of a ladder, and the RIM value increases significantly at some specific maintenance cost values. The results can provide valuable information to guide the recovery process.
In future research, we will consider extending and applying the proposed method to other technological or engineering multi-state systems. By defining the system performance and analyzing the impact of components on the system performance, the maintenance priority of components can be determined based on this to formulate the corresponding maintenance strategy to improve system resilience. We are also interested in extending the proposed LIM and RIM for risk analysis of safety-critical systems, including MCSs.


