
A New Text-Mining–Bayesian Network Approach for Identifying Chemical Safety Risk Factors

School of Resources and Safety Engineering, Central South University, Changsha 410083, China
*
Author to whom correspondence should be addressed.
Mathematics 2022, 10(24), 4815; https://doi.org/10.3390/math10244815
Submission received: 28 November 2022
/
Revised: 12 December 2022
/
Accepted: 15 December 2022
/
Published: 18 December 2022
(This article belongs to the Special Issue Data Analysis and Domain Knowledge)
Abstract
:The frequent occurrence of accidents in the chemical industry has caused serious economic loss and negative social impact. The chemical accident investigation report is of great value for analyzing the risk factors involved. However, traditional manual analysis is time-consuming and labor-intensive, while existing keyword extraction methods still need to be improved. This study aims to propose an improved text-mining method to analyze a large number of chemical accident reports. A workflow was designed for building and updating lexicons of word segmentation. An improved keyword extraction algorithm was proposed to extract the top 100 keywords from 330 incident reports. A total of 51 safety risk factors was obtained by standardizing these keywords. In all, 294 strong association rules were obtained by Apriori. Based on these rules, a Bayesian network was built to analyze safety risk factors. The mean accuracy and mean recall of the BM25 model in the comparison experiments were 10.5% and 14.38% higher than those of TF-IDF, respectively. The results of association-rule mining and Bayesian network analysis can clearly demonstrate the interrelationship between the safety risk factors. The methodology of this study can quickly and efficiently extract key information from incident reports which can provide managers with new insights and suggestions.
Keywords:
chemical safety; risk factor identification; text mining; association-rule mining; Bayesian networkMSC:
82-111. Introduction
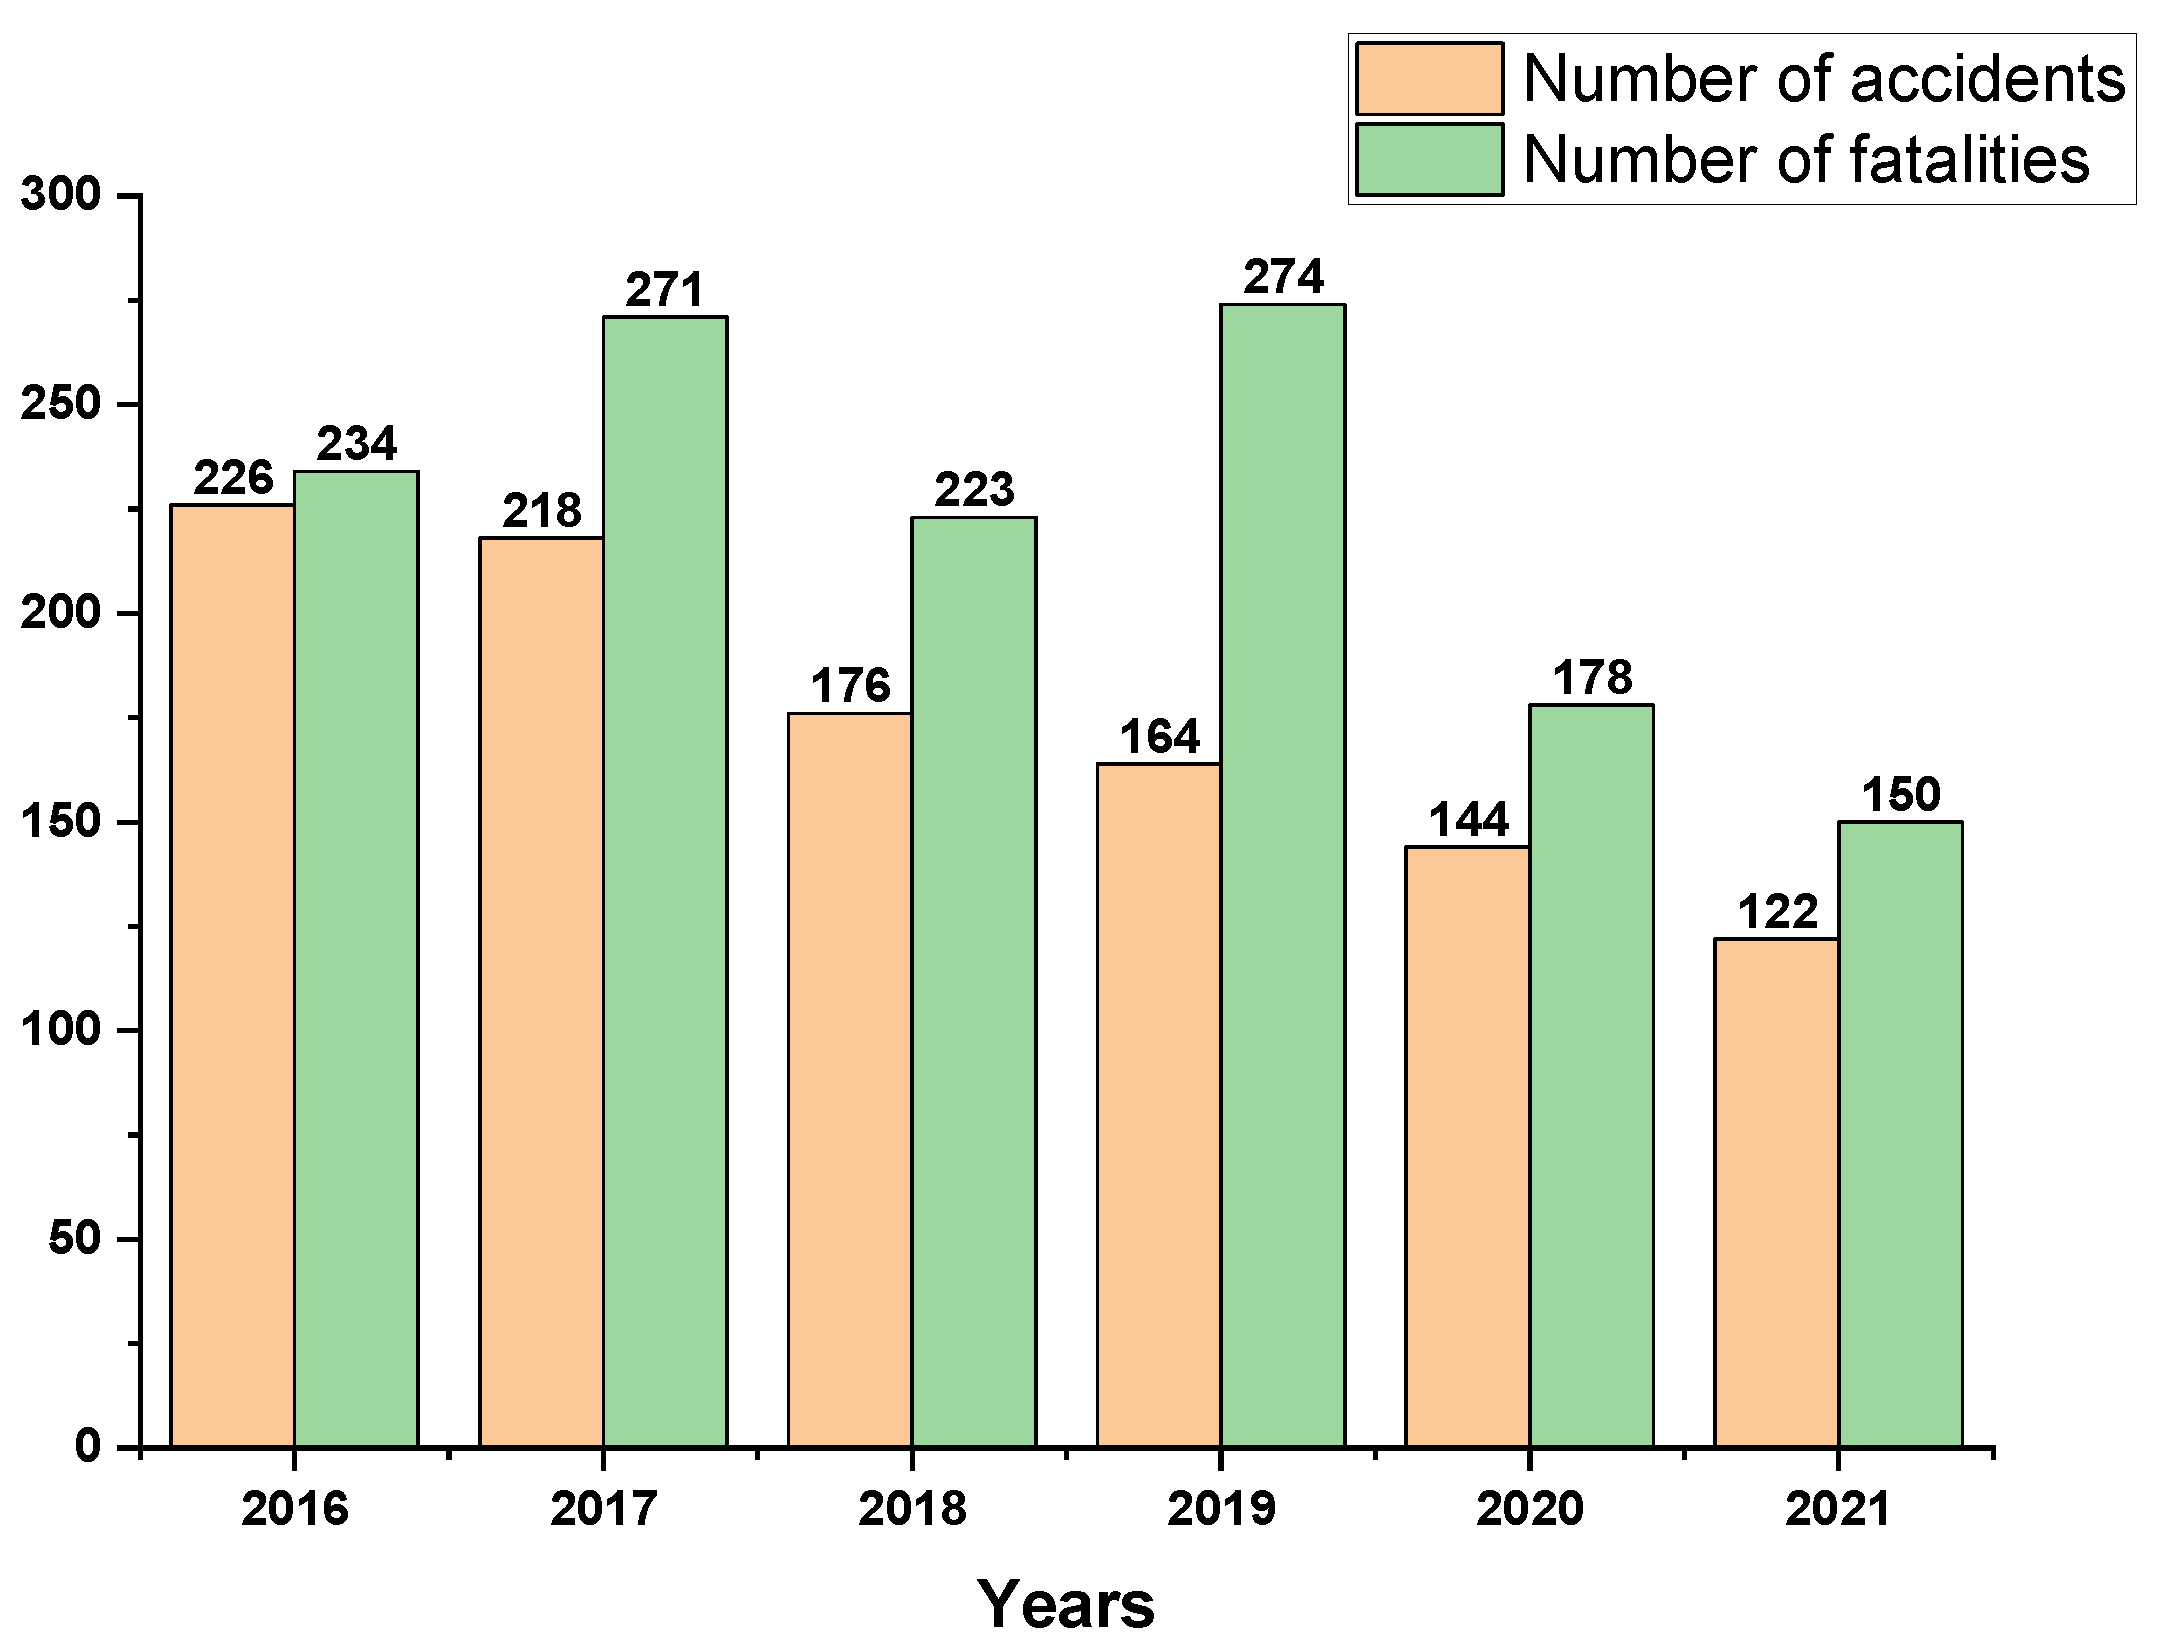
The chemical industry occupies an important position in China’s national economy, and its products are widely used in various fields such as industry, agriculture and people’s lives, so it plays a pivotal role in the industrial chain of the national economy. Since 2011, China’s chemical industry (with sales of about USD1.5 trillion in 2017) has been the highest in the world in terms of revenue, contributing half of the growth of the world chemical market in the last 20 years [1]. Due to the growth of the chemical industry, the number of chemical plants in China has been increasing significantly. The chemical industry mostly involves flammable and explosive hazardous chemicals and complex and diverse production processes, making safety management extremely difficult and production accidents frequent. In recent years, although the level of chemical safety has improved, the number of accidents and fatalities each year is still not to be underestimated. Figure 1 shows the number of chemical accidents and fatalities nationwide each year from 2016 to 2021 [2,3]. The number of chemical accidents was 1050, and the number of fatalities reached 1330, so the situation of chemical safety production remains very serious. Therefore, it is of great practical importance to improve the safety production level while ensuring the stable supply of chemical products.
In recent years, many scholars have conducted much research in the field of safety management in the chemical industry. Some of this research entails model-based approaches. For instance, Chen et al. [4] analyzed the vulnerability of chemical parks from the perspective of the domino effect and proposed targeted protection strategies. Yang et al. [5] proposed a prediction method to assess the probability of the occurrence of different levels of domino effects triggered by lightning in chemical storage tank areas. Zhou et al. [6] established an integrity chemical safety assessment system and, based on expert scores, made specific guidance recommendations for improving chemical park safety management and enhancing the overall safety capability of the park. Researchers have used tools such as brainstorming, Delphi method, questionnaires, interviews, cause-and-effect analysis, literature study, and their combination to encapsulate the domain knowledge [7,8,9]. These traditional data collection methods usually require a certain number of experienced experts and consume extensive time and cost [10]. Moreover, data collected from a few experts are prone to omissions, incompleteness, and subjectivity. As explicit knowledge, textual information that is encoded and digitized in documents and reports can be easily shared [11]. In the chemical industry, accident investigation reports are used to document the causes, consequences and the entire process of an accident. A large number of these reports constitute a valuable knowledge database. However, traditional descriptive statistics have been used to summarize the key security risk factors in these reports [12,13,14,15].
According to accident causation theory, the occurrence of accidents is the result of the interactions among multiple hazards, including people, equipment, environment and management [16]. Identifying the risk factors and their interrelationships in chemical accidents plays an important role in preventing accidents from occurring. Over 80% of failures were related to human error in the chemical and petrochemical industries [17]. The incidence of human error is much higher than the failure rate of equipment and the approval of hot work. However, previous studies of chemical accidents focused more on the selection of safety assessment methods than on the analysis of causes. The existing analysis methods were based on expert experience and relied excessively on manual processing, resulting in an inability to analyze the causes of accidents in a comprehensive and rapid manner. Moreover, there is no unified standard format for accident reports in the chemical industry, and the content of the reports is highly unstructured. Computers cannot process this information directly, and manual processing is both time-consuming and prone to errors and mistakes. Therefore, an automatic safety-risk-identification method is needed to solve the challenge of handling large textual datasets.
Text mining (TM) helps to solve this problem. TM refers to the process of extracting interesting, non-trivial information and knowledge from unstructured text documents that was not previously known and not easily revealed [18]. The concept originated in the 1950s and was subsequently used in various fields of research. In the field of cybersecurity, Zanasi [19] used TM to monitor and analyze online plain-text sources such as Internet news and blogs to prevent terrorism. In the business world, it was used to improve the predictive analysis of churn-prediction models [20]. TM often uses some clustering and classification methods to process the dataset. For example, common classification methods include naive Bayes (NB), decision trees (DT), random forests (RF), and support vector machines (SVM). A hierarchical Bayesian model was used to handle source-to-source variability in the root-cause analysis of rare events [17]. Tixier et al. [21] applied RF and stochastic gradient tree boosting (SGTB) to study the ability of machine learning (ML) in damage prediction, and the type of damage, energy type, and body parts of high skill in the accident dataset were accurately predicted. A common clustering method is the latent Dirichlet allocation (LDA). The LDA method helps to improve text classification tasks effectively, which is essential in many advanced expert and intelligent systems, especially in the case of a scarcity of labeled texts [22]. Zhong et al. [23] established a framework of deep learning (DL) and TM for various accidents in the construction industry to analyze accident hazards, using the 34 categories of topics generated by the LDA model. Chen et al. [24] constructed a stakeholder classification system and used the LDA model to complete topic clustering to uncover the topic focus and evolution path of stakeholders in the public opinion field. However, the results they retrieved were in the form of words to represent the corresponding information, which had a high degree of uncertainty. Especially in large texts such as accident reports, some words with very high word frequency did not indicate specific risk factors but were still extracted as keywords. Depending on the corpus and extraction purpose, traditional text mining can no longer effectively identify safety risk factors and needs to be improved.
Considering that text mining is rarely used in chemical safety research, this paper creatively combines text mining, association-rule mining, and Bayesian networks and uses them for chemical accident analysis. First, the domain dictionary, synonym dictionary, and discontinued word dictionary are built and updated respectively in data preprocessing. Then we improve the keyword-extraction method and propose the BM25W model. The safety risk factors are then identified by normalizing the keywords with correlation coefficients weighted by distance formulae and the sociotechnical systems. After that, we find the strong association rules between security risk factors using association-rule mining and discover the interconnection of key causes. Finally, this study conducts Bayesian network analysis based on the association-rule mining results to find the important factors, key causal paths, high-frequency factors, and highly concentrated factors of chemical accidents. A theoretical analysis is also performed for these results. This study differs from previous knowledge-driven or model-driven studies by analyzing the direct invisible patterns and complex associations of text data in a data-driven manner. We aim to reduce the number of accidents by providing a strong guide to automatically analyze the causes of accidents and optimize safety strategies.
2. Materials and Methods
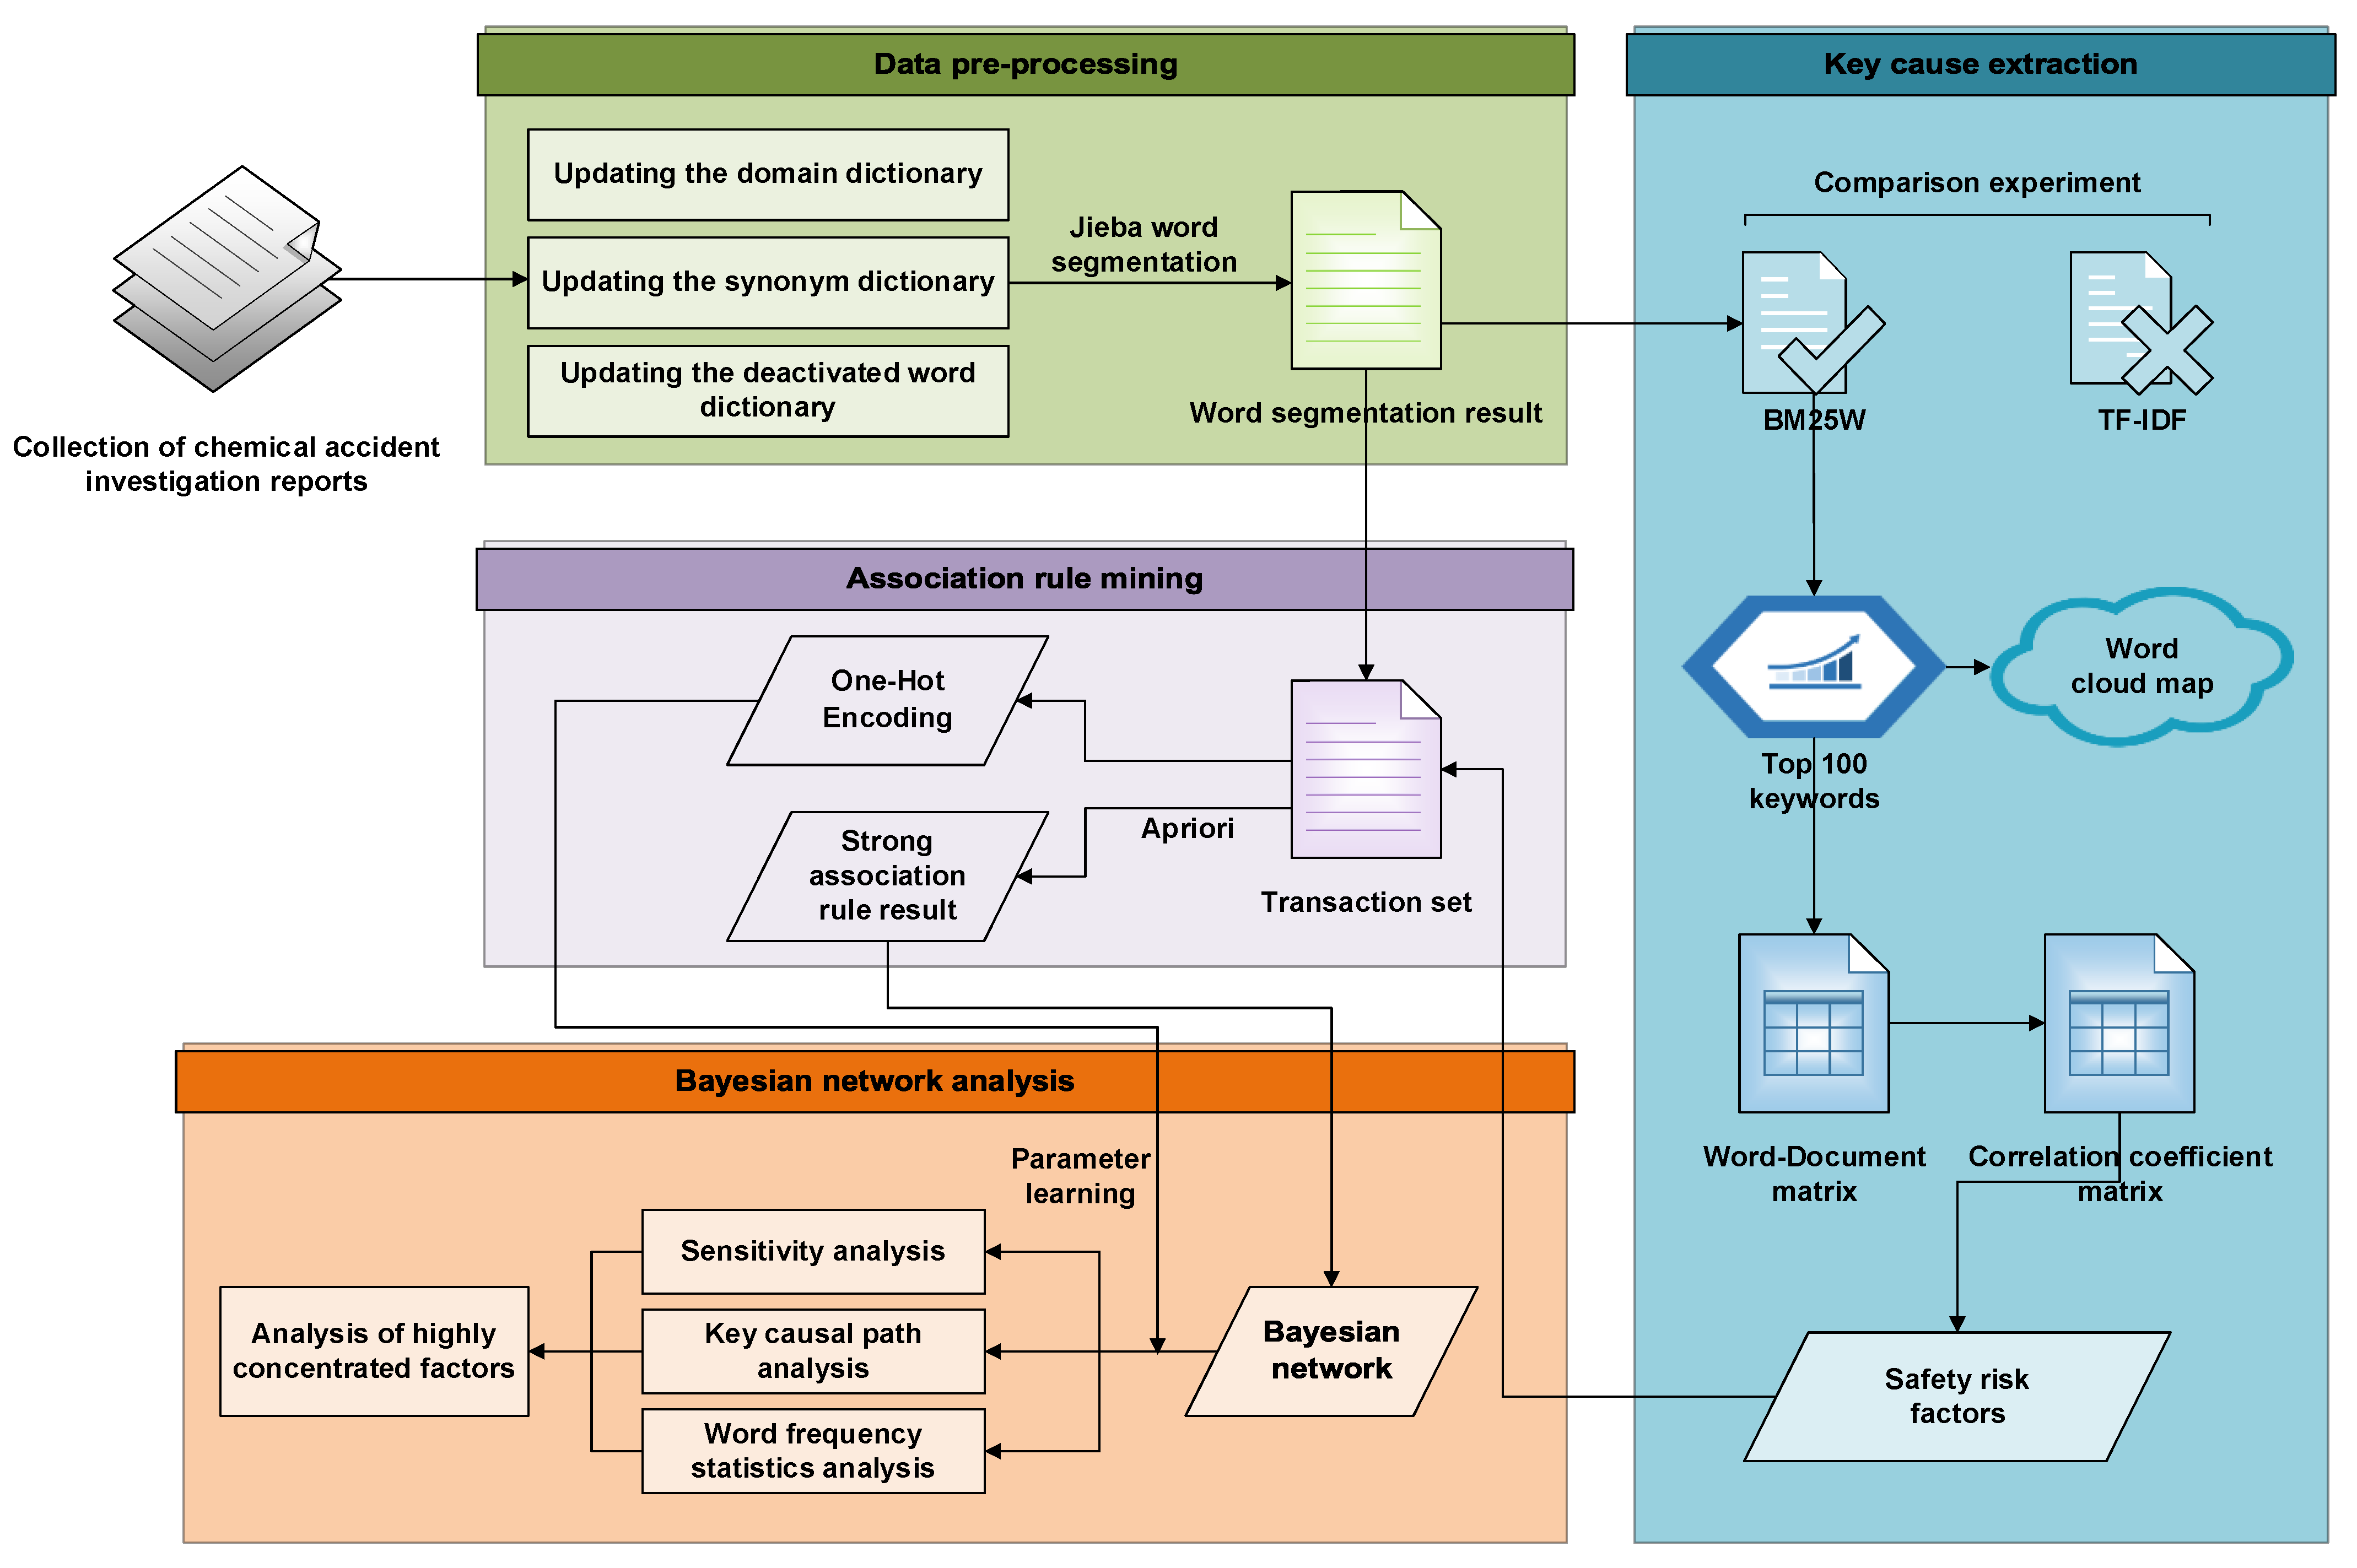
This study consists of four main parts: data preprocessing, key cause extraction, association-rule mining, and Bayesian network analysis, as shown in Figure 2. These four parts will be introduced one by one in the following sections.
2.1. Dataset
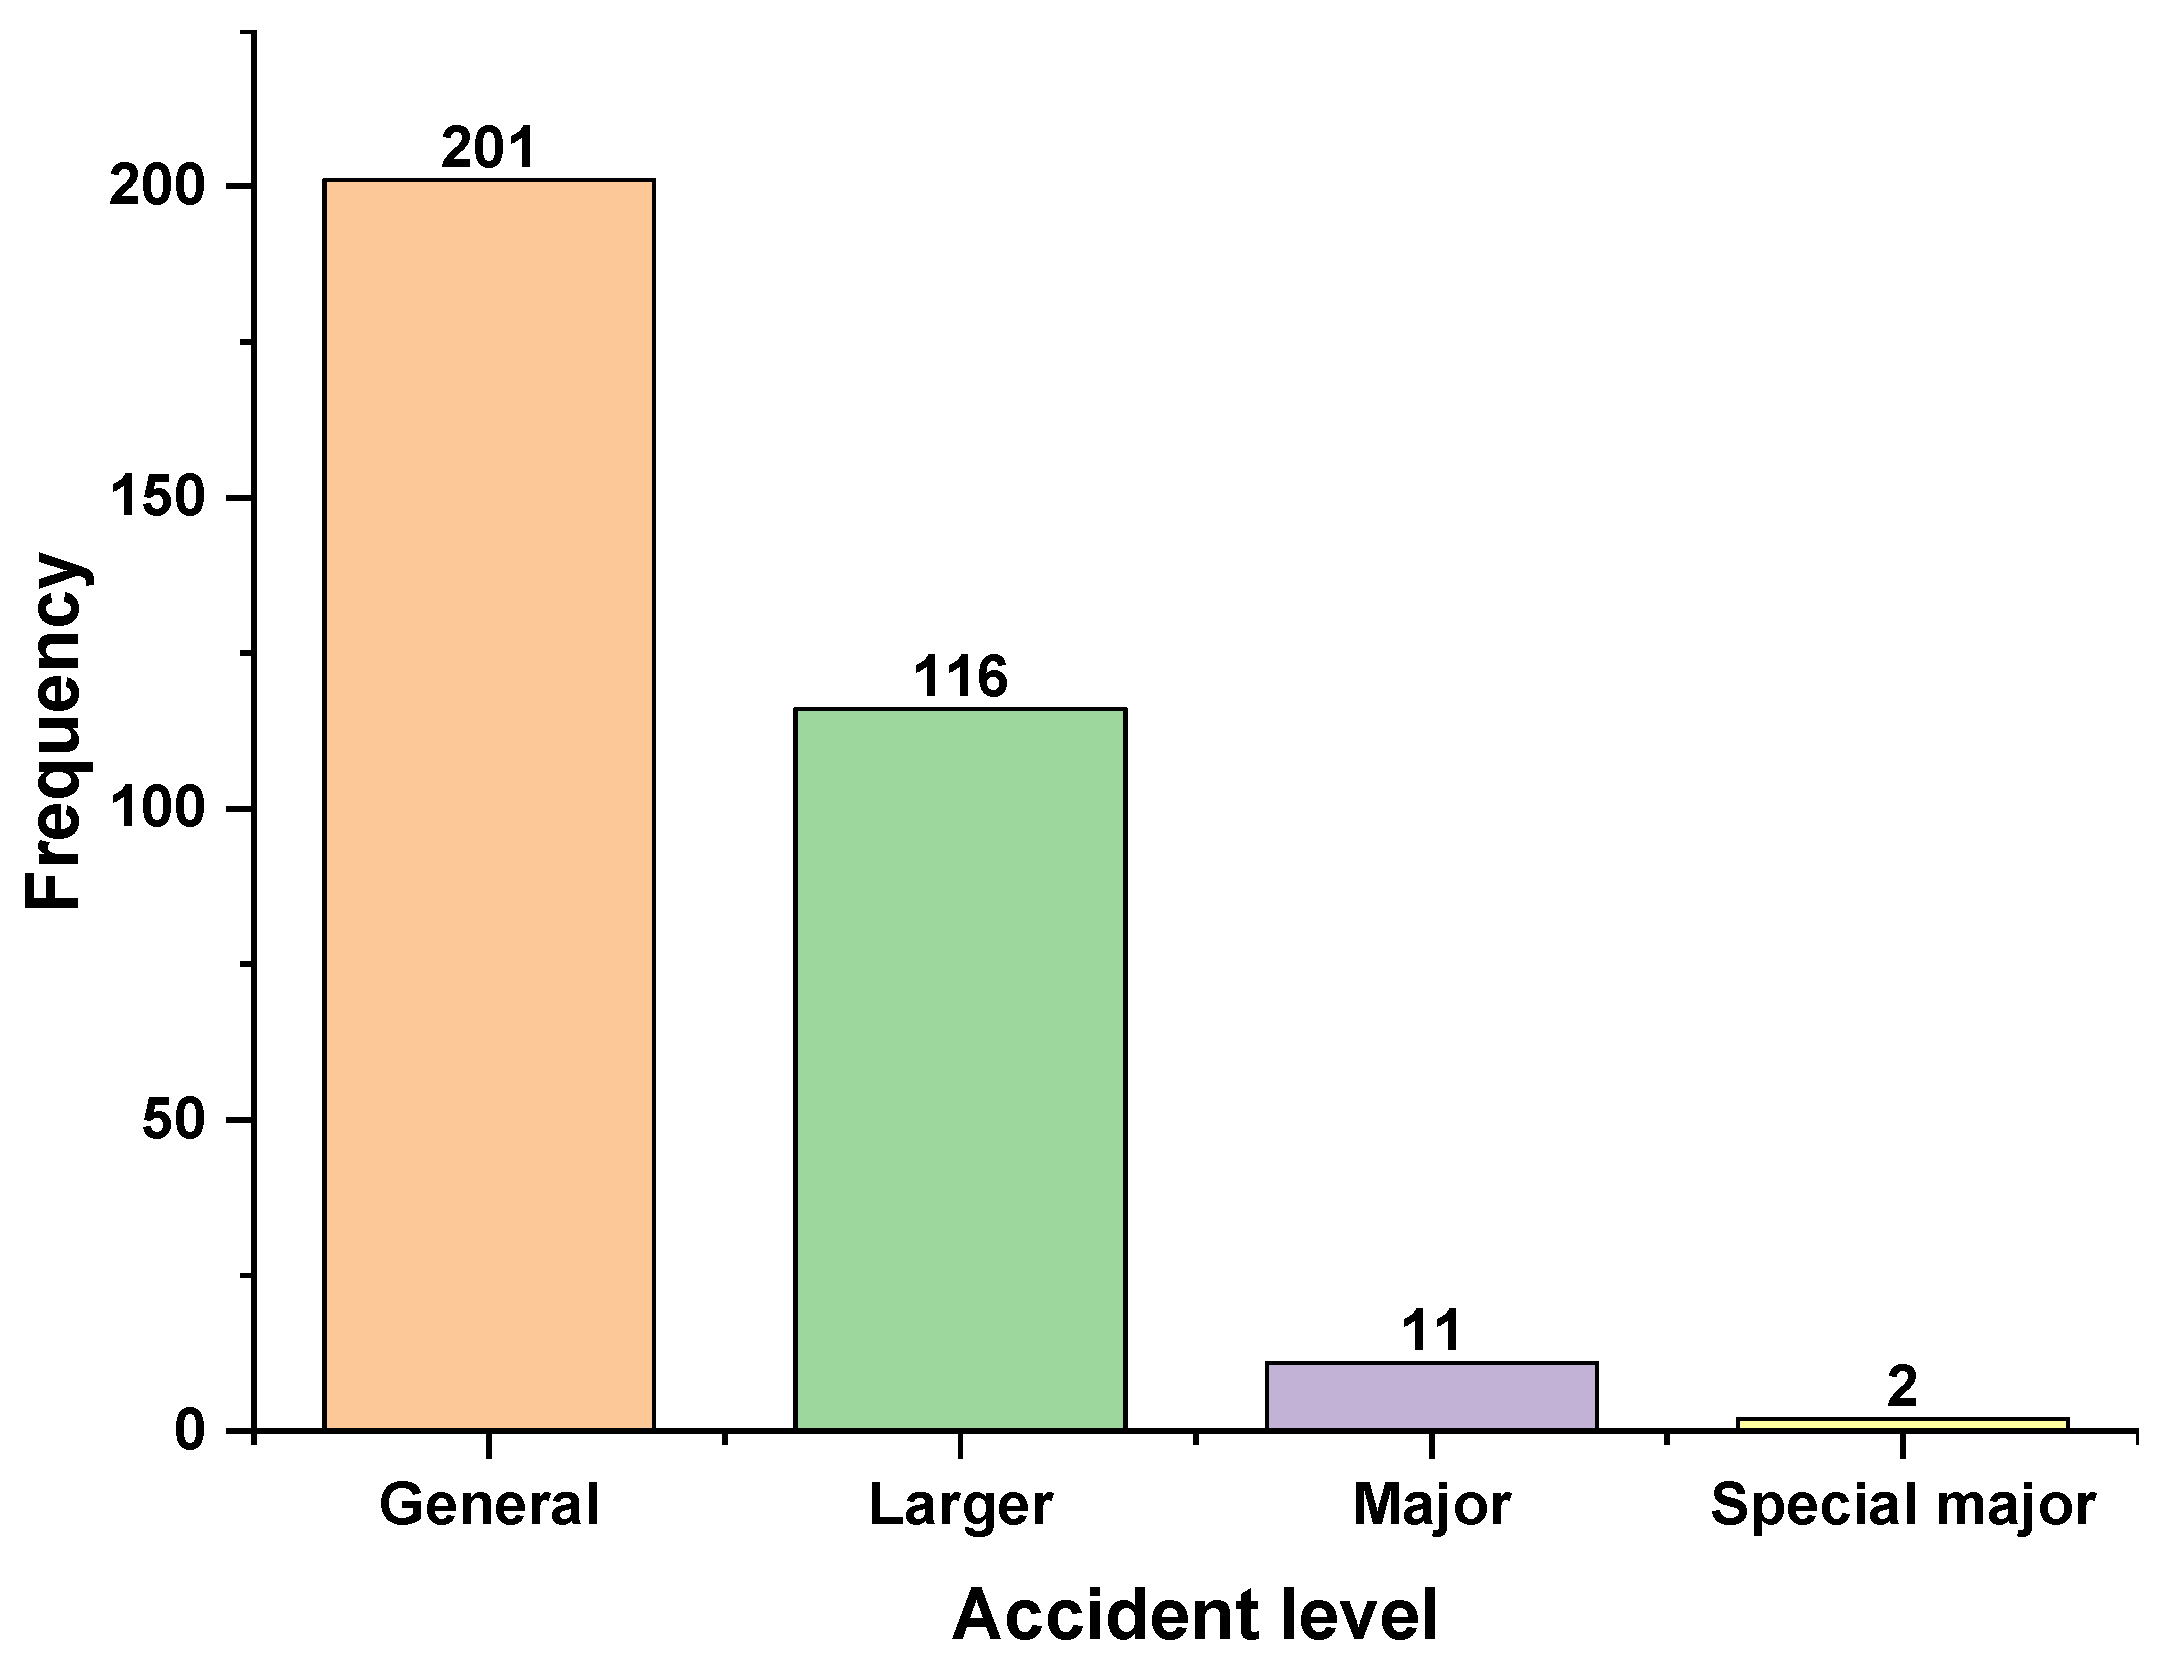
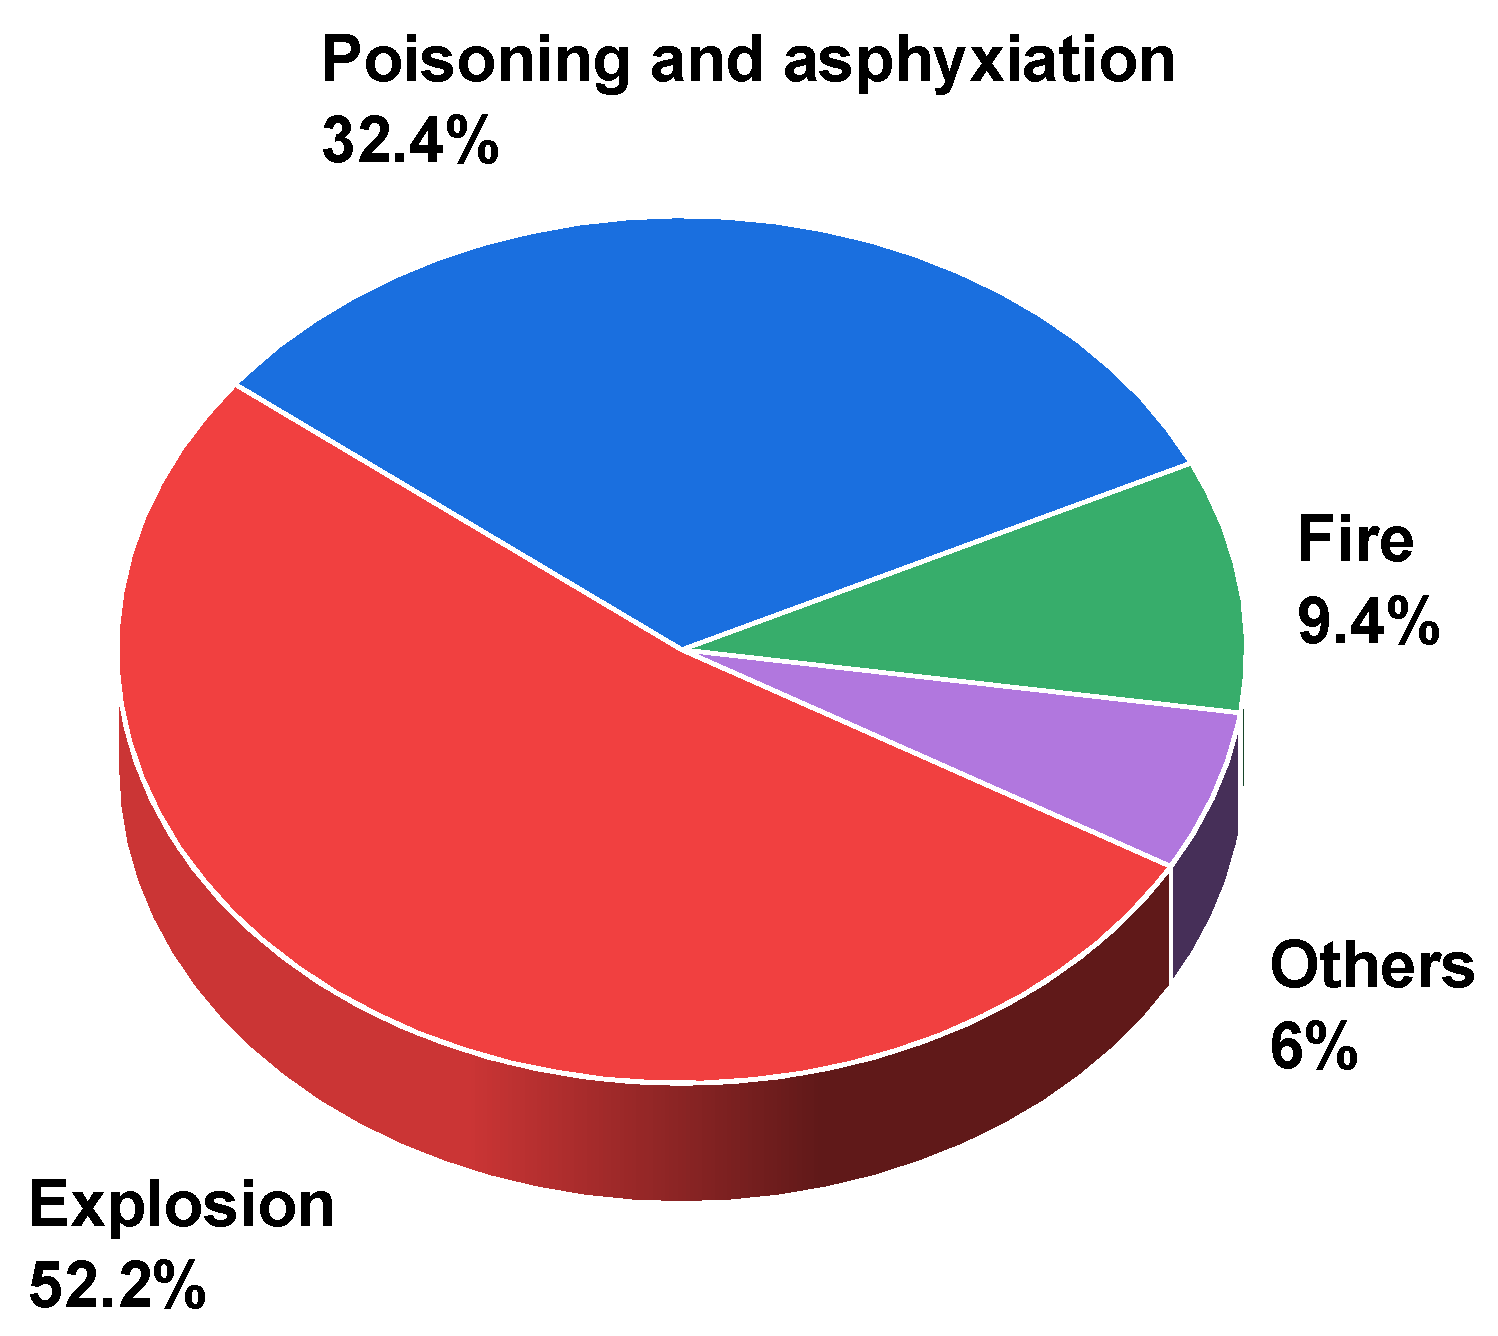
Accident investigation reports in the field of chemical production are the original corpus used in this paper for analysis. These reports are written by experts in the field of safety management by researching and analyzing accidents after they have occurred. There are many sources for obtaining accident investigation reports. Esmaseili et al. [25] obtained the accident reports from the National Institute for Occupational Safety and Health (NIOSH), Rodrigues et al. [26] obtained and analyzed the accident reports from the European Aviation Safety Agency (EASA), and some other scholars [27,28,29] also obtained the required data individually from the relevant official sources. China’s “Production Safety Accident Reporting and Investigation System for Chemical Enterprises” stipulates that any accident involving casualties shall be recorded and kept in a complete, accurate, and timely manner, and no unit or individual shall conceal it. The content of the accident report should include the cause of the accident, losses, responsibilities, corrective measures, etc. Like other countries, China has a dedicated production safety management function, namely the Ministry of Emergency Management of the People’s Republic of China (https://www.mem.gov.cn/ (accessed on 2 August 2022)) and the emergency management departments of all provinces and municipalities in the country. To ensure the reliability of the data sources, a total of 665 accident investigation reports related to chemical and hazardous chemicals from 2011 to the first half of 2022 were downloaded from these websites for this study. After that, we filtered the data and eliminated those that did not meet the requirements, leaving 330 accident investigation reports in the field of chemical production. The level and type of these accidents mentioned were also counted, as shown in Figure 3 and Figure 4. It can be seen from Figure 3 that the vast majority of accidents are general accidents and larger accidents. Although the number of casualties or damage caused by these accidents is small, they occur frequently and still have a serious impact on chemical production. Figure 4 shows that more than half of the accident types are explosions, while poisoning and asphyxiation are the next most common. This is because most of the chemical production fields involve flammable and explosive or toxic and hazardous gases, which can easily cause explosions of mixed gases or poisoning and asphyxiation of people.
Since the purpose of this study is to analyze the key causes of accidents, only the “accident history”, “direct cause of accident”, and “indirect cause of accident” of each report were selected to prevent information redundancy in the analyzed corpus. The spaces and line breaks in the content filtered from each report were then removed and turned into a one-line corpus. The 330 reports generated a total of 330 lines of corpus that were used for subsequent mining and analysis.
2.2. Data Pre-Processing
Data pre-processing is a very important but tedious process because the original corpus contains a large number of irregular or nonsensical words. One of the most important tasks is to split the original Chinese text into a format similar to the English text split by spaces for the next step of text-mining analysis. The text-segmentation tool used in this study is Jieba splitting in python3. We observe that the causes of chemical production accidents are generally composed of nouns and verbs or simple nouns [30]. Therefore, in this study, only common nouns, institutional names, other proper names, common verbs, and verbal nouns were selected for word segmentation. This way Jieba splitting would automatically exclude the rest of the lexical word-splitting results when splitting words. The Jieba word segmentation system (JiebaWSS) contains three kinds of dictionaries, namely the domain lexicon, synonym lexicon, and discontinued word lexicon.
- (1)
- Domain lexicon: Although JiebaWSS comes with a dictionary that contains most of the commonly used words (e.g., reactor, piping, etc.) for segmenting words, there are many industry-specific words that cannot be identified, such as distillation column, middle operating chamber, steam valve, and gas detector. When it comes to these words, JiebaWSS may split the whole proprietary word into two or more words. This requires prior integration of these industry-specific words into a domain dictionary and adding the dictionary to JiebaWSS.
- (2)
- Synonym lexicon: There are many synonyms in accident investigation reports, and a large number of these synonyms can make the word segmentation results too discrete. We can replace all the synonyms with one of the words; for example, pipe, pipeline, steam pipe, pressure pipe, etc., can be replaced by the pipe.
- (3)
- Discontinued word lexicon: The accident investigation report also contains a large number of meaningless words, numbers, and symbols, such as “we”, “actually”, “exactly”, “3”, “6”, “,”, “.”, “!”, etc. These words have no practical significance for the analysis of this study and can be added to the dictionary of discontinued words for elimination.
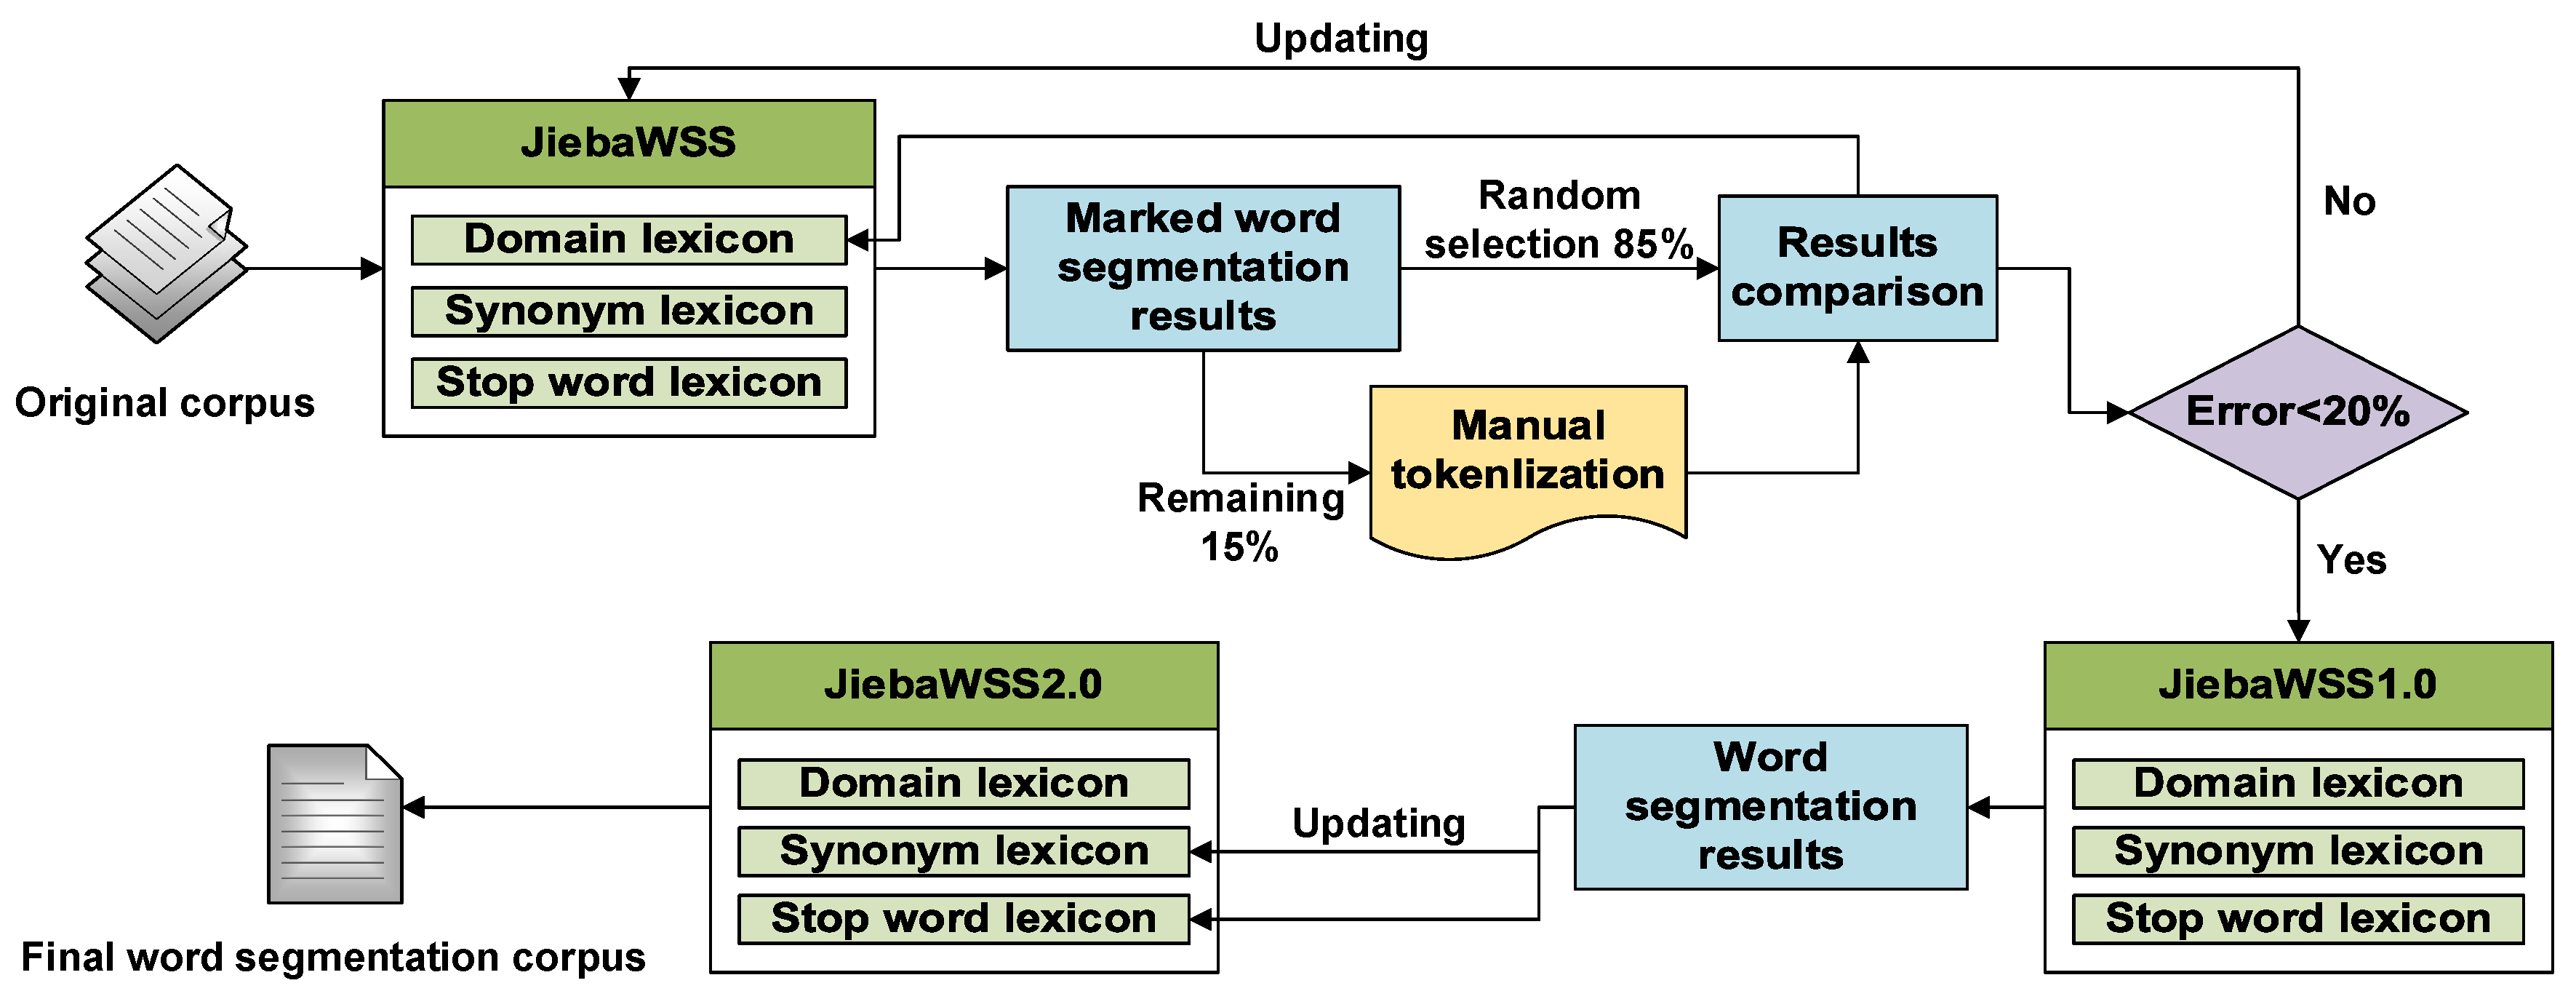
These three lexicons have a direct impact on the results of word segmentation, which in turn has a cascading effect on the subsequent analysis. Therefore, it is necessary to update these three lexicons to form a JiebaWSS that is consistent with this study. In this study, a lexicon update method was designed by drawing on the lexicon development ideas of Esmaeili, Hallowell, and Xu et al. [10,31]. Figure 5 shows the workflow of this method.
2.2.1. Creation and Update of Domain Lexicon
The initial domain lexicon can be created before the splitting of words. In this study, proprietary words in the field of chemical production were downloaded from the official websites of Baidu and Sogou, organized, and added to the domain dictionary. The original corpus was first segmented using the initial JiebaWSS to obtain word segmentation results that were marked with segmented positions. Then 15% of the results were randomly assigned to experts for manual inspection, and the other 85% were used to calculate the effect of JiebaWSS on the recognition of proprietary words. What we want is for JiebaWSS to segment proprietary words in their entirety. If some of the proprietary words are not recognized by the system, the segmentation markers will appear between those proprietary words. Therefore, experts need to pay particular attention to whether the words on either side of the segmentation marker can be combined to form a proprietary word when checking. Proprietary words that are checked by experts but not recognized by the system are recorded and used to update the domain dictionary. The update of the domain dictionary may be repeated, and we set an error rate as shown in Equation (1).
where denotes the set of proprietary words checked by experts; means the set of proprietary words identified by JiebaWSS; refers to the set of proprietary words in the domain dictionary; indicates the number of proprietary words contained in the set of but not in the set of ; means the number of proprietary words in the domain dictionary. When the error rate is less than 20%, the domain dictionary is considered acceptable and then the updating is stopped again, resulting in JiebaWSS1.0.
2.2.2. Creation and Update of Synonym Lexicon and Stop Word Lexicon
After obtaining JiebaWSS1.0, this study used the Harvard dictionary of discontinued words as the initial stop word lexicon. The original corpus was then split, and the result was scrutinized by domain experts. The synonyms in the result were added to the synonym dictionary and replaced with one of the words, while the words that had no real meaning in the result were added to the initial stop word dictionary. This gave JiebaWSS2.0, which consists of three up-to-date dictionaries. By using this system to segment the original corpus, the final word segmentation result was obtained, which was used as data for subsequent analysis.
2.3. Extraction of Key Causes
2.3.1. Keyword Extraction Method
The content of the splitting results from the original corpus is very large, making it difficult to perform a direct critical cause analysis of the accidents. Keywords are words that can express the key content of documents, and are often used in computer systems to cite the content characteristics of papers, information retrieval, and systematic collection for readers to review. Keyword extraction is a branch of the text-mining field and is fundamental to text-mining research such as text retrieval, document comparison, summary generation, document classification, and clustering [32]. Traditional keyword extraction methods mainly include TF (word frequency) and TF-IDF (word frequency-inverse document frequency), which are simple and convenient to use. TF considers that the more frequently a word appears, the more that word contributes to the document. However, for accident investigation reports, it is not simply assumed that the more frequently a word indicating a safety risk factor appears in the document, the more critical that word is. Because the length of each accident investigation report is different, some unimportant words may appear repeatedly in a longer document. To reduce the effect of high frequency, TF-IDF is multiplied by IDF after TF, as shown in Equation (2).
where P where refers to the number of occurrences of word in document ; indicates the sum of the occurrences of all words in document ; denotes the total number of documents in the whole corpus; and refers to the number of documents that contain word . However, TF-IDF ignores the document length, where the criticality score of word is still linearly related to the word frequency TF. For example, if a document with 1000 words has 100 words A and another document with 5000 words has 100 words A, it is clear that word A is of different importance in the two documents. The frequency of words in long documents is generally higher, which ultimately leads to the TF-IDF criticality score still being overly favorable to long documents. To improve this problem, researchers have proposed the BM25 model [33], as shown in Equation (3).
where is the total number of documents in the corpus; is the number of documents containing the word ; is the frequency of in document ; is the length of the document; is the average length of all documents in the whole corpus; and and are freely adjustable hyperparameters; in general, and . The function of on is a saturated increasing function, making the growth of document word frequency non-linearly related to the growth of keyword score. Therefore, in this study, some improvements based on the BM25 model were proposed and used for the extraction of keywords.
2.3.2. Improved BM25 Model—BM25W
Both TF-IDF and BM25 consider the relationship between words and documents but do not address the influence of the semantics of the words themselves on keyword extraction. For the word used to indicate safety risk factors, on the one hand, we generally consider that the longer the word, the clearer and more specialized the information indicated, such as device, safety device, and safety interlock device [34,35]. In particular, we would like to be able to extract words that can more clearly indicate safety risk factors. On the other hand, the proprietary words of the preceding domain dictionaries were carefully checked and selected by domain experts from the documents, so their semantic representation was clearer and more specialized. Therefore, in this paper, the BM25 model was weighted according to the semantics of the words themselves. First, the formula for calculating the weight based on the word length is shown in Equation (4).
where means the length of word and denotes the length of the longest word in document . Second, the formula for calculating the weight based on the domain dictionary is shown in Equation (5).
where, if does not exist in the domain dictionary, then the score is 0. On the contrary, if exists in the domain dictionary, then the base weight is first set to 0.5 and then summed with the ratio of every 100 words to the number of words in the word segmentation result of document . The sum of these two weights is used as the weight based on word semantics, then the weighted score of the BM25 model is calculated as shown in Equation (6).
In this study, this new model is called BM25W and this is used for keyword extraction.
2.3.3. Generation of Key Causes
Since the extracted keywords are only single nouns or verbs, they do not completely reflect the causes of accidents, such as special equipment, toxic and hazardous gases, supervision and management, etc. This is because these words may have some semantic repetition or may not specifically reflect a hidden problem [36]. These keywords need to be standardized. In this study, all feature words were first vectorized by computer into a word-document matrix (TDM), as shown in Equation (7).
where TDM is an two-dimensional sparse matrix. Each row means a document ; each column denotes a feature word ; then refers to the number of occurrences of the feature word in the document . In this way, the highly unstructured incident reports can be transformed into structured numerical-type data. The correlation coefficients between feature terms are then calculated using TDM, as shown in Equation (8).
where refers to the Pearson correlation coefficient of feature words and ; indicates the shortest distance between these two words in all documents. If two feature terms appear in a document at the same time but are located far apart, then it is clear that the two feature terms are not related when expressing a hidden problem. The TDM only represents the distribution of the number of feature words over the entire corpus space, but does not reflect the positional relationships of the feature words in the documents. Therefore, in this study, was used as the distance weight of the two feature terms and multiplied with the Pearson correlation coefficient as the final correlation coefficient.
2.4. Association-Rule Analysis
After obtaining the security risk factors, scholars [8,10,23] often analyzed these factors directly without considering their connections, or analyzed the relationships between them one by one manually, which was time-consuming and labor-intensive. In contrast, association-rule mining was first proposed by Agrawal in the analysis of supermarket shopping baskets, which is a method to study the potential inter-relationships between item sets in a database [37]. It is currently one of the most active research directions in the field of data mining. Association rules can discover the association characteristics of uncertain factors leading to accidents from a large amount of accident data, so as to identify the causal relationship between factors and assist managers in decision-making [38]. Therefore, based on identifying safety risk factors through text mining, this study used association-rule mining to obtain strong association rules among safety risk factors, which laid the foundation for the subsequent analysis of chemical safety risk factors and the construction of the Bayesian network structure. Association-rule mining was defined as follows [37]:
Let be a set of binary attributes called items and be a set of transactions called the database. Each transaction in has a unique transaction ID and contains a subset of the items in . A rule is described as an implication of , where , .
Every rule is composed of two different sets of items, also known as itemsets, and , where is called antecedent or left-hand-side (LHS) and is called consequent or right-hand-side (RHS). To select interesting rules from all possible set rules, constraints on various measures of significance and interest are used. The best-known constraints are minimum thresholds on support and confidence. Let be an itemset, an association rule, and a set of transactions of a given database. Support indicates how frequently the itemset appears in the dataset, whose preconditions become more restrictive instead of more inclusive as it grows. Support for with respect to is defined as the proportion of transactions in the dataset that contain the itemset , calculated as follows:
Confidence indicates how often the rule has been found to be true, expressed as:
The confidence value of with respect to a set of transactions is the proportion of the transactions containing that also contains . If the value of equals 1, the rule is inevitable.
Association rules are required to concurrently meet both minimum support and minimum confidence. In most conditions, association-rule generation is divided into two separate steps. The first step applies a minimum support threshold to find all frequent itemsets in a database, and the second step applies a minimum confidence constraint to obtain these frequent itemsets in order to form rules.
The safety risk factors were not originally present in the documents, but were obtained by standardizing the keywords. Therefore, when a pair of keyword and non-critical feature item appear in a document at the same time and the distance is not greater than 10, we consider that the safety risk factor normalized by these two words is also present in this document. In this way, the set of transactions needed for association-rule mining, i.e., the transaction dataset described above, can be obtained.
The main classical association-rule mining algorithms are Apriori and FP-growth. The Apriori algorithm scans the transaction database several times and generates frequent sets using candidate frequent sets each time; while FP-growth uses a tree structure to obtain frequent sets directly without generating candidate frequent sets, which greatly reduces the number of times the transaction database is scanned, thus improving the efficiency of the algorithm. Because of this, FP-growth can only be used to mine single-dimensional Boolean association rules. However, the causal relationships between the safety risk factors are intricate and complex, and there are a large number of association rules for multiple sets, so this study uses the Apriori algorithm for association-rule mining.
2.5. Bayesian Network Analysis
Bayesian network, also known as confidence network, is an extension of Bayes and is currently one of the most effective theoretical models in the field of uncertain knowledge representation and reasoning. Since its introduction by Pearl in 1988, Bayesian network has become a hot research topic in recent years. A Bayesian network is a Directed Acyclic Graph (DAG) consisting of nodes representing variables and directed edges connecting these nodes, as shown in Figure 6.
When the occurrence of event A affects the occurrence of B, there is the following relationship:
Equation (11) is known as Bayes’ formula, where and are the prior probabilities of events A and B, respectively; refers to the posterior probability (conditional probability), which means the probability of event B occurring when event A occurs; and denotes the likelihood probability, which is a description of the likelihood of the cause occurring when the outcome is assumed to occur. For any random variable, its joint probability can be obtained by multiplying the respective local conditional probability distributions, as shown in Equation (12).
In recent years, some scholars have used Bayesian network for the engineering analysis of complex safety systems. Quali et al. [39] analyzed the causality of disease occurrence through Bayesian network in order to discover the key factors that lead to the disease. Chen et al. [40] used fuzzy Bayesian network to evaluate the risk of electric vehicle fire accidents and identify the risk factors leading to electric vehicle fires. To effectively protect citizens’ property from the infringement of fund-raising fraud, Yang et al. [41] used Bayesian network to analyze the dissemination, identification, and causation of fund-raising fraud. Li and Chen et al. [38,42] constructed the causal network of coal mine accidents based on Bayesian networks, so as to discover the key causes of coal mine accidents. Because of its strong uncertainty analysis capabilities and characteristics of fast analysis speed and good results [43,44], Bayesian network has played a huge role in many fields. Therefore, it has a good prospect for application in the chemical complex system analysis. In this paper, the purpose of constructing and analyzing the chemical accident causality network is to clarify the key risk factors of the chemical safety production system through quantitative analysis, so as to propose more targeted accident-prevention strategies. Therefore, this study built a Bayesian network structure based on the result of association-rule mining, and transformed the transaction set into One-Hot Encoding for parameter learning of Bayesian network. Then sensitivity, critical cause path, and frequency statistical analysis were performed on the safety risk factors.
In this study, Bayesian network analysis was performed using GeNIe4.0 software. GeNIe Modeler is a development environment for building graphical decision-theoretic models. Because of their versatility and reliability, GeNIe and SMILE have become very popular and became de-facto standards in academia, while being embraced by a number of government, military, and commercial users and GeNIe has been tested extensively in many teaching, research, and commercial environments [45].
3. Results and Discussion
3.1. Data Pre-Processing Result
The main process of data pre-processing was to update the domain lexicon, synonym lexicon, and stop word lexicon. Experts followed the workflow in Figure 3 to scrutinize 50 randomly assigned (15% of the corpus) incident reports that had been marked by JiebaWSS for word segmentation locations. The examined proprietary words were then used as the set and the proprietary words marked by JiebaWSS in the other 280 incident reports were used as the set . Then was calculated using Equation (1) and the domain dictionary was updated iteratively. Since there was no content in the domain dictionary at the first update, and . In total, four updates were performed. The error values for each update are displayed in Table 1.
After that, this study added the domain dictionary and the HIT deactivation dictionary together to form JiebaWSS1.0 and then segmented the original corpus. The obtained splitting result still contained a large number of feature words, including many synonyms and meaningless words. The word separation result was further checked by professionals, and the synonyms and nonsense words found were added to the synonym dictionary and the deactivation dictionary respectively, thus forming the final JiebaWSS2.0. The text data consisting of words separated by spaces like English text was obtained by JiebaWSS2.0 to split the original corpus, which contained a total of 1879 feature words. Some of the contents are shown in Table 2. The text data in this format facilitated the computer to perform the next step of keyword extraction.
3.2. Key Cause Extraction Result
3.2.1. The Comparative Study of Keyword Extraction Algorithms
The subject keywords in the text are generally not marked up to the extent that the general meaning of the text can only be understood through the heading. Even if there are keywords marked out, they are only used to understand the general meaning of the text more conveniently, and understanding the text based on these keywords will cause some subjectivity [32]. In this study, a comparison experiment was designed to verify the superiority of the model before using the improved keyword extraction algorithm BM25W. To ensure the reliability of the comparison data, this study randomly selected ten unrelated texts in ten categories, such as art, sports, politics, and economy, from the Fudan University corpus, which had been marked with keywords by professionals. These 100 documents were then used as the corpus for the comparison experiment. Currently, keyword extraction algorithms are generally evaluated by comparing the result with the manually extracted keyword result through specific evaluation functions [32,46]. In this study, common accuracy and recall were chosen as evaluation functions as shown in Equations (13) and (14).
In order to satisfy the objectivity of the number of keywords extracted for different types and sizes of documents, the number of keywords extracted in Equation (13) is set to 5% of the total number of words in this text [32]. Domain lexicon was built based on keywords and experimental corpus. The BM25W hyperparameters and take default values of 1.5 and 0.75, respectively. The experimental result is shown in Table 3.
As can be seen from Table 3, only for the two corpuses Politics and Agriculture, the accuracies of TF-IDF are slightly higher than those of BM25W. For all other corpora, the accuracies of BM25W are significantly higher than those of TF-IDF. The recall rate of BM25W is mostly higher than that of TF-IDF as well. This further validated the desirability of the BM25W algorithm proposed in this study.
3.2.2. Keyword Extraction Result
In this study, the TF-IDF and BM25W models were used to extract the top one hundred feature words with importance scores from the word separation result as keywords. Table 4 shows the top ten extracted keywords of the two algorithms. It can be found that the length of the first ten keywords extracted by TF-IDF is mostly two Chinese characters, and such words are difficult to express the key contents of the accident report. In particular, the word “Enterprise” is not critical but has the first TF-IDF importance score, which is obviously due to its high frequency. In contrast, the BM25W model effectively suppressed the effect of frequency on importance and gave more prominence to words longer than two Chinese characters. For example, one of the key words “Safety education and training” is already specific to the daily safety education and training of employees in chemical production companies.
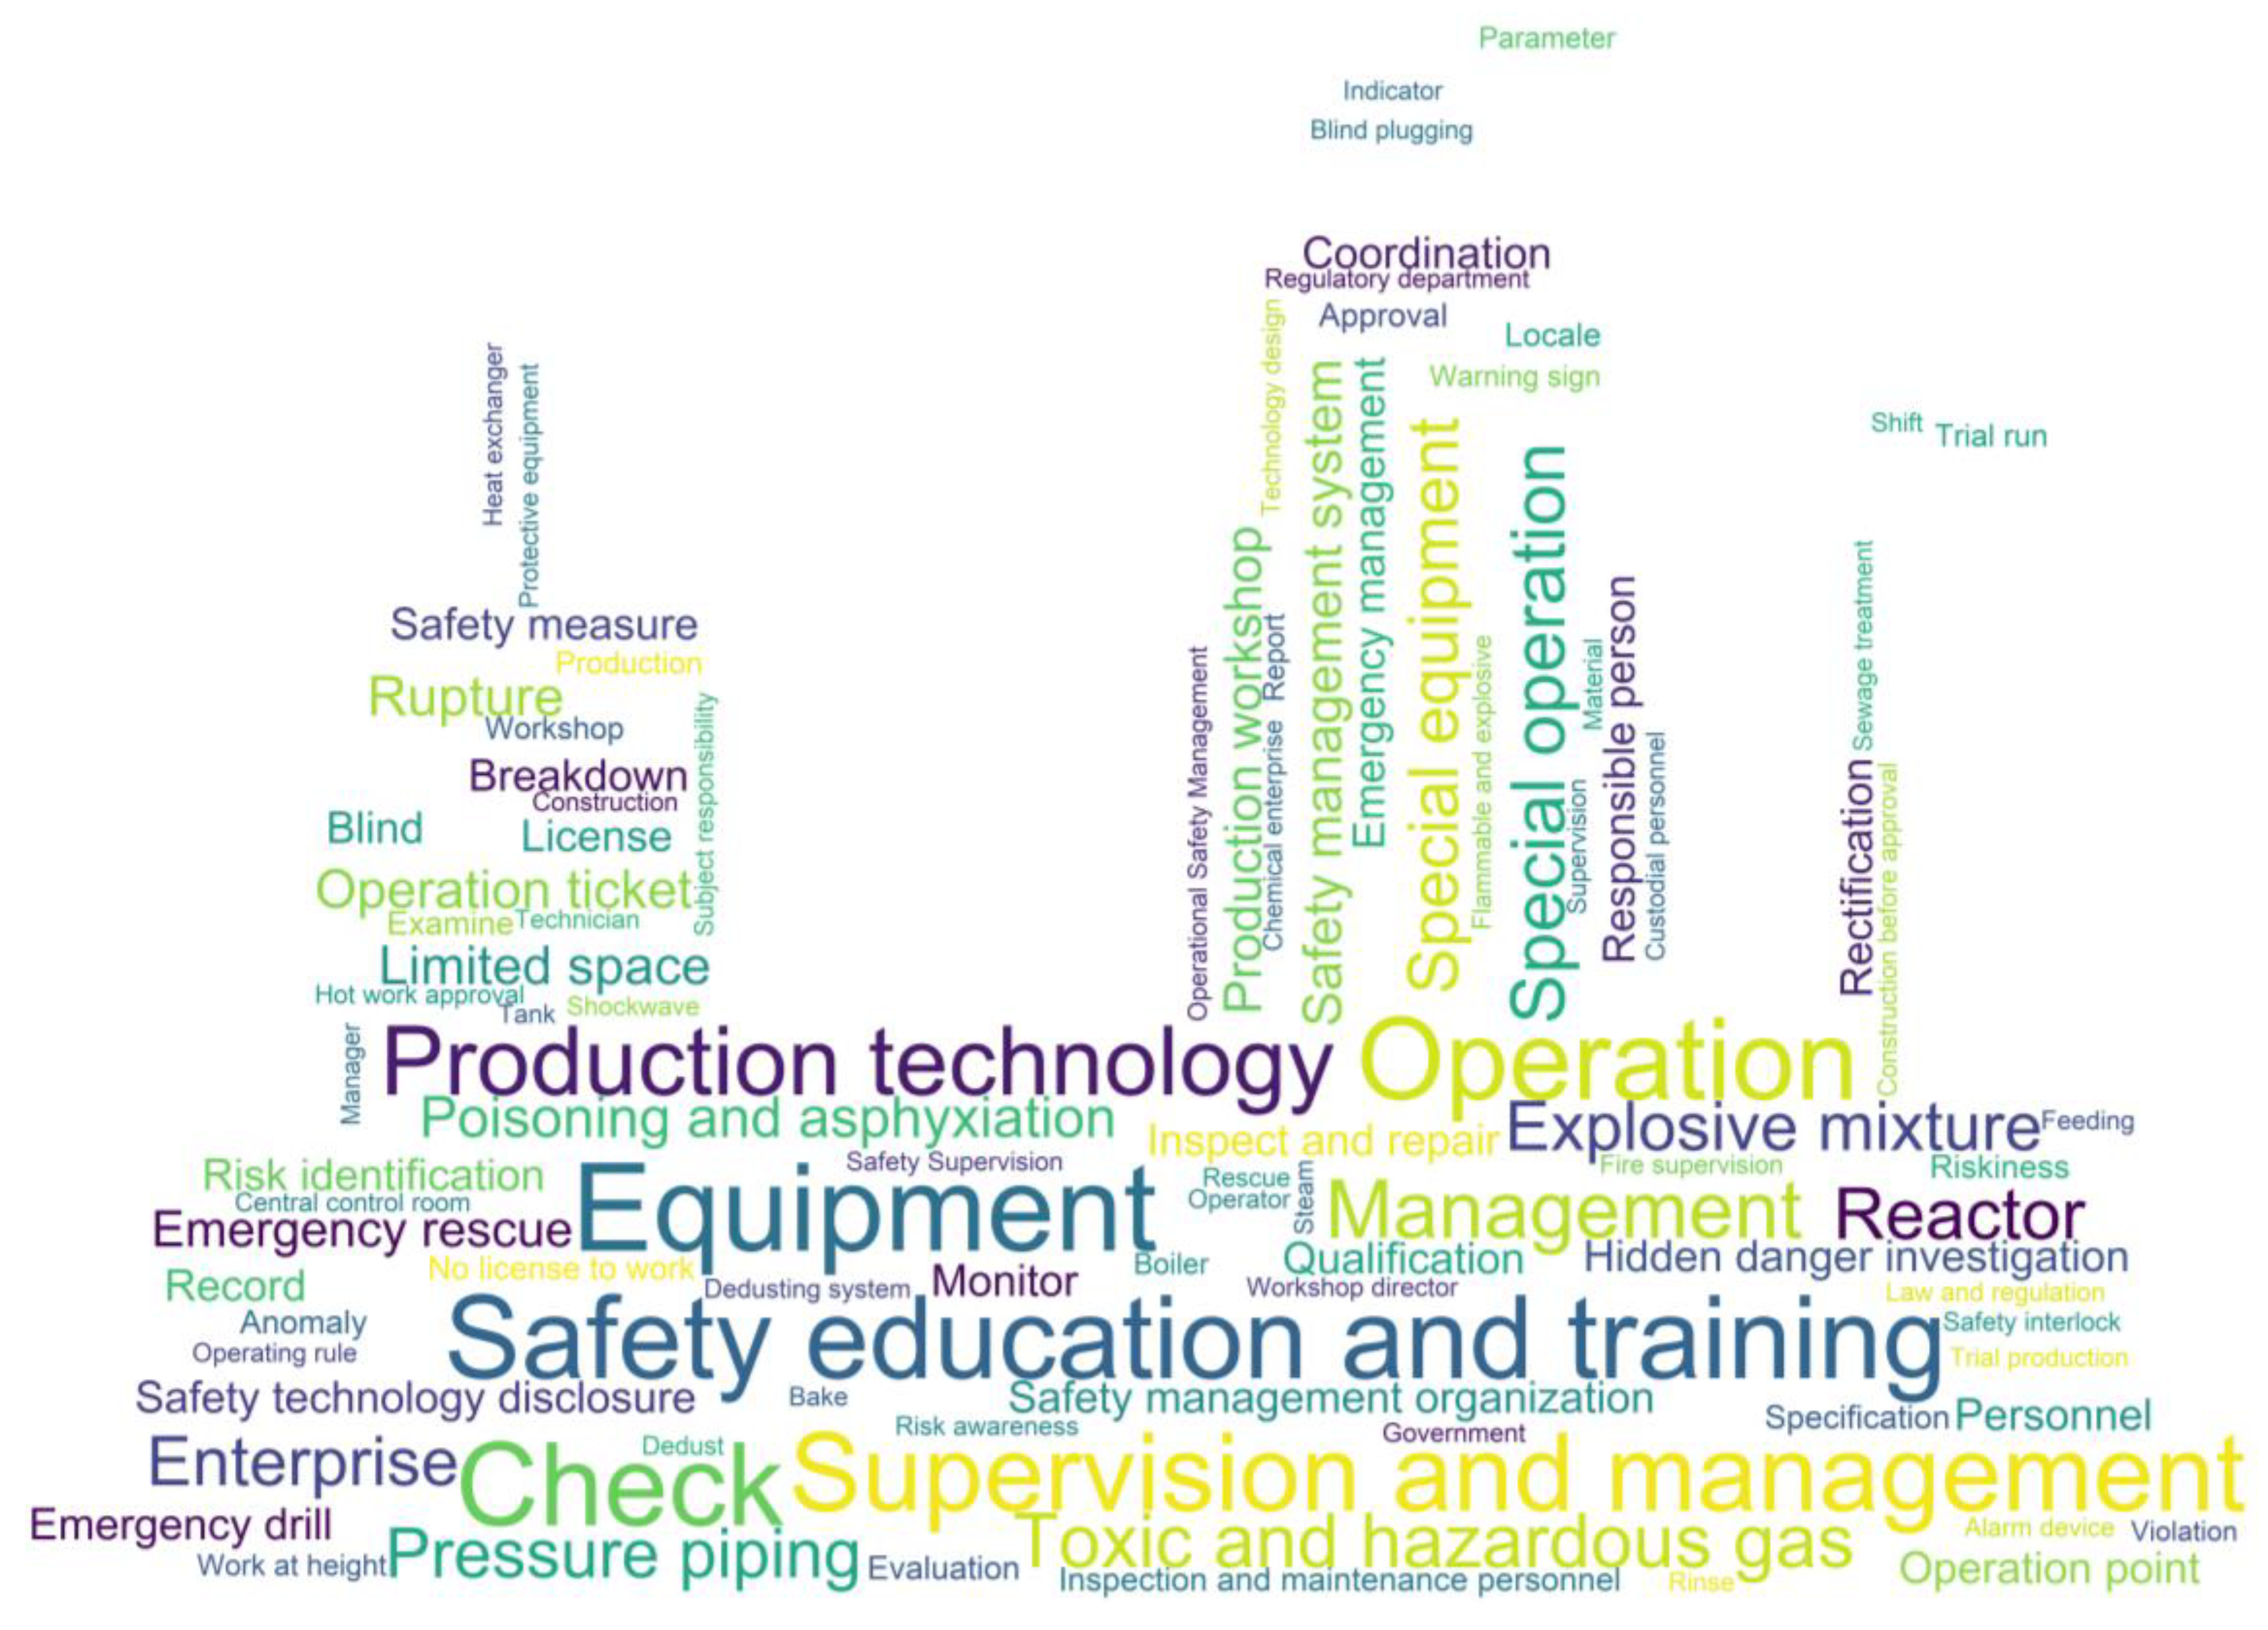
The top 100 keywords extracted by the BM25W model were presented through a word cloud. The scores obtained from Equation (6) were used as the frequency of words in the word cloud analysis, as shown in Figure 7.
Word cloud analysis provides a quick and visual representation of key information. The larger the word in Figure 7, the more important it is in the incident report. It can be found that “Equipment”, “Supervision and management”, and “Safety education and training” all have a pivotal role in the accident investigation reports.
3.2.3. Result of Key Causes Generation
As mentioned earlier, after extracting the top 100 keywords, the key causal factors, i.e., safety risk factors, need to be derived based on the analysis of the collocation of these keywords with the remaining 1779 non-key feature words. In this study, the TDM was first obtained according to Equation (7), with a size of 330 × 1879, and part of it is shown in Table 5.
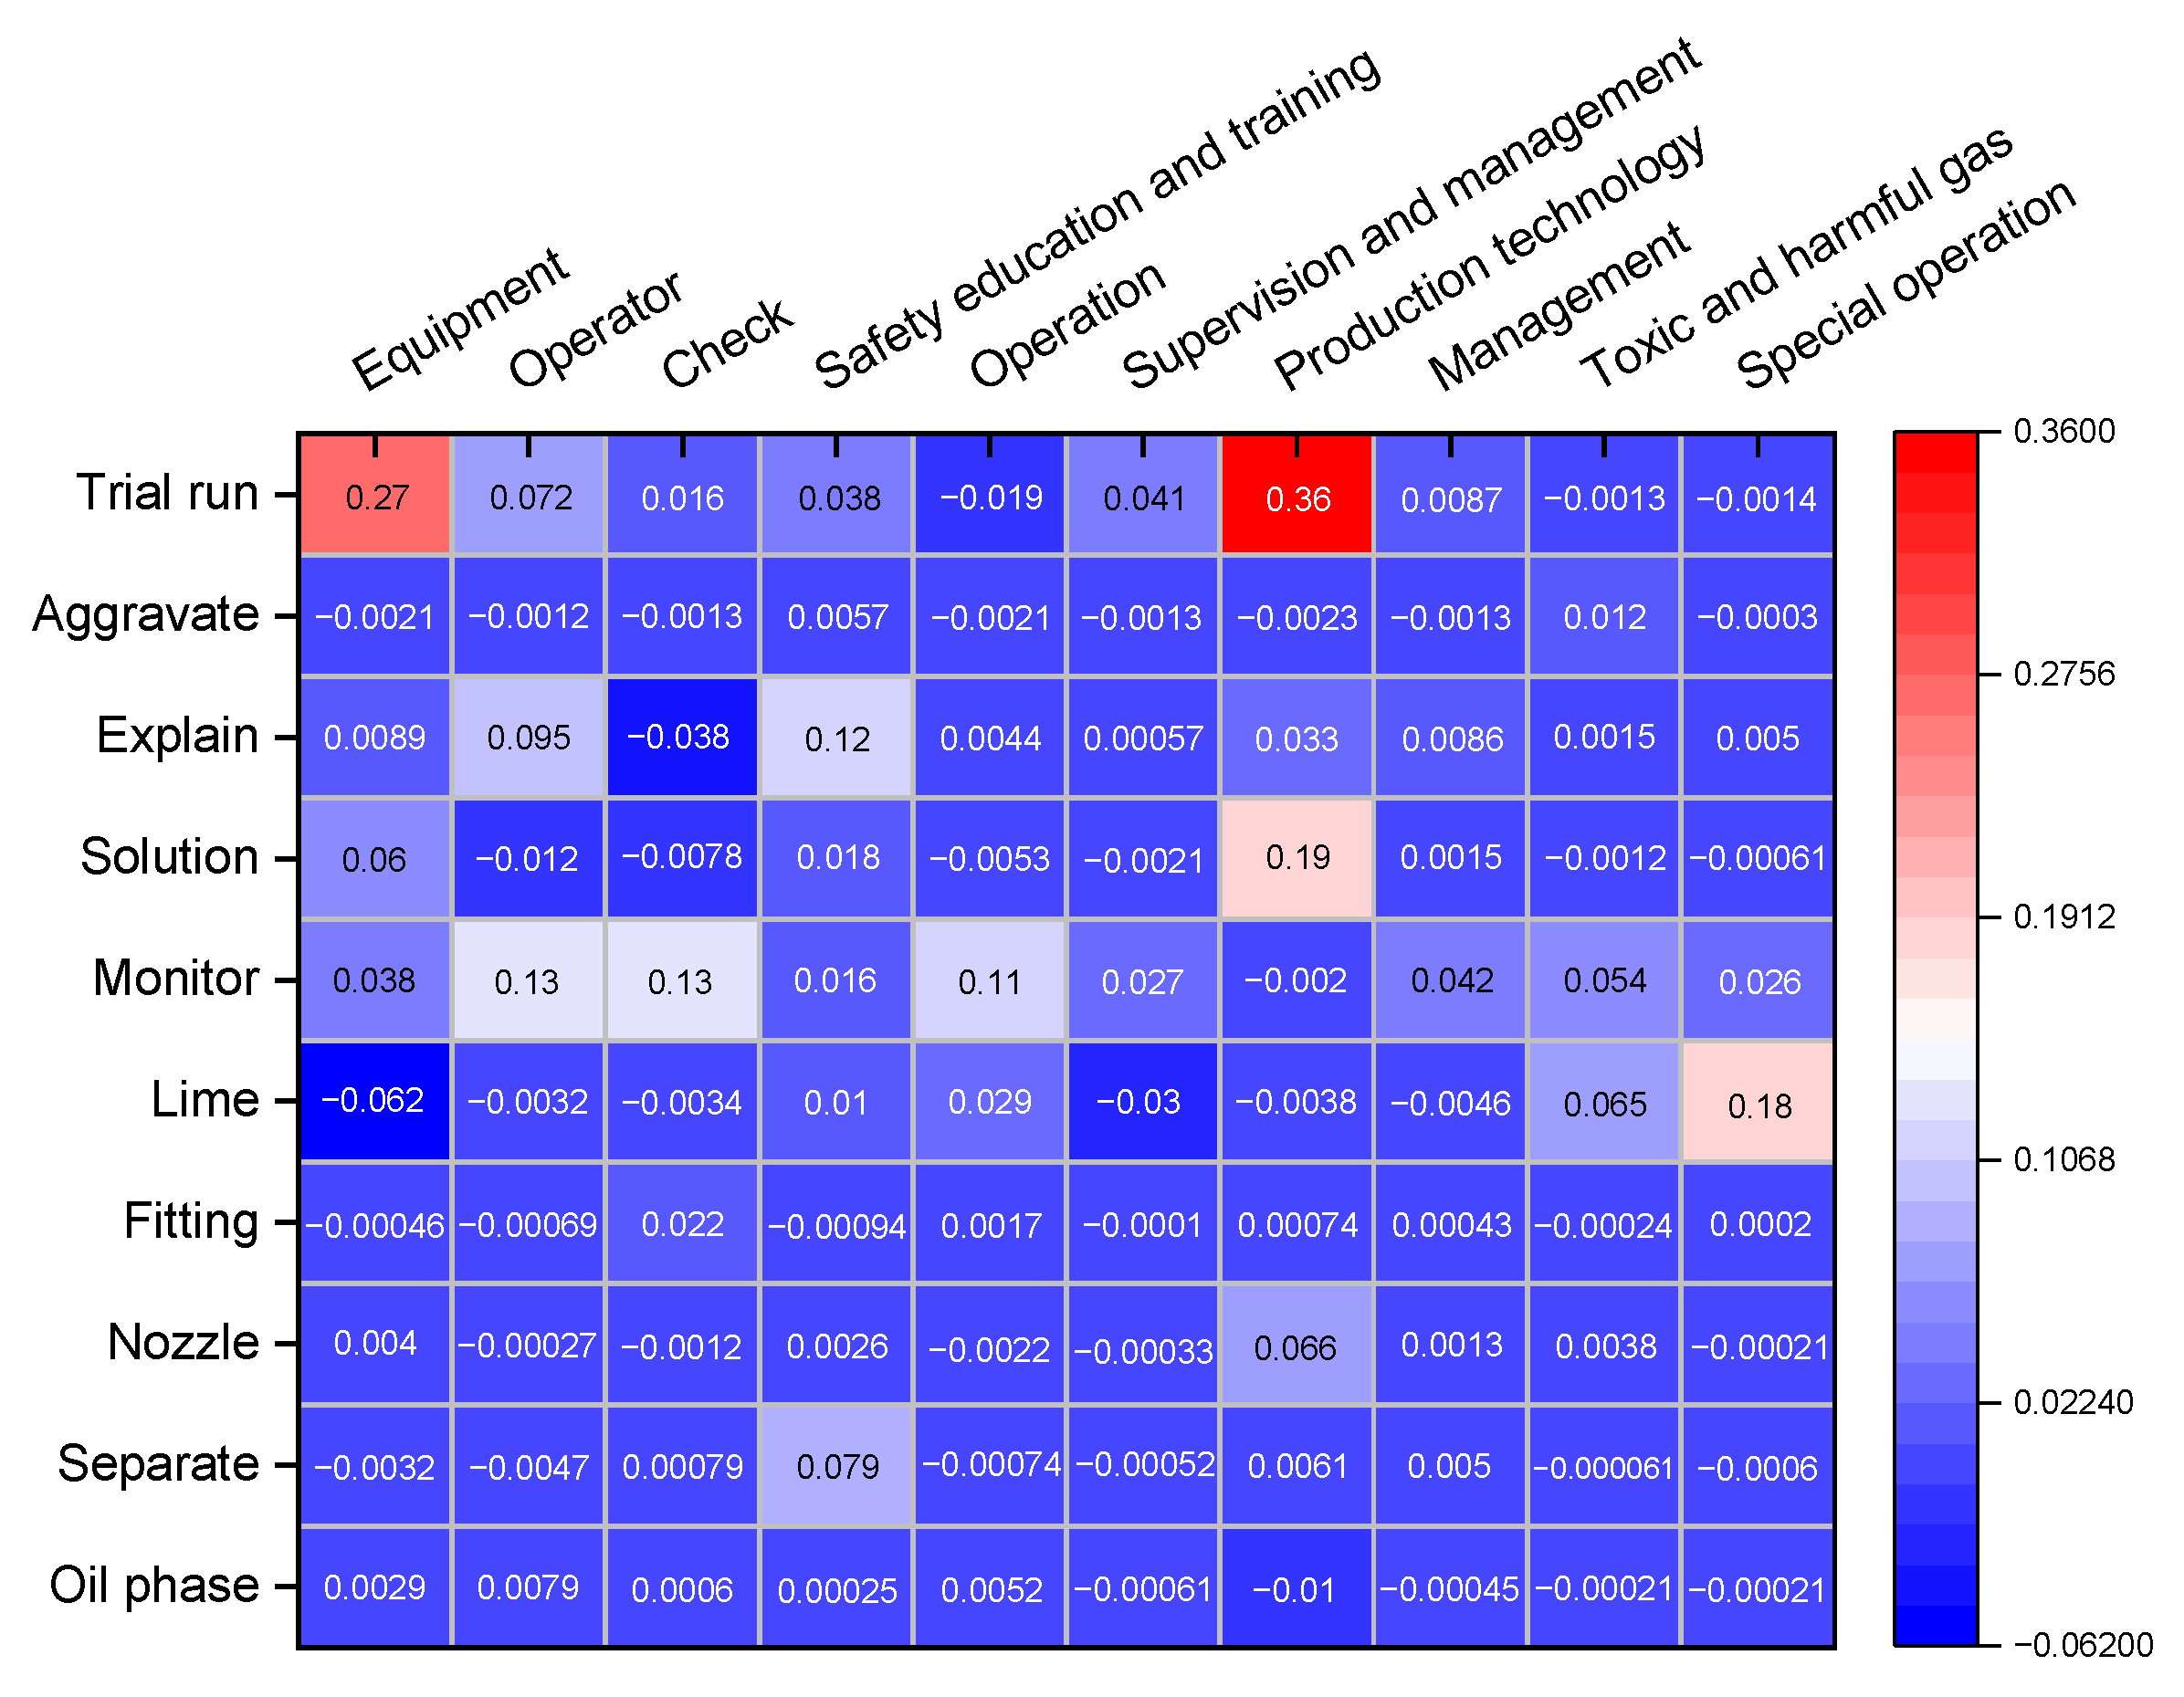
Then the correlation coefficients of keywords and non-key feature words were calculated according to Equation (8). Some of the correlation coefficients are plotted as a heat map, as shown in Figure 8.
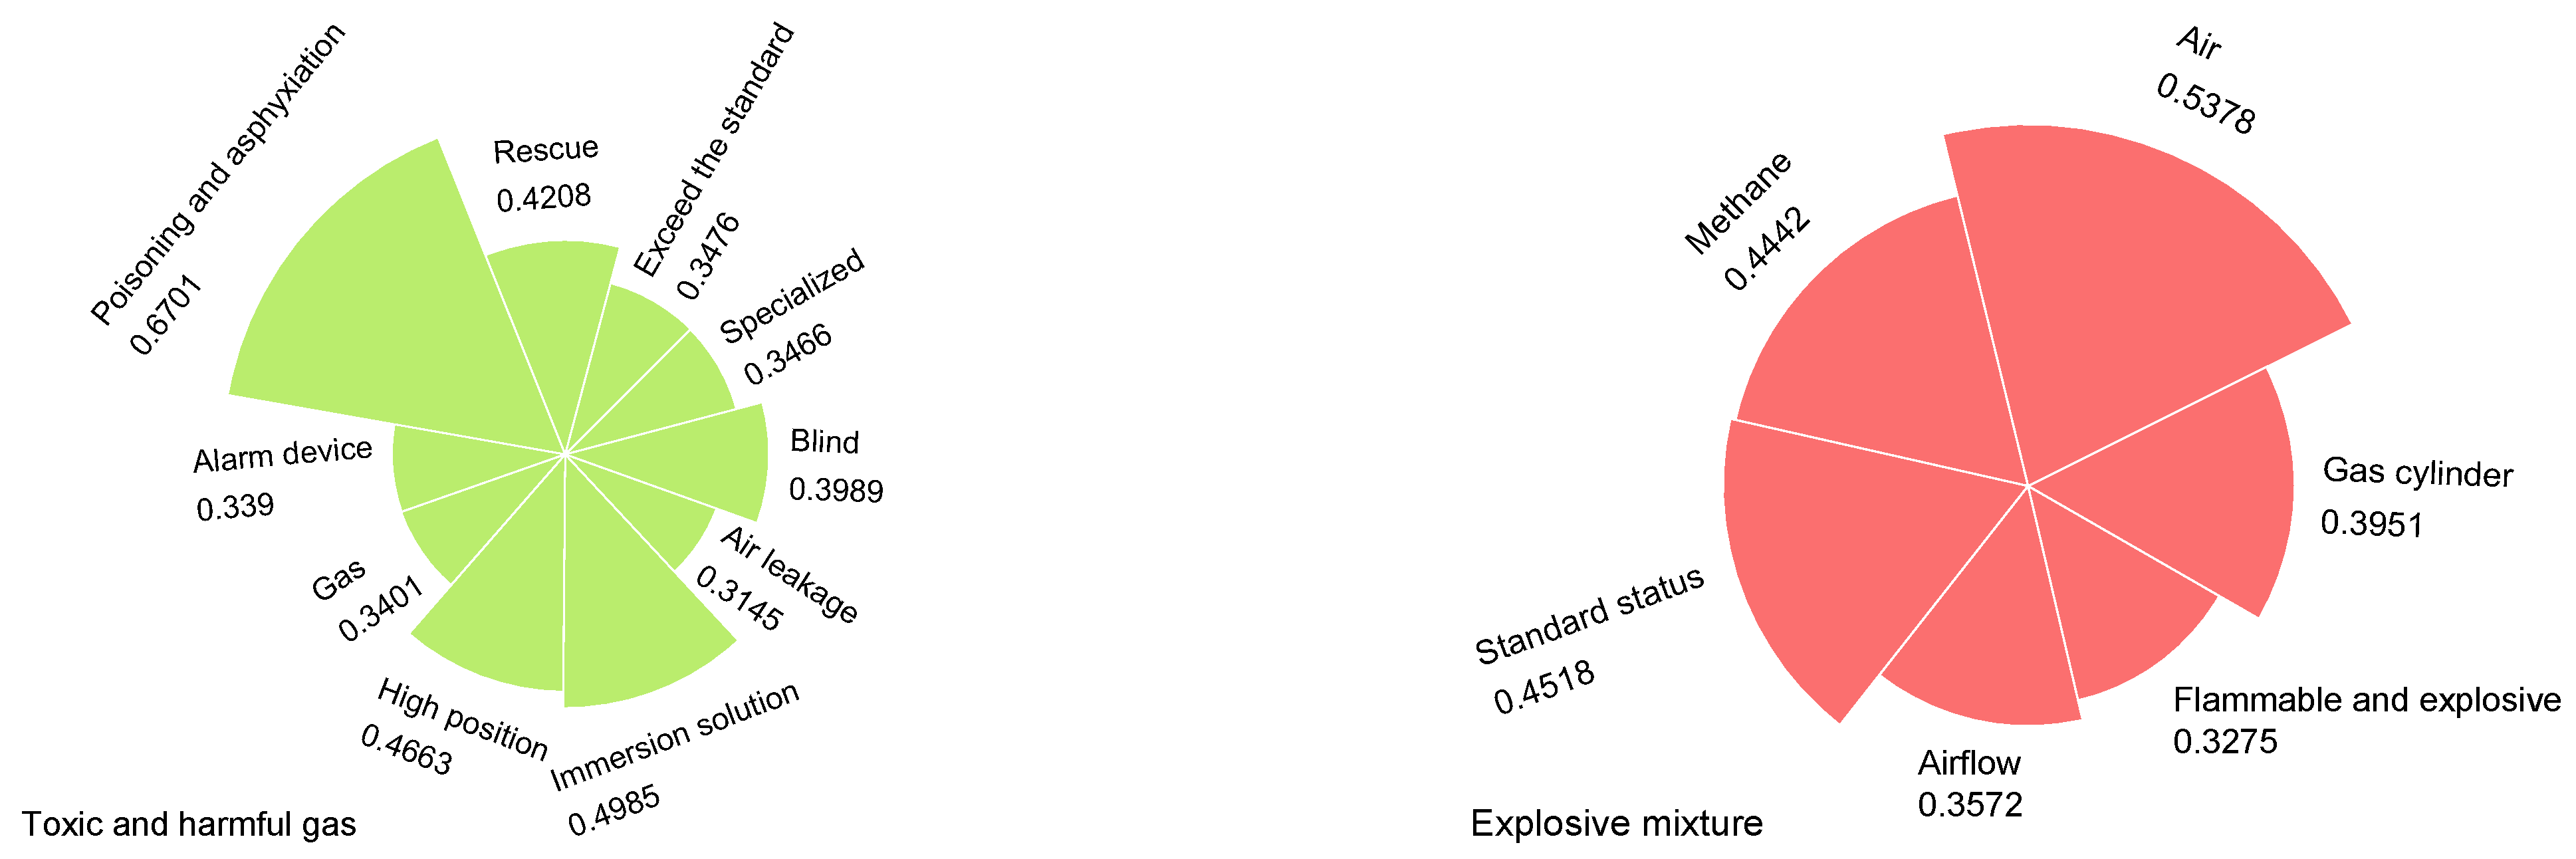
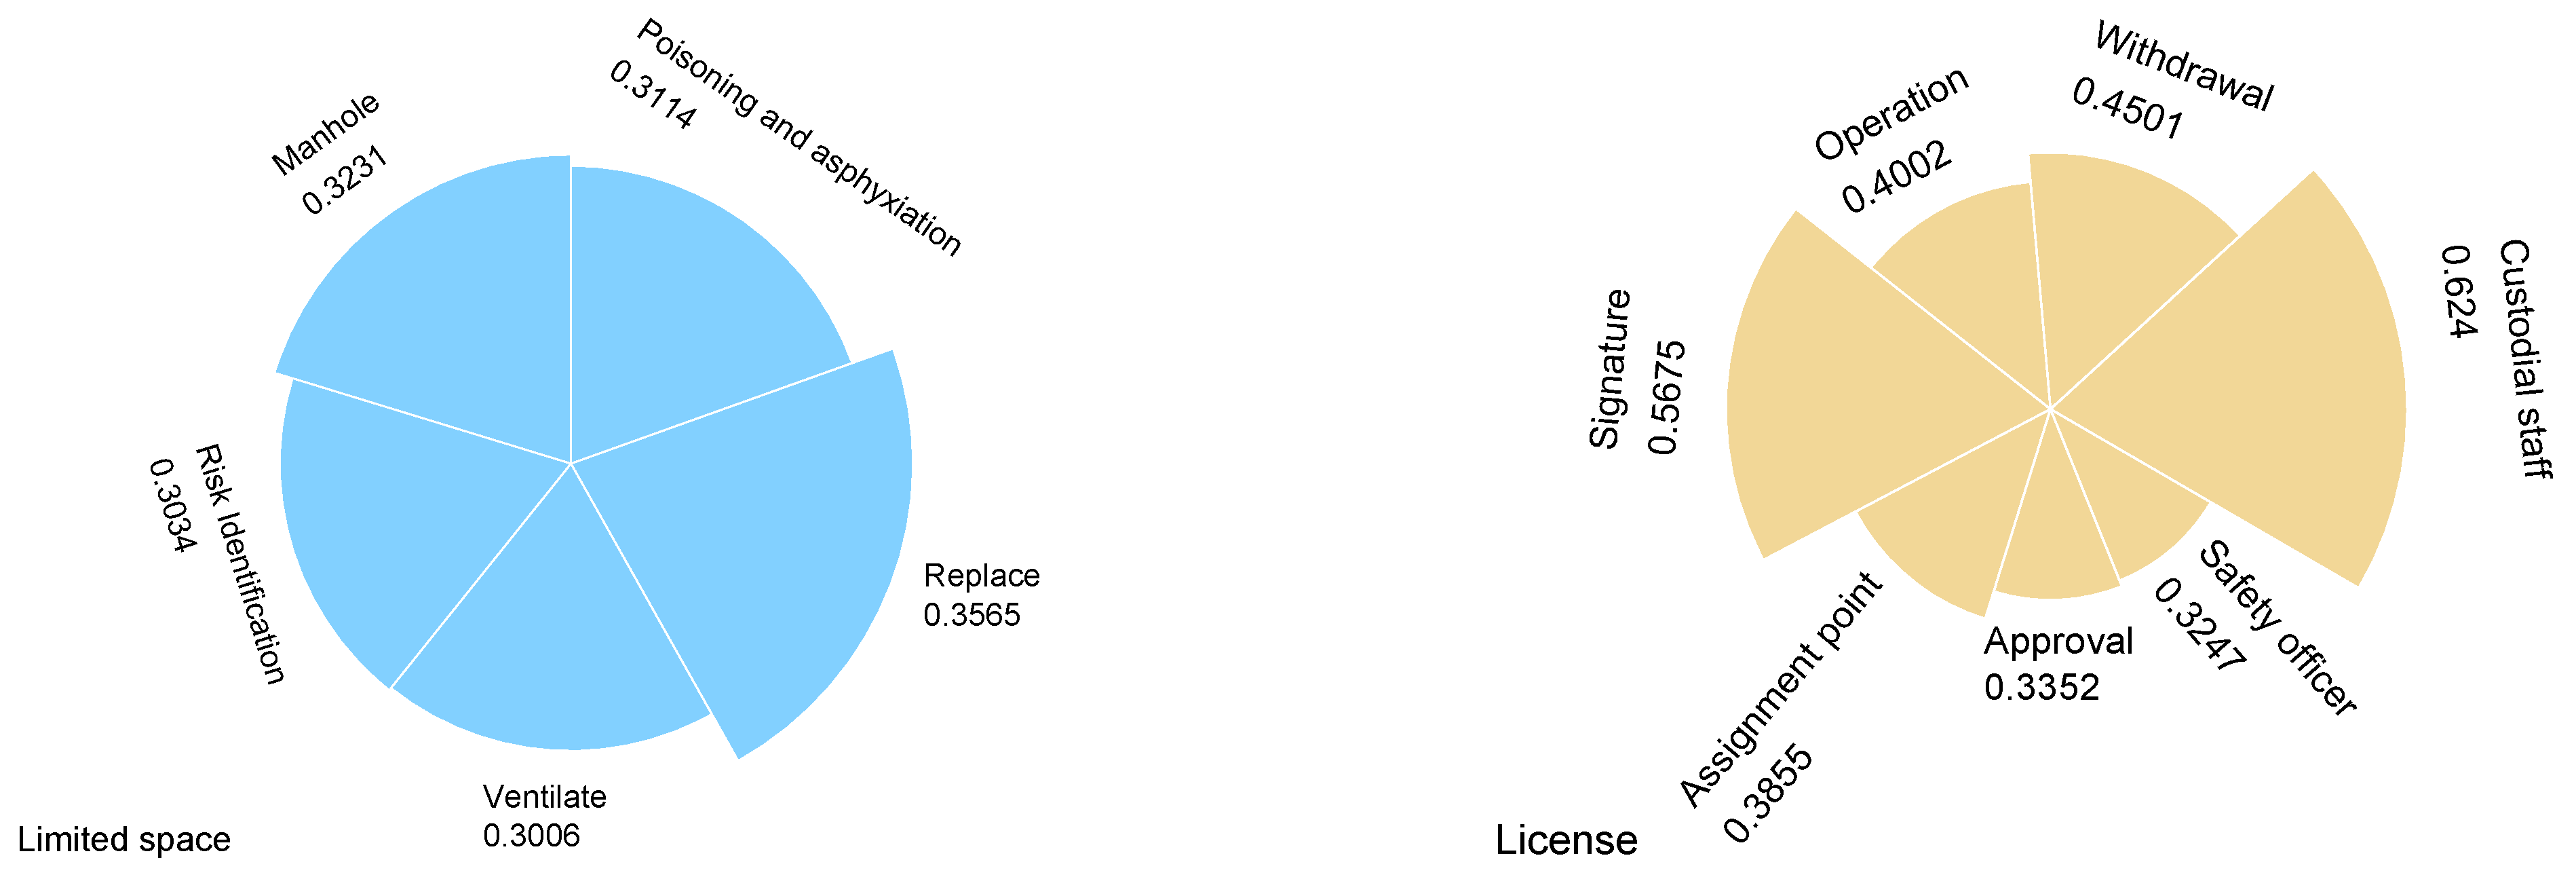
From Figure 8, it can be seen that the correlation coefficient between the keyword “Production technology” and the non-key feature word “Trial run” is 0.36, which has a very strong correlation. This is because operators generally perform the “Trial run” operation before starting a particular production technology. The negative correlation between “Production technology” and “Aggravate” is evident because the two terms do not have any previous association and thus no safety risk factor can be derived. Then the non-weakly correlated and non-negatively correlated words were filtered out (correlation coefficient greater than or equal to 0.3). In this paper, the keyword-centered combinations of keywords and non-key feature words were constructed. Some of the combinations are shown in Figure 9.
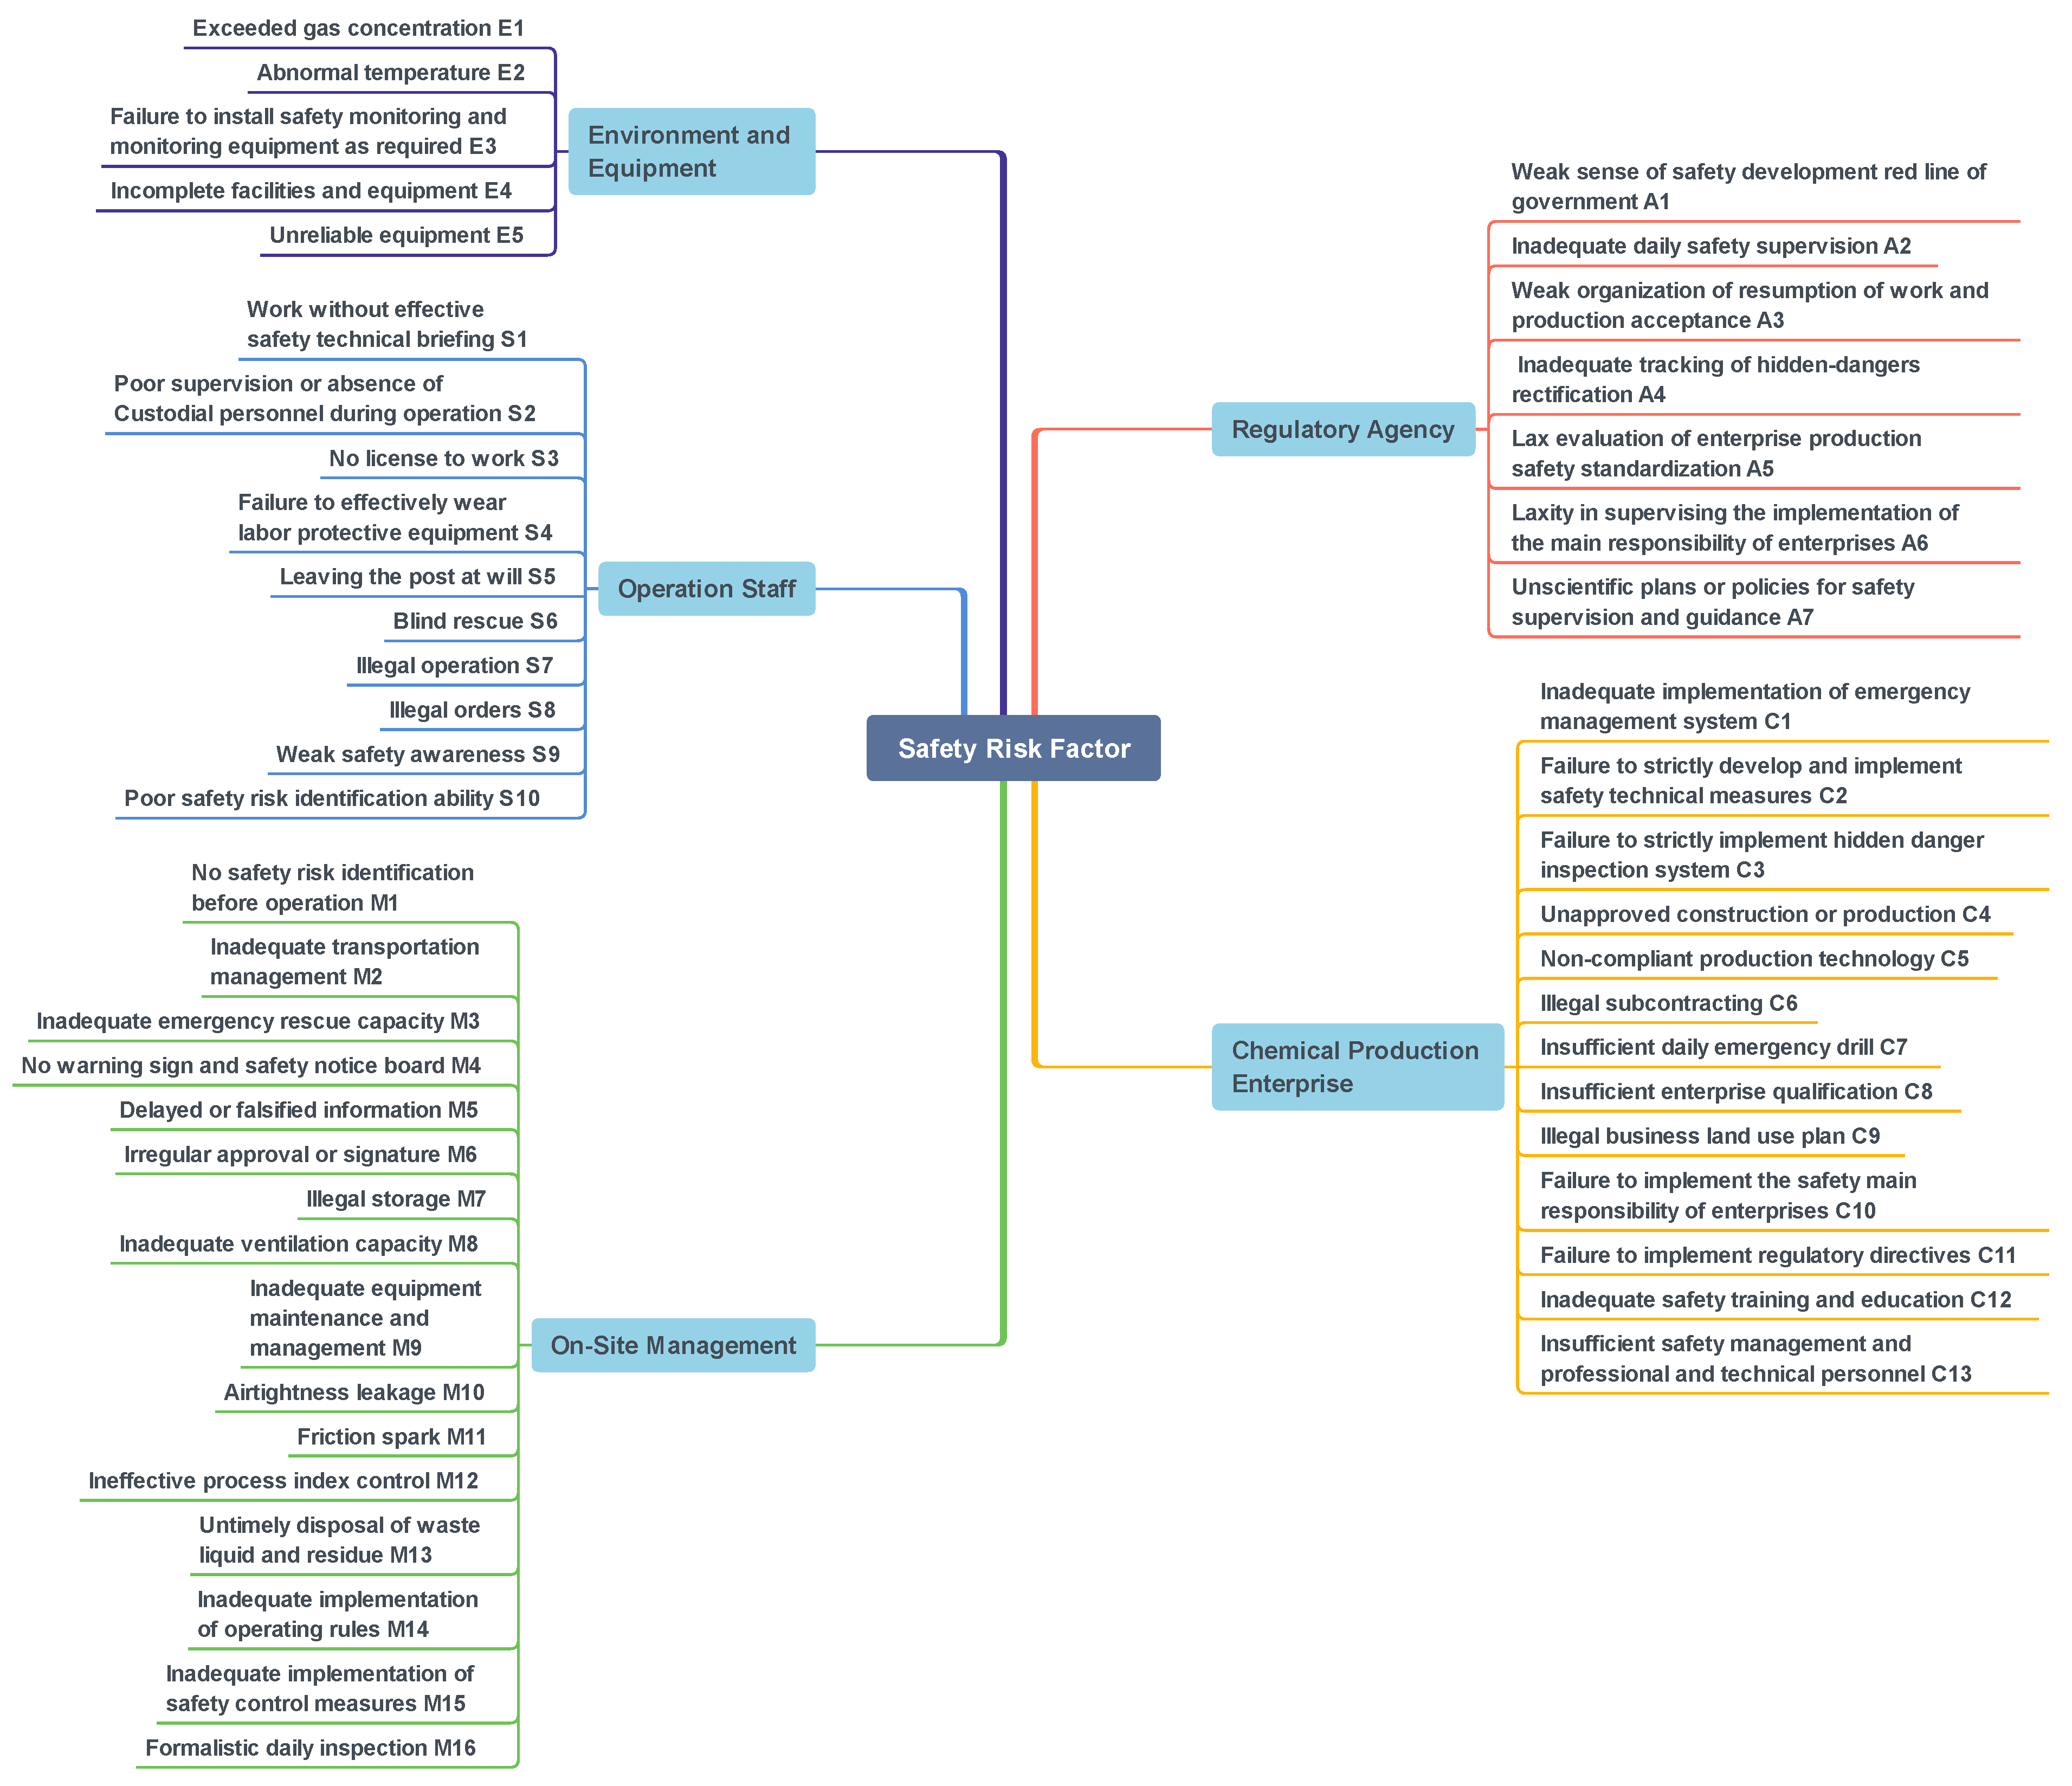
These combinations were then analyzed to identify the reflected security risk factors. According to the risk management model of the socio-technical system, these safety risk factors were classified into five major categories: regulatory agency (seven), chemical production enterprise (13), on-site management (16), operation staff (ten), environment and equipment (five). These five categories were used as abbreviations with the letters A, C, M, S, and E, as shown in Figure 10. A total of 51 safety risk factors, of which those belonging to on-site management are the most numerous and those belonging to chemical production enterprises are the second most numerous because most of the causes of chemical production accidents occur in the on-site management of enterprises. In total, there are 51 safety risk factors. Among them, those belonging to on-site management are the most numerous, and those belonging to chemical production enterprises are the second most numerous. This is because most of the causes of chemical production accidents occur in the on-site management of enterprises.
3.3. Association-Rule Analysis Result
This study obtained the transaction set for association-rule mining based on these safety risk factors. Then the Apriori algorithm was used to mine the association rules of safety risk factors from the transaction set in order to find out the influence propagation among the key causal factors. In this study, several experiments were conducted according to Equations (9) and (10), and finally the minimum support, minimum confidence, and minimum lift were set to 0.09, 0.4, and 1.5, respectively. Thus, preliminary association-rule mining results were obtained. In order to reduce the instability caused by the long number of terms, the association rules with the number of antecedent terms less than or equal to two and the number of consequent terms of one were selected in this study. Finally, 294 association rules were obtained. Some of these association rules are shown in Table 6.
The strong association between safety risk factors was found by association-rule mining. For example, when S4 (Failure to effectively wear labor protective equipment) and C12 (Inadequate safety training and education) are present at the same time, it is likely to result in S6 (Blind rescue) of the personnel on site at the time of the accident. Especially in chemical production accidents, the casualties and damages at the time of the original initial accident are generally small. However, the daily safety training and education of enterprises is not sufficient, which can lead to irregular response to accidents and frequent mistakes of employees. Coupled with the lack of effective wearing of labor protective equipment, it is likely to cause more casualties and losses in places where toxic and hazardous gases are dense.
3.4. Bayesian Network Analysis Result
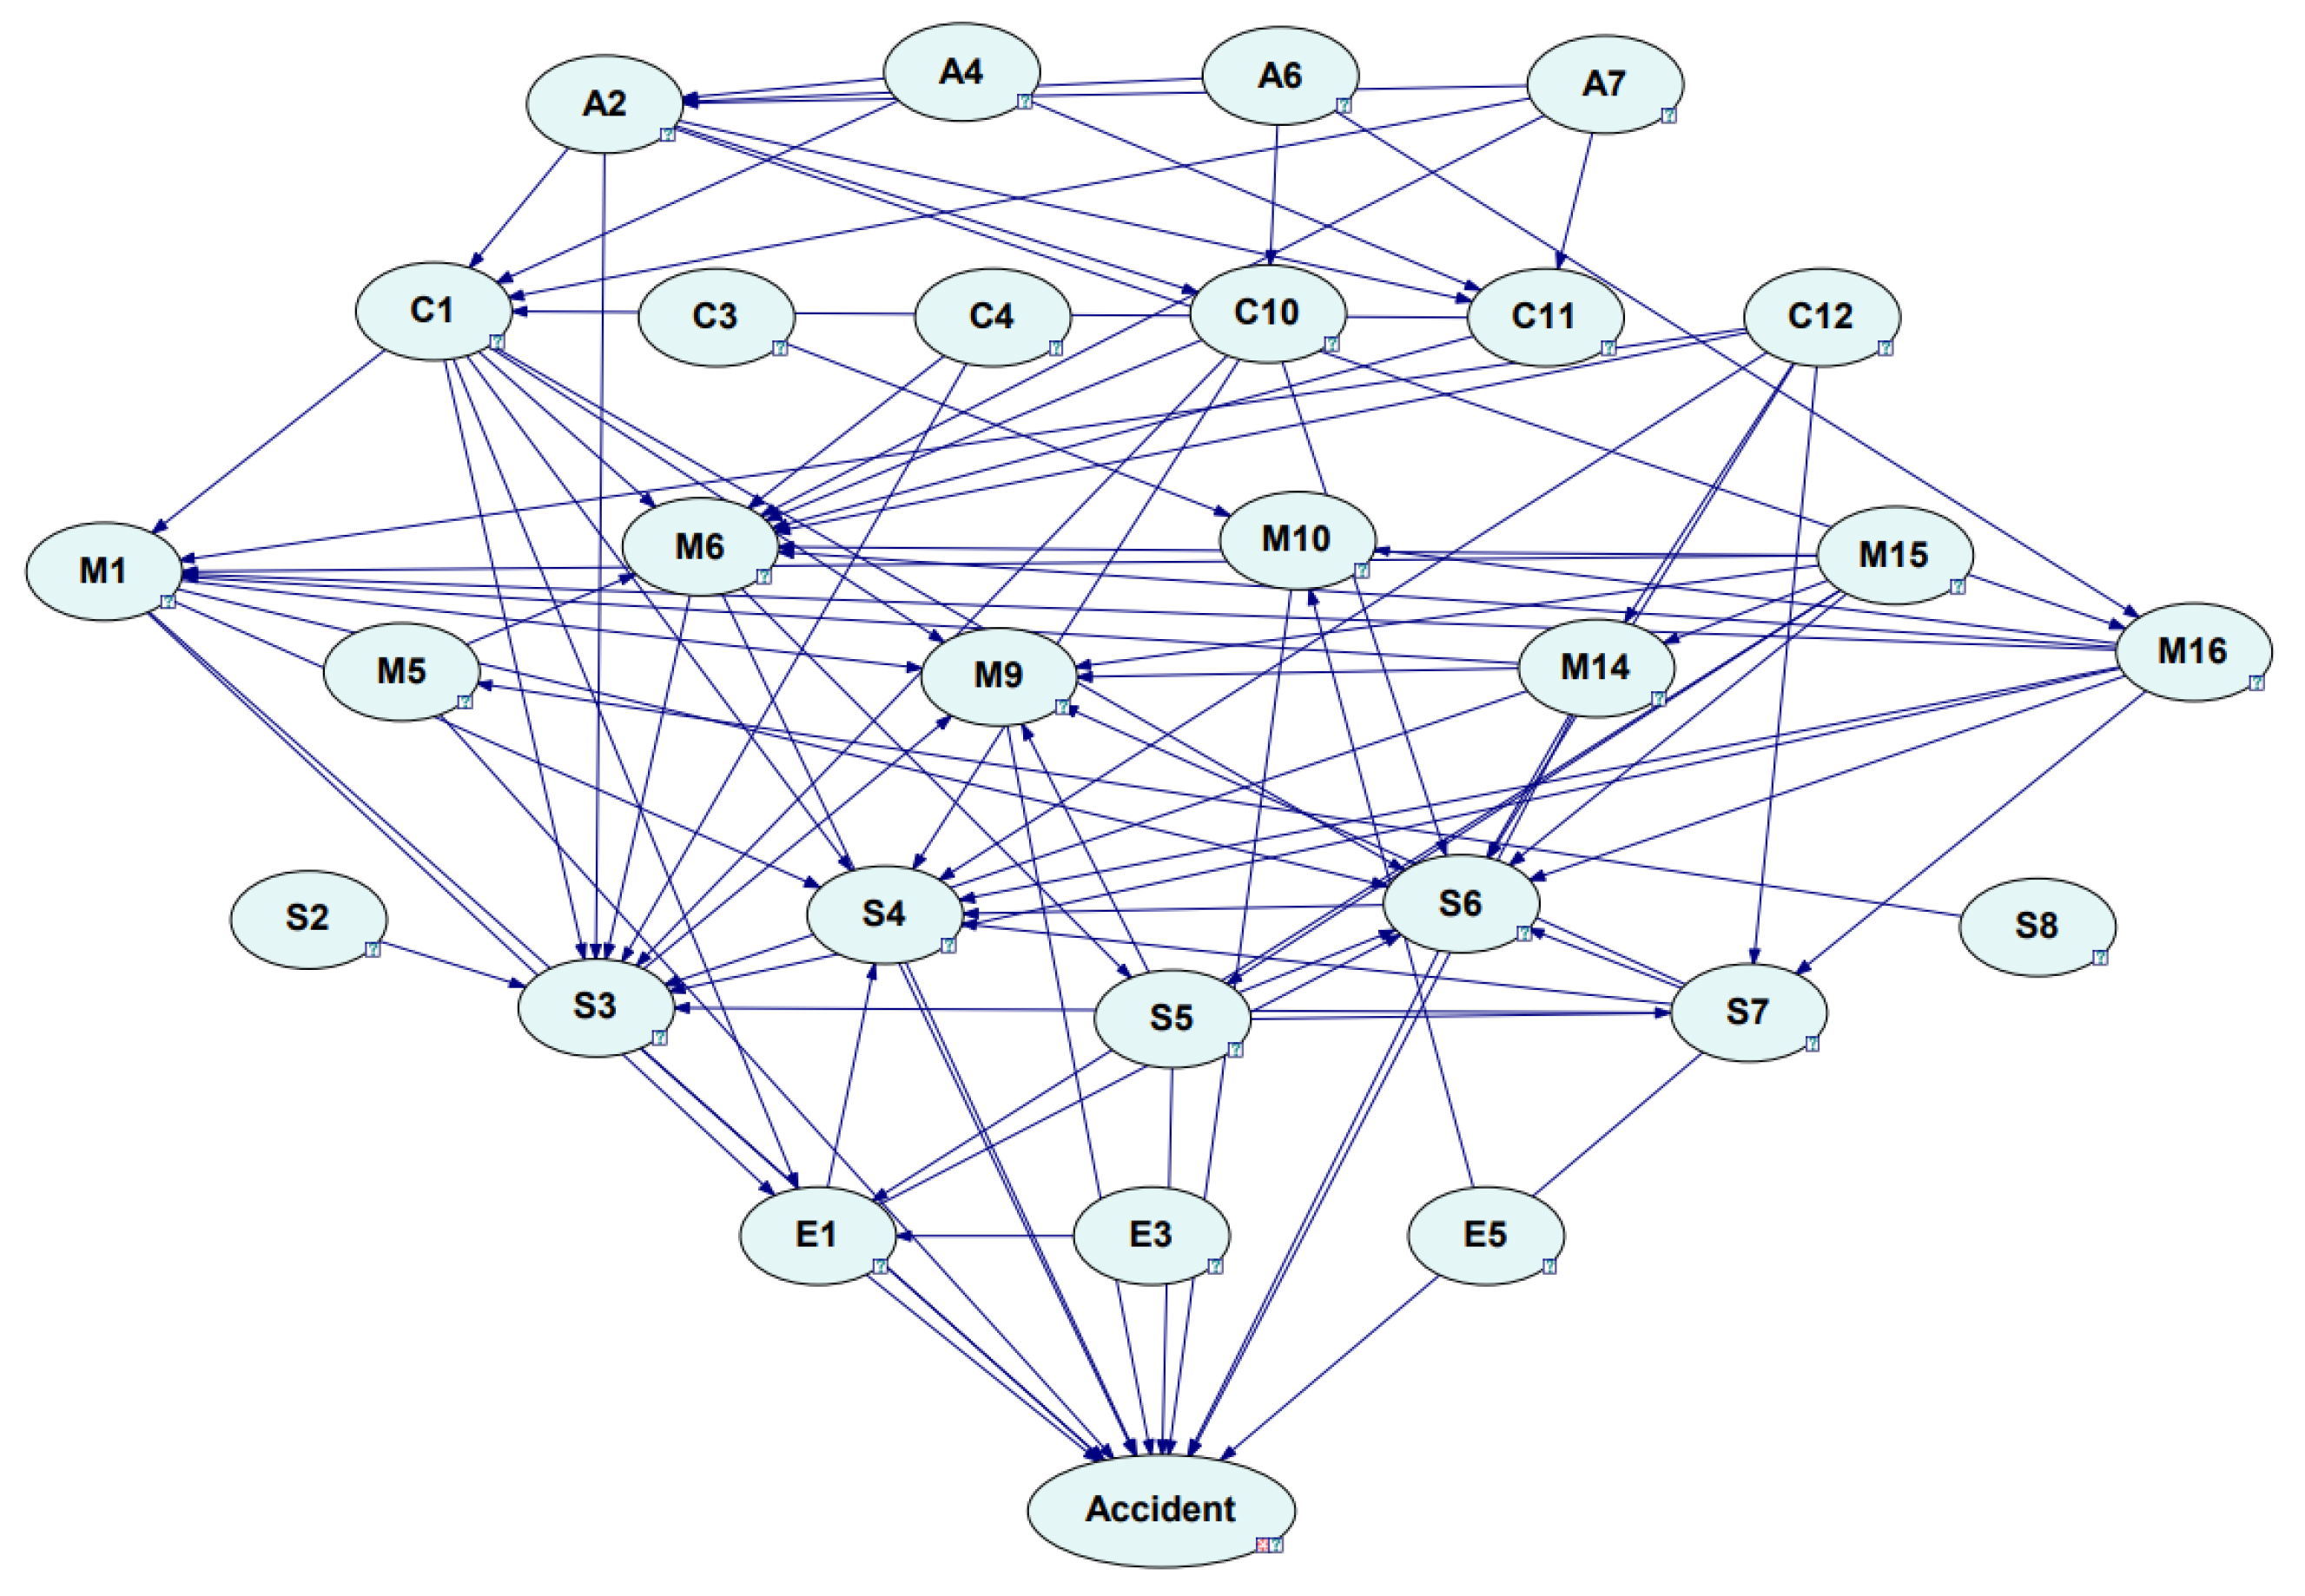
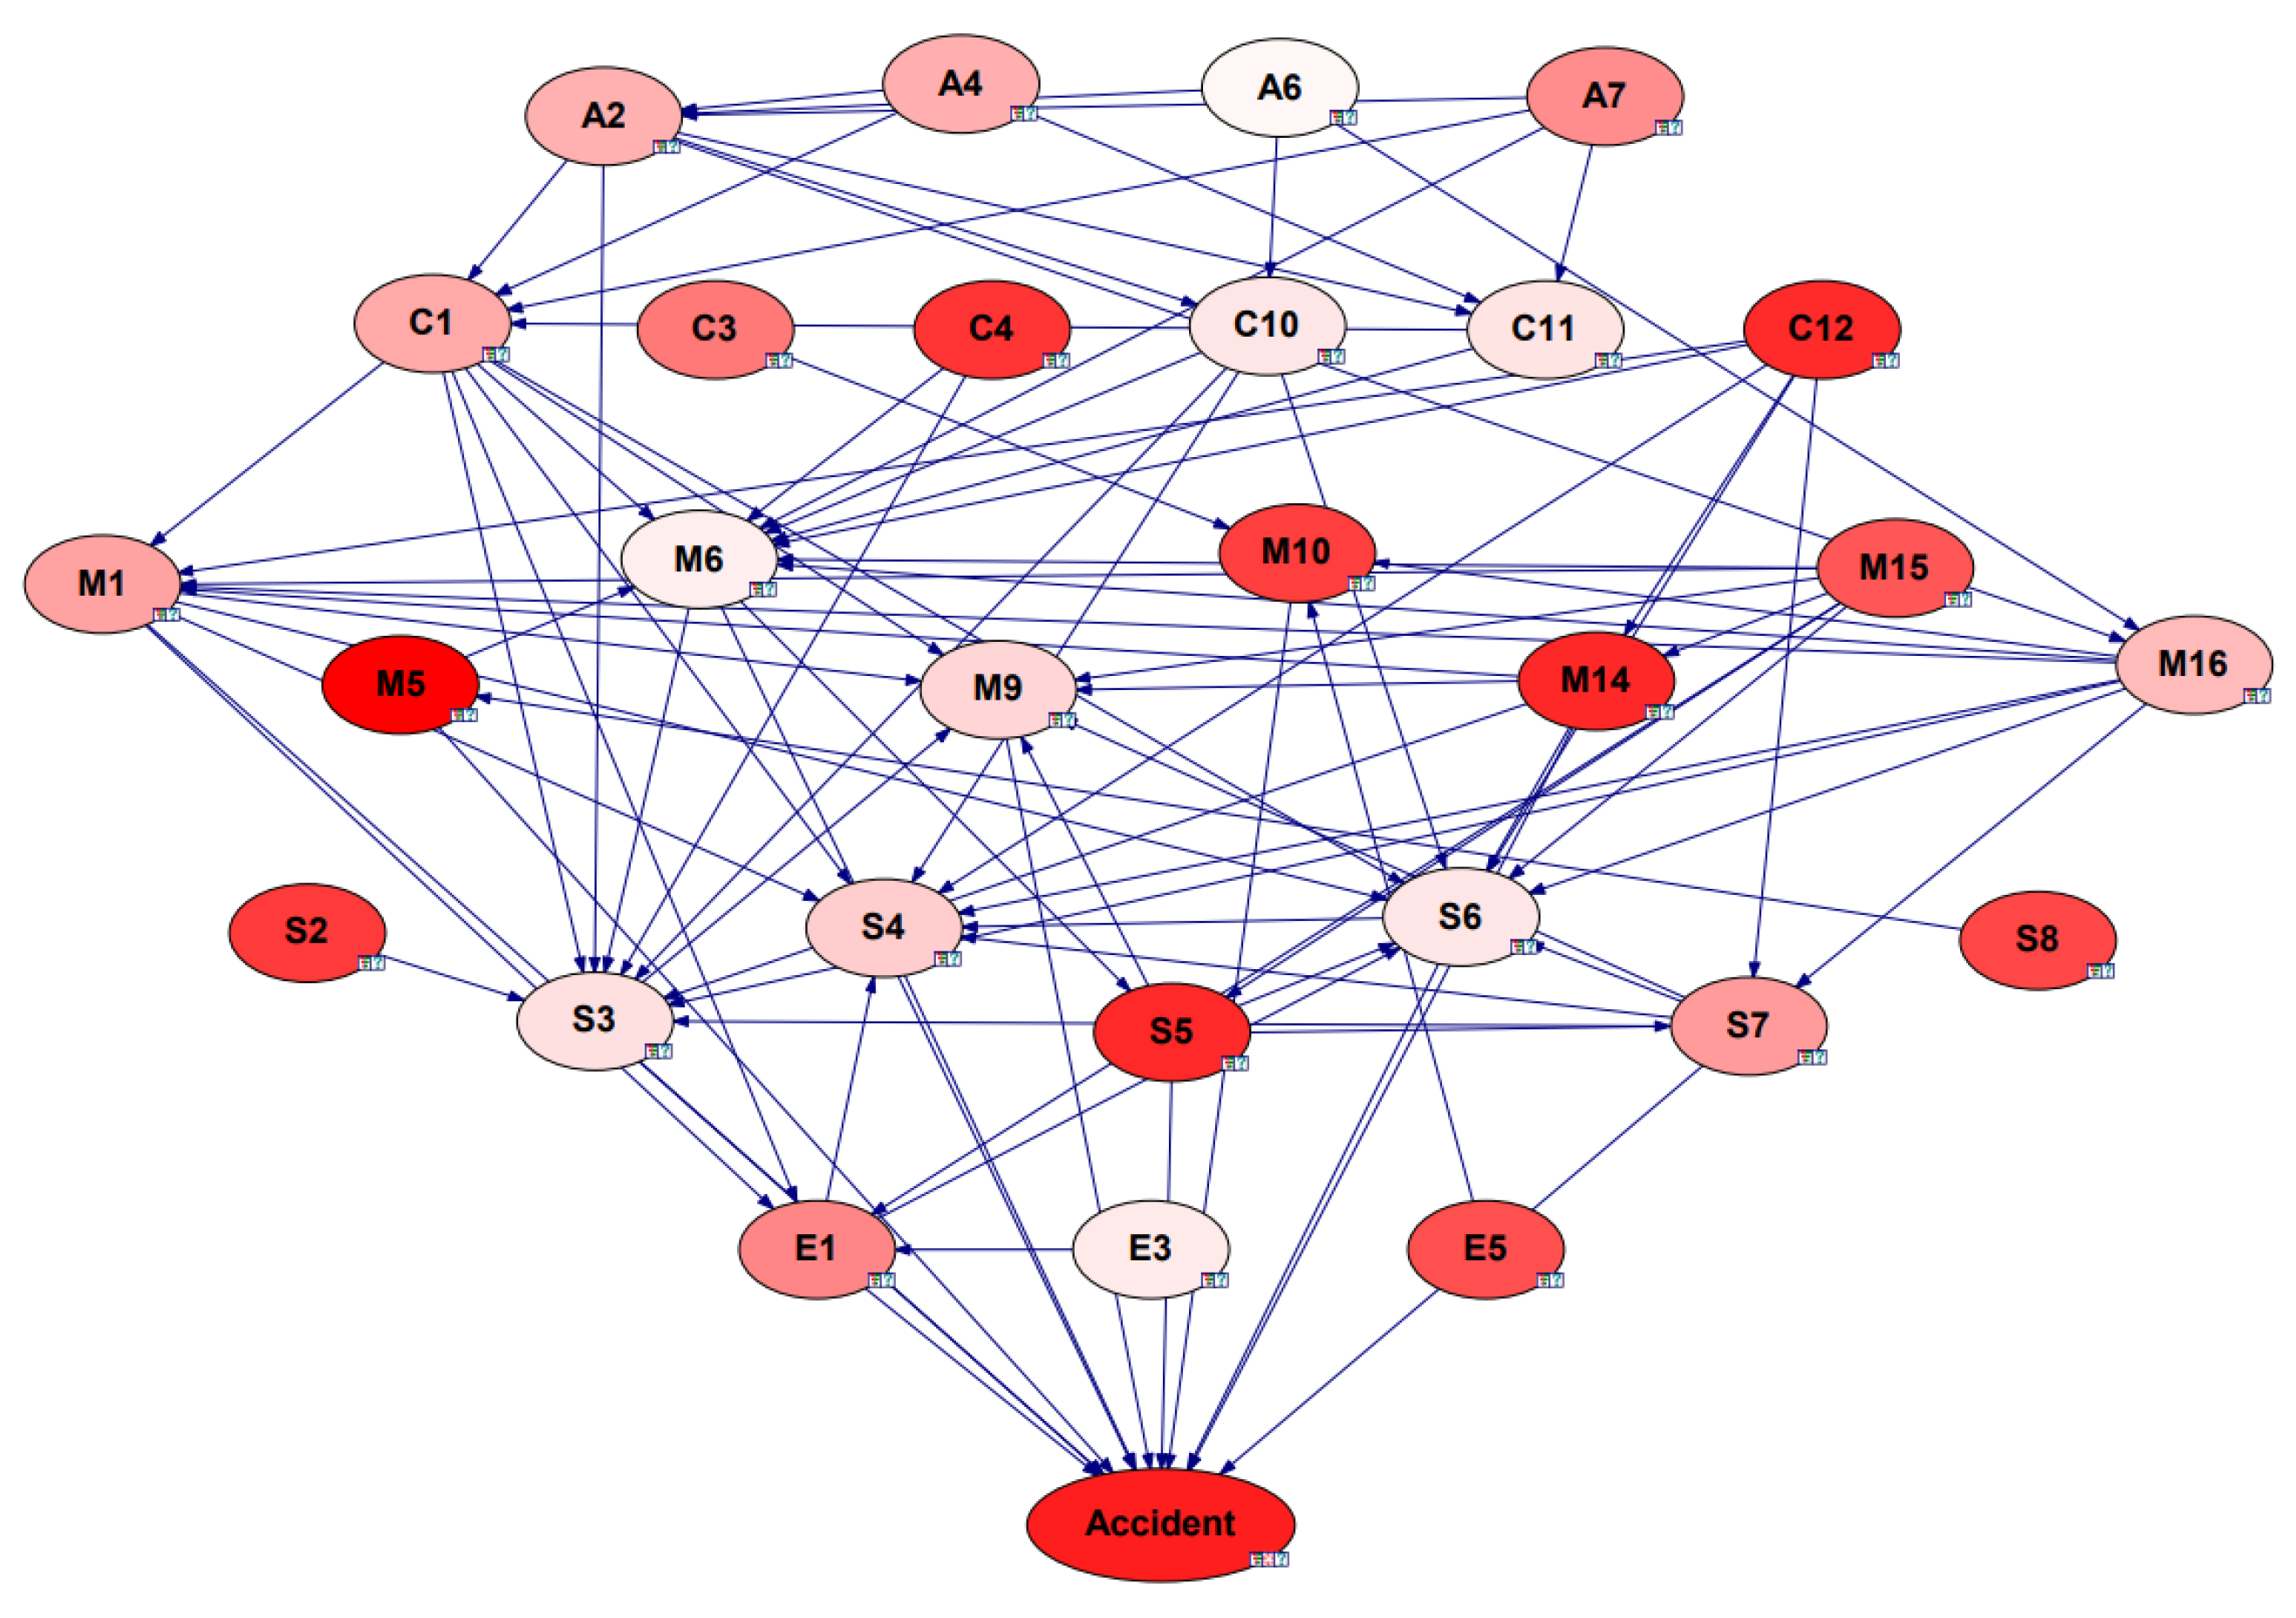
In this study, GeNIe 4.0 software was used to build the Bayesian network. The antecedent and consequent terms of the association rule results were used as the nodes of the Bayesian network, and the symbol “⇒” was used as the directed link. Through expert screening, links that did not match the reality and could lead to back propagation or form closed loops were removed, resulting in the Bayesian network topology of safety risk factors, as shown in Figure 11. “Accident” was newly created as a node to represent chemical production accidents.
Then the transaction set in association-rule mining was converted to One-Hot Encoding. In the encoding, the “1” was converted to “Y” and the “0” was converted to “N”. The data of the node “Accident” are derived from the accident level of each accident investigation report. Since there are too few special major accidents in the corpus to be representative, we combined major accidents and special major accidents into major and above accidents, which are recorded as MA, while general accidents are recorded as G and larger accidents as L. The vector consisting of G, L, and MA, was also added to One-Hot Encoding together as data for parameter learning of the Bayesian network in Figure 11.
3.4.1. Sensitivity Analysis
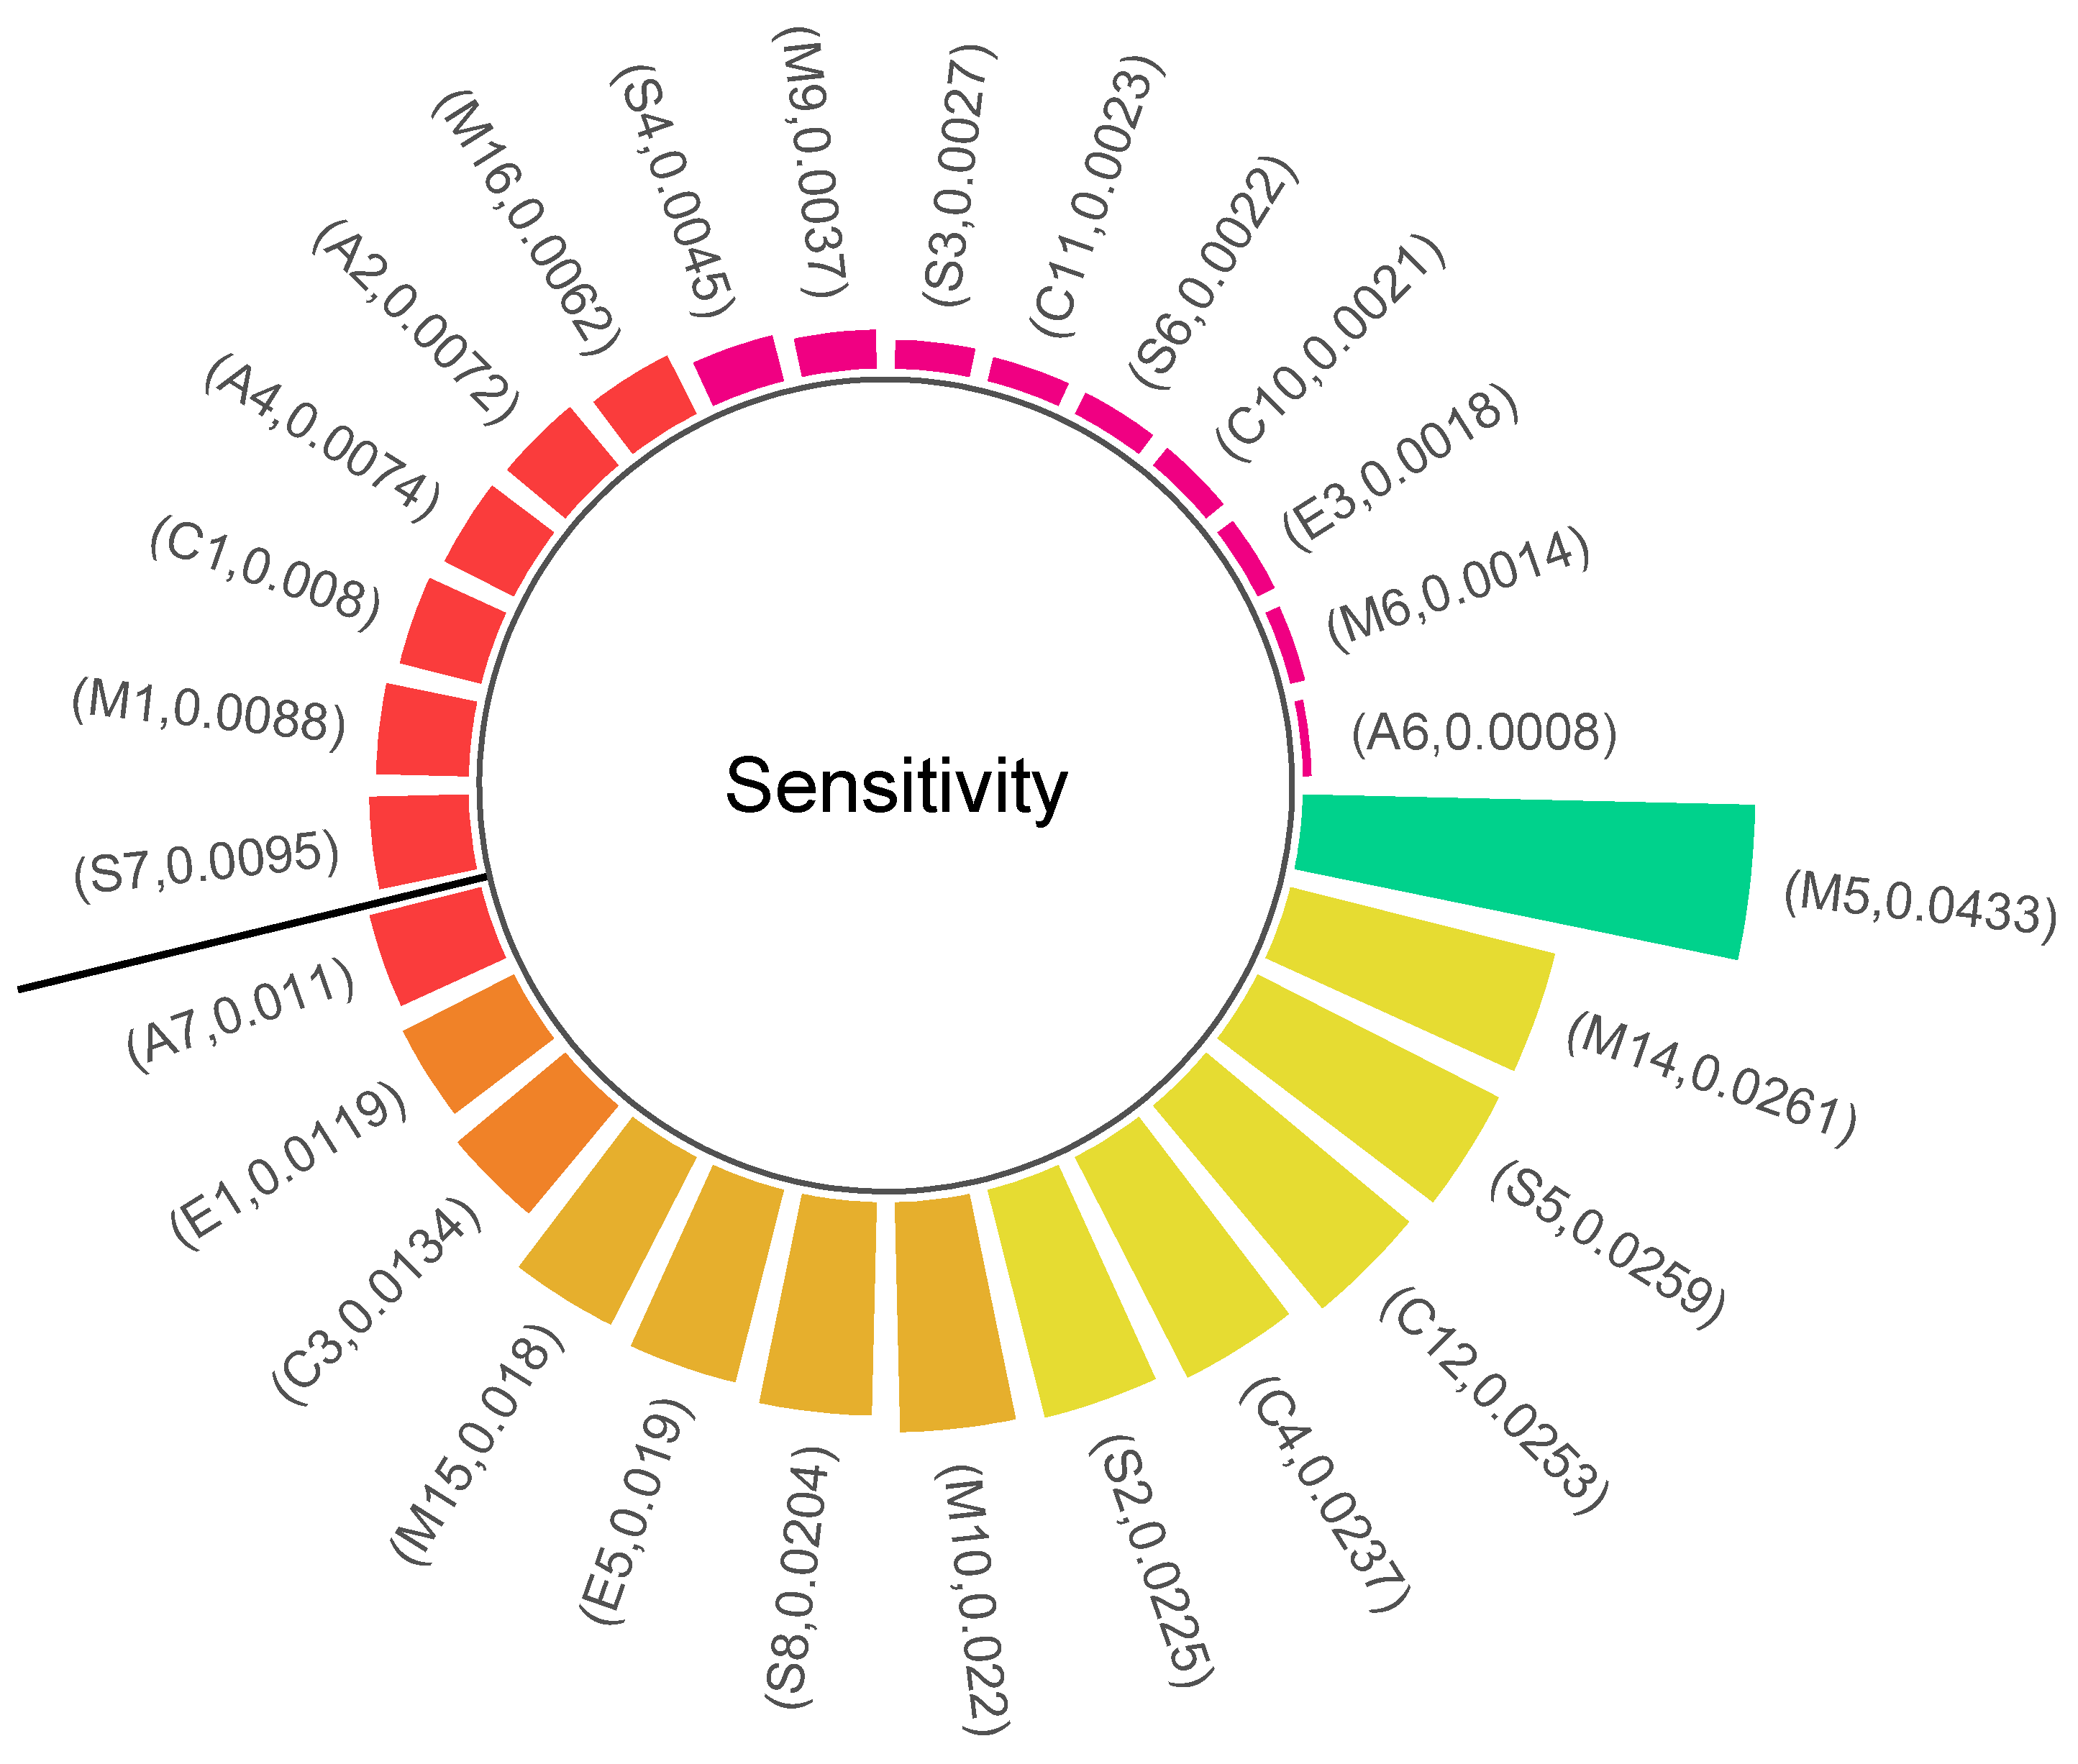
Sensitivity analysis is the study of how uncertainty in the output of a mathematical model or system (numerical or otherwise) is divided and assigned to different sources of uncertainty in the input. It is often used to identify, one by one, from multiple uncertainties, the sensitive factors that have a significant impact on the economic performance indicators of an investment project. In this paper, we are particularly interested in identifying, through sensitivity analysis, sensitive factors that have an impact on accidents (the “Accident” node). Therefore, this study used GeNIe4.0 software to learn the parameters of the constructed Bayesian network, and then used “Accident” as the target node to obtain the sensitivity analysis result, as shown in Figure 12. The darker color in the graph means that the node is more sensitive.
Figure 13 illustrates the sensitivity values of all safety risk factors. This research considered factors with sensitivities greater than 0.001 as highly sensitive factors for accidents, in descending order: M5, M14, S5, C12, C4, S2, M10, S8, E5, M15, C3, E1, and A7. From this, it can be found that although there are many key causes of chemical production accidents, the highly sensitive factors are mainly focused on on-site management. In particular, the sensitivity of M5 fully exceeds the sensitivity of M14 by 65.90%, while the sensitivity of all subsequent ones only decreases slowly. According to accident causation theory, safety management is the root cause of accidents [47]. The chemical production process involves many hazardous operations, such as fire operations, which require effective on-site management. This also reminds us that in chemical enterprises, safety investment should be reasonably arranged to control or even eliminate highly sensitive factors as a matter of priority. In this way, accidents can be more effectively prevented and the economic benefits of safety can be maximized, thus improving the overall level of safety production.
3.4.2. Key Cause Path Analysis
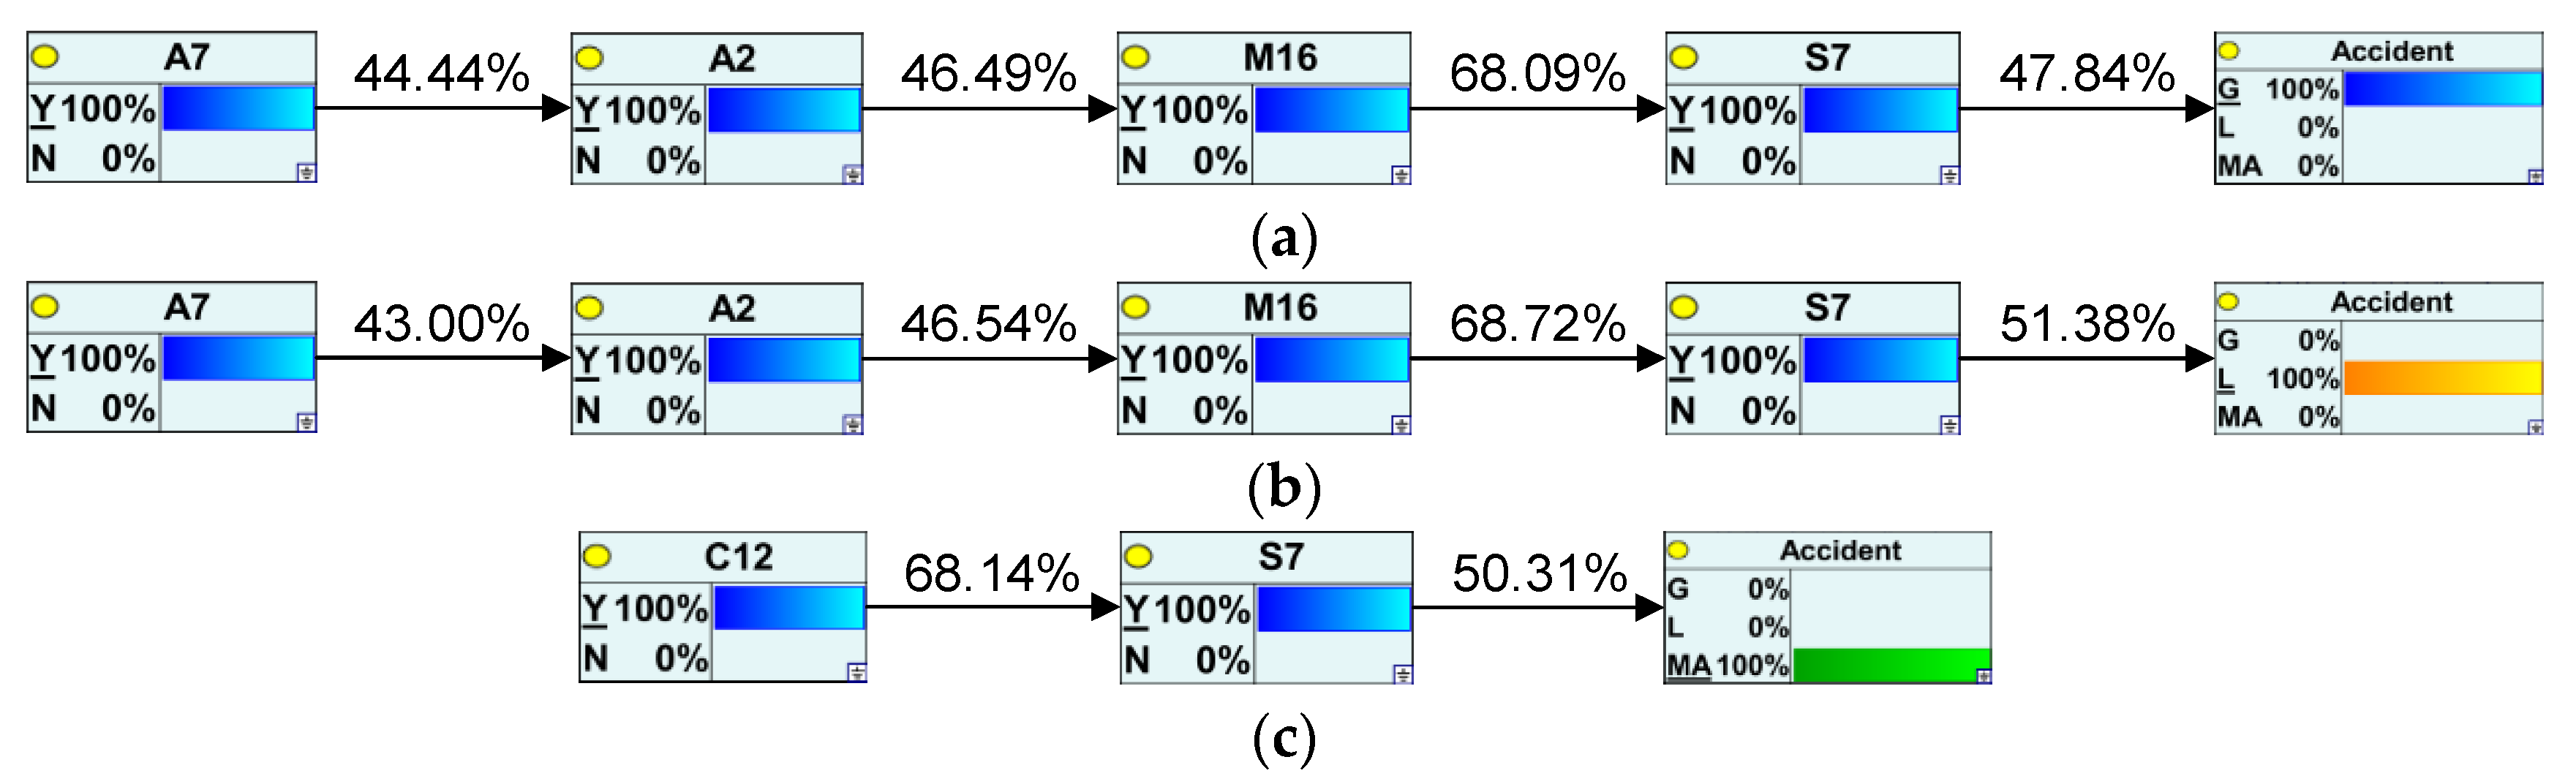
After sensitivity analysis, this study performed Bayesian network diagnosis by GeNIe4.0 software. Through the Bayesian network diagnosis, we can gradually infer the most probable causal propagation chain from the bottom to the top, assuming the occurrence of an accident, and then discover the most probable path to cause the accident. This study first cleared all the target nodes and then set evidence from the “Accident” node. The computer calculated the posterior probability of all the parents of the node, and then found the largest one and set evidence. This was repeated until the root node was reached. As a result, the key cause paths of the general accident, large accident, and major and above accident can be obtained, as shown in Figure 14a–c. From the figure, it can be seen that although the probabilities of propagation of key causes are different, the paths leading to the general accident and major accident are the same. It is all due to the unscientific plan or policy of the regulatory agency’s safety supervision guidance, which leads to the slackening of daily safety supervision. This further leads to the formalistic daily inspection of on-site management and failure to detect and stop the illegal operation of staff promptly when the company carries out production work. This series of reasons will eventually lead to accidents. For major and above accidents, it is mainly due to inadequate safety training and education of enterprises. This leads to irregularities in production activities by employees due to weak risk awareness, unskilled operation techniques, or insufficient understanding of the production process, which in turn leads to accidents. From the three key causal chains, it can be further found that the common and directly connected factor to the occurrence of the accident, regardless of the level of the accident, is S7 (Illegal operation). This is because the operating rules of production technologies vary in the chemical production process, and most of these processes involve a large number of reaction materials and violent chemical reactions. The illegal operation of the on-site staff is likely to result in uncontrolled chemical reactions of these raw materials, thus going in the undesired direction, such as explosions due to uncontrolled temperature and pressure, poisoning, and asphyxiation caused by toxic and hazardous gases from side reactions, which together account for 84.5% of all accidents. This reminds us to strengthen the training and management of operators, to strictly implement the operating procedures, and to detect and stop the illegal operation of personnel in time. If these problems can be improved, the most likely pathways leading to accidents will be cut off according to the domino principle, thus preventing accidents from occurring. However, this does not mean that as long as the key causal factors on the path are controlled, there is no need to be concerned about other safety risk factors. Due to the complexity of the Bayesian network structure and the general association of safety analysis factors, when a node of the causal path is cut off, the root node may pass through other nodes to finally reach the accident node. In the safety management of enterprises, it is necessary to keep an eye on the key cause paths to cut off the spread as early as possible, but also to pay attention to whether new cause paths will be created. Companies should then adjust their safety management orientation on time according to changes in the key causal paths.
3.4.3. Frequency Statistical Analysis
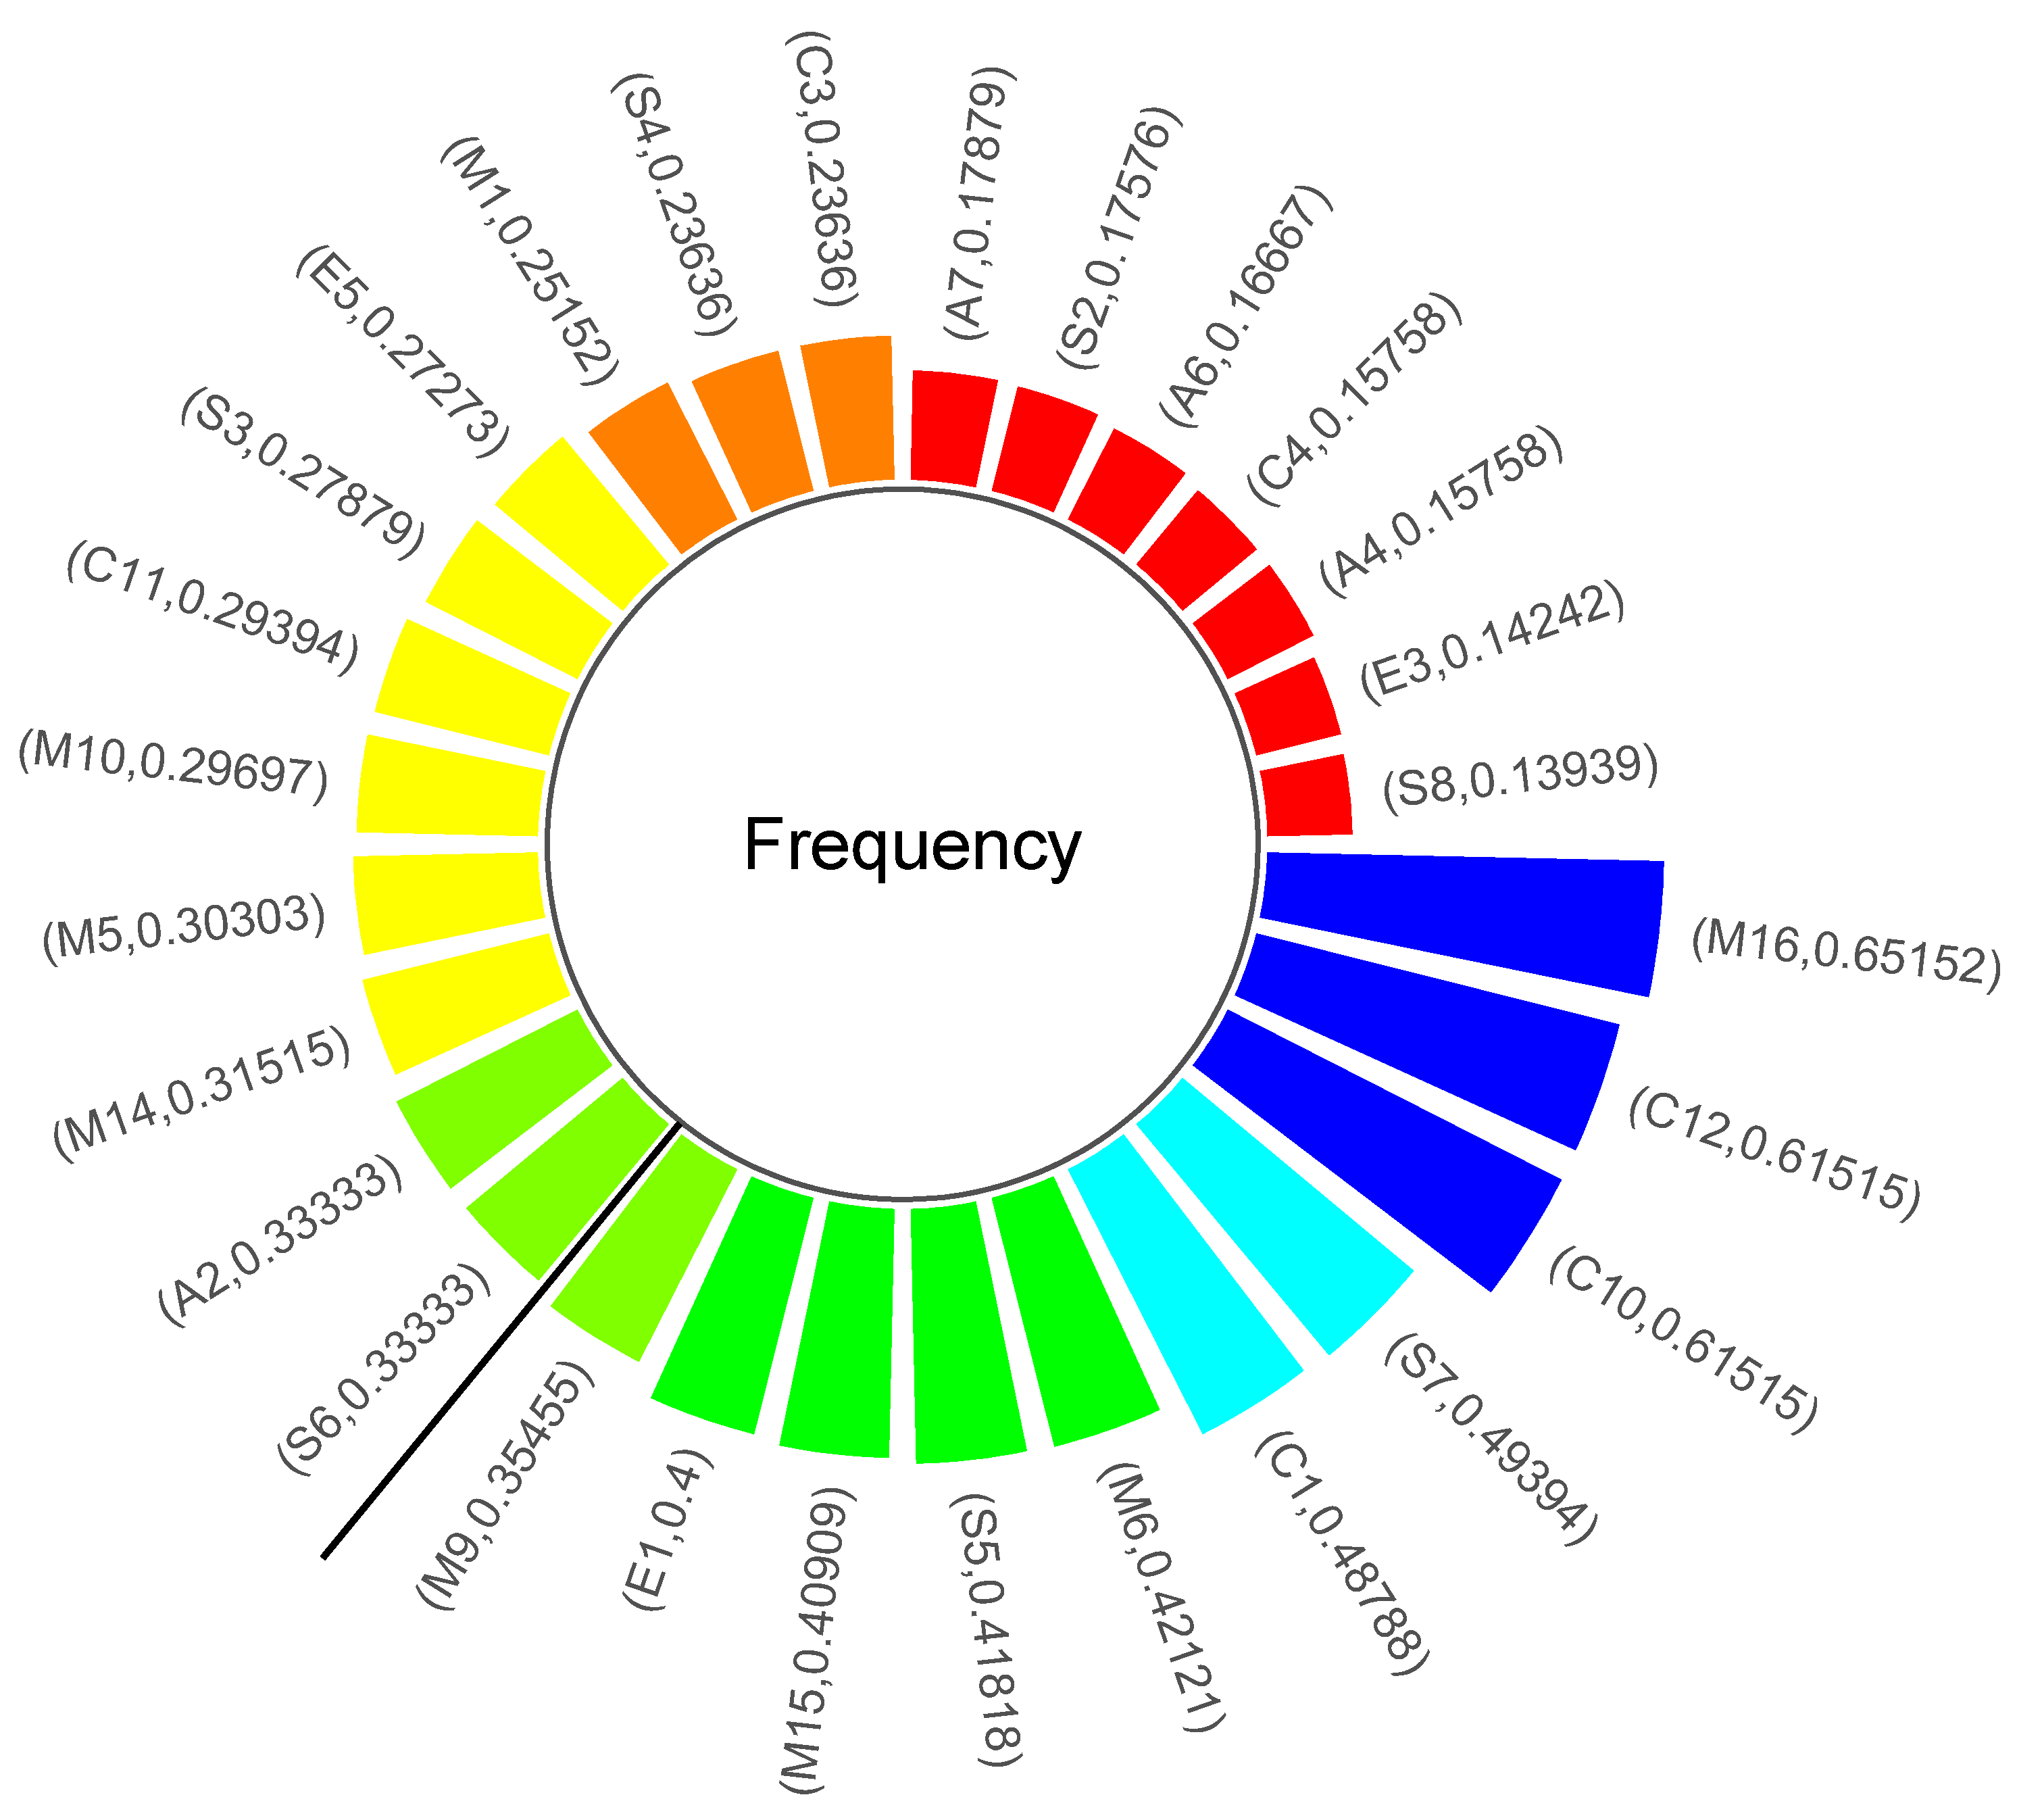
Risk factors that occur with high frequency tend to have a significant impact on most accidents. This study counted the frequency of all the nodes appearing in the transaction set to quickly identify the high frequency safety risk factors in chemical companies, as shown in Figure 15. The higher the frequency of the node, the more frequently the safety risk factor corresponding to the node appears in the production activities of enterprises. These safety risk factors require more safety input in daily safety management, are more difficult to control, and tend to have a greater impact on the occurrence of accidents. In this study, the top five safety risk factors in terms of frequency were considered as high-frequency factors, in descending order: M16, C12, C10, S7, and C1. It can be found that the largest frequency is M16. This is because, in the daily production activities of chemical enterprises, the production process and equipment and facilities are complex and diverse, and the inspection tasks on site are heavy. Moreover, if it is in a safe state for a long time, it will make the inspectors have a slack mentality and ultimately lead to the formalistic daily inspection. This is also related to inadequate safety training and education and failure to implement the main responsibility for safety production in enterprises. On the one hand, inadequate safety training and education can make the safety culture of a company weak. This can make the inspectors weak in safety concepts and poor in safety risk identification, thus failing to develop a sense of respect for accidents. On the other hand, the failure to implement the main responsibility for safety production further weakens the sense of responsibility of the inspectors and can lead to their scattered work. These two reasons will also eventually lead to the formalistic daily inspection. According to the previous key cause path analysis, it can be seen that in most of the accident propagation paths, the formalistic daily inspection is very likely to lead to the illegal operation of the on-site staff, which is a very dangerous behavior that directly leads to accidents. At the same time, if the emergency management system is not implemented in place, it will also make it impossible to effectively contain accidents caused by the illegal operation when they first occur. This can lead to further expansion of the accident, resulting in greater casualties or property damage.
3.4.4. Other Discovery
Combining the results of sensitivity analysis, key cause path analysis, and frequency statistical analysis, it was found that C12 appeared in the results of all three analyses. This means that inadequate safety training and education in companies is the most critical risk factor in chemical production accidents. To this end, we propose the following countermeasures.
First of all, to change the mindset of chemical companies and employees, chemical companies must face up to the investment in human capital and strengthen the necessary chemical safety training for employees. Secondly, we should integrate the resources of chemical safety education and training, make full use of the existing training bases and facilities, and increase the investment in training. This will train a large number of managers, technicians, and operators who master chemical safety for chemical companies. Then it is necessary to enrich the form of chemical safety education and training. In terms of training methods, we should end the traditional teaching methods of the past and actively use multimedia technology to carry out training. It is suggested to analyze the causes of accidents, explain the operation essentials and safety matters, and demonstrate the operation steps with some typical accidents that occur in enterprises as cases. Such on-site training can change the traditional cramming lectures and is more conducive to improving the ability to solve practical problems. Finally, the qualification system of chemical safety training institutions should be strictly implemented. For training that does not have chemical safety training qualifications and is beyond the scope of its qualifications, the competent authorities must give some necessary treatments. It is recommended not to confirm the vocational skills qualification of the trainees. This will ensure the effectiveness of chemical safety training.
4. Conclusions
The chemical accident investigation report records detailed information about the accident and is of great value for analyzing the risk factors involved. Text-mining methods can significantly reduce the workload of analyzing incident reports and effectively extract key information from them. In this study, an improved text-mining method was proposed and combined with association rules and Bayesian networks to analyze 330 chemical accident reports.
Since the original word separation system could not effectively identify proprietary words, this study designed a workflow to build and update the domain lexicon, synonym lexicon, and stop word lexicon, resulting in a more desirable word separation result. In order to avoid too large a text dataset for analysis, we performed keyword extraction on the word separation result. In view of the shortcomings of the traditional keyword extraction method TF-IDF in analyzing large texts, this study proposed the BM25W model and designed a comparison experiment to verify the feasibility and effectiveness of the new model. Since the extracted keywords could not completely express the safety risk of the accident, we calculated the correlation coefficients of keywords and non-key feature words. The distance formula was added to compensate for the fact that the word-document matrix did not take into account the position relationship of the words in the document. The final word combinations with strong correlations were found. Based on the combinations of these words, we standardized the keywords and identified 51 safety risk factors. Then, according to the socio-technical system, we classified these risk factors into five main categories: regulatory agency (seven), chemical production enterprise (13), on-site management (16), operation staff (ten), and environment and equipment (five). This process achieved the exploration from text to keywords and back again. After that, considering that FP-growth can only be used to mine single-dimensional Boolean association rules, the Apriori algorithm was used for association-rule mining in this study, which led to finding strong association rules between safety risk factors. Finally, this study constructed a Bayesian network topology, performed parameter learning, and performed sensitivity, key cause, and frequency statistics analysis on the result.
Through sensitivity analysis, it was found that highly sensitive factors are mainly concentrated in on-site management. In chemical enterprises, safety investment should be reasonably arranged to control or even eliminate highly sensitive factors as a priority. Through the key cause path analysis, we identified the most likely key cause path for each of the three types of accidents. Although the probabilities of propagation of key causes are different, the paths leading to general accident and major accident are the same. Moreover, all three paths pass through the same node S7, which means that chemical companies should pay particular attention to the illegal operation behavior of on-site personnel when conducting safety management. Through frequency statistical analysis, we have identified high frequency factors of chemical accidents. These factors are the most common or most difficult to contain in daily production activities, and are problems that require a long period of time and high investment in safety management. In addition, we combined the results of the three analyses and found that C12 was present in all three at the same time. This indicates that inadequate safety training and education in the enterprise is a highly concentrated safety risk factor and a priority to be managed regardless of the direction of consideration. To this end, we offered some suggestions.
The next step of this study is to collect more domestic chemical production accidents to make the database more representative. Then the different accident types will be divided to study the respective representative safety risk factors. Finally, more targeted recommendations will be made for different types of accidents.
Author Contributions
Conceptualization, Z.Z.; methodology, J.H.; software, J.H.; validation, Z.Z.; formal analysis, J.H., Y.L., H.M. and W.L.; data curation, J.H., Y.L., H.M. and W.L.; writing—original draft preparation, J.H.; writing—review and editing, J.C.; supervision, J.C. All authors have read and agreed to the published version of the manuscript.
Funding
This research was funded by the National Natural Science Foundation Project of China under Grant No. 52274163 and the Fundamental Research Funds for the Central Universities of Central South University under Grant No. 2022ZZTS0489.
Acknowledgments
The authors would like to express their thanks to the National Natural Science Foundation Project of China under Grant No. 52274163 and the Fundamental Research Funds for the Central Universities of Central South University under Grant No. 2022ZZTS0489.
Conflicts of Interest
The authors declare no conflict of interest.
References
- China’s Chemical Industry: New Strategies for a New Era. Available online: https://www.mckinsey.com/industries/chemicals/our-insights/chinas-chemical-industry-new-strategies-for-a-new-era (accessed on 29 June 2022).
- Southern Metropolis Daily. The Number of Larger Chemical Accidents in China Dropped to Single Digits for the First Time in 2021. Available online: https://www.mem.gov.cn/xw/xwfbh/2022n2y15rxwfbh/mtbd_4262/202202/t20220218_408142.shtml (accessed on 18 July 2022).
- National Chemical Accident Statistics: 620 Cases in Three Years, 728 People Died. Available online: https://news.sina.com.cn/c/2019-03-22/doc-ihsxncvh4721344.shtml (accessed on 18 July 2022).
- Chen, C.; Reniers, G.; Khakzad, N. Cost-benefit management of intentional domino effects in chemical industrial areas. Process Saf. Environ. Protect. 2020, 134, 392–405. [Google Scholar] [CrossRef]
- Yang, Y.; Chen, G.; Chen, P. The probability prediction method of domino effect triggered by lightning in chemical tank farm. Process Saf. Environ. Protect. 2018, 116, 106–114. [Google Scholar] [CrossRef]
- Zhou, D.; Zhang, M. The integrated safety assessment on chemical industry park. In Proceedings of the 2017 9th International Conference on Intelligent Human-Machine Systems and Cybernetics (IHMSC), Hangzhou, China, 26–27 August 2017. [Google Scholar]
- Zhao, J.; Suikkanen, J.; Wood, M. Lessons learned for process safety management in China. J. Loss Prev. Process Ind. 2014, 29, 170–176. [Google Scholar] [CrossRef]
- Wang, J.; Fu, G.; Yan, M. Comparative analysis of two catastrophic hazardous chemical accidents in China. Process Saf. Prog. 2020, 39, e12137. [Google Scholar] [CrossRef] [Green Version]
- Wang, B.; Wu, C.; Reniers, G.; Huang, L.; Kang, L.; Zhang, L. The future of hazardous chemical safety in China: Opportunities, problems, challenges and tasks. Sci. Total Environ. 2018, 643, 1–11. [Google Scholar] [CrossRef]
- Xu, N.; Ma, L.; Liu, Q.; Wang, L.; Deng, Y. An improved text mining approach to extract safety risk factors from construction accident reports. Saf. Sci. 2021, 138, 105216. [Google Scholar] [CrossRef]
- Nonaka, I. The Knowledge-Creating Company, 1st ed.; Harvard Business Review Press: Boston, MA, USA, 2008; pp. 1–72. [Google Scholar]
- Wang, B.; Li, D.; Wu, C. Characteristics of hazardous chemical accidents during hot season in China from 1989 to 2019: A statistical investigation. Saf. Sci. 2020, 129, 104788. [Google Scholar] [CrossRef]
- Fyffe, L.; Krahn, S.; Clarke, J.; Kosson, D.; Hutton, J. A preliminary analysis of Key Issues in chemical industry accident reports. Saf. Sci. 2016, 82, 368–373. [Google Scholar] [CrossRef] [Green Version]
- Zhang, H.; Zheng, X. Characteristics of hazardous chemical accidents in China: A statistical investigation. J. Loss Prev. Process Ind. 2012, 25, 686–693. [Google Scholar] [CrossRef]
- Chen, C.; Reniers, G. Chemical industry in China: The current status, safety problems, and pathways for future sustainable development. Saf. Sci. 2020, 128, 104741. [Google Scholar] [CrossRef]
- Liu, Q.; Meng, X.; Li, X.; Luo, X. Risk precontrol continuum and risk gradient control in underground coal mining. Process Saf. Environ. Protect. 2019, 129, 210–219. [Google Scholar] [CrossRef]
- Kumari, P.; Lee, D.; Wang, Q.; Karim, M.N.; Sang-Il Kwon, J. Root cause analysis of key process variable deviation for rare events in the chemical process industry. Ind. Eng. Chem. Res. 2020, 59, 10987–10999. [Google Scholar] [CrossRef]
- Miner, G.; Elder IV, J.; Fast, A.; Hill, T.; Nisbet, R.; Delen, D. Practical Text Mining and Statistical Analysis for Non-Structured Text Data Applications, 1st ed.; Academic Press: Waltham, MA, USA, 2012; pp. 921–1023. [Google Scholar]
- Zanasi, A. Virtual weapons for real wars: Text mining for national security. In Proceedings of the International Workshop on Computational Intelligence in Security for Information Systems CISIS’08, Genoa, Italy, 23–24 October 2008. [Google Scholar]
- Coussement, K.; Van den Poel, D. Integrating the voice of customers through call center emails into a decision support system for churn prediction. Inf. Manag. 2008, 45, 164–174. [Google Scholar] [CrossRef]
- Tixier, A.J.P.; Hallowell, M.R.; Rajagopalan, B.; Bowman, D. Automated content analysis for construction safety: A natural language processing system to extract precursors and outcomes from unstructured injury reports. Autom. Constr. 2016, 62, 45–56. [Google Scholar] [CrossRef] [Green Version]
- Pavlinek, M.; Podgorelec, V. Text classification method based on self-training and LDA topic models. Expert Syst. Appl. 2017, 80, 83–93. [Google Scholar] [CrossRef]
- Zhong, B.; Pan, X.; Love, P.E.; Sun, J.; Tao, C. Hazard analysis: A deep learning and text mining framework for accident prevention. Adv. Eng. Inform. 2020, 46, 101152. [Google Scholar] [CrossRef]
- Chen, J.; Du, S.; Yang, S. Mining and evolution analysis of network public opinion concerns of stakeholders in hot social events. Mathematics 2022, 10, 2145. [Google Scholar] [CrossRef]
- Esmaeili, B.; Hallowell, M. Attribute-based risk model for measuring safety risk of struck-by accidents. In Proceedings of the Construction Research Congress 2012, West Lafayette, IN, USA, 21–23 May 2012. [Google Scholar]
- Rodrigues, R.S.; Balestrassi, P.P.; Paiva, A.P.; Garcia-Diaz, A.; Pontes, F.J. Aircraft interior failure pattern recognition utilizing text mining and neural networks. J. Intell. Inf. Syst. 2012, 38, 741–766. [Google Scholar] [CrossRef]
- Fan, H.; Li, H. Retrieving similar cases for alternative dispute resolution in construction accidents using text mining techniques. Autom. Constr. 2013, 34, 85–91. [Google Scholar] [CrossRef]
- Sanmiquel, L.; Rossell, J.M.; Vintró, C. Study of Spanish mining accidents using data mining techniques. Saf. Sci. 2015, 75, 49–55. [Google Scholar] [CrossRef]
- Tanguy, L.; Tulechki, N.; Urieli, A.; Hermann, E.; Raynal, C. Natural language processing for aviation safety reports: From classification to interactive analysis. Comput. Ind. 2016, 78, 80–95. [Google Scholar] [CrossRef] [Green Version]
- Yang, L. Causes Analysis of Rail Transit Accidents and Risk Research Based on Text Data. Doctoral Dissertation, Beijing Jiaotong University, Beijing, China, 2021. [Google Scholar]
- Esmaeili, B.; Hallowell, M.R.; Rajagopalan, B. Attribute-based safety risk assessment. II: Predicting safety outcomes using generalized linear models. J. Constr. Eng. Manag. 2015, 141, 04015022. [Google Scholar] [CrossRef]
- Wang, X.; Yang, L.; Wang, D.; Zhen, L. Improved TF-IDF keyword extraction algorithm. Comput. Sci. Appl. 2013, 3, 64–68. [Google Scholar]
- Wang, J.; Wang, S.; Cui, Q.; Wang, Q. Local-based active classification of test report to assist crowdsourced testing. In Proceedings of the 31st IEEE/ACM International Conference on Automated Software Engineering, Singapore, 3–7 September 2016. [Google Scholar]
- Ma, Y.; Xie, Z.; Li, G.; Ma, K.; Huang, Z.; Qiu, Q.; Liu, H. Text visualization for geological hazard documents via text mining and natural language processing. Earth Sci. Inform. 2022, 15, 439–454. [Google Scholar] [CrossRef]
- Sun, J.; Lei, K.; Cao, L.; Zhong, B.; Wei, Y.; Li, J.; Yang, Z. Text visualization for construction document information management. Autom. Constr. 2020, 111, 103048. [Google Scholar] [CrossRef]
- Qiu, Z.; Liu, Q.; Li, X.; Zhang, J.; Zhang, Y. Construction and analysis of a coal mine accident causation network based on text mining. Process Saf. Environ. Protect. 2021, 153, 320–328. [Google Scholar] [CrossRef]
- Agrawal, R.; Imieliński, T.; Swami, A. Mining association rules between sets of items in large databases. In Proceedings of the 1993 ACM SIGMOD International Conference on Management of Data, Washington, DC, USA, 25–28 May 1993. [Google Scholar]
- Li, S.; You, M.; Li, D.; Liu, J. Identifying coal mine safety production risk factors by employing text mining and Bayesian network techniques. Process Saf. Environ. Protect. 2022, 162, 1067–1081. [Google Scholar] [CrossRef]
- Ouali, A.; Cherif, A.R.; Krebs, M.O. Data mining based Bayesian networks for best classification. Comput. Stat. Data Anal. 2006, 51, 1278–1292. [Google Scholar] [CrossRef]
- Chen, J.; Li, K.; Yang, S. Electric vehicle fire risk assessment based on WBS-RBS and fuzzy BN coupling. Mathematics 2022, 10, 3799. [Google Scholar] [CrossRef]
- Yang, S.; Su, K.; Wang, B.; Xu, Z. A Coupled mathematical model of the dissemination route of short-term fund-raising fraud. Mathematics 2022, 10, 1709. [Google Scholar] [CrossRef]
- Chen, Z.; Yin, D.; Zeng, J.; Li, H.; Li, Z. Human factors inference of safety accidents in coal mine based on Bayesian network. J. Saf. Sci. Technol. 2014, 11, 145–150. [Google Scholar]
- Uusitalo, L. Advantages and challenges of Bayesian networks in environmental modelling. Ecol. Model. 2007, 203, 312–318. [Google Scholar] [CrossRef]
- Heckerman, D. Bayesian networks for data mining. Data Min. Knowl. Discov. 1997, 1, 79–119. [Google Scholar] [CrossRef]
- GeNIe Modeler. Available online: https://support.bayesfusion.com/docs/GeNIe/introduction_genie.html (accessed on 16 September 2022).
- Chen, L.; Huang, S.; Sun, J.; Hui, Z.; Wu, K. Bug report quality detection based on the BM25 algorithm. J. Tsinghua Univ. 2020, 60, 829–836. [Google Scholar]
- Yang, X.; Haugen, S. Implications from major accident causation theories to activity-related risk analysis. Saf. Sci. 2018, 101, 121–134. [Google Scholar] [CrossRef]
Figure 1.
The number of chemical accidents and fatalities in China, 2016–2021.

Figure 2.
The framework of research on safety risk factors of chemical accidents.

Figure 3.
Frequency of different accident levels.

Figure 4.
Percentage of different accident types.

Figure 5.
The updated workflow of JiebaWSS.

Figure 6.
A simple Bayesian network consisting of events A and B.

Figure 7.
Word cloud visualization of the top 100 keywords.

Figure 8.
The heat map of correlation coefficients.

Figure 9.
The combinations of keywords and non-key feature words.


Figure 10.
Chemical production safety risk factors.

Figure 11.
Bayesian network topology of safety risk factors.

Figure 12.
Result of Bayesian network sensitivity analysis.

Figure 13.
Sensitivity of safety risk factors.

Figure 14.
Key cause paths of different types of accidents. (a) The key cause path of general accidents. (b) The key cause path of larger accidents. (c) The key cause path of major and above accidents.
Figure 14.
Key cause paths of different types of accidents. (a) The key cause path of general accidents. (b) The key cause path of larger accidents. (c) The key cause path of major and above accidents.

Figure 15.
The frequency statistics of safety risk factors.


Table 1.
Error values at each update of the domain dictionary.
| Updating Times | 1 | 2 | 3 | 4 |
|---|---|---|---|---|
| Error | ∞ | 0.70 | 0.37 | 0.17 |
Table 2.
Partial splitting results.
| Corpus Number | Word Segmentation Result |
|---|---|
| 1 | <Enterprise> <Sewage> <Production technology> <Production technology> <Wastewater> < Sampling > <Check>…<Manager> < Safety measure> |
| 2 | <Workshop> <Production technology> <Production> <Warehouse> <Stop production> <Inspect and repair> <Dilute> <Production technology>…<Operating rule> <Check> |
| … | … |
| 330 | <On duty> <Operate> <Dimethylformamide> <Methanol> <High level tank> <Valve> <Rinse> <High level tank>…<Staff> <Operate> |
Table 3.
The result of the comparison experiment.
| Corpus | Accuracy | Recall | ||
|---|---|---|---|---|
| TF-IDF | BM25W | TF-IDF | BM25W | |
| Art (10) | 0.1511 | 0.1724 | 0.5004 | 0.5720 |
| Sports (10) | 0.2544 | 0.3168 | 0.5967 | 0.7417 |
| Politics (10) | 0.2130 | 0.1544 | 0.8267 | 0.6117 |
| Economy (10) | 0.1592 | 0.1670 | 0.6983 | 0.5917 |
| Agriculture (10) | 0.1712 | 0.1375 | 0.7250 | 0.6083 |
| Environment (10) | 0.2582 | 0.3734 | 0.4433 | 0.7150 |
| Computer (10) | 0.2776 | 0.5226 | 0.3733 | 0.6667 |
| History (10) | 0.1148 | 0.2299 | 0.4229 | 0.7731 |
| Space (10) | 0.1517 | 0.5453 | 0.2750 | 0.8083 |
| Energy (10) | 0.3567 | 0.5383 | 0.3789 | 0.5900 |
| average | 0.2108 | 0.3158 | 0.5240 | 0.6678 |
Table 4.
The top 10 keywords extracted by TF-IDF and BM25W.
| Number | TF-IDF | BM25W |
|---|---|---|
| 1 | Enterprise | Equipment |
| 2 | Operation | Operator |
| 3 | Workshop | Check |
| 4 | Equipment | Safety education and training |
| 5 | Tank | Operation |
| 6 | Supervision and management | Supervision and management |
| 7 | Production | Production technology |
| 8 | Personnel | Management |
| 9 | Locale | Toxic and harmful gas |
| 10 | Check | Special operation |
Table 5.
Some of the components of TDM.
| … | … | |||||||||||||
|---|---|---|---|---|---|---|---|---|---|---|---|---|---|---|
| 0 | 0 | 0 | 0 | … | 5 | 0 | 1 | 0 | … | 0 | 0 | 0 | 0 | |
| 0 | 0 | 0 | 0 | … | 3 | 0 | 0 | 0 | … | 0 | 0 | 0 | 0 | |
| … | … | … | … | … | … | … | … | … | … | … | … | … | … | … |
| 0 | 0 | 0 | 0 | … | 12 | 0 | 1 | 0 | … | 0 | 0 | 0 | 0 | |
| 0 | 0 | 0 | 0 | … | 3 | 0 | 0 | 0 | … | 0 | 0 | 0 | 0 | |
| … | … | … | … | … | … | … | … | … | … | … | … | … | … | … |
| 0 | 0 | 0 | 0 | … | 4 | 0 | 0 | 0 | … | 0 | 0 | 0 | 0 | |
| 0 | 0 | 0 | 0 | … | 0 | 0 | 0 | 0 | … | 0 | 0 | 0 | 0 |
Table 6.
Some of the association rule results.
| Association Rule | Support | Confidence | Lift |
|---|---|---|---|
| {S4, C12}⇒{S6} | 0.1545 | 0.8361 | 2.5082 |
| {C10, S6}⇒{S4} | 0.1273 | 0.5915 | 2.5027 |
| {E1, M15}⇒{M1} | 0.1121 | 0.6271 | 2.4934 |
| {A7, C1}⇒{C11} | 0.0939 | 0.7209 | 2.4526 |
| {M16, S6}⇒{S4} | 0.1394 | 0.5750 | 2.4327 |
| {S4, S5}⇒{S6} | 0.1030 | 0.8095 | 2.4286 |
| {E1, S5}⇒{S4} | 0.1000 | 0.5323 | 2.2519 |
| {C11, M16}⇒{A7} | 0.1000 | 0.4024 | 2.2509 |
| {M6, M14}⇒{S3} | 0.0970 | 0.6275 | 2.2506 |
| {C1, A2}⇒{C11} | 0.1303 | 0.6615 | 2.2506 |
| {E1, S7}⇒{S4} | 0.1152 | 0.5278 | 2.2329 |
| {E1, C12}⇒{S4} | 0.1394 | 0.5227 | 2.2115 |
| {M15, M14}⇒{M1} | 0.0939 | 0.5439 | 2.1623 |
| {M1, E1}⇒{S6} | 0.1091 | 0.7200 | 2.1600 |
| {S4, S6}⇒{E1} | 0.1727 | 0.8636 | 2.1591 |
| {S8}⇒{M5} | 0.0909 | 0.6522 | 2.1522 |
| {M9, E1}⇒{S6} | 0.1152 | 0.7170 | 2.1509 |
| {C4, M16}⇒{A2} | 0.0909 | 0.7143 | 2.1429 |
| {C11, M6}⇒{M5} | 0.0939 | 0.6458 | 2.1313 |
| {A7, A2}⇒{C11} | 0.0939 | 0.6200 | 2.1093 |
| … | … | … | … |
Publisher’s Note: MDPI stays neutral with regard to jurisdictional claims in published maps and institutional affiliations. |
© 2022 by the authors. Licensee MDPI, Basel, Switzerland. This article is an open access article distributed under the terms and conditions of the Creative Commons Attribution (CC BY) license (https://creativecommons.org/licenses/by/4.0/).
Share and Cite
MDPI and ACS Style
Zhou, Z.; Huang, J.; Lu, Y.; Ma, H.; Li, W.; Chen, J. A New Text-Mining–Bayesian Network Approach for Identifying Chemical Safety Risk Factors. Mathematics 2022, 10, 4815. https://doi.org/10.3390/math10244815
AMA Style
Zhou Z, Huang J, Lu Y, Ma H, Li W, Chen J. A New Text-Mining–Bayesian Network Approach for Identifying Chemical Safety Risk Factors. Mathematics. 2022; 10(24):4815. https://doi.org/10.3390/math10244815
Chicago/Turabian StyleZhou, Zhiyong, Jianhui Huang, Yao Lu, Hongcai Ma, Wenwen Li, and Jianhong Chen. 2022. "A New Text-Mining–Bayesian Network Approach for Identifying Chemical Safety Risk Factors" Mathematics 10, no. 24: 4815. https://doi.org/10.3390/math10244815
Note that from the first issue of 2016, this journal uses article numbers instead of page numbers. See further details here.