
The Harvest Effect on Dynamics of Northern Fur Seal Population: Mathematical Modeling and Data Analysis Results

1
Institute of Automation and Control Processes, Far Eastern Branch, Russian Academy of Sciences, 690041 Vladivostok, Russia
2
Pacific Research Fisheries Center, 690091 Vladivostok, Russia
3
Institute for Complex Analysis of Regional Problems, Far Eastern Branch, Russian Academy of Sciences, 679016 Birobidzhan, Russia
*
Author to whom correspondence should be addressed.
Mathematics 2022, 10(17), 3067; https://doi.org/10.3390/math10173067
Submission received: 12 July 2022
/
Revised: 22 August 2022
/
Accepted: 22 August 2022
/
Published: 25 August 2022
(This article belongs to the Collection Theoretical and Mathematical Ecology)
Abstract
:We examine population trends in light of male harvest data considering the long-time series of population data on northern fur seals at Tyuleniy Island. To answer the question has the way males were harvested influenced the population trajectory, we analyzed the visual harem size and birth rate dynamics of the population, as well as the strategy and intensity of the harvest. We analyzed the dynamics of the sex ratio in the early (1958–1988) period to estimate parameters in the late period (1989–2013) based on the observed number of bulls and pups, while utilizing the distribution of reproductive rates obtained from pelagic sealing. Using a matrix population model for the observed part of the population (i.e., the male population), we analyzed the population growth rate associated with changes in both birth and survival rates considering the stochastic effects. Observations allow us to reject the hypothesis of nonselective harvest. Among the variety of natural and anthropogenic factors that could contribute to the decrease in the birth rate in the population, the effect of selective harvesting seems to be the most realistic.
MSC:
92-101. Introduction
Northern fur seals (Callorhinus ursinus) inhabiting the North Pacific on the Pribilof Islands, Commander Islands, Kuril Islands, and the Tyuleniy Island in the Sea of Okhotsk, have long been a valuable object of commercial harvest, e.g., [1,2]. Commercial sealing of northern fur seals for their pelts has significantly reduced their numbers globally. In the late 18th century, harvests began on the Commander Islands and soon thereafter on the Pribilof Islands and Tyuleniy Island. The history of commercial hunting of northern fur seals is well-documented [2,3,4,5,6,7] etc., and shows an alternating pattern between indiscriminate hunting of male and female seals and the implementation of conservation measures to restore declining stocks. Between 1956 and 1968, a management decision allowed the culling of females within a herd reduction program in the Pribilof Islands. This management activity was implemented without a good understanding of the population dynamics of the species. Thus, the removal of adult females was accompanied by a dramatic reduction in fur seal populations in the Pribilof Islands [8,9,10,11,12,13]. The commercial harvest sought to be limited to subadult males, which was started in the Pribilof Islands in 1835 [3,14], the Commander Islands in 1871, and Tyuleniy Island in 1891 [15], which resulted in a more reduced impact. Unfortunately, even a four-way international convention (Canada, Japan, USSR, and the USA) on the conservation of Northern Pacific fur seals (ICCNPFS, 1957) [16] has not successfully solved the optimal control problem of the harvest of the North Pacific fur seal populations.
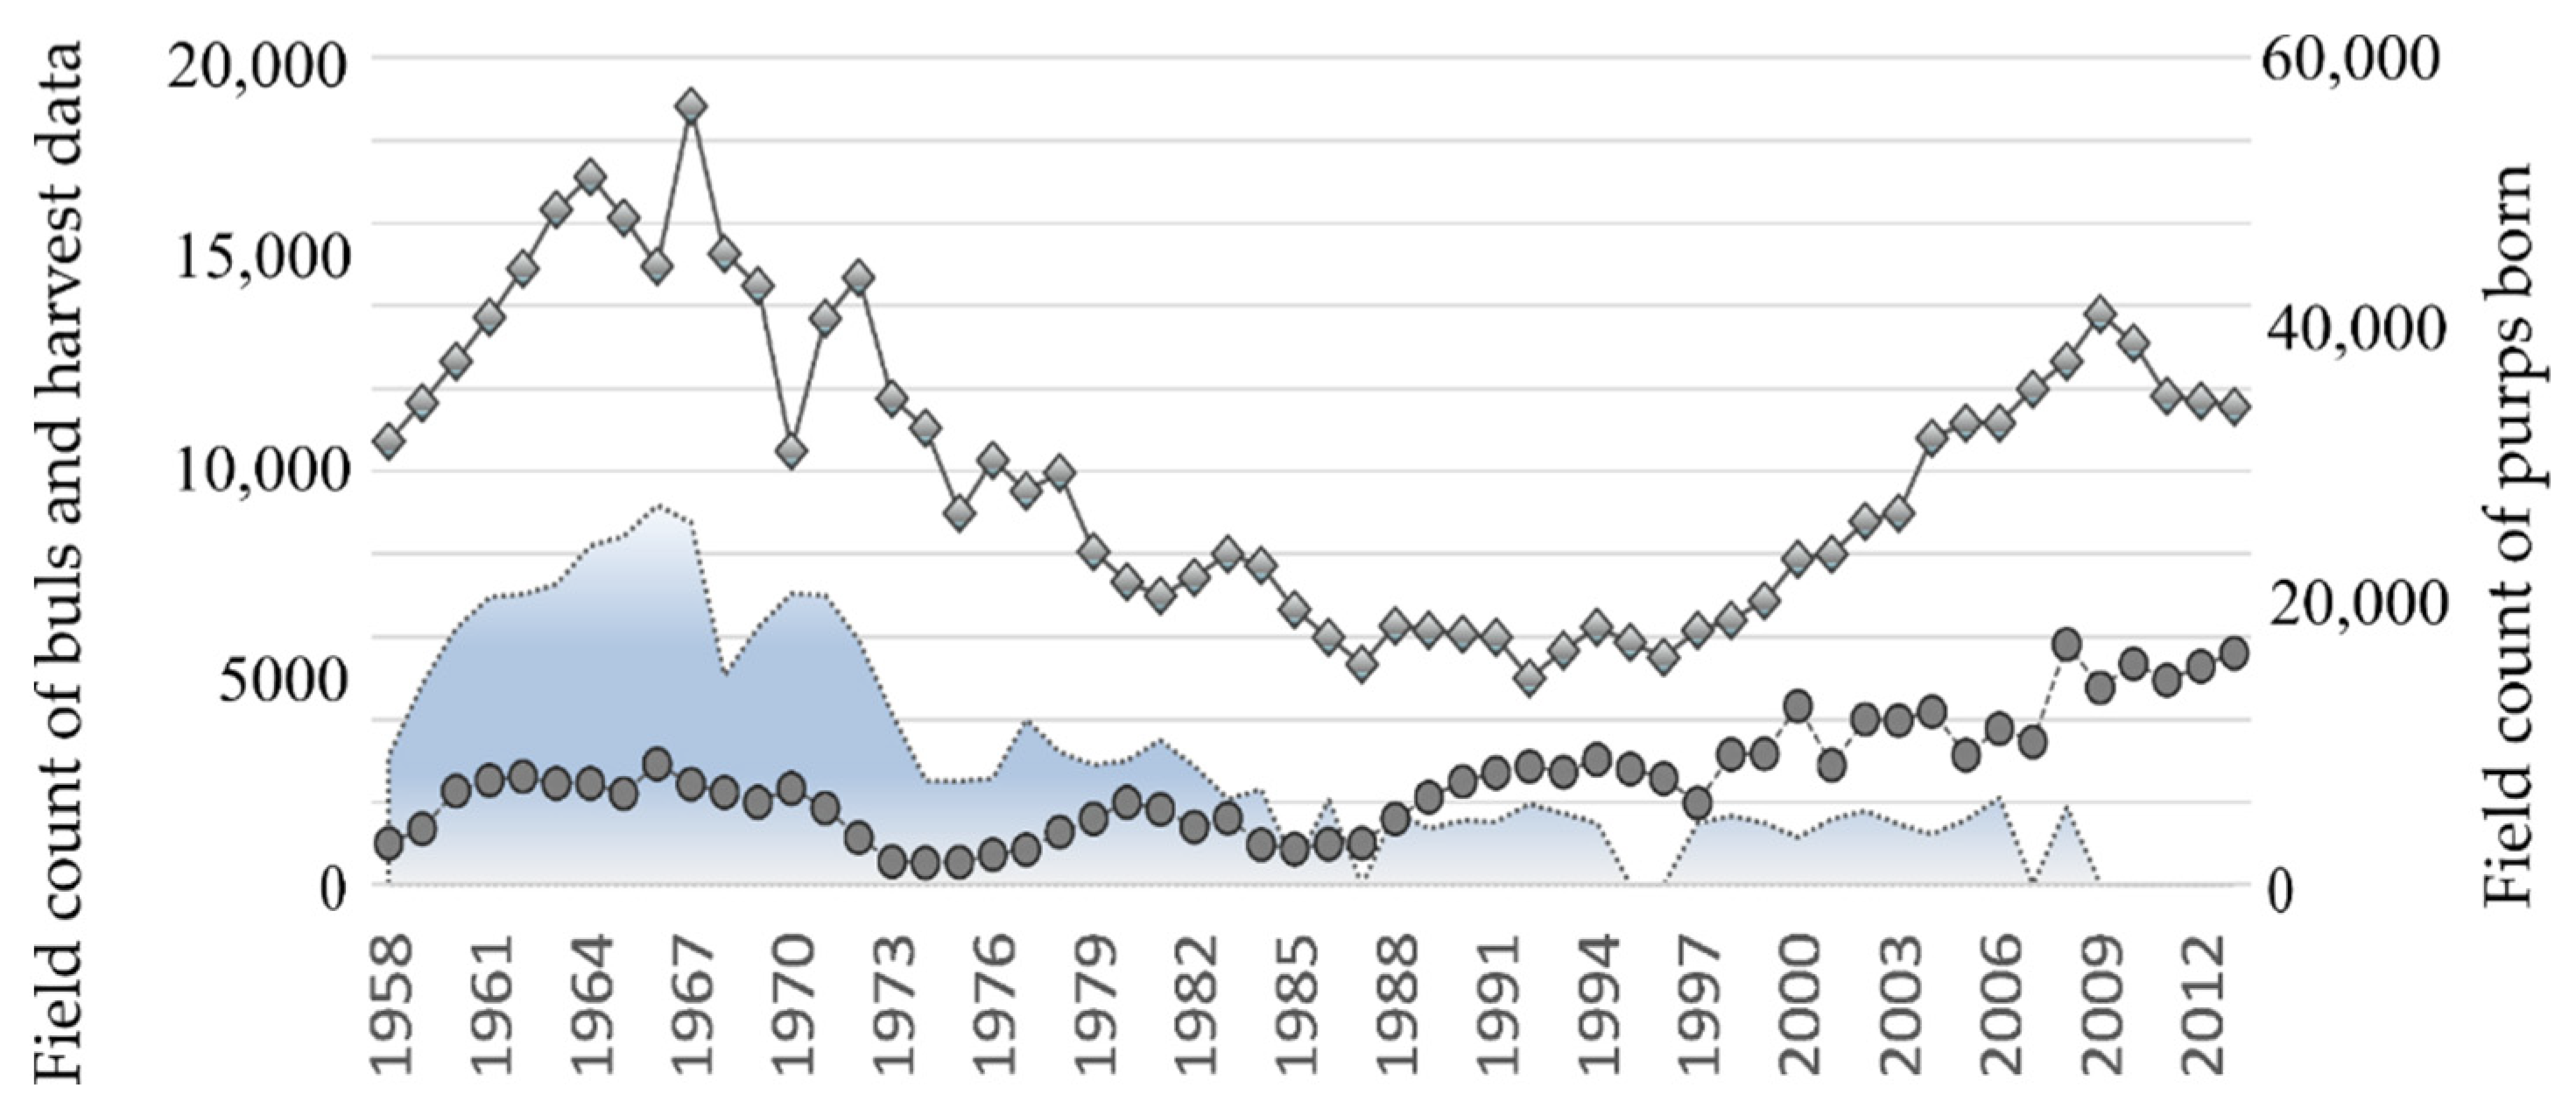
Following years of sealing, and despite all efforts to optimize it, the Tyuleniy Island herd started to reduce, e.g., [17,18]. By the late 1980s, the number of births decreased by half compared to the average values of the 1960s and early 1970s and then fixed there. Other North Pacific fur seal populations also demonstrated reduced population numbers, particularly Commander and Pribilof Islands [2,9,19], etc. To change this undesirable trend, hunting on Tyuleniy Island was considerably limited by the 1990s, and completely canceled in 2008. Figure 1 demonstrates the field counts available for the Tyuleniy Island herd of northern fur seals. As expected, the number of adult males in the population dramatically increased (Figure 1, the line with bullets), but the expected rise in the number of births did not follow: although the number of newborn pups is higher, the level of the mid-1960s remained unachieved (Figure 1, the line with the diamond shapes).
Animal populations are systems whose dynamics are affected by variations in birth and mortality rates, as well as immigration and emigration [20]. Considering the highest level of isolation of the Tyuleniy herd from all the others [21,22], immigration and emigration processes do not affect the population dynamics; therefore, achieving a population increase can only be due to higher productivity or survival. In previous papers [23,24,25], we estimated and analyzed the dynamics of the survival rates of various age and sex groups of this population using observation data available for more than half a century. In addition to data presented in Figure 1 (i.e., field count of bulls, number of males taken in the commercial harvest and pups born 1958–2013) we used the exact numbers and ages of the animals harvested on land (1958–2013) as well as information about the physiological state and ages of females from marine samples (available from 1958 to 1988). A decrease in the survival rate of young females, a reduction in the population number of females, as well as aging of the population is found via data analysis [24] to occur in the 1958–1988 period. The rate of the survival of females among individuals under 3 years of age increased substantially after 1988, indicating a positive trend in the dynamics of their number. The latter conclusion is the result of numerical experiments in which estimates were obtained of the minimum acceptable survivability of females required for them to reach the level of abundance at which they could produce the observed number of newborn pups at the rookery in the late period. Age and reproductive status of females obtained from pelagic harvesting ended in 1988, thus constraining the analysis to use newborn pups as a lower bound estimate of the number of mature females after 1988. Much more observational data are available for the male part of the population that has been subjected to a long period of commercial harvest. Our previous study [23] has shown that juvenile survival rates do not demonstrate visible decline, and those of older age groups seem to be slowly increasing. Nevertheless, the analysis of density-dependent effects on the juvenile survival rate revealed a considerably higher intraspecific competition, which is probably associated with certain external factors, such as food quality and availability. In addition, the viability dynamics of pups is indicative: at the start of the observation period, it was the highest, then it declined substantially after the sealing intensified, and eventually began to grow again, responding to considerable conservation efforts, but never reached its initial level. In addition, the number of newborn pups per bull has decreased significantly. These facts can indicate the effect of altering the population’s genetic structure, which emphasizes the importance of considering the evolutionary implications of harvest.
The decrease in the average number of newborn pups per bull on Tyuleniy Island may be a result of either selective harvesting or a shortage of reproductive females in the population or even a combined effect of both factors. A consequence of selective harvest may be as follows: at first, when the bulls were still in a good form, the decreasing competition allowed them to increase efficiency. Then, when the sealing eliminated the best potential breeders from the populations, there were only the inferior bulls. Since only males were hunted from the considered population, it seems reasonable to expect changes primarily in this part of the population. In this study, we examine to what extent changes in the average reproductive efficiency of bulls are consistent with male harvest selectivity. Another explanation for a decline in the population birth rate could be a shortage of reproductive females. Note, there was not any commercial harvest of females from this population (except for sea samples with research purpose, which were relatively small in relation to the total number of females in the population). Environmental factors affect both females and males; therefore, an increase in the number of bulls has to be simultaneous with an increase in the number of reproductive females (which is consistent with the observed increase in their numbers on the rookery). However, the latter statement requires additional estimates and calculations, with which this paper will proceed.
In order to elucidate changes in the Tyuleniy Island northern fur seal population that resulted in slow population growth in the absence of a male harvest, we perform the following:
- Address the question, how did harvest methods affect the number and age structure of harvested seals over time?
- Analyze the dynamics of visual sex ratio or observed average harem size;
- Then, using a matrix population model for the observed part (males), we estimate the average growth rate and stationary age composition of this population part on the base of average estimates of birth and survival rates for periods of different dynamics. In order to account for annual changes in the survival and birth rates, we supplement the deterministic estimates of the population growth rate with stochastic ones;
- Assess females in the population by comparing the observational results of their numbers at the rookery with the past period for which information on their physiological state from marine samples is available. Analyze the dynamics of the sex ratio of that period and estimate this parameter in the late period using the known number of bulls, pups, and the proportion of pregnant females available from marine samples.
2. Materials and Methods
2.1. Dynamics of Numbers and Ages of the Males Harvested on Land for Various Periods of Time
It is impossible to obtain reliable direct counts of individuals of all age and sex groups. The northern fur seals occupy a large area of often forbidding terrain; their numbers are high, and they are very densely grouped in the rookeries and constantly moving. Only bulls (adult males aged 7 and up) can be accurately counted directly due to their larger size, small numbers, and minimal movements during the reproductive period.
To analyze the strategy and intensity of the harvest we use the exact numbers and ages of the males killed on land that have been registered for all years between 1958 and 2008. Theoretically, the commercial harvest should have been confined to subadult males 2 to 5 years old, with the majority being 3 to 4 years of age.
Note that the age of the animals harvested on land is exactly known because the age was determined for all killed animals by the annual rings on their teeth. Early harvest strategies differed from those theoretically prescribed by killing subadult and adult males. Given this, we determined the proportion of the bulls (R7+) and two-year-old males that were harvested.
2.2. Dynamics of the Average Harem Size and Average Number of PUPS per Bull (or the Reproductive Efficiency of Bull)
We obtained the data for almost all years between 1980 and 2013 containing maximal numbers of females summarized over all harems of the rookery (Fobs(n)) on Tyuleniy Island, which allows the analysis of the sexual ratio dynamics in the coast for these years: ρ(n) = Fobs(n)/M(n), where M(n) is the observed number of bulls in the nth year. However, the observed number of females on a rookery (Fobs(n)) is a significantly underestimated number of the total mature females, because their feeding cycle usually consists of foraging and feeding at sea for about five days, then returning to the rookeries to nurse the pups for about two days. Moreover, a share of females that have not given birth in the current year do not come ashore at all. Therefore, we additionally calculated an average number of pups per bull (or the average reproductive efficiency of a bull), which characterizes an average harem size: b(n) = P(n + 1)/M(n), where P(n + 1) is the number of newborn pups in the next (n + 1)th year.
Moreover, to confirm the causal relationship between the considered parameters ρ(n) and b(n), we used the Granger causality test (Granger, 1969). Using the ordinary least squares method (OLS), the dependence of harem production (P(n + 1)/M(n)) on its observed size (Fobs(n)/M(n)) was estimated from observational data. We use the Chow test to verify the hypothesis of a changing trend in harem production in 1988. Then, using a theoretical regression line obtained from the data of the previous period, 1958–1979, we extend the series of observed numbers of females on the rookery for 1980–2013 by calculated values (tFobs).
We used the total number of bulls in all our calculations without dividing them into harem bulls (defending a territory containing one or more females) and idle ones (7 years and older with no territory). Although the harem bulls are in the breeding space on the rookery and the idle males, as a rule, are at the neighboring “haulouts”, the bulls classification into harem and idle ones is rather conditional, because they constantly compete with each other for a place on the harem territory and there is an exchange or rotation of harem and idle bulls during the entire harem period.
2.3. Matrix Model of the Male Part of the Population
We analyzed the dynamics of the male part of the population without explicit consideration of the females’ dynamics. We used the average reproductive efficiency of a bull as a birth rate in the model because this parameter was stable enough recently and there is a rather long series of its observations. Using two sets of male survival rate, estimates on different stages of their lifecycle obtained previously [25] (the methods for estimating the survival rates are reviewed in the Appendix A) and reproductive efficiency of a bull (as a proxy for an average harem production), we analyzed the dynamics of number and age structure of males and forecasted their further development.
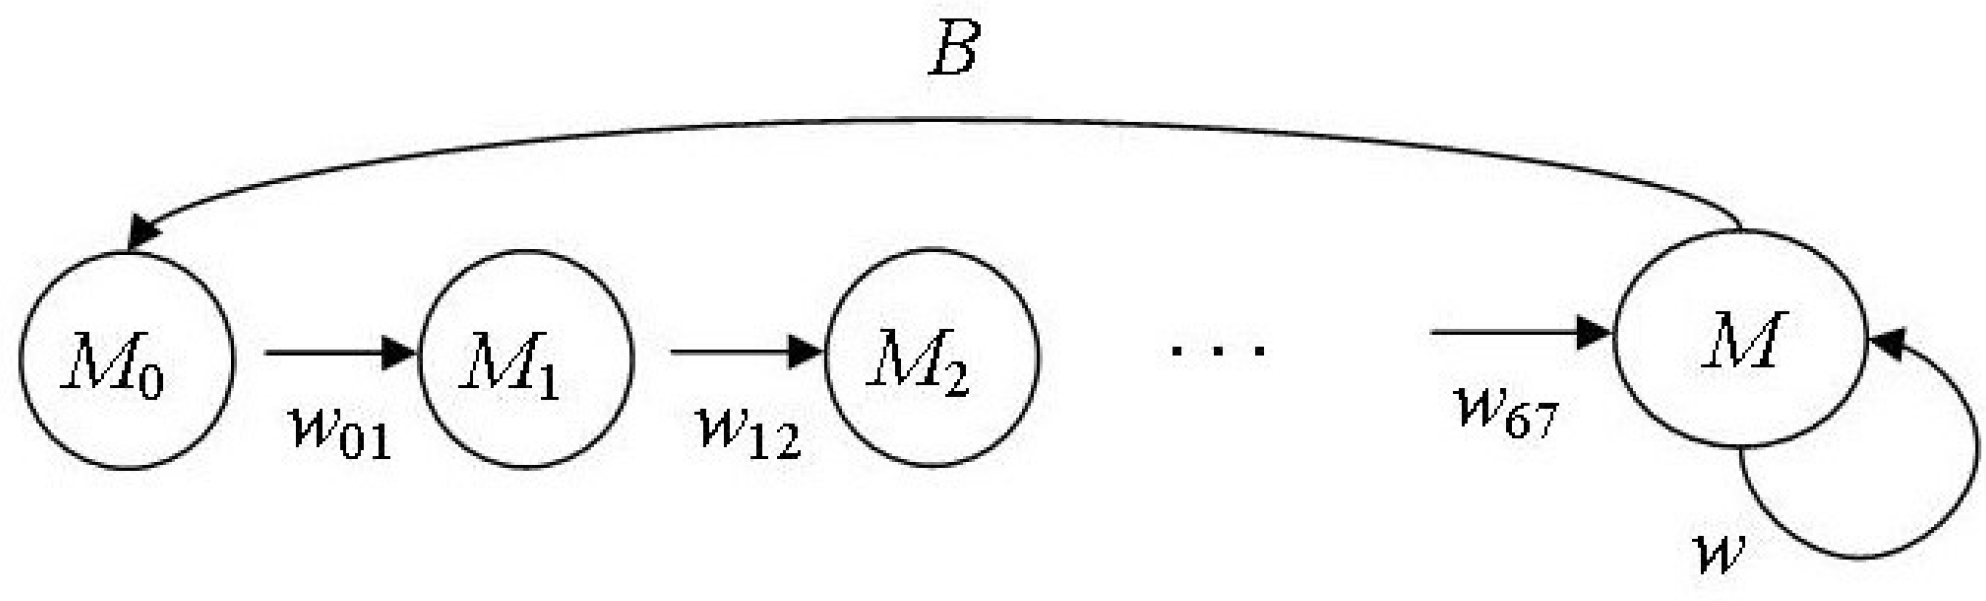
Figure 2 shows the lifecycle graph of the male part of the northern fur seal population.
Stage-structured Lefkovitch model [26] describes the dynamics of the population number and age structure:
SM(n + 1) = A⋅SM(n),
Column vector SM(n) = (M0(n), M1(n), M2(n), M3(n), M4(n), M5(n) M6(n), M(n))T describes the age structure of the considered population part, where Mi(n) is the number of males of age i in the nth year, the reproductive group or the bulls (M) is represented by males of age 7 years and older; wii+1(n) is the survival rate of males being i years old in the nth year between i and i + 1 year of age; w(n) is the survival rate of bulls between nth and (n + 1)th years. We suppose M0(n) = P(n)/2; the validity of this equation is confirmed by many studies: the sex ratio of fur seal embryos almost equals 1:1 [19]. Although by birth, there may be a deviation from the 1:1 ratio for both ways in different populations [12,27,28], these deviations are insignificant. During the first year of life, the fur seal pup is known from the biology of this species to have the lowest survival rate. Then up to seven years, when males start breeding, it does not practically change; therefore, we suggest w12 = w23 = … w67 = w27. Thus, we determine the survival rate of males from birth till one-year-old (w01) using previously calculated parameters (w02 and w27) as w01 = w02/w27. Fertility B is half the bull reproductive efficiency: B = b/2, given the sexual ratio. A projection matrix A takes the following form:
Given that the projection matrix (2) is irreducible and primitive, the Perron–Frobenius theorem [26,29] is true: the spectrum of an irreducible matrix L has a positive number λ1 = ρ(L) (also called the dominant eigenvalue), which corresponds to a positive eigenvector x* > 0: Lx* = λ1x* called the Perron vector provided that it is scaled (its elements sum to 1). In mathematical population biology, the Perron vector represents the stable relative age structure of the population. In asymptotic of the matrix model x(t) growths geometrically with rate λ1; therefore, λ1 is considered as an analog of a Malthusian parameter in unstructured population models. Eigenvalues of matrix L are solutions of the following equation: |L − λI| = 0.
To estimate the growth rate and stable age structure of the considered population we calculated the dominant eigenvalue (λ1) and the Perron vector (x*) of the projection matrix (2).
2.4. Effect of Changing Environments (Introducing Stochasticity to the Model)
In changing environments, the population growth rate may differ from the one that is predicted by a deterministic model with averaged coefficients [30]. The considered northern fur seal population demonstrates fluctuations of both survival rates of various age groups and bull reproductive efficiency every year, which require supplementing the deterministic growth rate obtained previously with its stochastic estimate (λe).
For each considered period, we constructed a set of annual projection matrices constituted by survival rates and bull reproductive efficiency corresponding to the natural order of observations. To simulate a sequence of “successful” and “unsuccessful” years, we permutated the initial set of projection matrices on a random base and used it to get a random realization of long-time dynamics, which allowed the calculation of the mean stochastic growth rates [26]: logλe = (logN(T) − logN(0))/T, where T = 1000. To estimate the variance of the mean stochastic growth rate (λe), we constructed histograms of its distribution by repeating each permutation series 1000 times.
2.5. Characteristics of the Data of Females from Marine Samples (Obtained during Observations in 1958–1988): Dynamics of Pregnant Females’ Proportion and Sex Ratio
Since the observed number of females at the rookery underestimates the total number of sexually mature females to some extent, we supplement it with information available from marine samples in the previous period. We use estimates of the total number of mature females F(n) and the proportion of pregnant females λ(n) from marine samples obtained previously [24]. Using these estimates and the observed numbers of bulls at the rookery, we obtain the dynamics of sex ratio in the population F(n)/M(n) for the period 1958–1988. Then we compare the estimated (or actual) sex ratio with those observed on the rookery Fobs(n)/M(n) for 1980–1988 and calculated tFobs(n)/M(n) for the previous period, 1958–1979.
Then, to answer the question whether the proportion of pregnant females decreased at high values of their number per male, we develop a linear regression of the proportion of pregnant females in the next year λ(n + 1) and the number of females per male (F(n)/M(n)) in the current year and estimate the significance of this dependence.
Using available data on the ages and physiological state of females from marine samples, we calculate the proportion of pregnant females by age.
2.6. Rough Estimates of Mature Female Numbers in the Late Period
Unfortunately, the late period (1988–2013) has no available data of total number of mature females in the population; therefore, we supplement it with rough estimates of their number. Using available field counts of pups born on Tyuleniy Island (P) along with minimal (λmin = 0.44), median (λme = 0.72), and maximal (λmax = 0.84) proportions of pregnant females registered in the marine samples, we calculate the upper F(λmin), median F(λme) and lower F(λmax) estimates of the total number of mature females in the population for each observation year:
F(λmin, n) = P(n)/λmin; F(λme, n) = P(n)/λme; F(λmax, n) = P(n)/λmax.
Then we analyze the dynamics of the sex ratio in the population using the obtained boundary estimates (F(λmin, n)/M(n), F(λme, n)/M(n), F(λmax, n)/M(n)) and compare them with the observed dynamics of this proportion F(n)/M(n) for the period 1958–1988. In addition, comparing the observed sex ratio on the rookery with the calculated ones, we estimate the difference with the previous period for which data are available.
2.7. Partitioning All Observation Period on Several Parts Taking into Account Changes in Bull’s Reproductive Efficiency and the INTENSITY of the harvest
To calculate for the average values of model parameters, we divided the entire observation period into several homogeneous parts. The simplest way would be considering all observations before 1988 and after separately, given that the population tendency has changed statistically significantly after 1988 [23,24]. However, the early period (before 1988) is evidently inhomogeneous in terms of the bull’s reproductive efficiency; therefore, the data were divided into three parts: 1959–1973, 1974–1978, and 1979–1988. Moreover, the strategy and intensity of the harvest was significantly changed during that time (1958–1988), and these changes mainly correspond to those of the bull’s reproductive efficiency.
3. Results
3.1. Dynamics of Numbers and Ages of the Animals Harvested on Land in Different Years
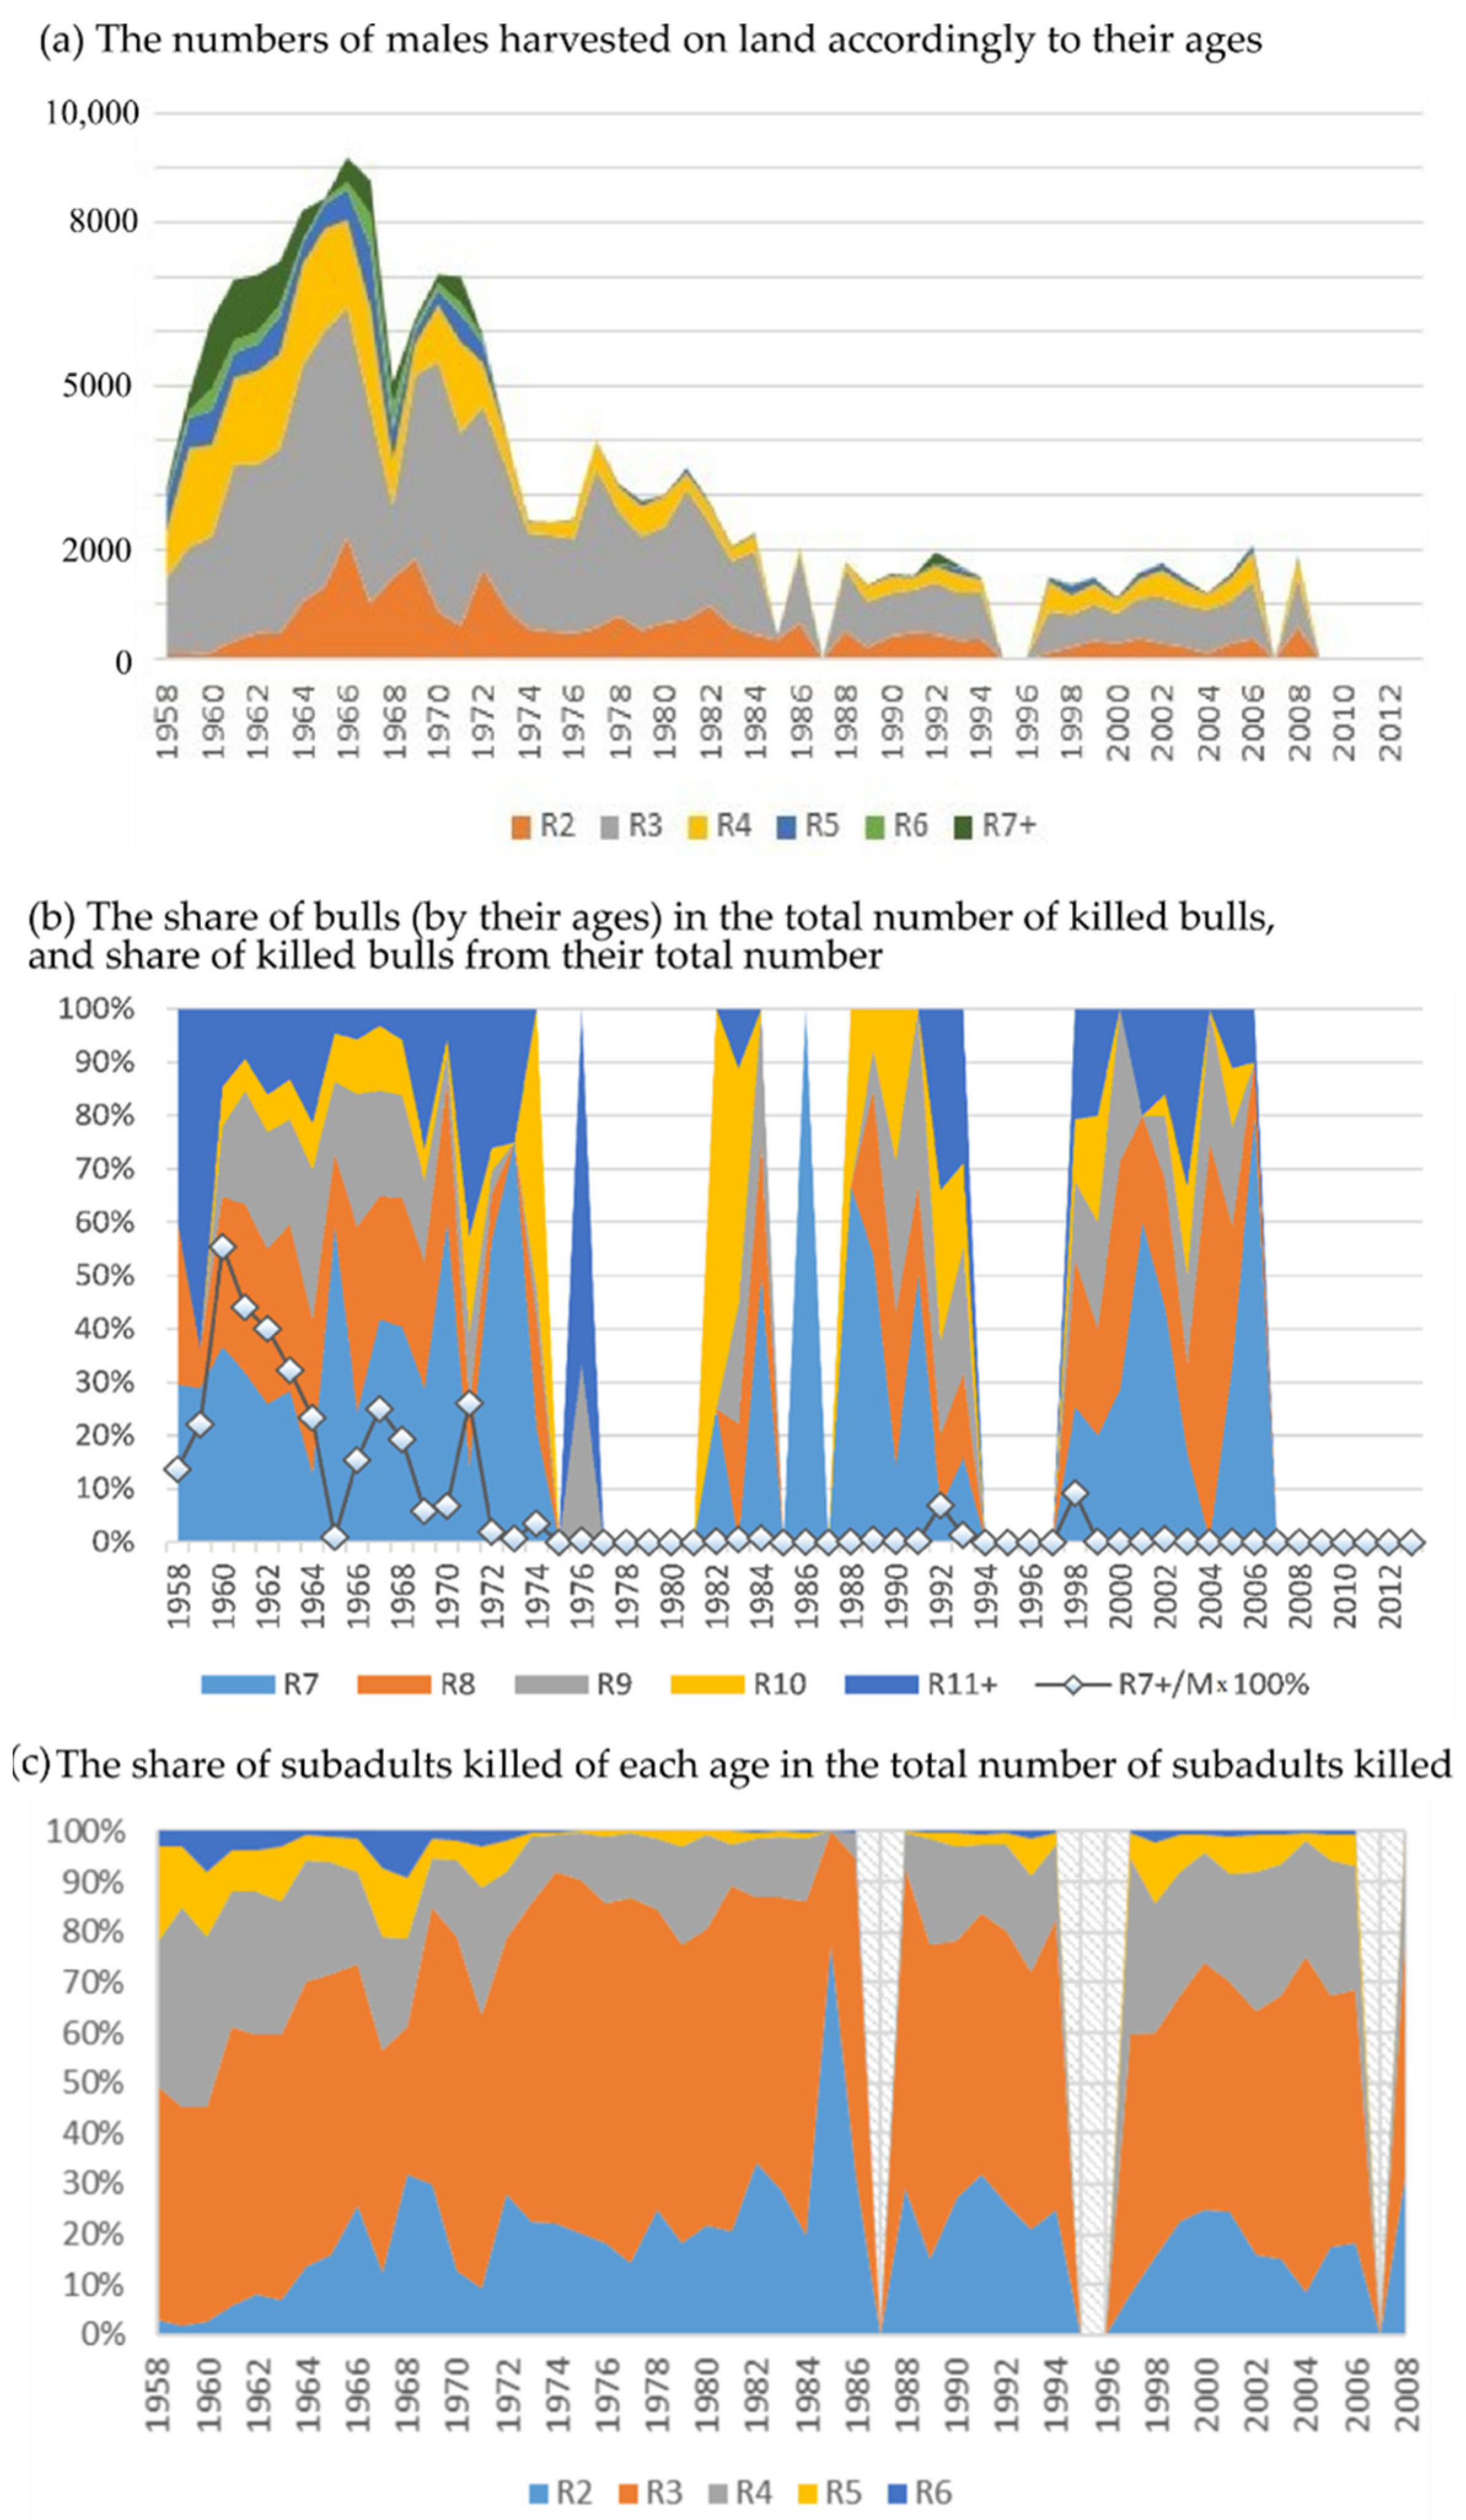
The earliest period (1958–1972) is characterized as a time of intensive harvesting, when, along with subadult males, bulls were killed, and their share is essential in the total withdrawal volume (Figure 3a). In some years, up to 40–50% of the total number of bulls were killed (Figure 3b). Since 1972, the harvest of bulls was almost banned. In the following years (1973–1988), it averaged only 0.5%, and the total harvest volume was noticeably reduced. The next reduction in harvest volume was in 1988, and bulls were almost not being hunted during this time. In 2008, the harvest on Tyuleniy Island was completely banned.
Note that the proportion of two-year-old males in the total subadults (being from 2 to 6 years old) killed is significant throughout the entire harvesting except for the first three years, and in some years, it even exceeds that of the target group of four-year-olds (1966, 1968–1969, 1972–1978, 1980–1986, 1988, 1990–1994, 2000–2001, 2008 years, Figure 3c).
3.2. Dynamics of the Observed Average Harem Size and the Reproductive Efficiency of Bulls
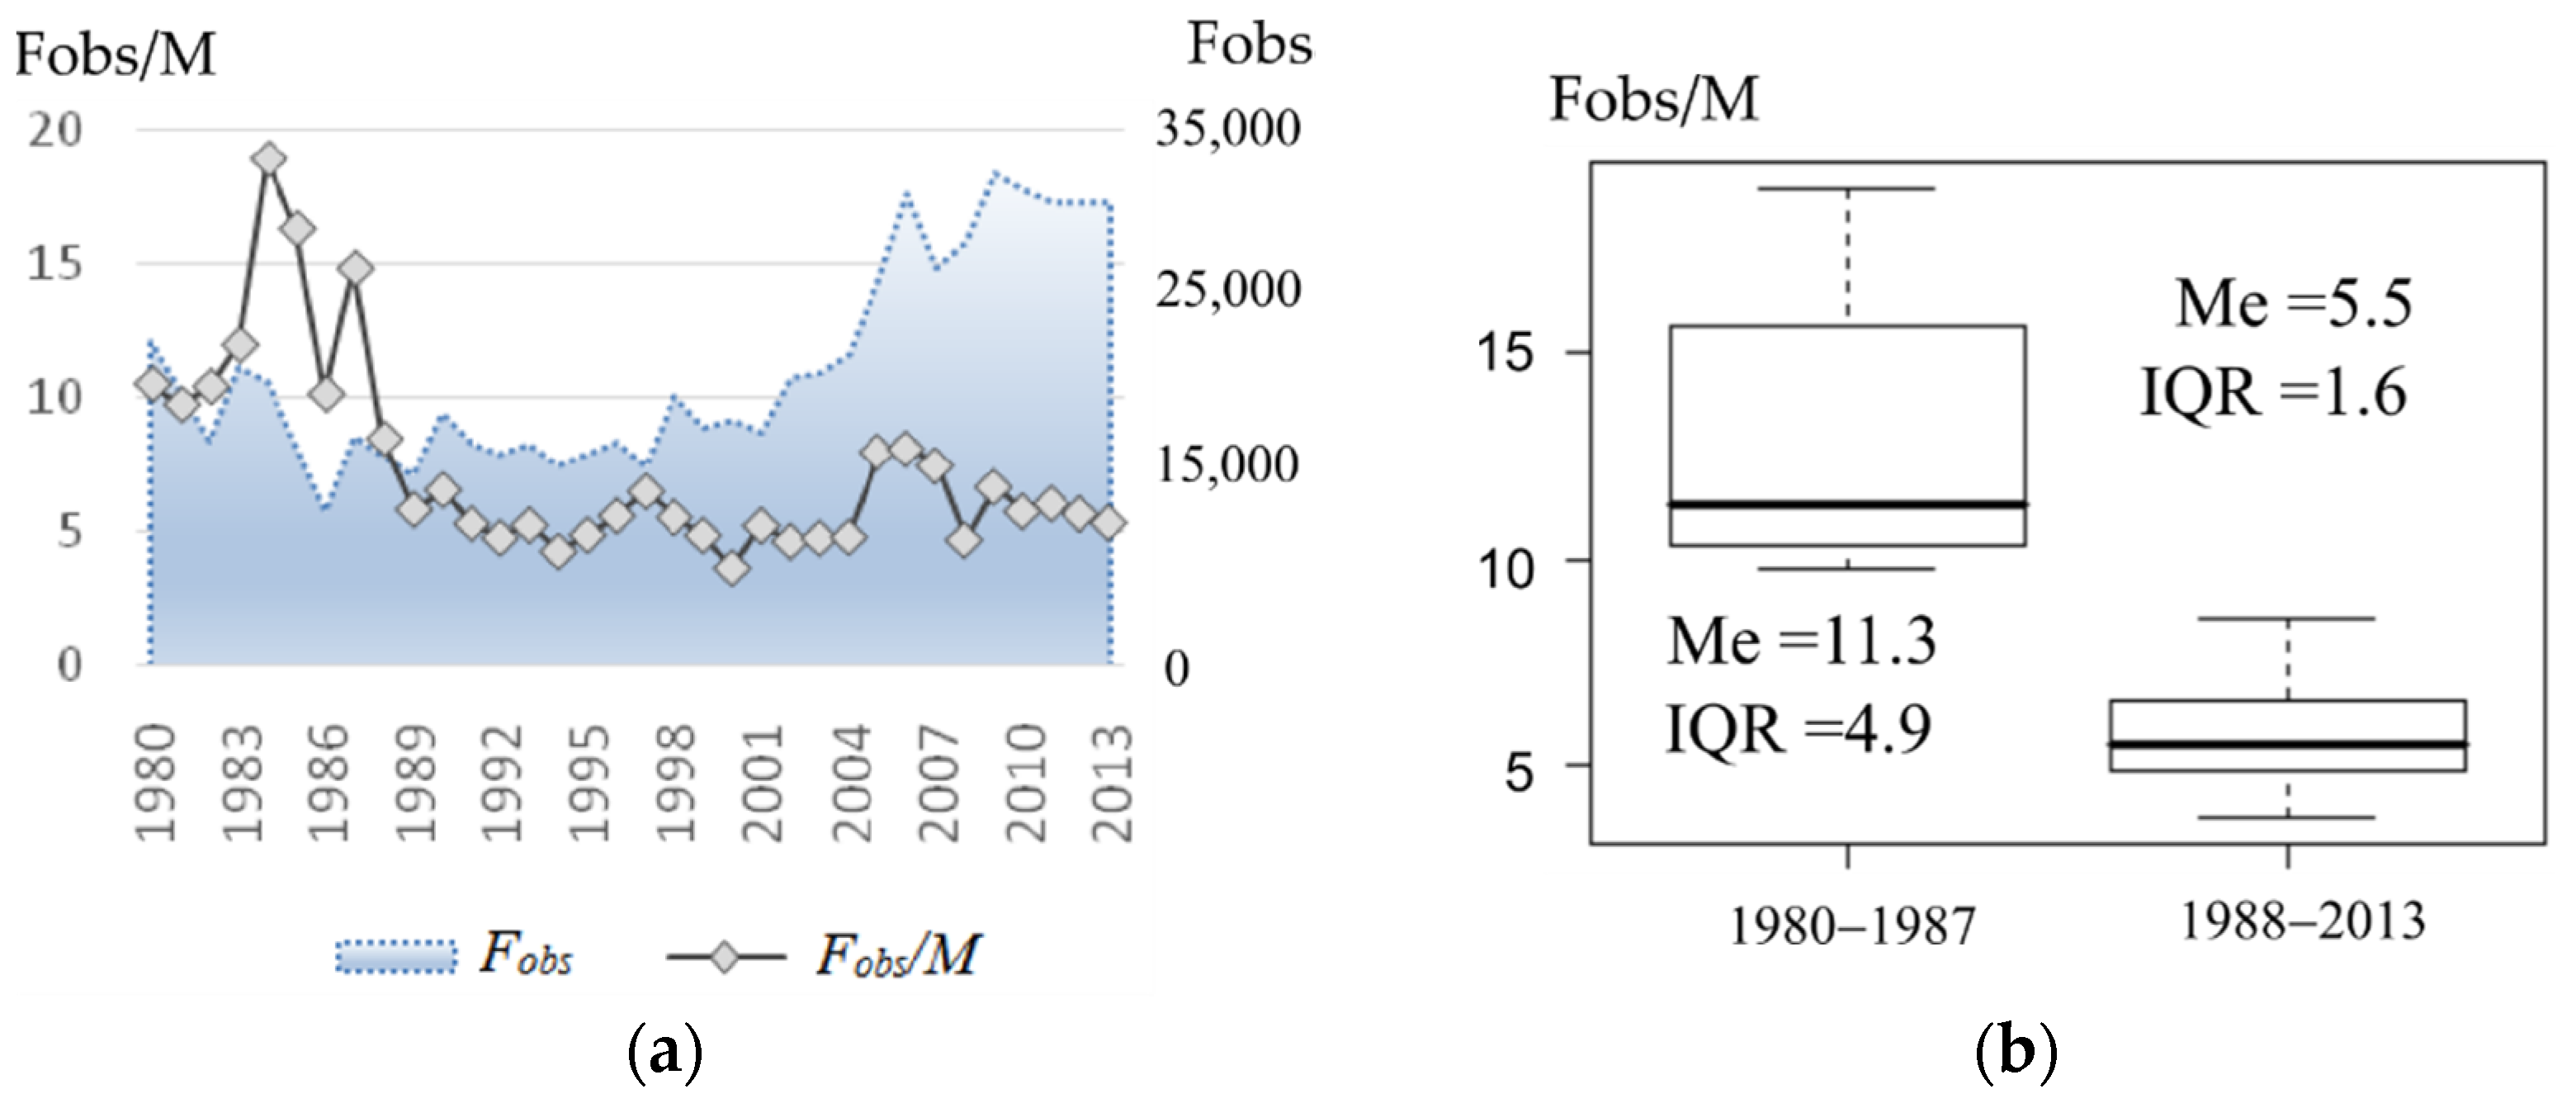
The change in the visual sex ratio that occurred around 1988 is readily seen in Figure 4a. By dividing the entire observation period in two: before and after 1988 (Figure 4b presents box plots corresponding with two periods), the average harem size was reduced more than twice (by medians (Me) of the periods: 11.3 and 5.5 respectively). In addition, the interquartile range (IQR) reduced markedly (from 4.9 to 1.6), i.e., the average observed harem size dropped to around 5.5, which remained almost stable for over 20 years.
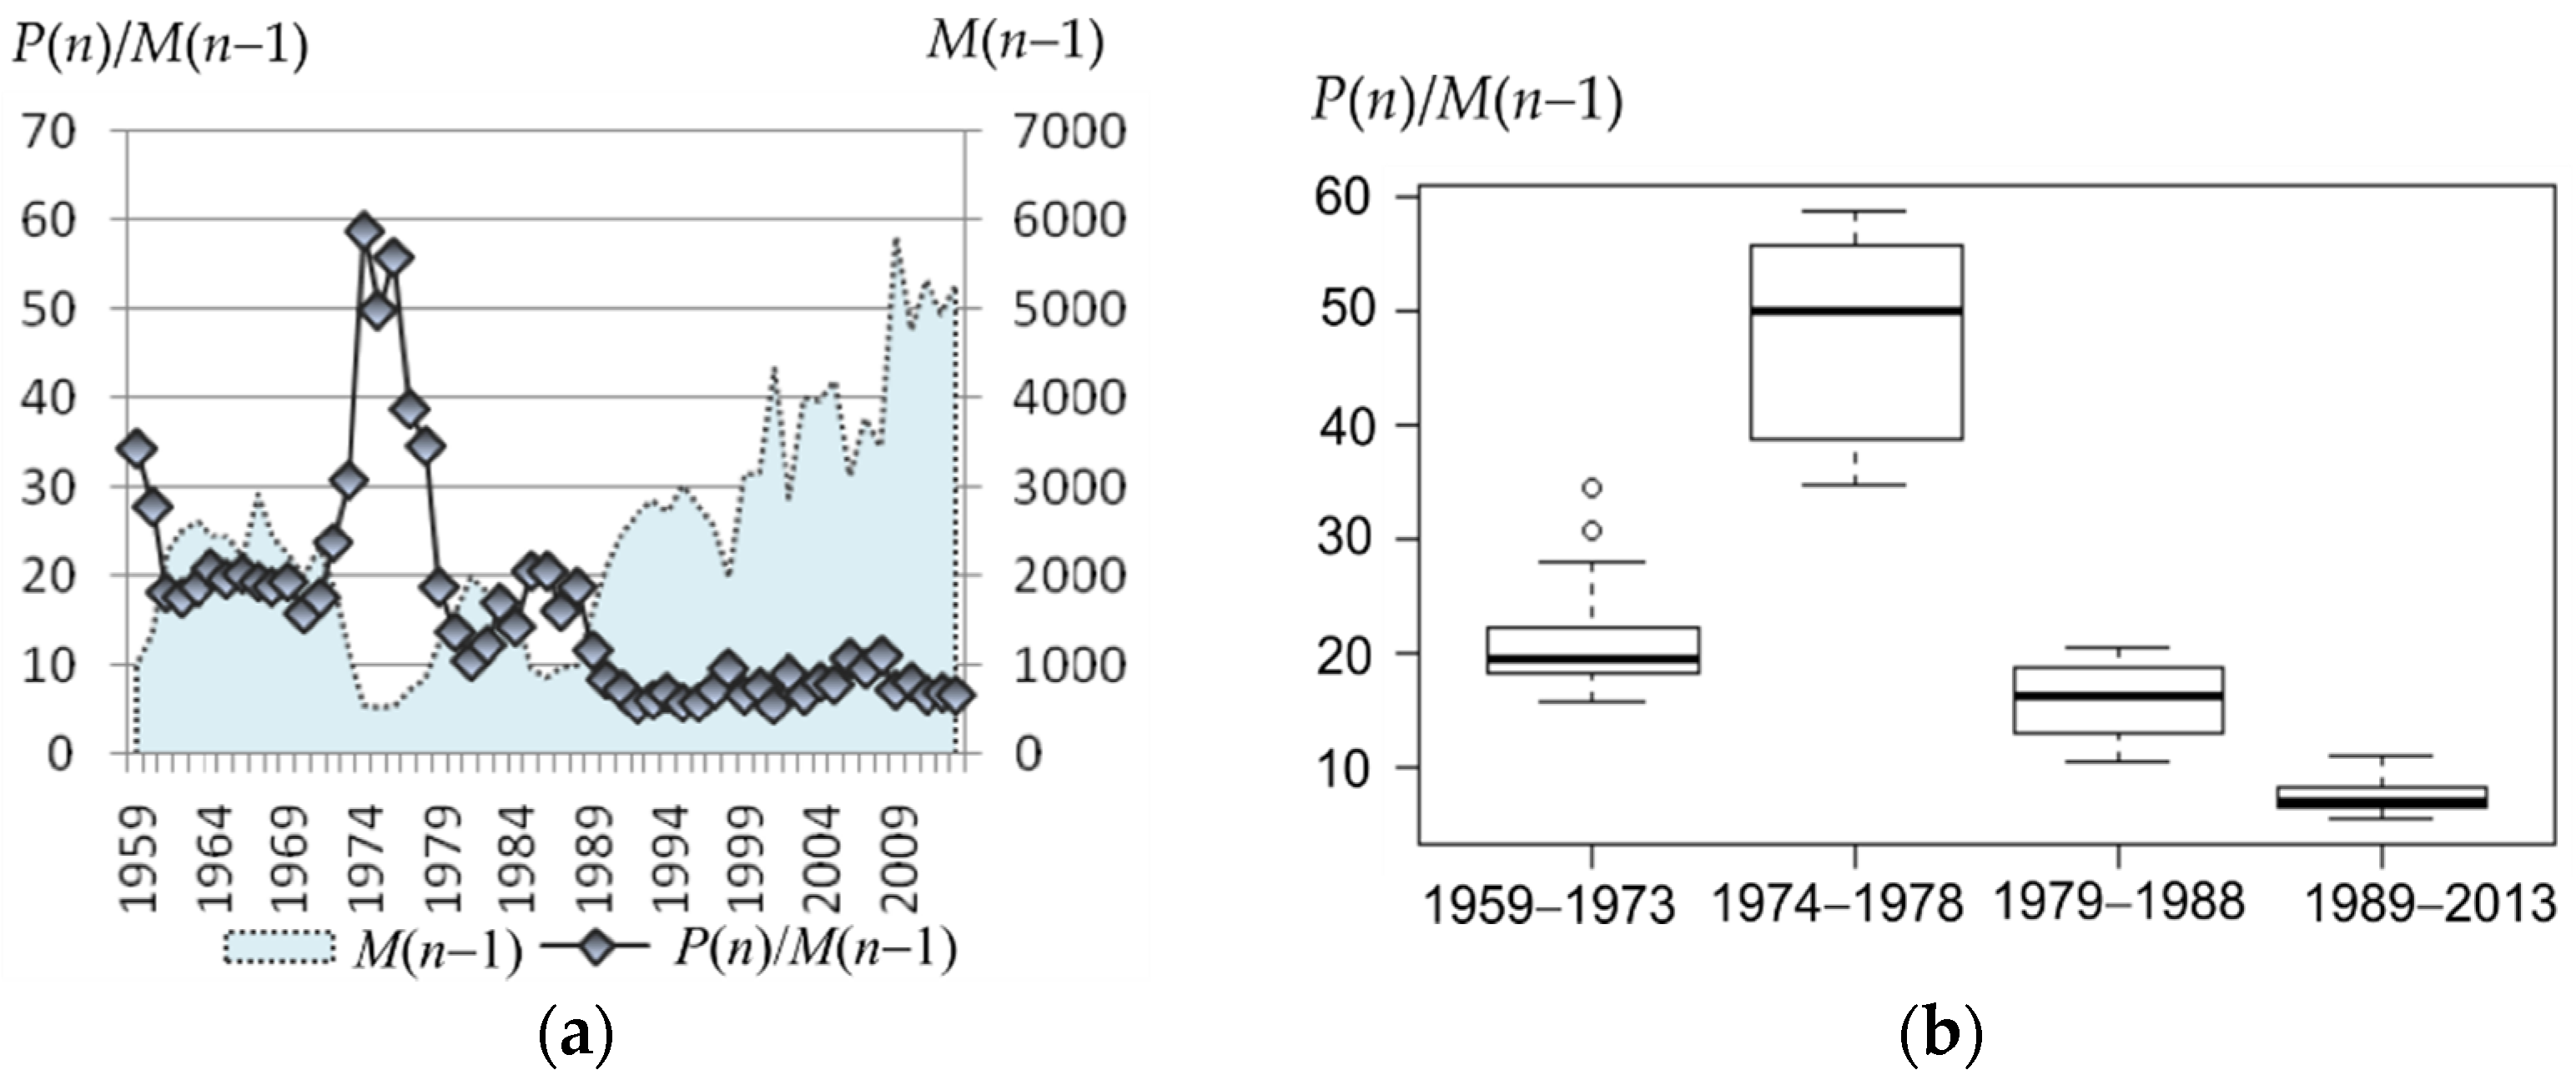
The shift in reproductive efficiency is readily seen. At the beginning of the observation, it was twenty pups per bull and higher (1959–1973: Me = 19.4, IQR = 3.9), with a sharp peak in the 1970s (1974−1978: Me = 50, IQR = 17); then, it dropped to 10–20 (1979–1988: Me = 16.2, IQR = 5.8). Since the late 1980s (parallel with the steady increase in the bulls’ number), it dropped to the next level around 10 (1989–2013: Me = 7.1, IQR = 1.8) and then remained stable for over 20 years (Figure 5).
Considering the dependence between the observed harem size and the average number of pups per bull (or the bull’s reproductive efficiency) and comparing the periods for which both these parameters are available (1980–2013), not only a qualitative but also a quantitative coincidence of their tendencies can be observed. Indeed, the average harem size decreased more than twice after 1987 (2.1 times), and the bull’s reproductive efficiency demonstrated even a slightly larger decrease (2.3 times) after 1988. Annual delay is quite natural because the results of a harem life (i.e., newborn pups) appear the following year. In addition, a similar decrease in the interquartile range was observed (3.1 and 3.2 times—for the harem size and the bull’s reproductive efficiency, respectively).
The Granger causality test [31] confirms (p << 0.001) the presence of causal relationship between the considered time series with a lag of 1, where the observed average harem size is Granger-cause for the bull’s reproductive efficiency, i.e., the values of the observed average harem size provide statistically significant information about future values of a bull’s reproductive efficiency. Figure 6 presents the available observations, as well as the dependence of harem production (P(n + 1)/M(n)) on its observed size (Fobs(n)/M(n)), as estimated by the least squares method (OLS):
P(n + 1)/M(n) = 1.27* Fobs(n)/M(n).
The linear model has a highly significant (p < 0.0001) regression coefficient and the coefficient of determination is R2 = 87.5%. Chow test showed that there was no change in the trend, i.e., although the size of the harems clearly decreased after 1987, the production remained at the same level.
Given the significance of regression (4), we substitute the known number of newborn pups in it to obtain theoretical values of the observed number of females (tFobs) for the previous period being out of observational data:
tFobs(n) = P(n + 1)/1.27.
3.3. Changes in Population Growth Rate and Stable Age Structure, Results of Deterministic and Stochastic Modeling
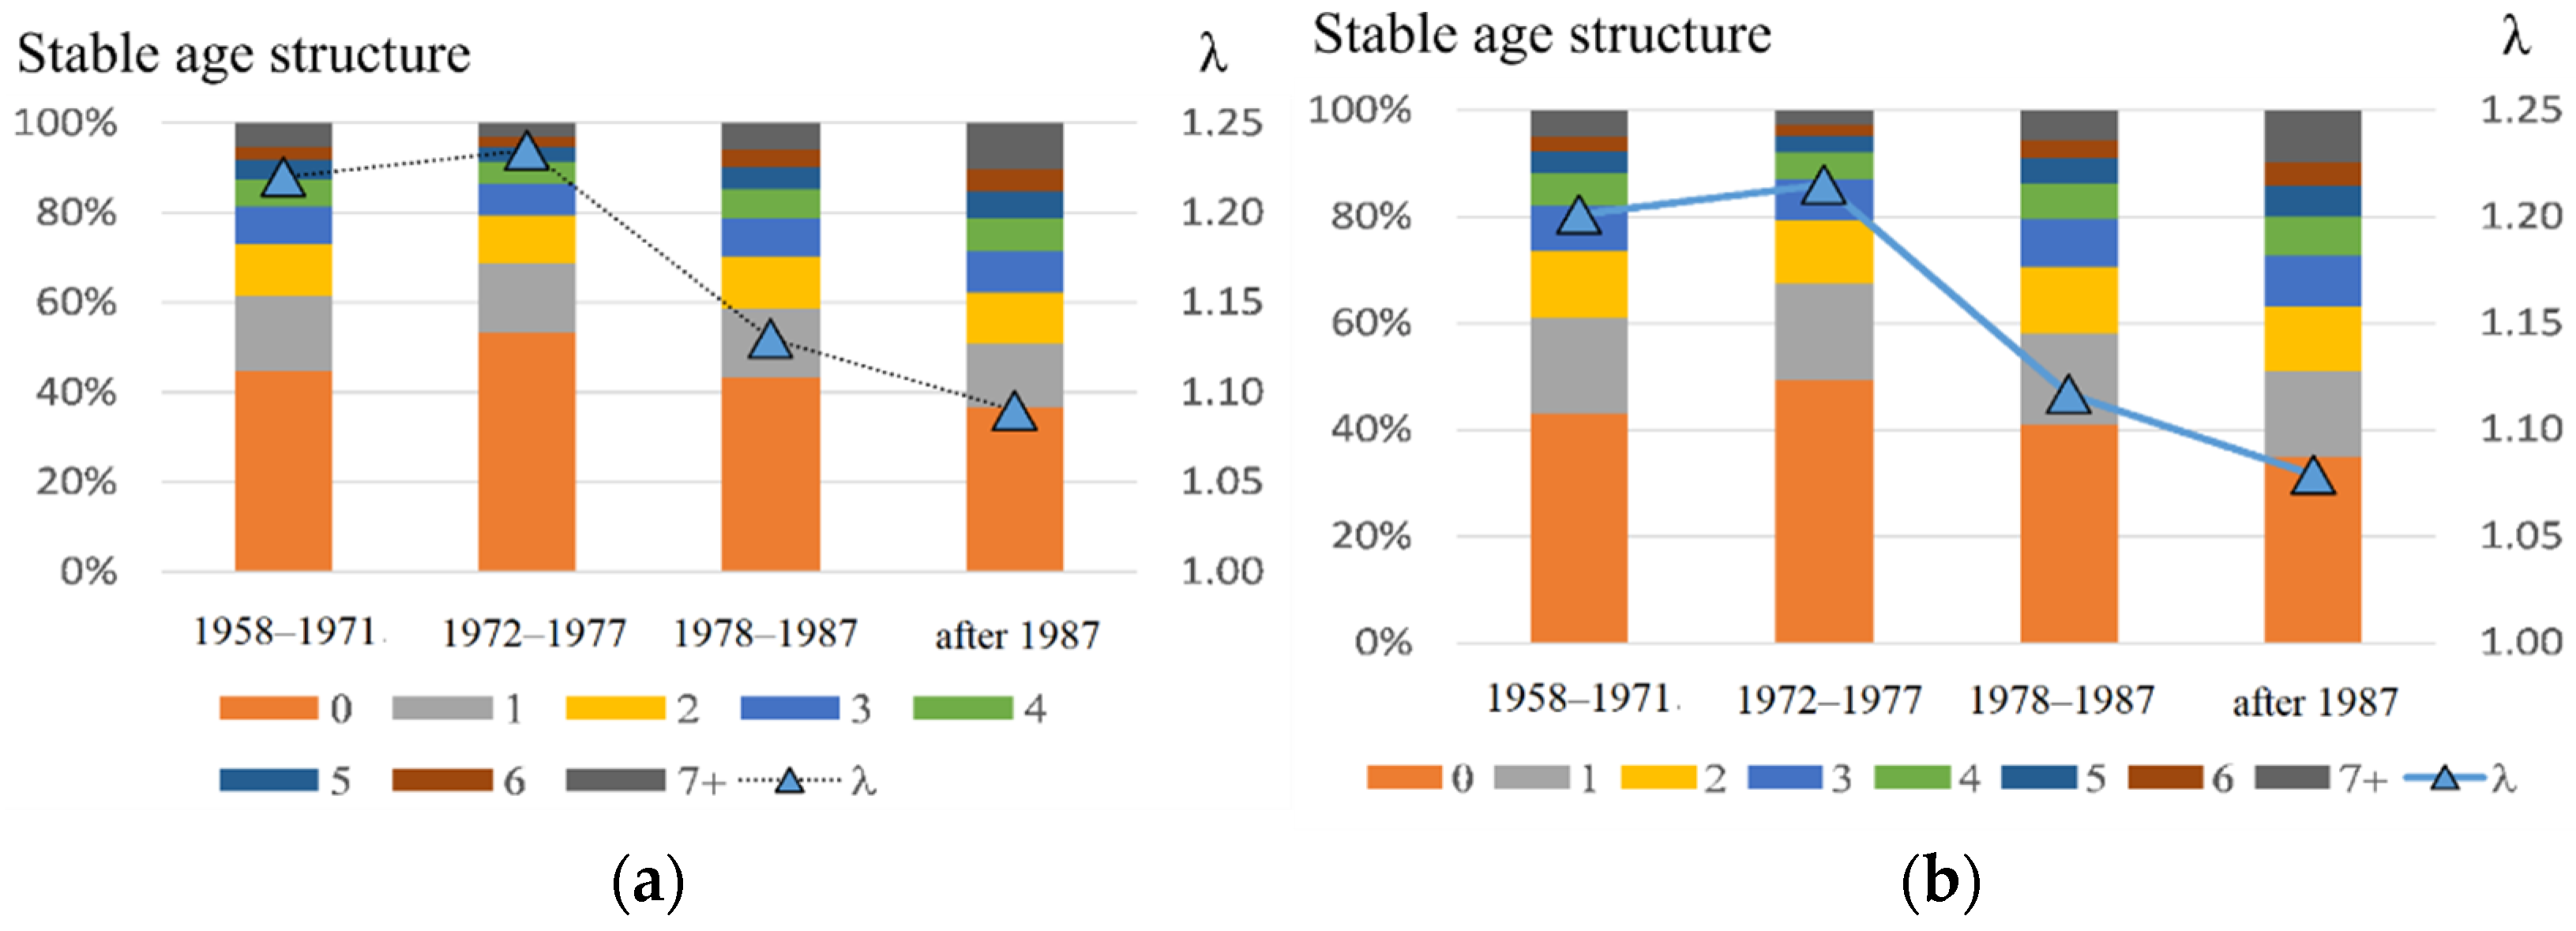
Table 1 contains the model coefficient values used in calculation and the results of the modeling. Both estimates (by the iteration and fitting methods) give similar findings (Figure 7); in comparison with the early period, the annual population growth rate has become considerably lower (8–9% vs. 20–24%). Moreover, its stationary composition was also altered. The proportion of pups dropped from 43–53% to 35–37%, and that of bulls grew from 3–5% to 10%.
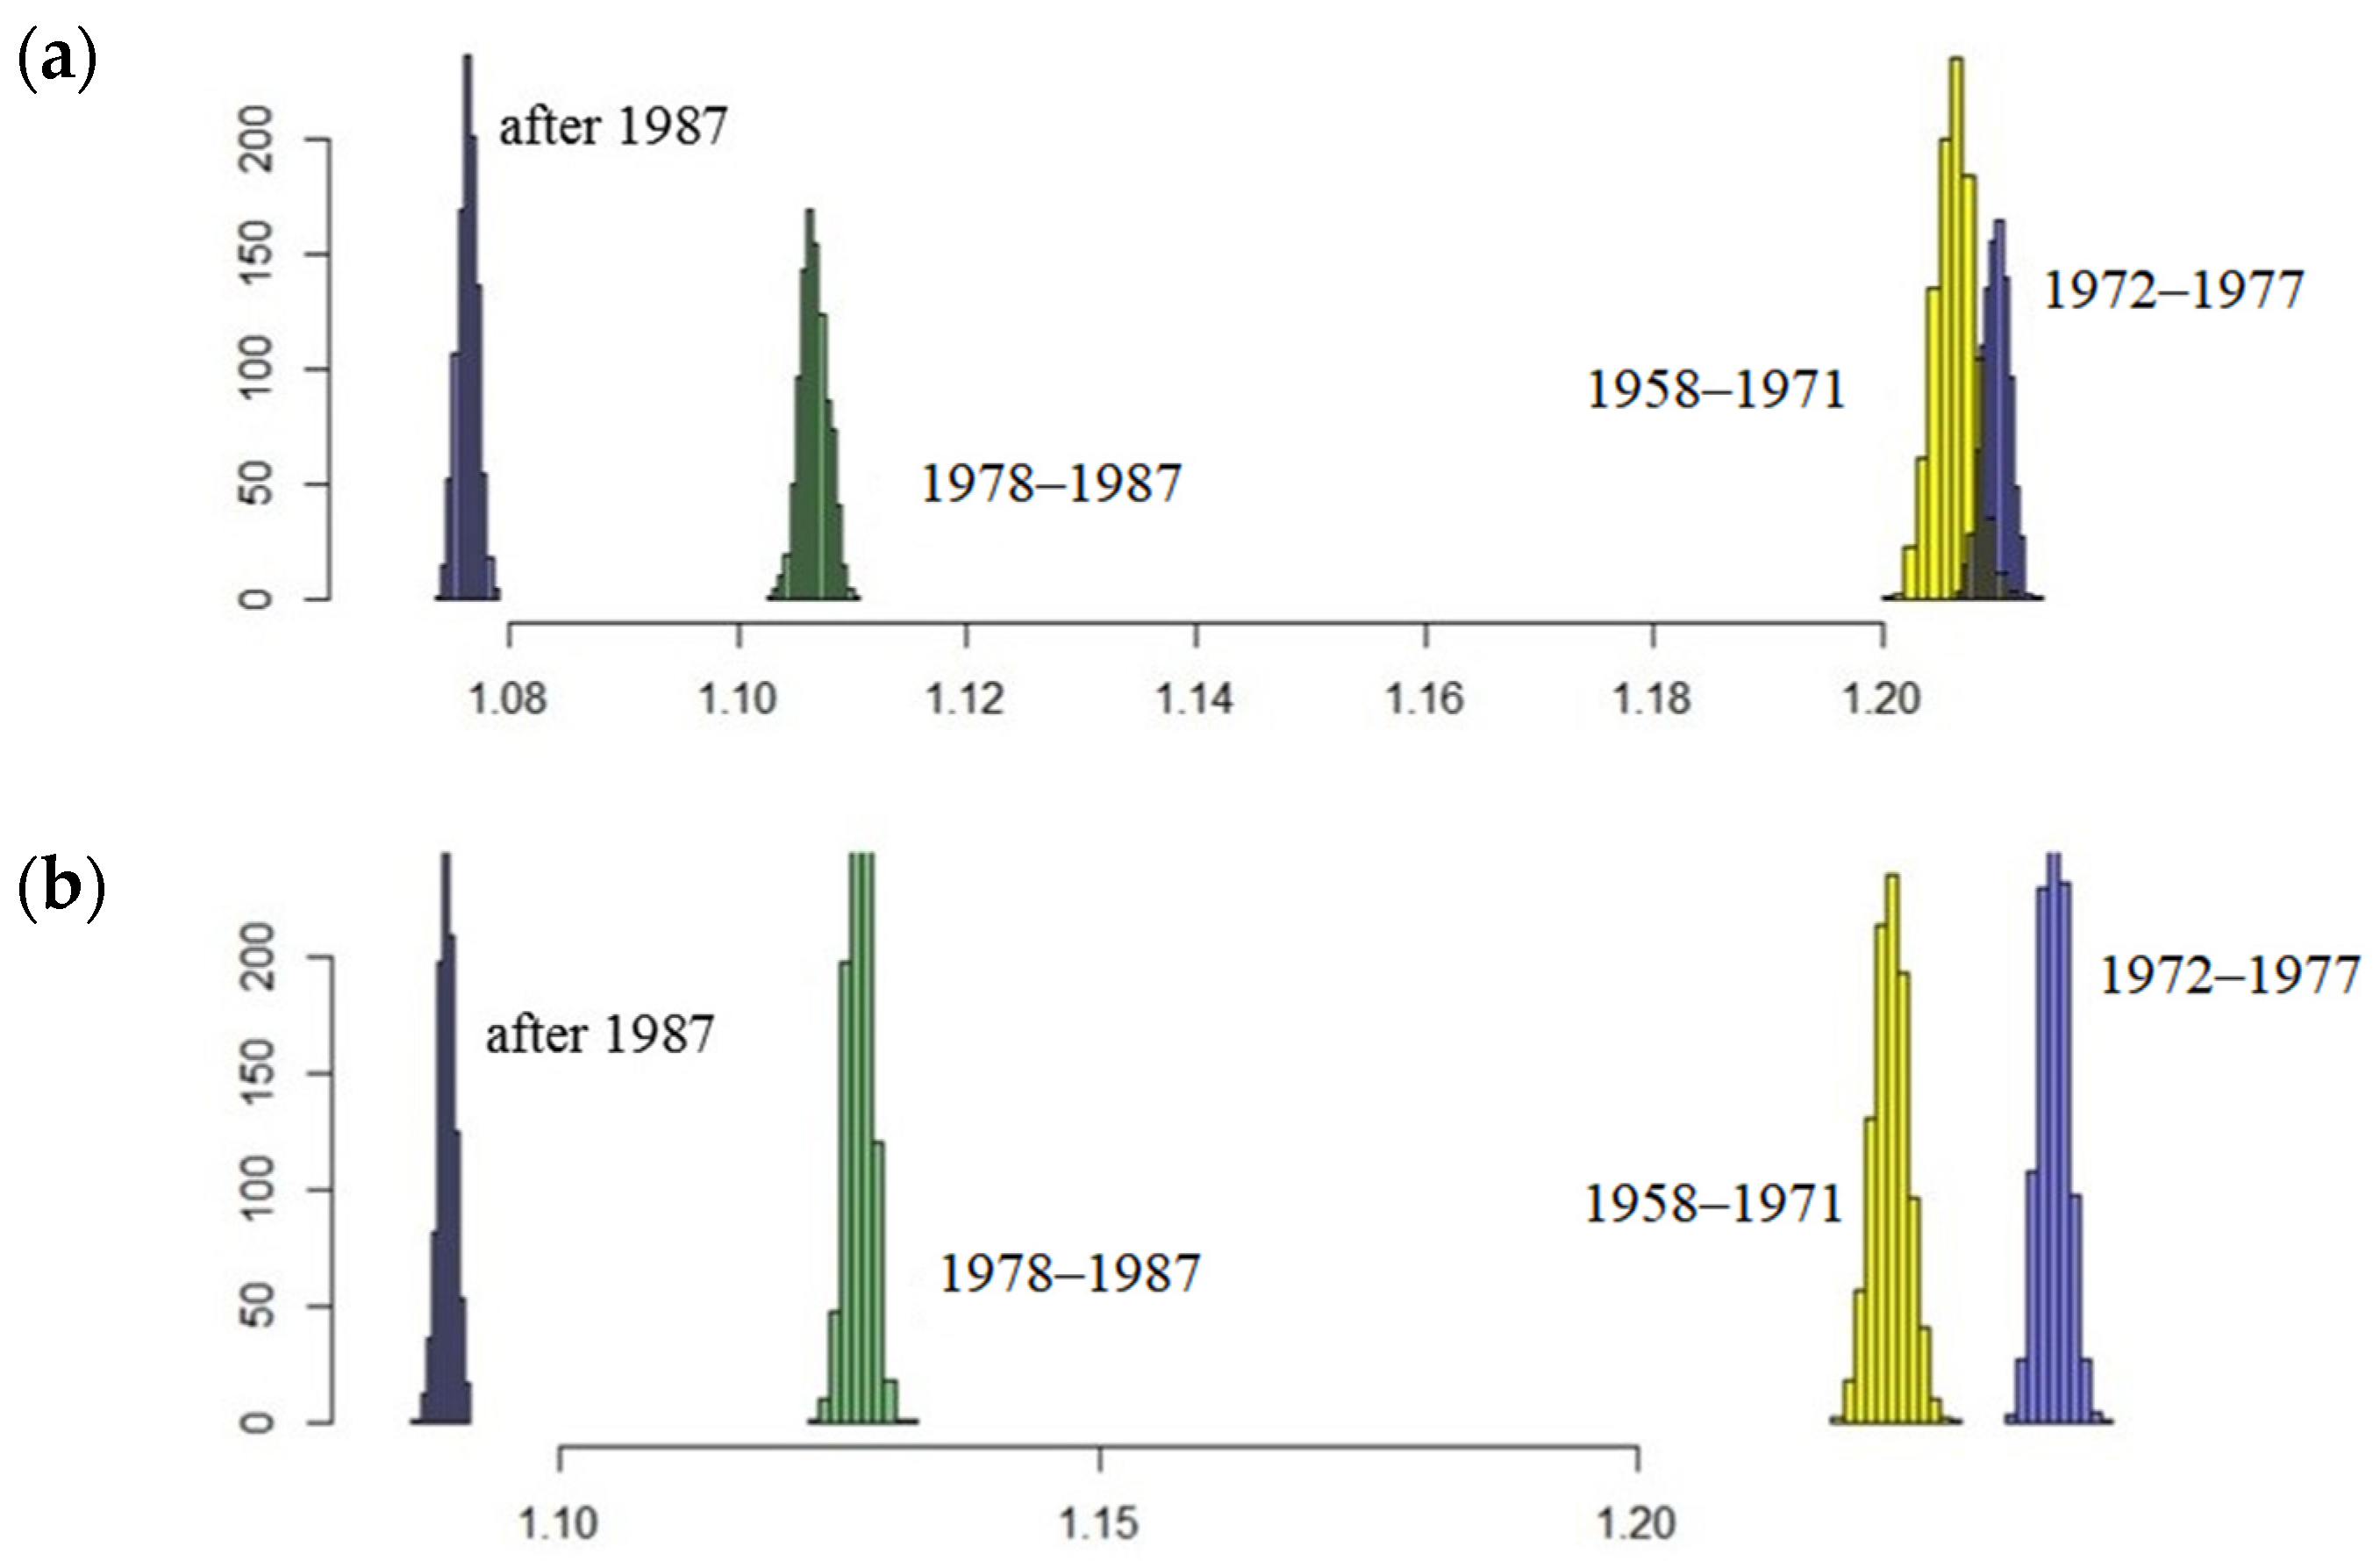
The results showed that the northern fur seal population on Tyuleniy Island is still growing. However, annual changes in the coefficients of matrix (2) raise the question about their ability to affect the population trend in general. Will the population continue to grow? If the values of the model parameters deviate slightly from the average (within the observed range), will its trend not reverse? To answer these questions, we performed simulations with a random selection of projection matrices from the original set according to defined periods. Results of stochastic modelling confirm those of the deterministic model (Figure 8). Indeed, the periods are evidently inhomogeneous in terms of population growth rate, especially after the time of intensive harvest (two last periods, 1978–1987 and after 1987), the distributions of λe in the late periods are far from the early ones, i.e., the expected rate of population growth has declined significantly lately.
3.4. Actual vs. Observed Sex Ratio (Including the Calculated One)
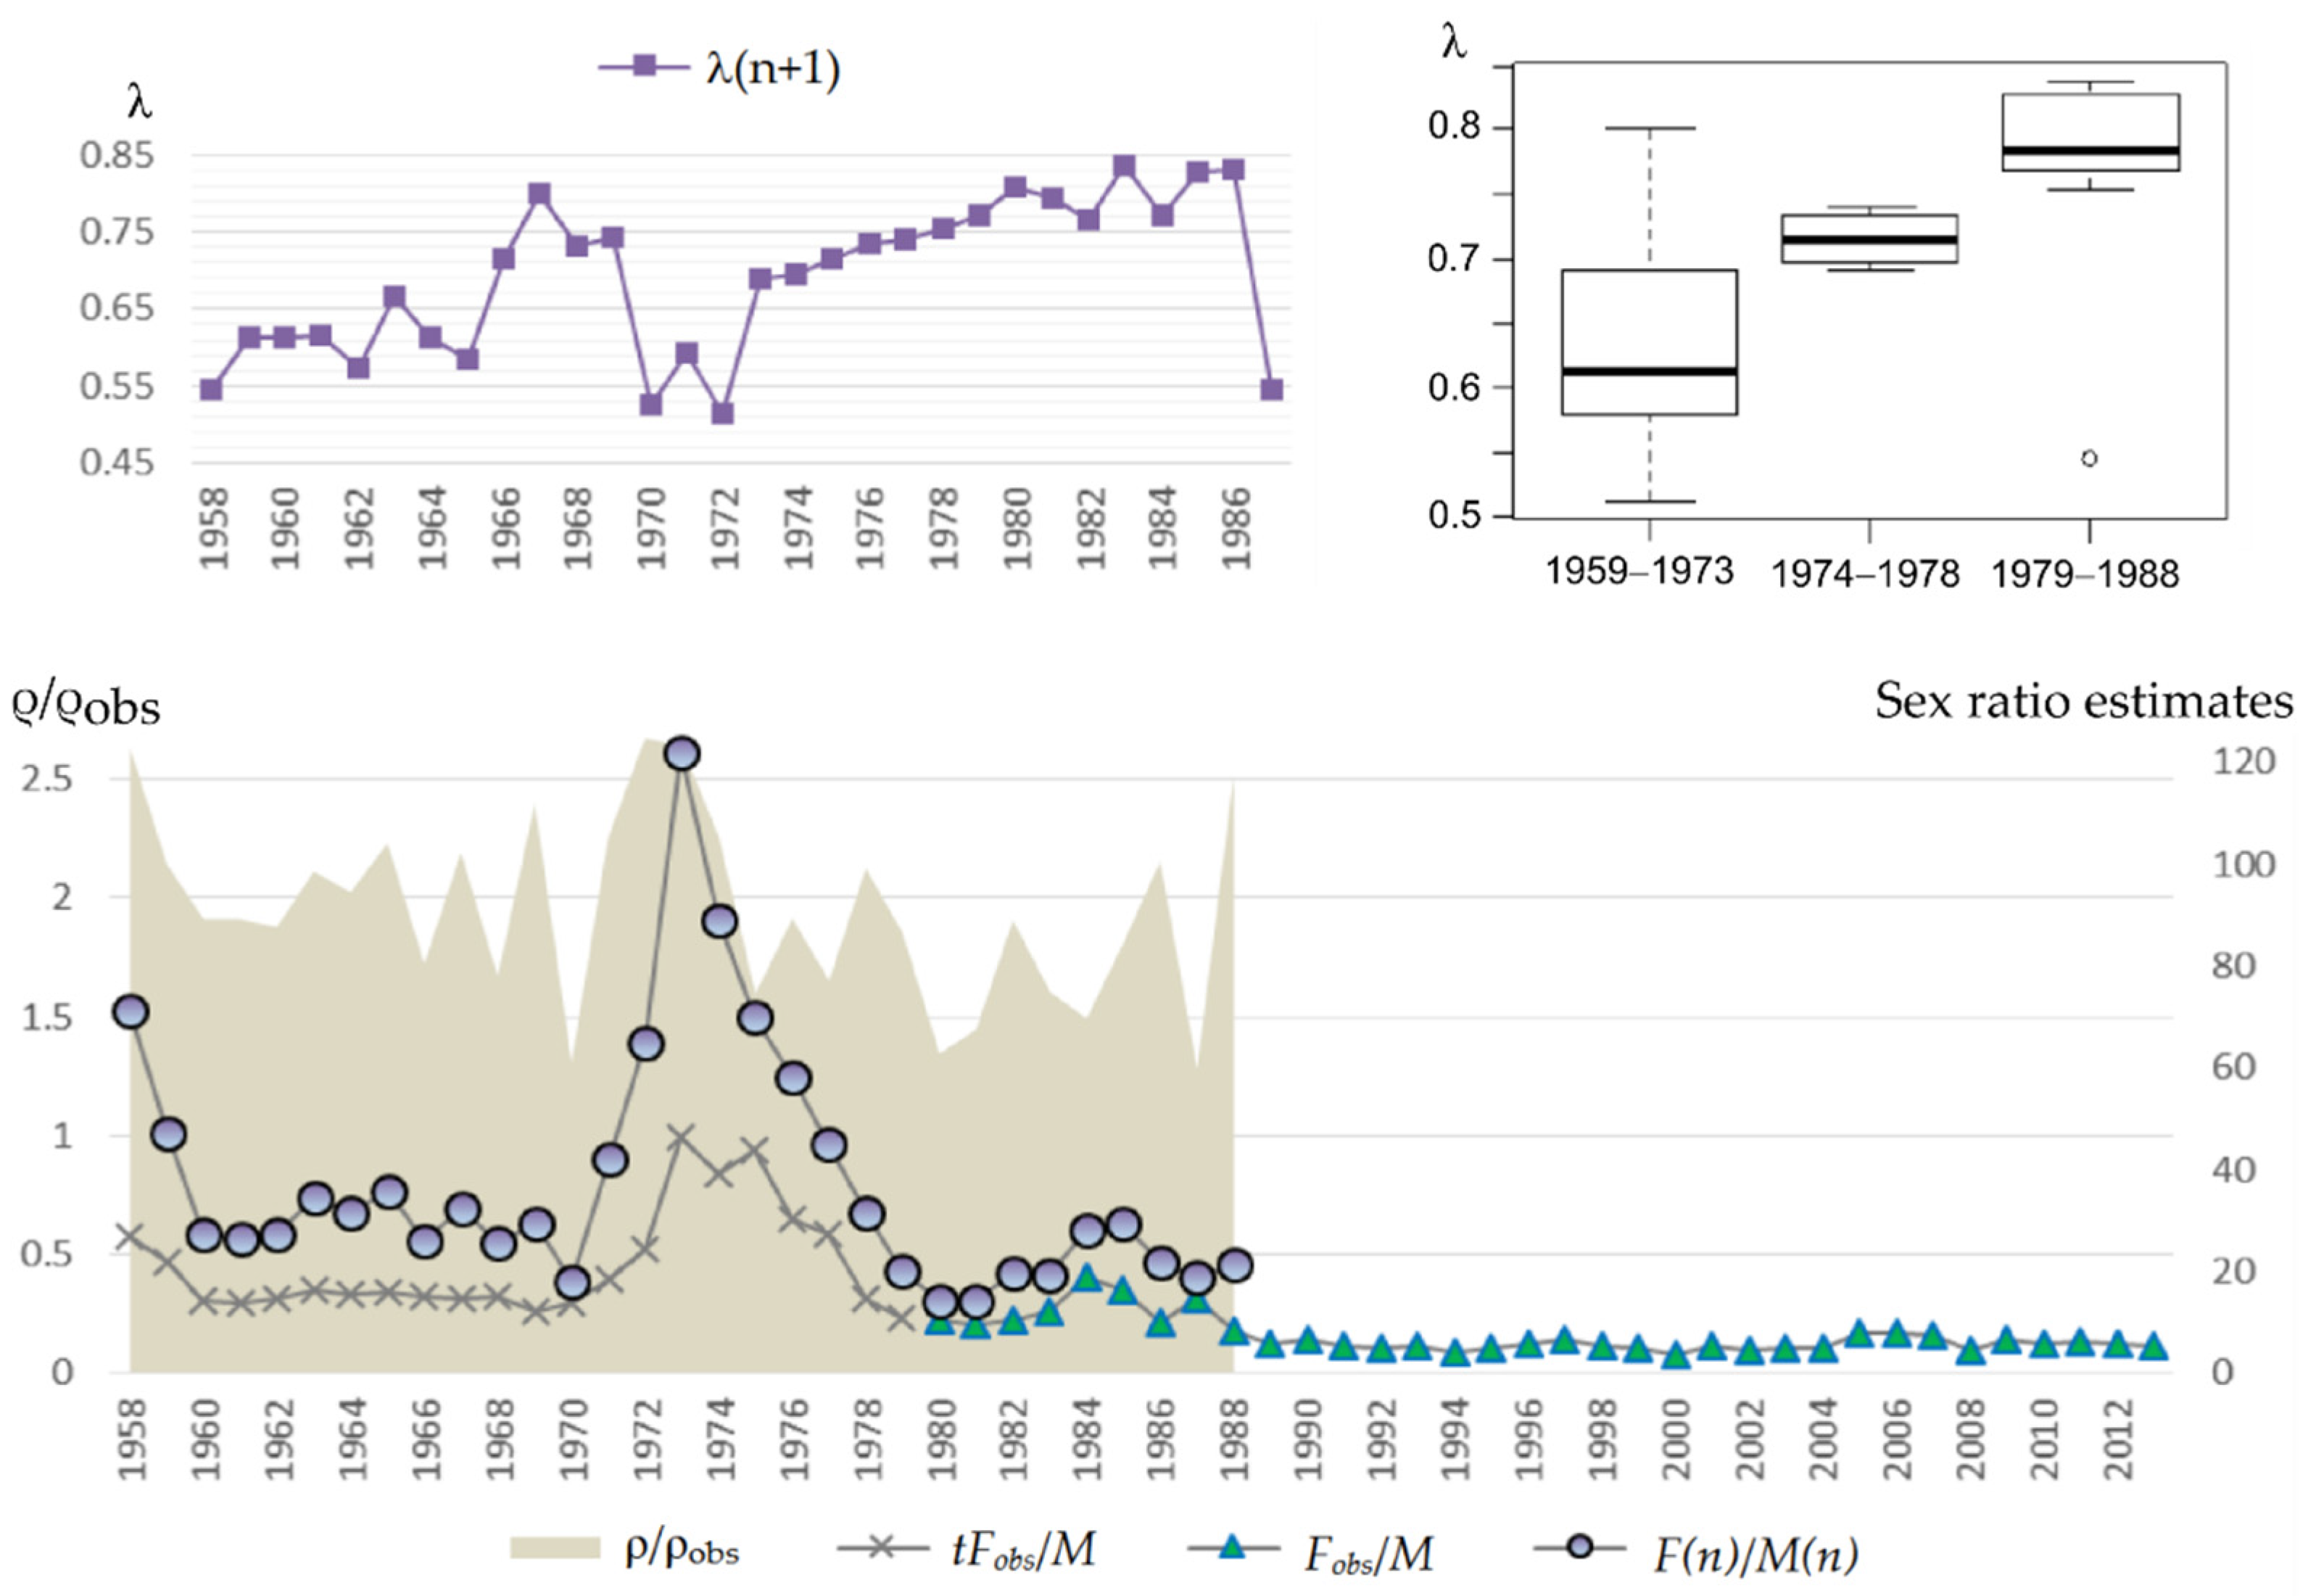
Figure 9 (bottom) shows the dynamics of actual sex ratio ρ = F(n)/M(n) for the period 1958–1988, visual sex ratio ρobs = Fobs(n)/M(n) for 1980–2013, supplemented by calculated ones tFobs(n)/M(n) for 1958–1979 based on Equation (5). One can see the number of mature females in the population is always greater than that observed on the rookery, and the difference varies from year to year. The minimum value of ρ/ρobs = 1.28 corresponds to 1987, the maximum ρ/ρobs = 2.67 to 1972, and the average ρ/ρobs = 1.96.
Figure 9 (top) shows the dynamics of pregnant females’ proportion based on the available data from marine samples and a box plot of this indicator for the periods corresponding to different reproductive efficiency of bulls. One can see the pregnant females’ proportion varies within the range from 0.51 to 0.84. Its minimum value was observed in 1973, λ(1973) = 0.51, at sex ratio 64.8. However, the next year showed much higher value λ(1974) = 0.69 at sex ratio 122 females per bull. Low values of λ were also observed in 1959, 1971 and 1988: λ(1959) = 0.55, λ(1971) = 0.53, and λ(1988) = 0.54 at sex ratios of 71, 18, and 19 females per bull, respectively.
On the base of available data, the linear model (OLS) gives a statistically insignificant dependence of the proportion of pregnant females in the next year λ(n + 1) on the current year sex ratio λ = −0.0009 ρ + 0.7263 (R2 = 0.0506). Thus, the sex ratio did not contribute significantly to the proportion of pregnant females during the entire observation period. An increase in the average for this index seems to be related to the aging of the female population, which was shown in our previous paper [24], given older females are more successful in reproduction (Figure 10).
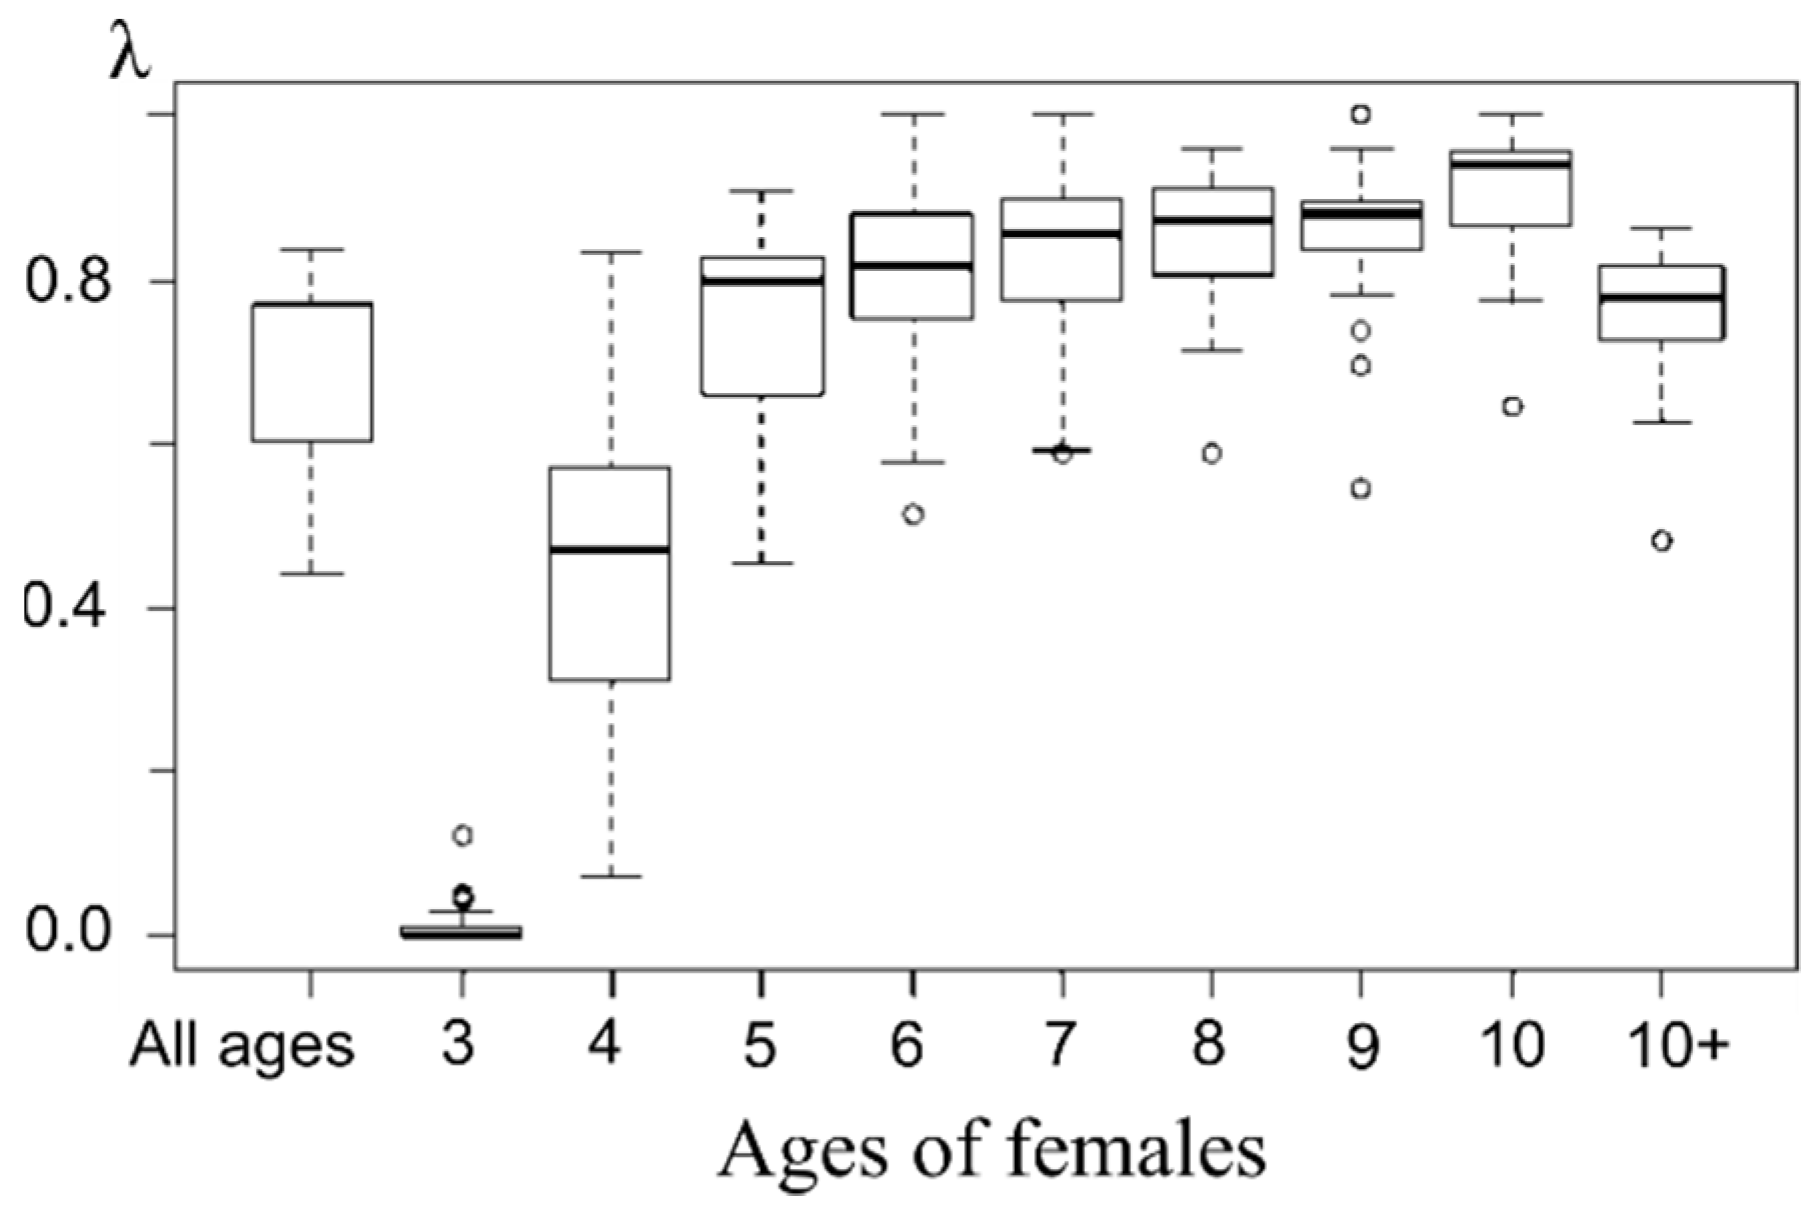
Note that the proportion of pregnant females increases starting at age 5 and remains consistently high (above the average for the entire sample) until age 10+, where it decreases slightly, which may be related to the mixed age composition of this group (females ages 11 and up) and aging effect (Figure 10). A steadily low pregnancy proportion shows three-year-old females (rather even negligible compared to other groups). The next age group demonstrates a higher level of pregnancy that still stands lower than that of older females’. Apparently, 4 years is the age when females of northern fur seals are ready to start breeding, but pregnancy success depends on a variety of factors; hence there is a wide range of observed values and the average proportion of pregnant females of this age is consistently lower than in older females.
3.5. Results of Calculation: Rough Estimates of Mature Females’ Numbers in the Late Period
Figure 11a shows the calculated dynamics of the upper F(λmin), median F(λme) and lower F(λmax) estimates of the total number of mature females in the population for each observation year. The dynamics of females’ number estimates from marine samples F(n) for 1958–1988 is also given. It falls within the given limits and gravitates toward the median estimate exceeding it somewhat in the early period and dropping slightly lower in the late period. Such a deviation is quite consistent with the dynamics of the average proportion of pregnant females, which tended to increase. In addition, Figure 11a shows the dynamics of bull abundance, which shows a marked increase in the late period of observations (after 1988). At the same time, if we assume the average proportion of pregnant females does not change, being at the level of the median λme, then the females’ number has not increased by now and lies even under its average value of the early period. A slight increase in the females’ number could only occur if the proportion of pregnant females decreased to the lowest of the observed λmin.
The disproportion between the growth rates of females and bulls is demonstrated by Figure 11b, which shows how the sex ratio in the population has changed. Table 2 shows the descriptive statistics of distribution. At the beginning of the observations, there were about 30 females per bull on average. Then, a period of extremely low number of bulls (1973–1977) with a sex ratio of 70 females per bull follows, which was probably only a consequence of intensive exploitation of the male part of the population and does not reflect the natural sex ratio for this population. Later, the number of females decreased significantly, while the number of males recovered and the ratio changed to 20:1. In the late period, assuming that the average proportion of pregnant females remains at the λme level, we see only about nine females per bull, which is more than three times lower than the ratio of the initial period and more than two times lower than that of the period of females’ number depression (1974–1988). Even with the proportion of pregnant females reduced to the lowest of the observed values λmin, the change in the sex ratio remains significant: about 15:1.
The difference dynamics between the sex ratio calculated by the average F(λme, n) and that observed at the rookery falls within the range of the period for which the observations are available (Figure 11c). Assuming lower pregnant females’ proportion λmin gives a higher difference between the observed onshore and real sex ratio with the values of this indicator beyond the range of the previous period, which could occur due to females beginning to spend more time in the sea searching for food.
4. Discussion and Conclusions
The analysis of numbers and ages of the animals hunted on land shows that harvest methods varied significantly throughout the exploitation period with twice the removals in the early period (1958–1972) versus the late period (1973–2008, Figure 1). In addition, the age structure of the harvested males varied over time due to intensive harvesting across all age classes in the early period (1958–1972). This practice was implemented to “improve” the population by hunting visually weak and sick animals. In some years, up to 40–50% of the total number of bulls were killed (Figure 1). Note that the strategy practiced at that time does not correspond to the optimal harvest strategy when the primary harvest volume should consist of subadult males. The strategy of the subadults harvest also does not fit into the theoretical scheme, which prescribed mainly taking 3–4 yearling males. Here, one cannot ignore the proportion of two-year-old males killed, which is a significant part of the total catch throughout the entire harvesting, and in some years it even exceeds that of the group of four-year-olds. It is unlikely that this was a deliberate violation of the prescribed strategy since the exact age of the male was determined only in the killed animals by the tooth rings. The decision to harvest was based on the appearance of the animal, and the largest two-year-old males could be mistaken for three- or even four-year-old males, which were the target group for hunting. This fact is the most alarming, because it indicates that the harvesting, conceived as non-selective, turned out to be selective, and already at the age of two, the male part of the population lost its largest individuals.
Results of overexploitation did not become visible immediately (Figure 1); the number of bulls was growing at the beginning, but then it reduced dramatically and dropped by more than half in 1972 compared to the maximal numbers of this period; the catastrophically low numbers of bulls characterize the years 1973–1975. Moreover, in this period of the minimal number of bulls, they demonstrated the maximal number of newborn pups per bull (or reproductive efficiency), which could indicate that the intensive selective harvest had maximized the share of the “strongest” breeders in the population. Since 1972, the harvest of bulls was almost banned, and the total volume was noticeably reduced, but the proportion of two-year-old males killed was still high, i.e., the harvest remained selective. Note that the lower harvest pressure rather quickly recovered the number of bulls with their further growth, while the number of newborn pups continued to decline until 1988. Since the early 1990s, the observed number of bulls on the rookery of Tyuleniy Island is constantly higher than all those values of the previous period; therefore, the cause of slow growth of the number of births in the population is obviously the result of a decrease in the birth rate in this population and may be related to a change in the harem structure. This issue we have tried to analyze, as far as the available data allowed us.
Polygyny in the northern fur seal is considered to reach an extreme level [32]; a bull is able to fertilize up to 100 females per season [33]. However, early and late sources differ essentially by the data about the observed harem sizes. At the beginning of the last century, in the midst of the coastal and pelagic harvesting, up to 60–100 females could be found in the harem of one male on the rookery [14,34]. At the end of the last century and the beginning of the current one, the sex ratio on the coast reduced to 5–10 females per male [6,12,35]. Analysis of the field data available to us confirms the tendency observed in the Commander and Pribilof Island populations: the visual sex ratio on the rookery of Tyuleniy Island after 1980–1988 was kept at the level of 10–20, and after 1987 it did not exceed 10. Chow test showed that there was no change in the trend, i.e., although the size of the harems clearly decreased after 1987, the production remained at the same level. For the period with available data, the linear model relating to the observed harem size in the current year and its production (or number of newborn pups per male) in the next year has a highly significant (p < 0.0001) regression coefficient and the coefficient of determination is R2 = 87.5%. Using this correlation, we were able to substitute the known number of newborn pups to obtain theoretical values of the observed number of females (tFobs) for the early period and estimate the average harem size observed on the rookery (Figure 6). Our results show that the observed sizes of the harems in the early period were significantly greater than those in the later period, with their maximum values reaching almost 50, but still lower than at the beginning of the last century (60–100, according to [14,34]. Note that the early period is also heterogeneous in the estimated observed harem size: in a number of years, values are not different from those observed in 1980–1987, while in other years, there are significantly higher numbers of females per male than could be found in the set of field data. The observed sex ratio (Fobs/M) has declined after 1987 to the level that does not overlap with that of recovered values for the period prior to 1980.
Changes in the visual sex ratio were simultaneous with those of the reproductive efficiency of bulls, and such dynamics could be a result of either selective harvesting or a shortage of reproductive females in the population or even a combined effect of both factors. A consequence of selective harvest may be as follows: at first, when the bulls were still in a good form, the decreasing competition allowed them to increase efficiency. Then, when the sealing eliminated the best potential breeders, there were only the inferior bulls. Note, that a similar trend of birth was observed in the Commander populations [2], where there were more than 40 females that gave birth per bull in 1950s, then it dropped to 10 in 1960s; and since the early 1980s it dropped to 8, and then remained stable up until recently.
We will return to an alternative reason for the change in the visual sex ratio being a shortage of reproductive females in the population after discussing the complex effect of the trends observed in the population: an increase in male survival and a decrease in birth rate. In long-lived species, population growth is shown by recent advances in demography and population modeling to be usually most dependent on adult survival [36,37,38,39], and reproduction rates are of lesser importance. However, Model 2 results show an increase in male survival does not compensate for a decline in reproductive rate. Essential changes of males’ age structure and a vast decrease in population growth rate even against the background of a slight increase in survival rates of almost all age groups are occurring (Table 1). Aging of the male part of the population is revealed by modelling: the proportion of pups in the stationary age composition in the late period decreased significantly, while that of bulls increased nearly twice. Results of stochastic modelling confirm those of the deterministic model (Figure 8), showing a significant decrease in the population growth rate in the post-intensive harvesting periods (1978–1987 and after 1987), and the most positive result is that the population is still growing. If the reason for the observed decrease in harem production is selective harvesting, then a further increase in the population of the northern fur seal, if it happens, will not be fast. Apparently, for such growth and especially for its acceleration, an increase in the proportion of bulls with high reproductive success is needed. Probably, this restructure is ongoing in the Tyuleniy Island population in the absence of anthropogenic forcing, thus allowing for natural selection to occur. Nonetheless, the share of males with high reproductive efficiency is small (taking into account the current low average values), and thus positive processes of natural selection will take a lot of time. Extensive additional research is required to obtain any quantitative assessments for both the present degree of bulls’ differentiation by their reproductive efficiency, and the rate of its change.
Considering that only males were hunted from the Tyuleniy Island population, it seems reasonable to expect changes primarily in this part of the population. The present study showed that changes in the average reproductive efficiency of bulls significantly correspond to the harvest strategy (Figure 5). Another explanation for a decline in the population birth rate could be a shortage of reproductive females. Note, there was not any commercial harvest of females from this population (except for sea samples with a research purpose, which were relatively small in relation to the total number of females in the population). Environmental factors affect both females and males; therefore, an increase in the number of bulls has to be simultaneous with an increase in the number of reproductive females (which is consistent with the observed increase in their numbers on the rookery, Figure 4). However, the latter statement requires additional estimates and calculations, which we have tried to carry out.
One can analyze the dynamics of actual sex ratio and pregnant females’ proportion in the population for the period 1958–1988 on the base of data from marine samples obtained previously. In particular, Figure 9 shows that on average at first (approximately till 1970) there were about 30 females per bull, then with the sharply decreased number of bulls due to intensive harvesting the sex ratio changed to 70 females per bull (Table 2). However, this period was short because the estimated number of females was also declining and by the second half of the 1970s and 1980s a depression in the female part of the population occurred. The reason for this depression is not clear. Later, with lower pressure from the harvest and active recovery of the bulls’ number, the sex ratio reached the minimum of observations: 20 females per bull. At the same time, the proportion of pregnant females increased on average (Figure 9, top right), which may be related to the aging of females (Figure 10). Besides, shares of pregnant females do not show any significant decrease with growth of number of females per bull, i.e., even at the ratio 70:1 the share of pregnant females was not low, apparently, the limit for bulls at that time was even higher. One can also see (Figure 9) that the number of females observed on shore was, on average, twice as low as their actual number for the observation period.
Assuming the proportion of pregnant females remained at the average level of the previous period (1958–1988), calculations show (Figure 11) only about nine females per bull, which is more than three times lower than the ratio of the initial period and more than two times lower than that of the period of females’ number depression. In this case, their numbers still have not reached the average pre-depression level, and the number of bulls has already exceeded it by more than two times. Even assuming the proportion of pregnant females reduced to the lowest of the observed values λmin, the change in the sex ratio remains significant: about 15:1, and thus the number of females only slightly exceeds the average values of the initial period. This begs the question of how natural selection is acting on population processes such that population growth become so different in the male and female parts of the population?
Scant amount of observational data on survival and other physiological characteristics of females in natural populations of pinnipeds is a common problem [40], which we also encountered without adequate data to compare the survival of males and females in this population directly. Female mammals are usually assumed to live longer than males [41,42] because of their higher survival rate. This opinion resulted from studies performed across human populations, some case studies on wild mammals, or records of mammals from captivity [43]. However, those lifespan and aging patterns are often not representatives of conspecifics in nature [44]. Nevertheless, recent study [45] has compiled demographic data from 134 mammal populations, including 101 species, to demonstrate that, in nature, the median lifespan of females is on average 18.6% longer than that of males of the same species. At that, the extreme polygyny characterizing northern fur seals [40] is accompanied by a high degree of male–male competition. It often produces a decrease in longevity relative to species with lower degrees of polygyny or monogamy [41,46]. All this makes the hypothesis of a shortage of reproductive females in the population, when considered, unconvincing.
On the other hand, evolutionary changes have been recorded in many species subject to selective harvest (e.g., [47,48,49]). Such a type of harvesting is not unusual in both marine and terrestrial habitats. Empirical studies are increasingly documenting the negative effect of the preferential removal of larger individuals of a species on its demography, life history, and ecology [48]. Body size is one of the most important traits of an organism correlating with many aspects of its biology. Size-selective harvesting can change evolution of behaviors. One of the apparently most counterintuitive traits affected by size-selective selection is the quality of offspring. For example, size-selective harvesting of Atlantic silverside (Menidia menidia) decreased larval growth rate and other characteristics of the species lifecycle [50,51]. Similarly, several sex-selectively (and hence size-selectively) harvested ungulate populations demonstrate a lower offspring weight [47]. Large and dominant males of such species as grizzly bears (Ursus arctos) and African lions (Panthera leo) also suffer from selective harvest as trophies. This can be followed by a reduction in survival among juveniles triggered by the growing infanticidal behavior of less dominant males [52,53]. In addition, for long-lived species with high natural survival rates of adults, size-selective hunting may cause changes in a trait such as reproductive investment [48]. Reproductive value (RV) refers to the expected individual contribution to population growth that varies with age such that the highest RV values correspond to mature adults of middle ages and the lowest ones to juveniles [54]. Thus, size-selective hunting of individuals with the highest RV can cause a lower growth rate in the population by increasing the reproductive investment of young adults [55].
Of importance is also to consider the effect of harvest-induced selection on behavioral traits because this selection is able to create an evolution of behaviors unlike those favored by natural selection [49]. For instance, zebra fish Danio rerio demonstrated an alternative behavior due to size-selective fishing. Fish adapted to high positively size-selective fishing pressure reached a smaller body size at maturity and appeared less curious and bold. It has been shown that genetic changes in functional loci accompanied those of the phenotypic observed [56]. Thus, the observed life-history changes increased the rate of population growth under fishing conditions but slowed its recovery after fishing had ended [56].
In conclusion, note that all the effects of selective harvesting described above, apparently, have not escaped the population of the northern fur seal of Tyuleniy Island. After a few years of bull hunting, their numbers dropped sharply. Following recovery, due to the maturation of subadults just entering reproductive age and having a low reproductive value (RV), those who had already experienced (starting from two years of age) size-selective selection, could see a change in their gene pool. This may explain the decline in reproductive efficiency of bulls after their numbers began to recover. The reduction in total harvest volume due to a ban of harvesting adult males did not change its selectivity by size (which can be seen in the significant proportion of two-year-old males killed) and, probably, by behavior—the males most eager in the rookery were more likely to be hunted. The observed increase in average male survival together with a decrease in average harem size may be a consequence of a lower degree of male–male competition, which is characteristic of species with lesser degrees of polygyny. Therefore, a lower survival advantage of females relative to males could also be expected with a consequent change in the sex ratio toward a lower proportion of females. Considering the natural survival rate of females is higher than males, even in monogamous species [57] the decrease in female survival is hardly so large as to give so small an abundance of females in the population, which would be consistent with unchanged reproductive rates (Figure 11).
The observed changes were unlikely to be caused by a lack of food or the poor physiological state of the females. The state analysis of fish species stocks being the main food items for the fur seals in the Sea of Okhotsk and around Hokkaido Island does not allow us to conclude that the food resources in this area are limited. Inter-annual variability in body length and weight ([58], Table 105), as well as the fatness of animals ([58], Figure 288), confirm this conclusion. In addition, the condition index of subadult males in the late 1980s has become higher, despite pollock resources being significantly undermined by this time. Thus, one can note higher characteristics of the growth processes of fur seals on Tyuleniy Island during the depression period. Similarly, A. York and A. Trites [1] note larger body sizes of fur seal females collected near the Pribilofs through the 1960s when the population was declining. The study [1] found the most likely explanations for the lower birth rates in Pribilof populations of fur seals are related to a change in the age and sex ratios of breeders caused by the depletion of females and/or the harvest of young males. Another hypothesis claims [59] that increased predation by killer whales is responsible for the sequential decline of North Pacific populations of fur seals and other pinnipeds. However, detailed study [60] considering changes in food chains in this region found this hypothesis to be unlikely. Thus, the role of environmental factors in the survival rate and, consequently, in the population dynamics of the northern fur seal seems to be of little significance. Considering all these facts, the effect of selective harvesting seems to be the most realistic reason for the observed decrease in the birth rate in the population at hand.
Author Contributions
Conceptualization, E.F. and O.Z.; methodology, O.Z. and E.F.; software, O.Z.; validation, O.Z., E.F. and A.K.; formal analysis, O.Z.; investigation, O.Z.; data curation, A.K.; writing—original draft preparation, O.Z., E.F.; writing—review and editing, O.Z., E.F. and A.K. All authors have read and agreed to the published version of the manuscript.
Funding
This research received no external funding.
Institutional Review Board Statement
Not applicable.
Acknowledgments
This work was performed in the framework of the State targets of the Institute for Automation and Control Processes FEB RAS and the Institute of Complex Analysis of Regional Problem FEB RAS.
Conflicts of Interest
The authors declare no conflict of interest.
Appendix A. Review of Methods Used to Estimate Male Survival Rates
Two current methods for estimating the survival of juvenile and subadult northern fur seals are reviewed here (more details see in [25]).
Appendix A.1. Iteration Method
A new method for estimating both upper and lower bounds of the juvenile survival rates: w02L and w02U (Equations (A1) and (A2)) were developed in [23], which was based on Trites’ approach [61] without any assumptions about harvest. At that, the larger the number of harvested animals the narrower estimated intervals (w02L, w02U) for the value of w02. Given that the harvest level decreased significantly in the late period, the intervals became wide. To narrow them down, the iteration method uses estimates of subadults’ survival as additional information.
where M0 = P/2, P is the number of newborn pups; Ri denotes the number of harvested males of age i (i = 2,…,6) from the considered generation.
Note, Equations (A1) and (A2) describe a particular generation. Thus, calculating the survival rate of fur seal males during the first two years of life that were born, for instance, in 1958 (w02(1958)), we use M0(1958), R2(1960), R3(1961) etc., and M7(1965).
To determine the minimum possible juvenile survival rate (w02L) the survival rates of older ages are assumed to be 1: wU = w27U = 1; then w27 = 1 is substituted in Equation (A1), and the number of new bulls is calculated as M7L = M(n) − wU(M(n − 1) − R(n − 1)). Here n is the year when the considered generation became seven-year-olds; M(n) is the total number of bulls in the n-th year, and R(n − 1) denotes the number of harvested bulls in the previous year. Then, the estimated value of M7L was compared with the total harvest from the generation in subsequent years R7+ (i.e., R7+ = R7(n) + R8(n + 1) + …). If M7L < R7+, then we increase M7L to R7+, thus, avoiding obtaining fewer seven-year-old animals than were subsequently killed). Similar verification applies to the M7U.
When calculating the upper bound, the survival rate of subadults (w27) is replaced by their minimum possible values (w27L = (w02U)0.5, wL = (w02U)0.5), and the number of new bulls is calculated as M7U(n) = M(n) − (w02U)0.5 (M(n − 1) − R(n − 1)).
Considering that the pups’ survival rate from birth to two years is a product of average annual survival rates from birth to one year, and then to two years: w02 = w01·w12, and survival rate from birth to one year is a minimal one, we assume w12 = w27. Then, w02U = w01U·w27L = (w27L)2 and therefore w27L = (w02U)0.5. Similarly, we get the lower bound of the bulls’ survival: wL ≥ w01 ⇒ wL = w27L = (w02U)0.5.
The estimates of juvenile survival rates obtained from Equations (A1) and (A2) allow the estimation of both upper and lower bounds of the survival rates from two to seven years of age [23], which can then be used as a substitute for previous rough estimates (w27U = 1, w27L = (w02)1/2) in Equation (A1) to recalculate the bounds w02L and w02U. The maximum possible survival of bulls is considered the lower bound of the subadults’ survival: w27L = wU, and this restriction is substituted in Equation (A1) to refine the lower bound of the juvenile survival rate:
To refine the upper bound of the juvenile survival rate, the minimum possible survival of bulls is considered to be the upper bound of the survival rate from birth to one year: wL = w01U = w02U/w27L. Then, Equation (A2) takes the following form:
where , one can solve this equation for w02U:
The Formulas (A3) and (A5) give the first recalculation for upper and lower bounds of the juvenile survival rates: w02L(1) and w02U(1). Note that even the first step of such a procedure narrows the bounds (w02L, w02U) considerably. The next step uses the updated values of the juvenile survival rates w02(1) to recalculate the bounds of the subadults’ survival rates (w27L, w27U) and then using Formulas (A3) and (A5) obtain the next approximation of the values (w02L(2), w02U(2)), and so on. After a few such iterations, the estimates (w02L(i), w02U(i)) stabilize, with narrow intervals being obtained only for a few generations, as shown in Figure A1. The initial bounds of the juvenile survival rate (w02L, w02U) obtained by Formulas (A1) and (A2) stabilized bounds of both juvenile and the subadults’ survival rates and the number of iterations (i) required for their stabilization (with an accuracy of 0.0001).
Figure A1.
Dynamics of the estimates of juvenile survival rate: initial (w02L, w02U) and refined (w02L(i), w02U(i)) after i iterations (number of iterations on the right axis), as well as bounds of the subadults’ survival rate (w27L(i), w27U(i)).
Figure A1.
Dynamics of the estimates of juvenile survival rate: initial (w02L, w02U) and refined (w02L(i), w02U(i)) after i iterations (number of iterations on the right axis), as well as bounds of the subadults’ survival rate (w27L(i), w27U(i)).

Appendix A.2. Fitting Method
For a particular generation the number of seven-year-old males (M7) one can express in terms of survived two-year-old males (M2), the yearly survival rate w27 and the number of harvested animals:
M7 = (((((M2 – R2)w27 – R3)w27 – R4)w27 – R5)w27 – R6)w27.
Considering that the males of this generation join the group of bulls when they are 7 years old (M7), i.e., in the n-th year (the year of birth of the considering generation is n – 7), their number can be also expressed in terms of the number of bulls (M(n)), and their yearly survival rate w and the number of bulls in the previous year escaped harvest (M(n–1) – R(n–1)) is:
Thus, the new bulls (10) is a function of one variable—the survival rate of bulls (w), and varying it from 0 to wmax = min{(M(n) − R7+)/(M(n − 1) − R(n − 1)), 1}, only correct values of M7 can be obtained.
From the other Expression (A6), one can obtain, the juvenile survival rate substituting M2 = M0·w02:
and the survival rate from birth to one year as w01 = w02/w27:
The calculated value of w01 depends on w27 and M7, and it is a function of two variables. When calculating, one has to hold the condition 0 < w01 < w < w27 < 1.
Thus, the feasible bounds of the survival rates can be determined, varying w from 0 to wmax = min{(M(n) − R7+)/(M(n − 1) − R(n − 1)), 1}, w27 from w to 1 and comparing the obtained w01 (Equation A9) with w (0 <w01 ≤ w). As w and w27 increase, w01 decreases, i.e., the maximum w27 gives the minimum w01, and the minimum w27 provides the maximum w01.
Figure A2 shows the results of calculations by this method on data of the northern fur seal population of Tyuleniy Island.
Figure A2.
(a)—Dynamics of the estimates of upper and lower bounds of the survival rate of males from birth to one year (w01L, w01U), subadults (w27L, w27U), and bulls (wL, wU). (b)—Average values of the survival rates.
Figure A2.
(a)—Dynamics of the estimates of upper and lower bounds of the survival rate of males from birth to one year (w01L, w01U), subadults (w27L, w27U), and bulls (wL, wU). (b)—Average values of the survival rates.

Regression analysis [25] has shown that both sets of estimates (obtained by both the iteration and fitting method) are consistent with the observation data.
References
- Trites, A.W.; York, A.E. Unexpected changes in reproductive rates and mean age at first birth during the decline of the Pribilof northern fur seal (Callorhinus ursinus). Can. J. Fish. Aquat. Sci. 1993, 50, 858–864. [Google Scholar] [CrossRef]
- Kornev, S.I.; Blokhin, I.A.; Generalov, A.A.; Semerinov, A.P. Historical trend of the population of Northern fur seals in the Commander islands for the 50-year-period (1958–2007). Issledovaniya vodnyh biologicheskih resursov Kamchatki i Severo-Zapadnoj chasti Tihogo okeana 2008, 11, 105–120. (In Russian) [Google Scholar]
- Roppel, A.Y.; Davey, S.P. Evolution of fur seal management on the Pribilof Islands. J. Wildl. Manag. 1965, 29, 448–463. [Google Scholar] [CrossRef]
- Roppel, A.Y. Management of Northern Fur Seals on the Pribilof Islands, Alaska, 1786–1981. In NOAA Technical; Report NMFS-4; US Department of Commerce: Washington, DC, USA, 1984. [Google Scholar]
- Atkinson, C.E. Fisheries management: An historical overview. Mar. Fish. Rev. 1988, 50, 111–123. [Google Scholar]
- Gentry, R.L. Behavior and Ecology of the Northern Fur Seal; Princeton University Press: Princeton, NJ, USA, 1998. [Google Scholar]
- Kuzin, A.E. Analisys of northern fur seal (Callorhinus ursinus) harvest on Tyuleniy Island. Izv. TINRO 2015, 183, 71–80. (In Russian) [Google Scholar] [CrossRef]
- Smith, T.D.; Polacheck, T. The population dynamics of the Alaska fur seal: What do we really know? NWAFC Proc. Rep. 1984, 84, 121–122. [Google Scholar]
- Trites, A.W.; Larkin, P.A. The decline and fall of the Pribilof fur seal (Callorhinus-Ursinus)—A simulation study. Canadian J. Fish. Aquat. Sci. 1989, 46, 1437–1445. [Google Scholar] [CrossRef]
- Angliss, R.P.; Lodge, K.L. Northern Fur Seal (Callorhinus ursinus): Eastern Pacific Stock. In NOAA Technical Memorandum; Report NOAA-TM-AFSC-144; Department of Commerce: Washington, DC, USA, 2003. [Google Scholar]
- Testa, J.W.; Adams, G.P.; Bergfelt, D.R.; Johnson, D.S.; Ream, R.R.; Gelatt, T.S. Replicating necropsy data without lethal collections: Using ultrasonography to understand the decline in northern fur seals. J. Appl. Ecol. 2010, 47, 1199–1206. [Google Scholar] [CrossRef]
- Boltnev, A.I. Nothern Fur Seal of Comandor Islands; Izdatel’stvo VNIRO: Moskow, Russia, 2011. (In Russian) [Google Scholar]
- Lee, O.A.; Burkanov, V.; Neill, W.H. Population trends of northern fur seals (Callorhinus ursinus) from a metapopulation perspective. J. Exp. Mar. Biol. Ecol. 2014, 451, 25–34. [Google Scholar] [CrossRef]
- Osgood, W.H.; Preble, E.A.; Parker, G.H. The Fur Seals and Other Life of the Pribilof Islands, Alaska, in 1914; US Government Printing Office: Washington, DC, USA, 1915; p. 820.
- Dorofeev, S.V. Northern fur seals (Callorhinus ursinus L.). Trudy VNIRO 1964, 51, 23–50. (In Russian) [Google Scholar]
- Interim Convention on Conservation of North Pacific Fur Seals. Washington. 1957. Available online: http://sedac.ciesin.columbia.edu/entri/texts/acrc/1957FS.txt.html (accessed on 19 March 2011).
- Kuzin, A.E. The intrapopulation structure of the northern fur seal (Callorhinus Ursinus) on Tyuleniy Island during the post-depression years (1993–2009). Rus. J. Mar. Biol. 2010, 36, 507–517. [Google Scholar] [CrossRef]
- Kuzin, A.E. Northern Fur Seal; Sovet po morskim mlekopitayuschim: Moskow, Russia, 1999. (In Russian) [Google Scholar]
- York, A.E. Northern Fur Seal, Callorhinus ursinus, Eastern Pacific Population (Pribilof Islands, Alaska, and San Miguel Island, California). In Status, Biology, and Ecology of Fur Seals; NOAA Techical Report NFMS 51; Croxall, J.P., Gentry, R.L., Eds.; British Antarctic Survey: Cambridge, UK, 1987; pp. 133–140. [Google Scholar]
- Neal, D. Introduction to Population Biology; Cambridge University Press: Cambridge, UK, 2004. [Google Scholar]
- Frisman, E.Y.; Skaletskaya, E.I.; Kuzin, A.E. A mathematical model of the population dynamics of a local northern fur seal with seal herd. Ecol. Model. 1982, 16, 151–172. [Google Scholar] [CrossRef]
- Frisman, E.Y.; Skaletskaya, E.I.; Kuzin, A.E. Mathematical Modelling the Number Dynamics of the Northern Fur Seal and Optimal Control of Fur Seal Farm; FESC AS USSR: Vladivostok, Russia, 1985. (In Russian) [Google Scholar]
- Zhdanova, O.L.; Kuzin, A.E.; Skaletskaya, E.I.; Frisman, E.Y. Why the population of the northern fur seals (Callorhinus ursinus) of Tyuleniy Island does not recover following the harvest ban: Analysis of 56 years of observation data. Ecol. Model. 2017, 363, 57–67. [Google Scholar] [CrossRef]
- Zhdanova, O.L.; Kuzin, A.E.; Frisman, E.Y. Mathematical modeling of the variation in the survival of female northern fur seals, Callorhinus ursinus (Linnaeus, 1758), on Tyuleniy Island. Russ. J. Mar. Biol. 2017, 43, 348–358. [Google Scholar] [CrossRef]
- Zhdanova, O.L.; Kuzin, A.E.; Frisman, E.Y. Estimating the juvenile survival rate of male northern fur seals (Callorhinus ursinus): Mathematical modeling and data analysis. Matemat. Biol. Bioinform. 2018, 13, 360–375. [Google Scholar] [CrossRef]
- Caswell, H. Matrix Population Models: Construction, Analysis, and Interpretation; Sinauer: Sunderland, UK, 2001. [Google Scholar]
- Antonelis, G.A.; Ragen, T.J.; Rooks, N.J. Male-Biased Secondary Sex Ratios of Northern Fur Seals on the Pribilof Islands, Alaska, 1989 and 1992. In Fur Seal Investigations; Sinclair, E.H., Ed.; NOAA Tech. Mem: Silver Spring, MD, USA, 1994; pp. 84–89. [Google Scholar]
- Fowler, C.W. A Review of Density Dependence in Populations of Large Mammals. In Current Mammalogy; Genoways, H.H., Ed.; Springer: Boston, MA, USA, 1987. [Google Scholar] [CrossRef]
- Logofet, D.O.; Belova, I.N. Nonnegative matrices as a tool for modeling population dynamics: Classical models and modern generalizations. Fundament. Prikl. Matemat. 2007, 13, 145–164. [Google Scholar]
- Haridas, C.V.; Prendeville, H.R.; Pilson, D.; Tenhumberg, B. Response of population size to changing vital rates in random environments. Theor. Ecol. 2013, 6, 27–29. [Google Scholar] [CrossRef]
- Granger, C.W. Investigating causal relations by econometric models and cross-spectral methods. Econom. J. Econom. Soc. 1969, 37, 424–438. [Google Scholar] [CrossRef]
- Stearns, S.C. The evolution of life history traits: A critique of the theory and a review of the data. Ann. Rev. Ecol. Syst. 1977, 8, 145–171. [Google Scholar] [CrossRef]
- Bartholomew, G.A.; Hoell, P.G. Reproductive behavior of the Alaska fur seal, Callorhinus ursinus. J. Mammal. 1953, 36, 417–436. [Google Scholar] [CrossRef]
- Suvorov, E.K. Commander Islands and the Fur Trade on Them; Tipographia, V.F., Ed.; Kirshbauma: St. Peterburg, Russia, 1912. (In Russian) [Google Scholar]
- Vladimirov, V.A. Population status of a herd of northern fur seals (Callorhinus ursinus curilensis) on Tyuleniy Island. Zool. J. 1978, 57, 1239–1249. (In Russian) [Google Scholar]
- Heppell, S.; Caswell, H.; Crowder, L.R. Life histories and elasticity patterns: Perturbation analysis of species with minimal demographic data. Ecology 2000, 81, 654–665. [Google Scholar] [CrossRef]
- Saether, B.; Bakke, Ø. Avian life history variation and contribution of demographic traits to the population growth rate. Ecology 2000, 81, 642–653. [Google Scholar] [CrossRef]
- Maestri, M.L.; Ferrati, R.; Berkunsky, I. Evaluating management strategies in the conservation of the critically endangered Blue-throated Macaw (Ara glaucogularis). Ecol. Model. 2017, 361, 74–79. [Google Scholar] [CrossRef]
- Romanov, M.S.; Masterov, V.B. Low breeding performance of the Steller’s sea eagle (Haliaeetus pelagicus) causes the populations to decline. Ecol. Model. 2020, 420, 108877. [Google Scholar] [CrossRef]
- Brusa, J.L.; Rotella, J.J.; Banner, K.M.; Hutchins, P.R. Challenges and opportunities for comparative studies of survival rates: An example with male pinnipeds. Ecol. Evol. 2021, 11, 7980–7999. [Google Scholar] [CrossRef]
- Clutton-Brock, T.H.; Isvaran, K. Sex differences in ageing in natural populations of vertebrates. Proc. Biol. Sci. 2007, 274, 3097–3104. [Google Scholar] [CrossRef]
- Promislow, D.E. Costs of sexual selection in natural populations of mammals. Proc. R. Soc. Lond. B Biol. Sci. 1992, 247, 203–210. [Google Scholar] [CrossRef]
- Carey, J.R.; Judge, D.S. Longevity Records: Life Spans of Mammals, Birds, Reptiles, Amphibians and Fish; Odense University Press: Odense, Denmark, 2000. [Google Scholar]
- Tidière, M.; Gaillard, J.M.; Berger, V.; Müller, D.W.H.; Lackey, L.B.; Gimenez, O.; Clauss, M.; Lemaître, J.-F. Comparative analyses of longevity and senescence reveal variable survival benefits of living in zoos across mammals. Sci. Rep. 2016, 6, 36361. [Google Scholar] [CrossRef]
- Lemaître, J.F.; Ronget, V.; Tidière, M.; Allainé, D.; Berger, V.; Cohas, A.; Gaillard, J.M. Sex differences in adult lifespan and aging rates of mortality across wild mammals. Proc. Nat. Acad. Sci. USA 2020, 117, 8546–8553. [Google Scholar] [CrossRef]
- Tidière, M.; Gaillard, J.-M.; Müller, D.W.H.; Lackey, L.B.; Gimenez, O.; Clauss, M.; Lemaître, J.-F. Does sexual selection shape sex differences in longevity and senescence patterns across vertebrates? A review and new insights from captive ruminants. Evolution 2015, 69, 3123–3140. [Google Scholar] [CrossRef]
- Milner, J.; Nilsen, E.; Andreassen, H. Demographic side effects of selective hunting in ungulates and carnivores. Conserv. Biol. 2007, 21, 36–47. [Google Scholar] [CrossRef]
- Fenberg, P.B.; Roy, K. Ecological and evolutionary consequences of size-selective harvesting: How much do we know? Mol. Ecol. 2008, 17, 209–220. [Google Scholar] [CrossRef]
- Leclerc, M.; Zedrosser, A.; Pelletier, F. Harvesting as a potential selective pressure on behavioural traits. J. Appl. Ecol. 2017, 54, 1941–1945. [Google Scholar] [CrossRef]
- Walsh, M.R.; Munch, S.B.; Chiba, S.; Conover, D.O. Maladaptive changes in multiple traits caused by fishing: Impediments to population recovery. Ecol. Lett. 2006, 9, 142–148. [Google Scholar] [CrossRef]
- Duffy, T.A.; Picha, M.E.; Borski, R.J.; Conover, D.O. Circulating levels of plasma IGF-I during recovery from size-selective harvesting in Menidia menidia. Comp. Biochem. Physiol. Part A 2013, 166, 222–227. [Google Scholar] [CrossRef]
- Whitman, K.; Starfield, A.M.; Quadling, H.S.; Packer, C. Sustainable trophy hunting of African lions. Nature 2004, 428, 175–178. [Google Scholar] [CrossRef]
- Loveridge, A.J.; Searle, A.W.; Murindagomo, F.; Macdonald, D.W. The impact of sport-hunting on the population dynamics of an African lion population in a protected area. Biol. Conserv. 2007, 134, 548–558. [Google Scholar] [CrossRef]
- Kokko, H.; Lindstrom, J.; Ranta, E. Life histories and sustainable harvesting. In Conservation of Exploited Species; Reynolds, J.D., Mace, G.M., Redford, K.H., Robinson, J.G., Eds.; Cambridge University Press: Cambridge, UK, 2001; pp. 301–322. [Google Scholar]
- Festa-Bianchet, M. Exploitative wildlife management as a selective pressure for life-history evolution of large mammals. In Animal Behavior and Wildlife Conservation; Festa-Bianchet, M., Apollonio, M., Eds.; Island Press: Washington, DC, USA, 2003; pp. 191–210. [Google Scholar]
- Uusi-Heikkilä, S.; Whiteley, A.R.; Kuparinen, A.; Matsumura, S.; Venturelli, P.A.; Wolter, C.; Slate, J.; Primmer, C.R.; Meinelt, T.; Killen, S.S.; et al. The evolutionary legacy of size-selective harvesting extends from genes to populations. Evol. Appl. 2015, 8, 597–620. [Google Scholar] [CrossRef]
- Romanov, M.; Masterov, V.; Kurilovich, L. Analysis of the steller’s sea eagle survival curves. Do males age faster than females? Rus. J. Ecosys. Ecol. 2019, 4, 27–39. [Google Scholar] [CrossRef]
- Kuzin, A.E. Northern Fur Seal; TINRO: Vladivostok, Russia, 2014. (In Russian) [Google Scholar]
- Springer, A.M.; Estes, J.A.; van Vliet, G.B.; Williams, T.M.; Doak, D.F.; Danner, E.M.; Forney, K.A.; Pfister, B. Sequential megafaunal collapse in the North Pacific Ocean: An ongoing legacy of industrial whaling? Proc. Natl. Acad. Sci. USA 2003, 100, 12223–12228. [Google Scholar] [CrossRef] [PubMed]
- Wade, P.R.; Burkanov, V.N.; Dahlheim, M.E.; Friday, N.A.; Fritz, L.W.; Loughlin, T.R.; Mizroch, S.A.; Muto, M.M.; Rice, D.W.; Barrett-Lennard, L.G.; et al. Killer whales and marine mammal trends in the North Pacific—A re-examination of evidence for sequential megafauna collapse and the prey-switching hypothesis. Mar. Mamm. Sci. 2007, 23, 766–802. [Google Scholar] [CrossRef]
- Trites, A.W. Estimating the juvenile survival rate of male northern fur seals (Callorhinus ursinus). Can. J. Fish. Aquat. Sci. 1989, 46, 1428–1436. [Google Scholar] [CrossRef]
Figure 1.
Field count of bulls before the harvest and number of males (including bulls and subadults from 2 to 6 years old) taken in the commercial harvest (on the left axis), and pups born (on the right axis) on Tyuleniy Island.
Figure 1.
Field count of bulls before the harvest and number of males (including bulls and subadults from 2 to 6 years old) taken in the commercial harvest (on the left axis), and pups born (on the right axis) on Tyuleniy Island.

Figure 2.
Lifecycle graph of the male part of the northern fur seal population.

Figure 3.
Structure of harvest. (a) The numbers of males harvested on land accordingly to their ages (R2–R6), bulls are included in the group of seven-year-olds and older (R7+). (b) The share of bulls (by their ages) in the total number of killed bulls, as well as that of killed bulls from their total number (the line with markers, R7 + (n)/M(n)). (c) The share of subadults killed of each age in the total number of subadults killed.

Figure 4.
(a) Average observed number of females per male (or average observed harem size, on the left axis) and observed number of females (on the right axis) at the rookery. (b) Box plots of average observed harem size corresponding with two periods: 1980–1987 and 1988–2013.
Figure 4.
(a) Average observed number of females per male (or average observed harem size, on the left axis) and observed number of females (on the right axis) at the rookery. (b) Box plots of average observed harem size corresponding with two periods: 1980–1987 and 1988–2013.

Figure 5.
(a) Average number of pups per bull (P(n)/M(n − 1), or average reproductive efficiency, on the left axis, and the number of bulls at the rookery (M(n − 1)), on the right axis. (b) Box plots of average reproductive efficiency corresponding to the periods: 1959–1973, 1974–1978, 1979–1988, and 1989–2013.

Figure 6.
Average number of pups per bull (P(n + 1)/M(n) dependence on average observed harem size (Fobs(n)/M(n)) (theoretical values of tFobs(n) are used for the period 1958–1979).
Figure 6.
Average number of pups per bull (P(n + 1)/M(n) dependence on average observed harem size (Fobs(n)/M(n)) (theoretical values of tFobs(n) are used for the period 1958–1979).

Figure 7.
Stable age structure of the male part of the northern fur seal population (left axis) and annual growth rate of the population (on the right axis), corresponding to the periods: 1958–1971, 1972–1977, 1978–1987, and after 1987; here, (a) corresponds to the parameter estimates obtained by the iteration and (b) refers to the fitting method.

Figure 8.
Expected rate of population growth λe distributions in random samples (1000 iterations) for each period; here, (a) corresponds to parameter estimates obtained by the iteration and (b) refers to the fitting method.
Figure 8.
Expected rate of population growth λe distributions in random samples (1000 iterations) for each period; here, (a) corresponds to parameter estimates obtained by the iteration and (b) refers to the fitting method.

Figure 9.
(bottom) Dynamics of actual sex ratio ρ = F(n)/M(n) for the period 1958–1988, visual sex ratio ρobs = Fobs(n)/M(n) for 1980–2013, supplemented by calculated ones tFobs(n)/M(n) for 1958–1979 based on Equation (5) (on the right axis); and ρ/ρobs (on the left axis). (top) Dynamics of pregnant females’ proportion in the next year λ(n + 1) (on the left), and a box plot of λ(n + 1) for the periods corresponding to different reproductive efficiency of bulls (on the right).

Figure 10.
Box plot of pregnant females’ proportion of each age from marine samples.

Figure 11.
(a) Dynamics of the upper F(λmin), median F(λme) and lower F(λmax) estimates of the total number of mature females in the population for each observation year, Equation (3); dynamics of females’ number estimates from marine samples F(n) for 1958–1988 (on the left axis), and the number of bulls at the rookery M(n) (on the right axis). (b) Dynamics of sex ratio F(n)/M(n) according to observations for the period 1958–1988 and sex ratios corresponding to the upper, median, and lower estimates of the females’ number for the entire period. (c) The difference dynamics between calculated sex ratios and that observed at the rookery.


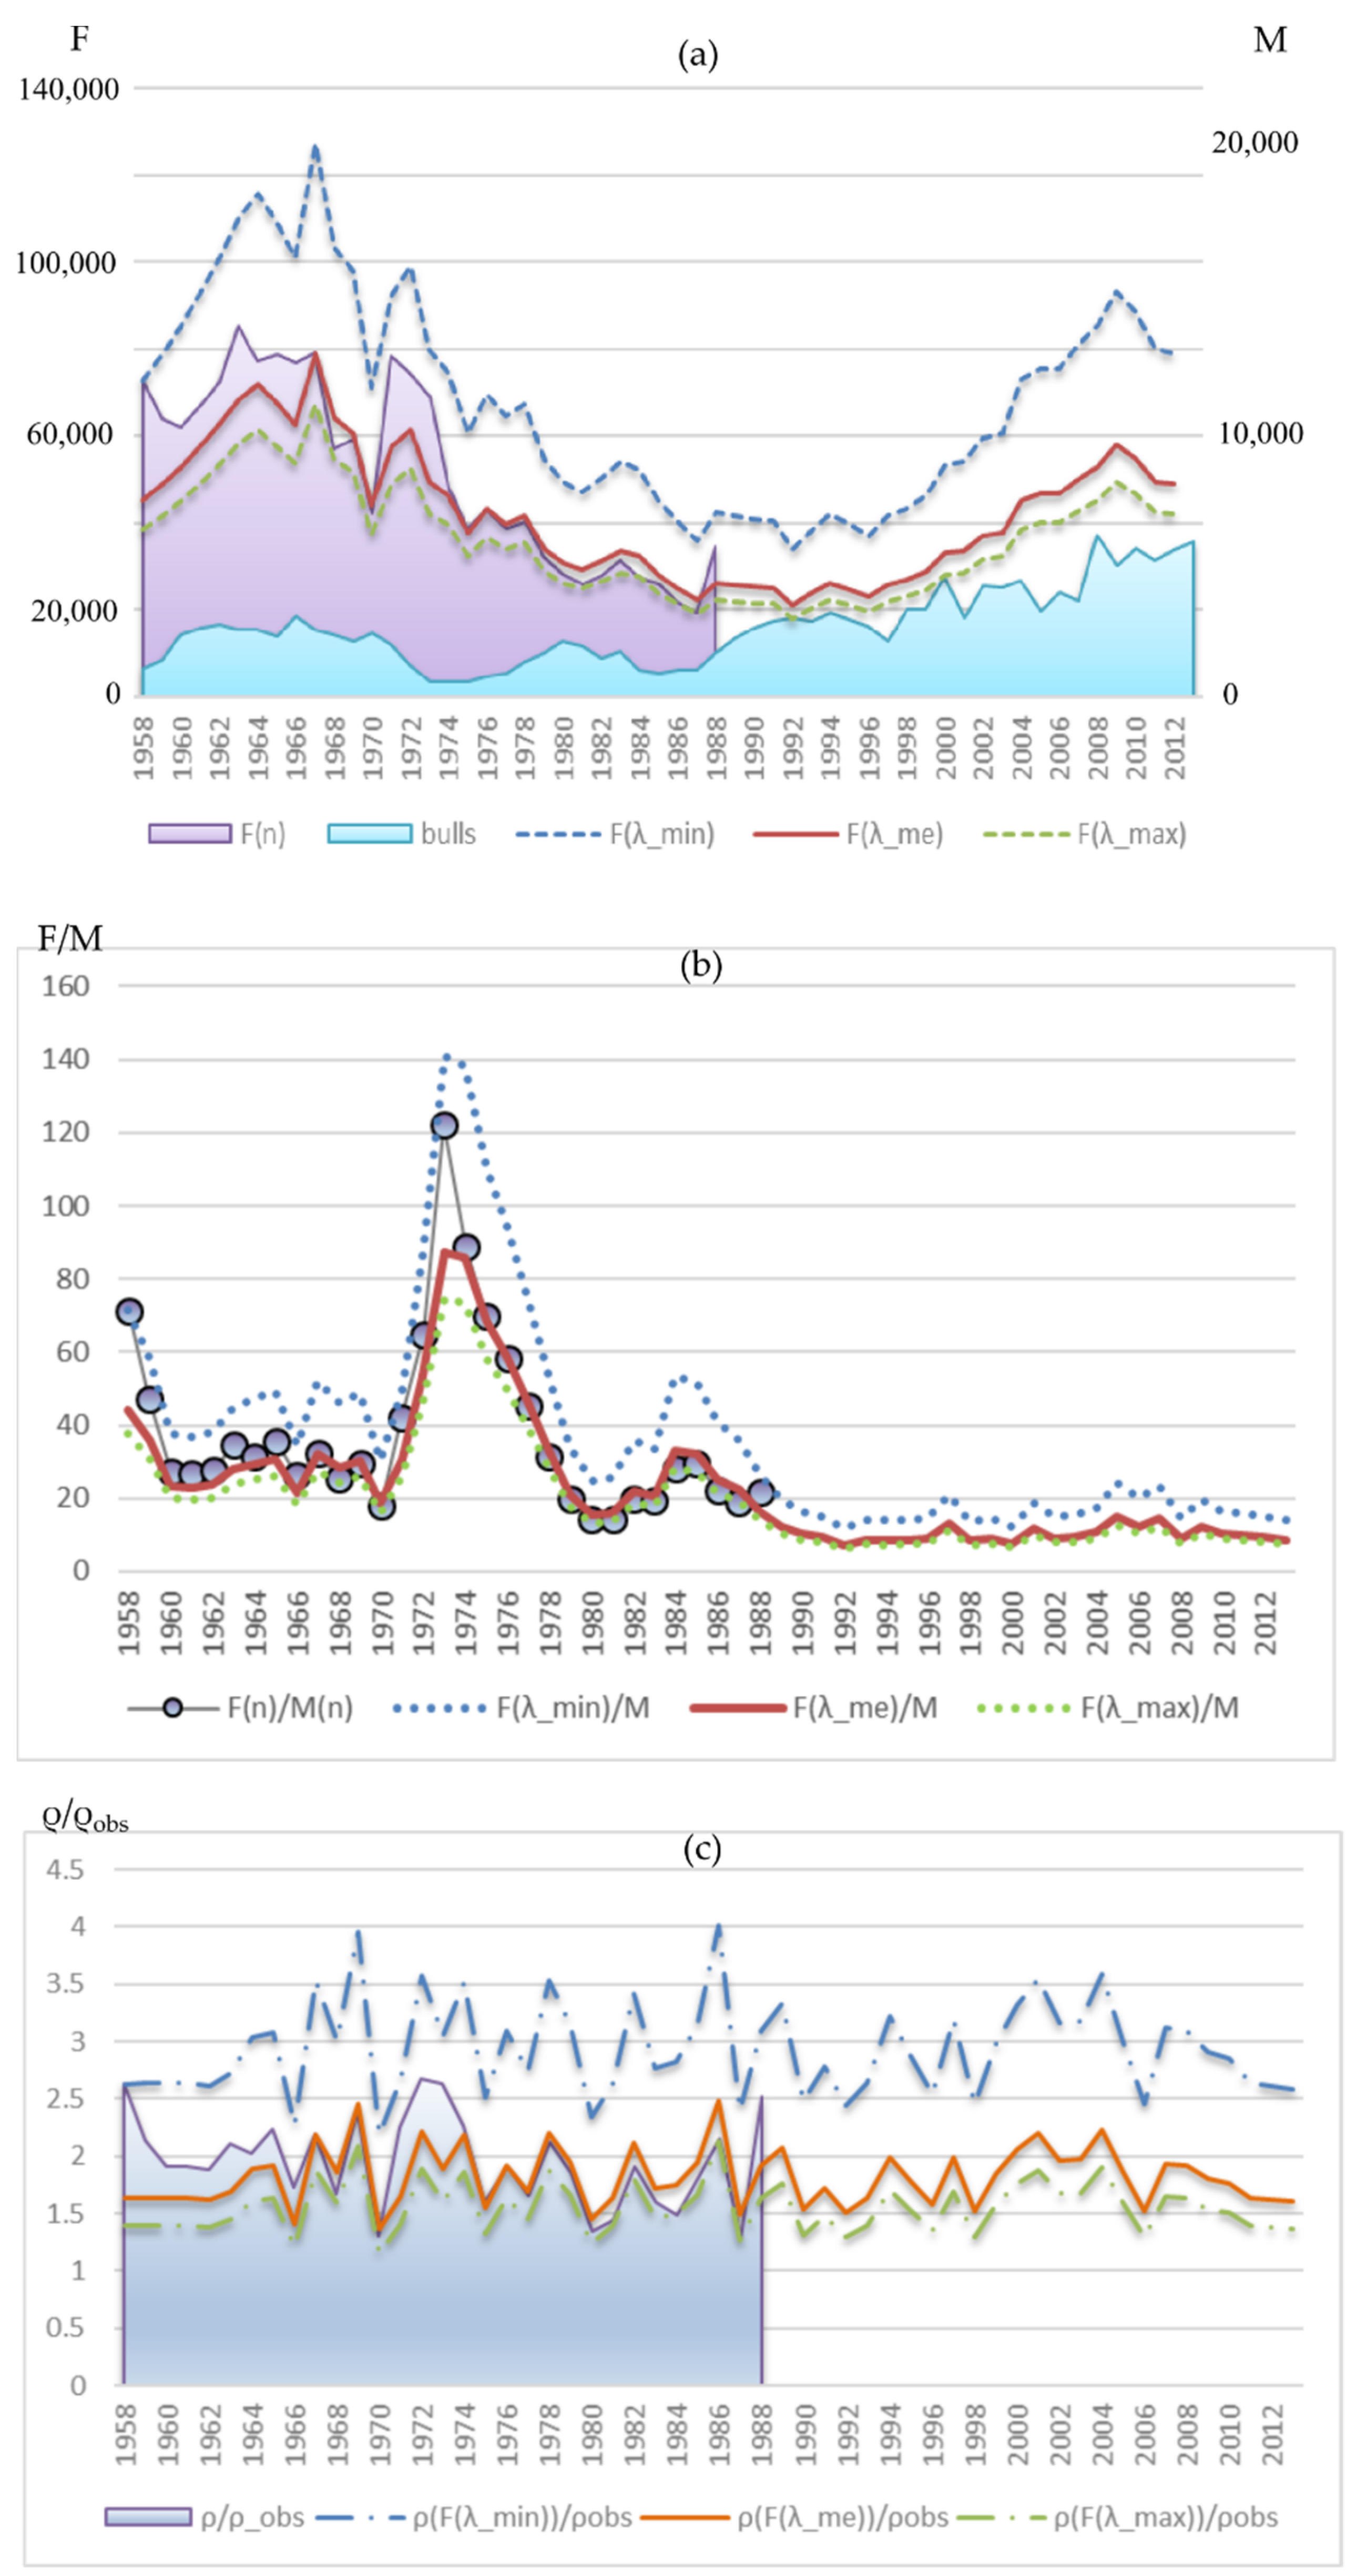
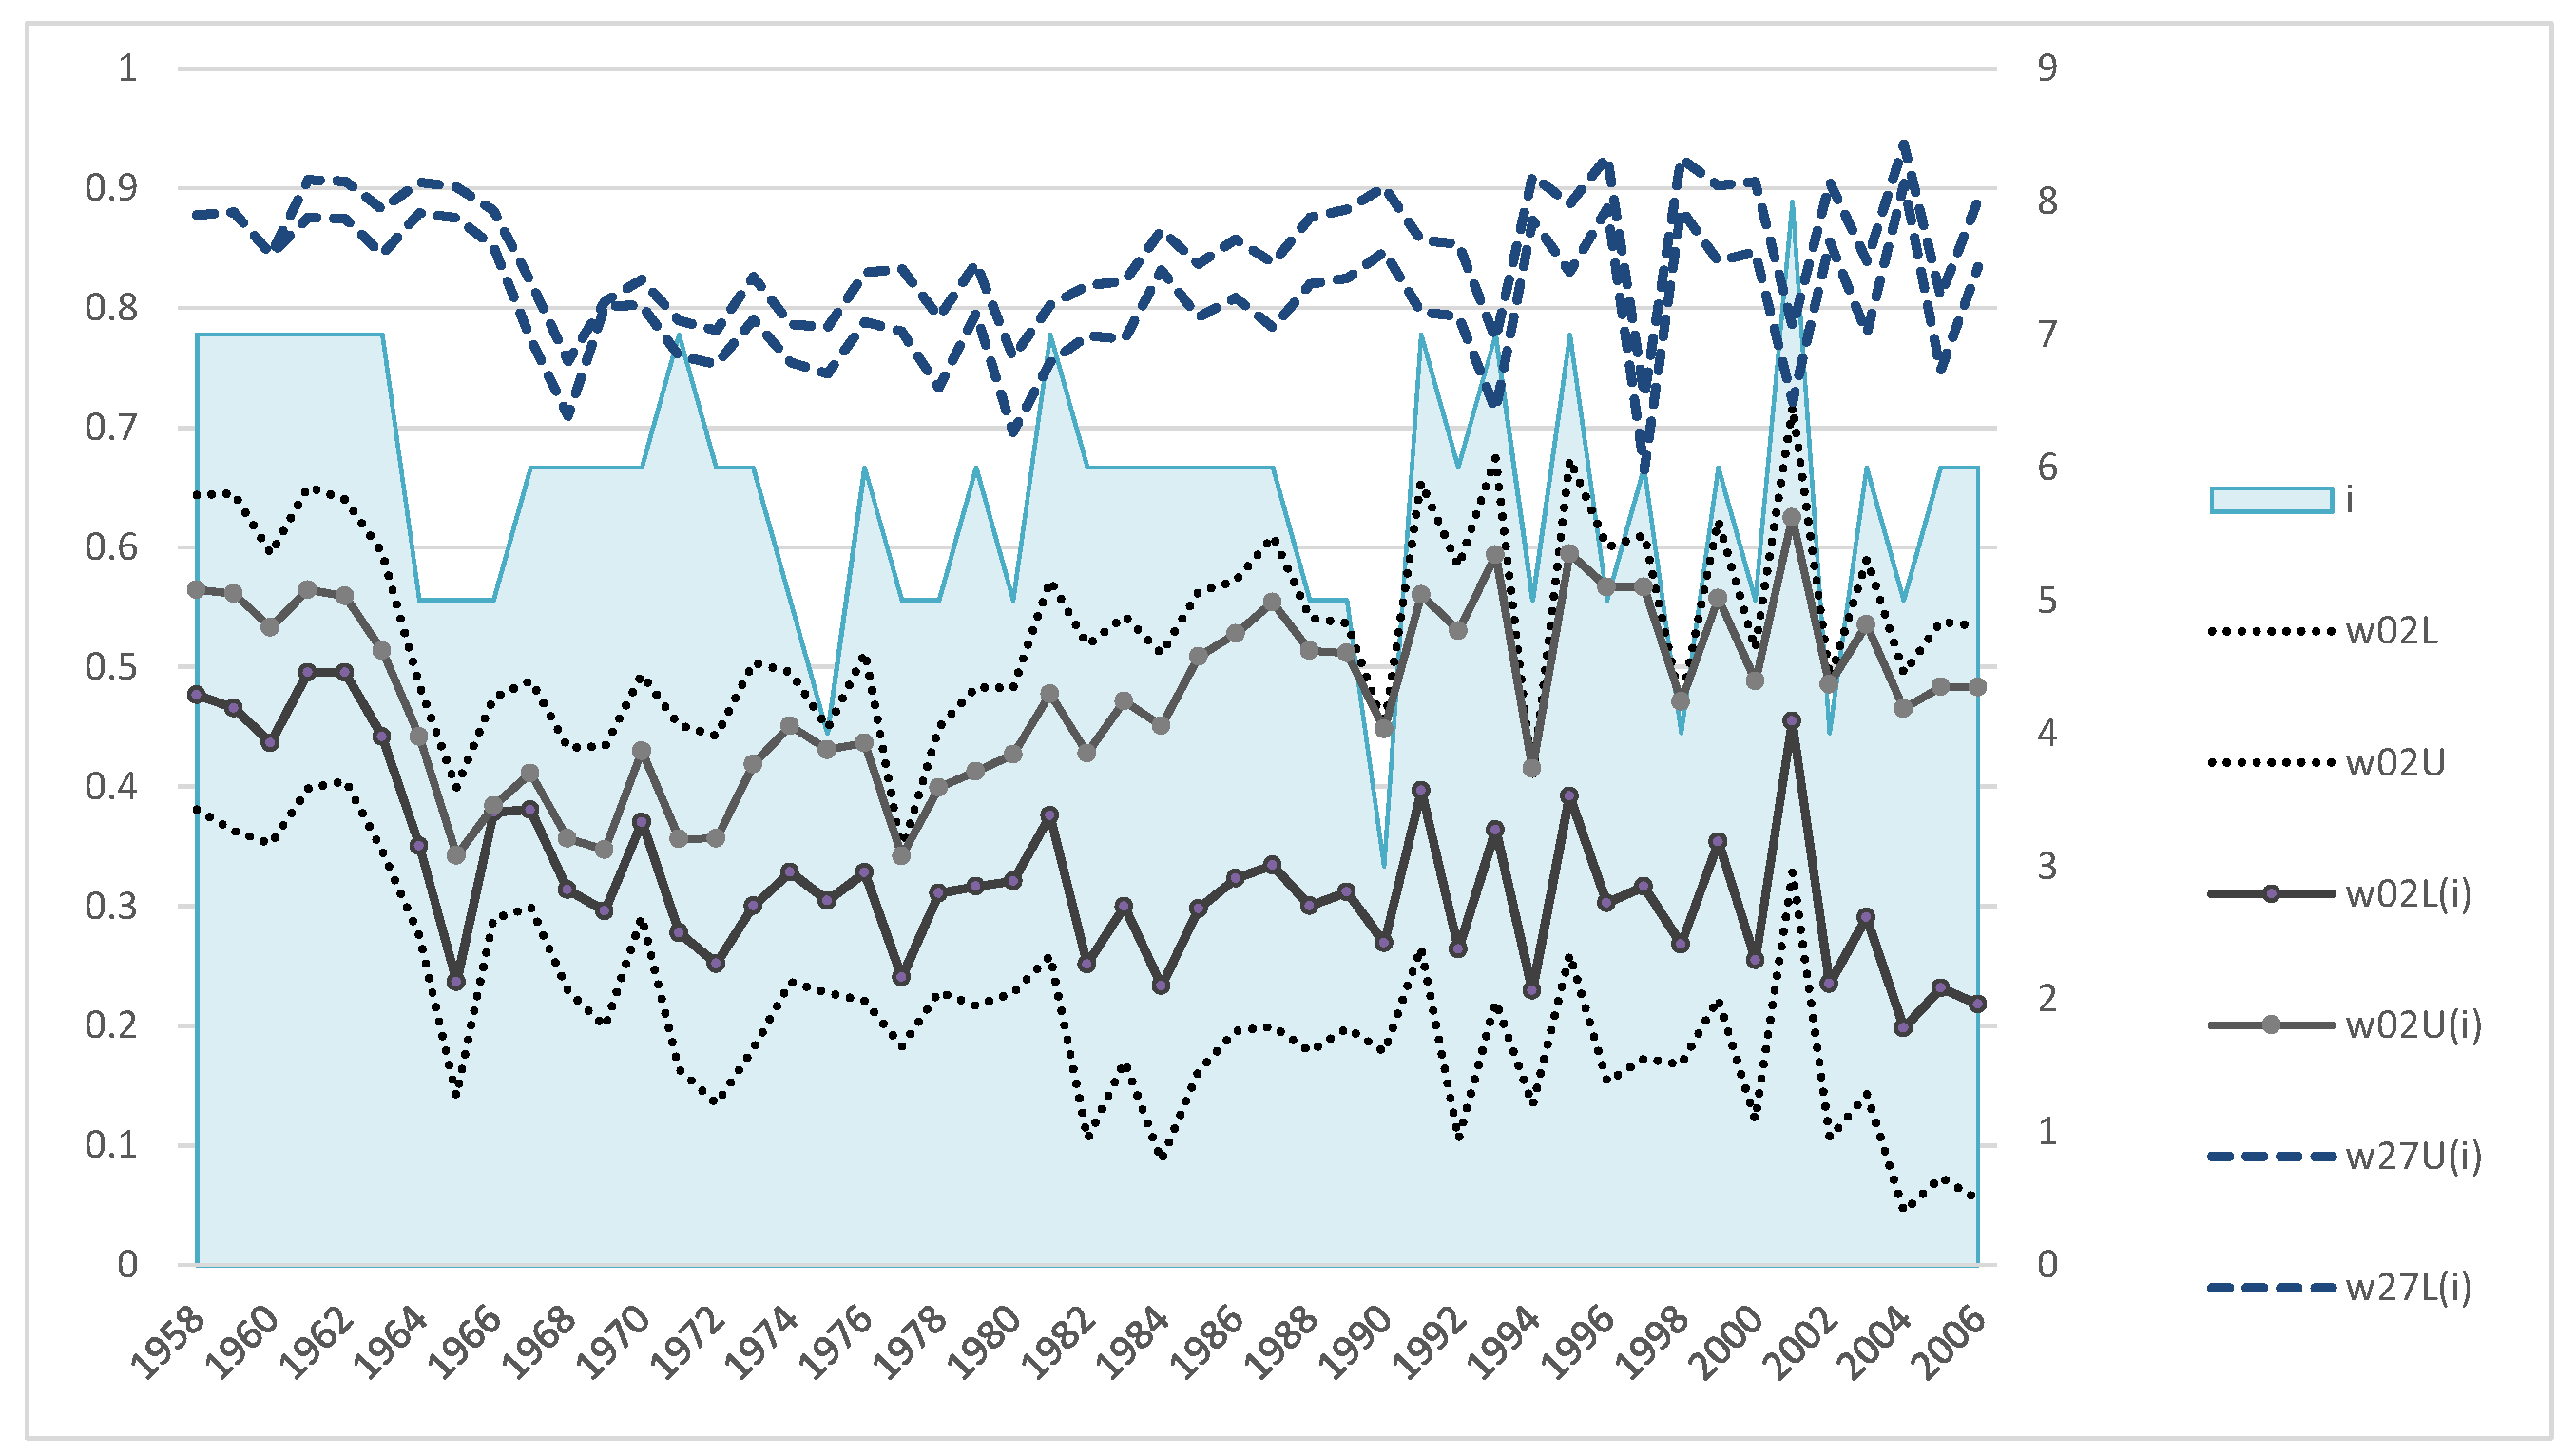
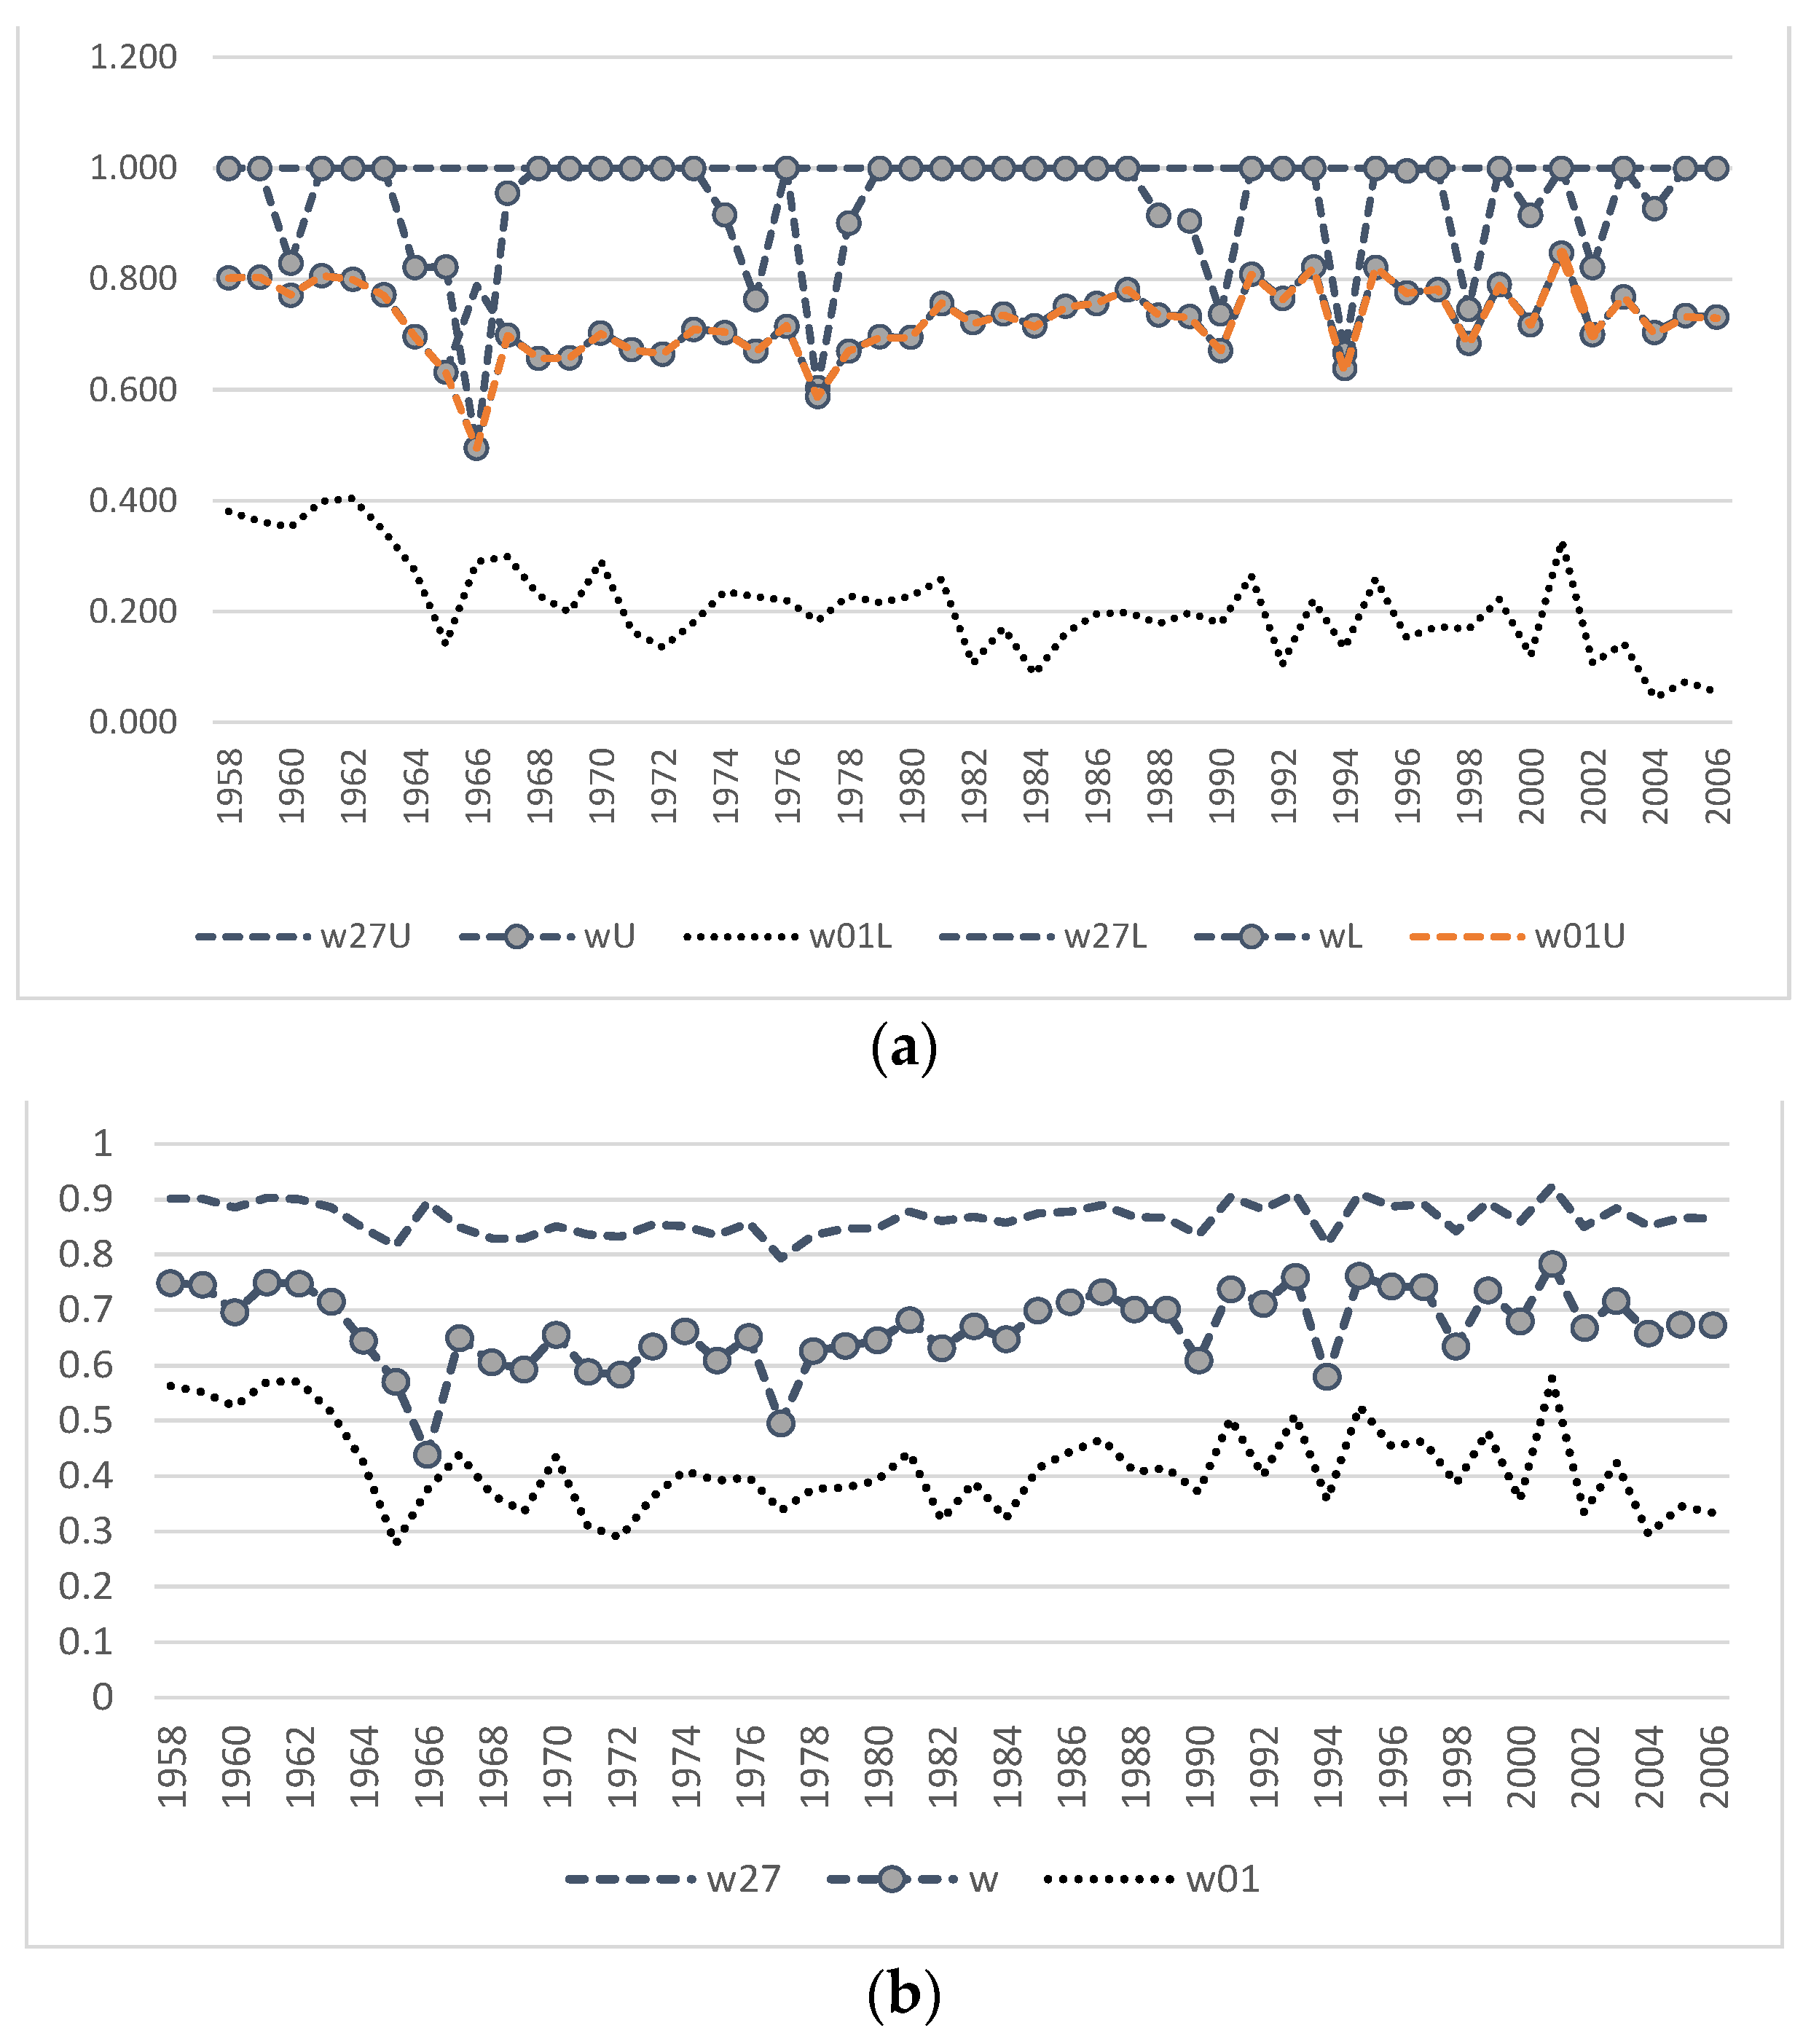
Table 1.
Model coefficient values (adapted from [25]), annual growth rate of the population (λ) and its stable age structure (x*).
Table 1.
Model coefficient values (adapted from [25]), annual growth rate of the population (λ) and its stable age structure (x*).
| Fitting Method | ||||||||
| Years | w27 | w01 | w | b | λ | |||
| 1958–1971 | 0.87 | 0.45 | 0.72 | 10.43 | 1.22 | |||
| 1972–1977 | 0.84 | 0.36 | 0.59 | 22.40 | 1.24 | |||
| 1978–1987 | 0.85 | 0.40 | 0.61 | 8.12 | 1.13 | |||
| after 1987 | 0.88 | 0.42 | 0.69 | 3.85 | 1.09 | |||
| Perron Vector (x*) | ||||||||
| 1958–1971 | 0.45 | 0.17 | 0.12 | 0.08 | 0.06 | 0.04 | 0.03 | 0.05 |
| 1972–1977 | 0.53 | 0.16 | 0.11 | 0.07 | 0.05 | 0.03 | 0.02 | 0.03 |
| 1978–1987 | 0.43 | 0.15 | 0.12 | 0.09 | 0.07 | 0.05 | 0.04 | 0.06 |
| after 1987 | 0.37 | 0.14 | 0.11 | 0.09 | 0.07 | 0.06 | 0.05 | 0.10 |
| Iteration Method | ||||||||
| Years | w27 | w01 | w | b | λ | |||
| 1958–1971 | 0.83 | 0.51 | 0.72 | 10.43 | 1.20 | |||
| 1972–1977 | 0.79 | 0.45 | 0.59 | 22.40 | 1.22 | |||
| 1978–1987 | 0.81 | 0.47 | 0.62 | 8.12 | 1.12 | |||
| after 1987 | 0.84 | 0.49 | 0.70 | 3.85 | 1.08 | |||
| Perron Vector (x*) | ||||||||
| 1958–1971 | 0.43 | 0.18 | 0.12 | 0.09 | 0.06 | 0.04 | 0.03 | 0.05 |
| 1972–1977 | 0.49 | 0.18 | 0.12 | 0.08 | 0.05 | 0.03 | 0.02 | 0.03 |
| 1978–1987 | 0.41 | 0.17 | 0.12 | 0.09 | 0.07 | 0.05 | 0.03 | 0.06 |
| after 1987 | 0.35 | 0.16 | 0.12 | 0.10 | 0.07 | 0.06 | 0.04 | 0.10 |
Table 2.
Descriptive statistics of the distribution of the sex ratio in the population.
| Years | Min(F(n)/M(n)) | Me(F(n)/M(n)) | Max(F(n)/M(n)) |
|---|---|---|---|
| 1958–1972 | 18.14580538 | 31.45767579 | 71.41407582 |
| 1973–1977 | 45.20987382 | 70.09244868 | 122.1069182 |
| 1978–1988 | 14.18993578 | 20.01973463 | 31.46966894 |
| Min(F(n)/M(n)) | Me(F(n)/M(n)) | Max(F(n)/M(n)) | |
| 1989–2013 | 11.78511348 | 14.95958214 | 24.06312045 |
| Min(F(λme)/M) | Me(F(λme)/M) | Max(F(λme)/M) | |
| 1989–2013 | 7.31092815 | 9.280218674 | 14.92762416 |
| Min(F(λmax)/M) | Me(F(λmax)/M) | Max(F(λmax)/M) | |
| 1989–2013 | 6.243618746 | 7.925416047 | 12.74836685 |
Publisher’s Note: MDPI stays neutral with regard to jurisdictional claims in published maps and institutional affiliations. |
© 2022 by the authors. Licensee MDPI, Basel, Switzerland. This article is an open access article distributed under the terms and conditions of the Creative Commons Attribution (CC BY) license (https://creativecommons.org/licenses/by/4.0/).
Share and Cite
MDPI and ACS Style
Zhdanova, O.; Kuzin, A.; Frisman, E. The Harvest Effect on Dynamics of Northern Fur Seal Population: Mathematical Modeling and Data Analysis Results. Mathematics 2022, 10, 3067. https://doi.org/10.3390/math10173067
AMA Style
Zhdanova O, Kuzin A, Frisman E. The Harvest Effect on Dynamics of Northern Fur Seal Population: Mathematical Modeling and Data Analysis Results. Mathematics. 2022; 10(17):3067. https://doi.org/10.3390/math10173067
Chicago/Turabian StyleZhdanova, Oksana, Alexey Kuzin, and Efim Frisman. 2022. "The Harvest Effect on Dynamics of Northern Fur Seal Population: Mathematical Modeling and Data Analysis Results" Mathematics 10, no. 17: 3067. https://doi.org/10.3390/math10173067
Note that from the first issue of 2016, this journal uses article numbers instead of page numbers. See further details here.