
A Novel Strategy to Classify Chronic Patients at Risk: A Hybrid Machine Learning Approach


1
Facultad de Ciencias Sociales y Económicas, Universidad Católica del Maule, Avenida San Miguel 3605, Talca 3466706, Chile
2
Doctorado en Sistemas de Ingeniería, Faculty of Engineering, Universidad de Talca, Curicó 3340000, Chile
3
Department of Computer Science, Faculty of Engineering, Universidad de Talca, Curicó 3340000, Chile
*
Authors to whom correspondence should be addressed.
Mathematics 2022, 10(17), 3053; https://doi.org/10.3390/math10173053
Submission received: 31 July 2022
/
Revised: 16 August 2022
/
Accepted: 20 August 2022
/
Published: 24 August 2022
(This article belongs to the Special Issue Mathematical Prediction Models Applied to Health Management)
Abstract
:Various care processes have been affected by COVID-19. One of the most dramatic has been the care of chronic patients under medical supervision. According to the World Health Organization (WHO), a chronic patient has one or more long-term illnesses, and must be permanently monitored by the health team.. In fact, and according to the Chilean Ministry of Health (MINSAL), 7 out of 10 chronic patients have suspended their medical check-ups, generating critical situations, such as a more significant number of visits to emergency units, expired prescriptions, and a higher incidence in hospitalization rates. For this problem, health services in Chile have had to reschedule their scarce medical resources to provide care in all health processes. One element that has been considered is caring through telemedicine and patient prioritization. In the latter case, the aim was to provide timely care to those critical patients with high severity and who require immediate clinical attention. For this reason, in this work, we present the following methodological contributions: first, an unsupervised algorithm that analyzes information from anonymous patients to classify them according to priority levels; and second, rules that allow health teams to understand which variable(s) determine the classification of patients. The results of the proposed methodology allow classifying new patients with 99.96% certainty using a three-level decision tree and five classification rules.
MSC:
68T011. Introduction
Health services in the world are continuously under stress. Authors such as Kimball and Resneck Jr. [1], Burdiles and Pommier [2] have argued that the source of this problem lies in the gap between available health resources, which are always limited, and the constantly increasing demand for healthcare (see, e.g., Zevallos et al. [3], Malko et al. [4], Pérez-Cuevas et al. [5], Bowen et al. [6], Bazyar et al. [7]). Additionally, this imbalance has led to intense pressure on the responsiveness of health services, have included the work by Singla [8], Armocida et al. [9], which has been accentuated by the COVID-19 pandemic and has affected patients according to Iyengar et al. [10], Haslam and Redman [11], Leite et al. [12], Prasad et al. [13], Wang et al. [14], Mele et al. [15]).
Due to these situations, care processes have been affected at all stages (i.e., emergency care processes, clinical and diagnostic support, laboratories, outpatient care, and bed management, among others; see, e.g., Bae et al. [16], Leclerc et al. [17], Bekker et al. [18]). According to Martínez-Sanz et al. [19]), these situations have caused direct effects on the availability of information, increasing physicians’ uncertainty in making decisions, delaying, in some cases, the implementation of treatments, hospitalization, and surgeries, and affecting the life quality of patients (see, e.g., Ayad et al. [20], Lohnberg et al. [21]).
One of the main difficulties has been medical care, which has not been able to achieve continuity as in pre-pandemic periods. The pandemic forced hospitals to reassign some of their medical resources, causing issues in the sanitary processes (see, e.g., Díaz-Bello et al. [22], Morales-Contreras et al. [23]). According to Zimmermann and Nkenke [24], Katulanda et al. [25], Pang et al. [26], Olloquequi [27], Chudasama et al. [28], this situation has been especially critical for chronic patients, who must constantly be under control given the nature of their illnesses. In some cases, the medical care has been suspended, interrupted, or reprogrammed, negatively impacting the health condition of this type of patient. Some critical events include expired medical prescriptions, decompensation, an increase in urgent-care visits, surgical services, and hospitalization.
In Chile, not all healthcare processes are automated and support decision making. Some hospitals only use part of the digital information to make their decisions. The clinical units cannot characterize their chronic patients (under control) due to the lack of records. In practice, hospitals focus on the modernization of the health emergency process caused by COVID-19, the management of beds, and the reduction in waiting lists, among other urgent aspects. The proper administration of chronic patients has been relegated to a lesser priority. This scenario generated waiting lists in the population under control and critical events in patients.
Machine learning (ML) is a subfield of artificial intelligence which is focused on how machines learn from data. ML relies on statistics, algorithms, and data structures to derive predictions and rules from a large set of examples rather than explicitly specified by humans. ML has been applied in almost all branches of science and engineering, including air quality prediction mentioned by Astudillo et al. [29], economics analysis in Cataldo et al. [30], and the physiological breeding of the plants in Garriga et al. [31]. In health science, the applications of ML are vast. They include human activity recognition using wearable sensors Uddin and Soylu [32], prediction of pregnancy outcomes Islam et al. [33], classification of white blood cell leukemia Sahlol et al. [34], among many more. All these examples show the applications of complex ML solutions.
The applications mentioned above demand the ability to interpret the predictions, which is studied in a subfield of ML called explainable artificial intelligence (XAI) (see, e.g., Ribeiro et al. [35]). The interpretability can influence the decision about using a simpler model in critical domains. Moreover, justifying specific outcomes will produce valuable information that humans can understand, and these models will become an excellent asset to support decision making.
To address the problem of chronic patients, we designed a methodology based on unsupervised learning and explainable machine learning (XAI), including principal component analysis (PCA), the DBSCAN algorithm, and decision trees adapted to the scenario of the current pandemic. This data-driven approach provides insights into the variables affecting the status of patients at any given time.
This work presents an innovative methodology based on machine learning (ML) and XAI for classifying chronic patients at risk. This technological development responds to the needs of patients and the clinical and administrative demands of health teams. In more detail, there are two methodological contributions: The first is a prioritization scheme based on an unsupervised algorithm that considers critical events and clinical variables in chronic patients waiting for healthcare. The second contribution corresponds to an interpretable machine learning algorithm that allows knowing classification rules and understanding how and why each variable is affected by patients in real-time.
The results show that the proposed ML+XAI scheme successfully supports the management of chronic patients under control in Chile. The advantage of the method is that, based on the available data, it organizes chronic patients according to their severity and simultaneously offers rules for explaining the reasons for each categorization. Additionally, a dimensionality reduction of the data allows us to obtain classification accuracies of 99.96% for new patients. Furthermore, the proposed strategy offers five classification rules based on a tree depth of three, identifying the variables Operating Room and Recurrence of Critical Events as the most relevant when classifying chronic patients in the different levels of prioritization.
This paper is organized as follows. Section 2 presents a literature review on managing patients under control during the pandemic. In Section 3, we offer the main features of the proposed method. The experimental results obtained from real-world patients are presented in Section 4. Section 5 presents a thorough discussion of the results. Finally, Section 6 concludes the paper and provides avenues for further research.
2. Related Literature
This section presents a brief literature review of the demand for health services and predictive strategies to support decision making.
2.1. Demand for Health Services
Some health centers have financed special programs to solve demand problems. However, Huber [36] suggests that changes in the incentives provided in the health sector do not determine the quality of clinical attention. Different governments in the world have addressed the latter approach (see, e.g., Valente et al. [37]), but it continues to be a public policy problem, both in the clinical and budgetary spheres.
According to Rathnayake et al. [38], health services have not been able to cover all health demands, which has triggered patient dissatisfaction and has increased with the spread of COVID-19. Governments added resources to deal with this situation, but this has been insufficient. In this sense, decision support systems are an efficient alternative to alleviate the problem. Various cases have been addressed in the literature, such as Grossman [39], Alcalde-Rabanal et al. [40], Braithwaite and Nolan [41], Solanki et al. [42], Verma et al. [43].
Authors such as Bowers [44], Sutherland et al. [45], Clement et al. [46] have pointed out that solving all problems related to patients’ health in time is a complex problem and a great challenge for health centers. Consequently, as more people enter the system, the waiting lists become unmanageable. For this reason, health services urgently require decision support systems that identify the most seriously ill patients and provide quality information to health teams (see, e.g., Boivin et al. [47], Silva-Aravena et al. [48]).
2.2. Strategies to Manage Healthcare Demand
Various strategies have been implemented to manage waiting lists. For instance, the authors of Harper and Gamlin [49] analyzed the evolution of 400 patients in one year using a simulation model, which allowed them to identify a series of critical factors influencing patient waiting times. The authors have shown that alternative appointment times reduce waiting times without the need for additional resources. More recently, authors such as Ritschl et al. [50] and others have developed an assignment-based system implemented in Germany to reduce mortality on the waiting list. The purpose of this study was to assess post-transplant outcomes and waiting list mortality using historical open access data from Eurotransplant and the German Organ Transplant Foundation.
A different study cited by Acuna et al. [51] proposed game-theoretic models in which cooperation between the public and private health systems reduces waiting lists by up to 60%. Furthermore, other works have focused on ENT pediatric patients, such as that proposed by Pokorny et al. [52] which indicate that introducing an advanced audiology service could significantly reduce waiting lists. In Taherkhani et al. [53], the author suggested a method based on a fuzzy inference system for ranking the patients on waiting lists based on kidney allocation factors. The strategy is effective in improving kidney replacement systems and applies to other organs, including the lung, liver, and heart. In addition, the literature records systematic reviews exhibiting the urgency of managing waiting lists to improve both health services and the life quality of patients (see, e.g., Déry et al. [54], Vijeratnam et al. [55], Rathnayake and Clarke [56].
Other strategies based on data range aggregation have been used to manage waiting lists. Authors, such as [57] and others, have developed this method to prioritize triage patients according to their medical condition and chances of survival. The process is evaluated by an expert physician, who judges the results in terms of practicality and acceptability, achieving adequate performance. On the other hand, other studies, such as the one proposed by Riff et al. [58], proposed an algorithm based on heuristics to reduce the average waiting time in the radiotherapy unit. This work dynamically manages a priority list based on the patient category and their current waiting time, reducing the average waiting time and delay for all patient types with a statistical significance of 95%.
Other successful cases that have contributed to the problem of managing waiting lists are multivariate regression models that allow estimating associations between patient characteristics and health conditions, such as depression and pain (see, e.g., Sutherland et al. [45], Breton et al. [59], Guo et al. [60]). In a related investigation proposed by Gutacker et al. [61], a Poisson regression model estimates the waiting time of patients requiring hip or knee replacement. In this work, the authors mentioned that patients who suffer the most intense pain and immobility have shorter waits, 24% for hip replacement and 11% for knee replacement, with a linear association. In related research proposed by Gutacker et al. [61], a Poisson regression model estimates the waiting time for patients requiring hip or knee replacement. Other studies, such as those of Azizi et al. [62], Dorado-Díaz et al. [63], Jegatheeswaran and Tolley [64], chose different algorithms to prioritize patient waiting lists, providing information to support the clinical team decision making that benefited patients.
In more recent cases, the impact of COVID-19 on the management of waiting lists has been studied. For example, Yates et al. [65] described how the life quality of patients waiting for cardiac surgeries and the perioperative risk might be affected by long waiting times. Furthermore, according to Stuart et al. [66], 20% of patients awaiting cataract surgery were at high risk of severe illness or death.
2.3. Decision Support Systems: Predictive and Automated Tools
Predictive automated tools have been used to select patients on waiting lists. For example, in Petwal and Rani [67], the authors developed a hybrid metaheuristic strategy based on a simulation that predicts the evolution of the prioritized patients. The study revealed the methodology and algorithms used to provide optimal priorities for patients on the surgical waiting list. Furthermore, de Almeida et al. [68] designed mathematical tools that dynamically sort patients waiting for attention. The surgical prioritization algorithm showed excellent concordance and correlation with the classifications of expert physicians in the field. This consistently stratifies patients who require surgical care. Additionally, in Valente et al. [69], Pietrzak et al. [70], the authors designed effective methodologies to sort patients, adapting characteristics and new pandemic criteria supporting the decision making. A recent study was presented by Casal-Guisande et al. [71], in which authors proposed a strategy to support decision making in triage for emergency and intensive care units (ICUs). The vague fuzzy decision matrices are proposed in this work according to experts’ opinions and weight criteria based on the normal distribution, aiming to define a multi-attribute patient hierarchization method for ICUs, which define a rank of patients for supporting clinical decision making. The method suggests that, if a part of the decision process is supported by these systems and by the experts’ opinions, the errors associated with incorrect interpretations and diagnoses might be reduced.
In Brazil, the authors of Sapiertein Silva et al. [72] used a Cox regression model to estimate the risk of kidney transplant patients which considers the waiting time for a kidney transplant from a deceased donor. The developed model could predict the waiting time with good agreement in the internal validation (c index = 0.70). The strategy offers good predictive performance and provides valuable information for decision making by the health team, benefiting patients. In the same line of work, authors such as Kawakita et al. [73] and other researchers remarked on the importance of supporting personalized decision making that helps physicians and patients on the kidney transplant waiting list. The model demonstrated good forecasting ability for a validation data set. The ROC curve was 73.4 [72.7; 74.0] for receiving a kidney transplant and 75.0 [73.7; 76.4] for leaving the waiting list due to death.
Various ML and XAI strategies have been used to address health problems. In this direction, some authors such as Ahmad et al. [74], Antoniadi et al. [75], Manresa-Yee et al. [76] solve complex health problems by understanding variables for health teams to support decision making and guide the implementation of these methods. In the same line, the authors of Panigutti et al. [77] presented Doctor XAI, an explainable model that deals with sequential and multilabel data. The model classifier takes a patient’s clinical history to predict the next visit through an explanation based on rules, favoring the decision making of the health team. Some successful cases of the implementation of XAI in the health sector have been the works presented by Zainab [78], applied to the detection of depression, Kavya et al. [79], to improve the diagnostic interpretation of comorbidities associated with the allergy of patients, and Biswas et al. [80] for autism detection. Other authors, such as Xu et al. [81], Resta et al. [82], have developed strategies to characterize and group patients in emergency units. These strategies are based on unsupervised learning, such as k-means, hierarchical methods, and an unsupervised neural network, self-organizing maps (SOMs), which allow for the better planning of the capacity of sanitary beds.
Of particular interest is the strategy of the prioritization of patients with chronic pathologies belonging to a cardiology unit presented by Kalid et al. [83]. The authors proposed the use of body sensors and communication technologies to evaluate emergencies and score patient data on a large scale in a telemedicine environment. The patients were classified in a decision matrix based on multicriteria analysis, achieving good results with the patient classification method. In the same line of work, the authors of Salman et al. [84] have used sensors to measure electrical signals of the heart; blood oxygen saturation; and blood pressure—in addition to using a non-sensory assessment to measure chest pain. Patients were prioritized based on measurements using integrated forward and backward adjustment for weight calculation, achieving appropriate patient classification.
Some strategies have been implemented in Chile to reinforce the control of waiting lists. For instance, Martinez et al. [85] proposed a statistical survival model to predict the risk of patient mortality. There was a statistically significant association between waiting for time variability and death (Z = 2.16, p = 0.0308). The waiting time for patients due to non-prioritized health conditions was associated with higher mortality in Chilean hospitals. On the other hand, a dynamic biopsychosocial prioritization by measuring the vulnerability of the waiting patient is presented in Silva-Aravena et al. [86], where authors show that the effective measures can be implemented that allow health teams to control their waiting lists. More recently, Acuna et al. [51] proposed a game-theoretic strategy to reduce the waiting list across mixed process attention with private hospitals, and Silva-Aravena and Morales [87] offered a dynamic method of managing the surgical waiting list through a network approach. The implemented model will reduce waiting lists.
State of the art shows that waiting list management processes are approached through automated and interpretive techniques that support the management of health teams. Then, the main findings are presented to justify the choice of the method that we propose in this work:
- (1)
- International evidence demonstrates the importance of including interpretable methodologies to manage patients under control on waiting lists (that is, using supervised or unsupervised algorithms) that allow health services to face, in some way, the effects caused by the pandemic. Unfortunately, there is a lack of investigations into this issue in Chile.
- (2)
- The health teams’ opinion is central for developing prioritization strategies, considering the clinical variability presented in various clinical specialties.
The above elements demonstrate the importance of developing strategies to support decision making in Chilean health services, considering more automated and explanatory processes to help physicians in decision making. These strategies would make it possible to combat excess demand and long waiting lists, providing timely care for complex patients.
3. Materials and Methods
In this section, we present the main elements of the methodology that allows classifying chronic patients at risk using ML + XAI.
3.1. Novel Strategy to Classify Patients
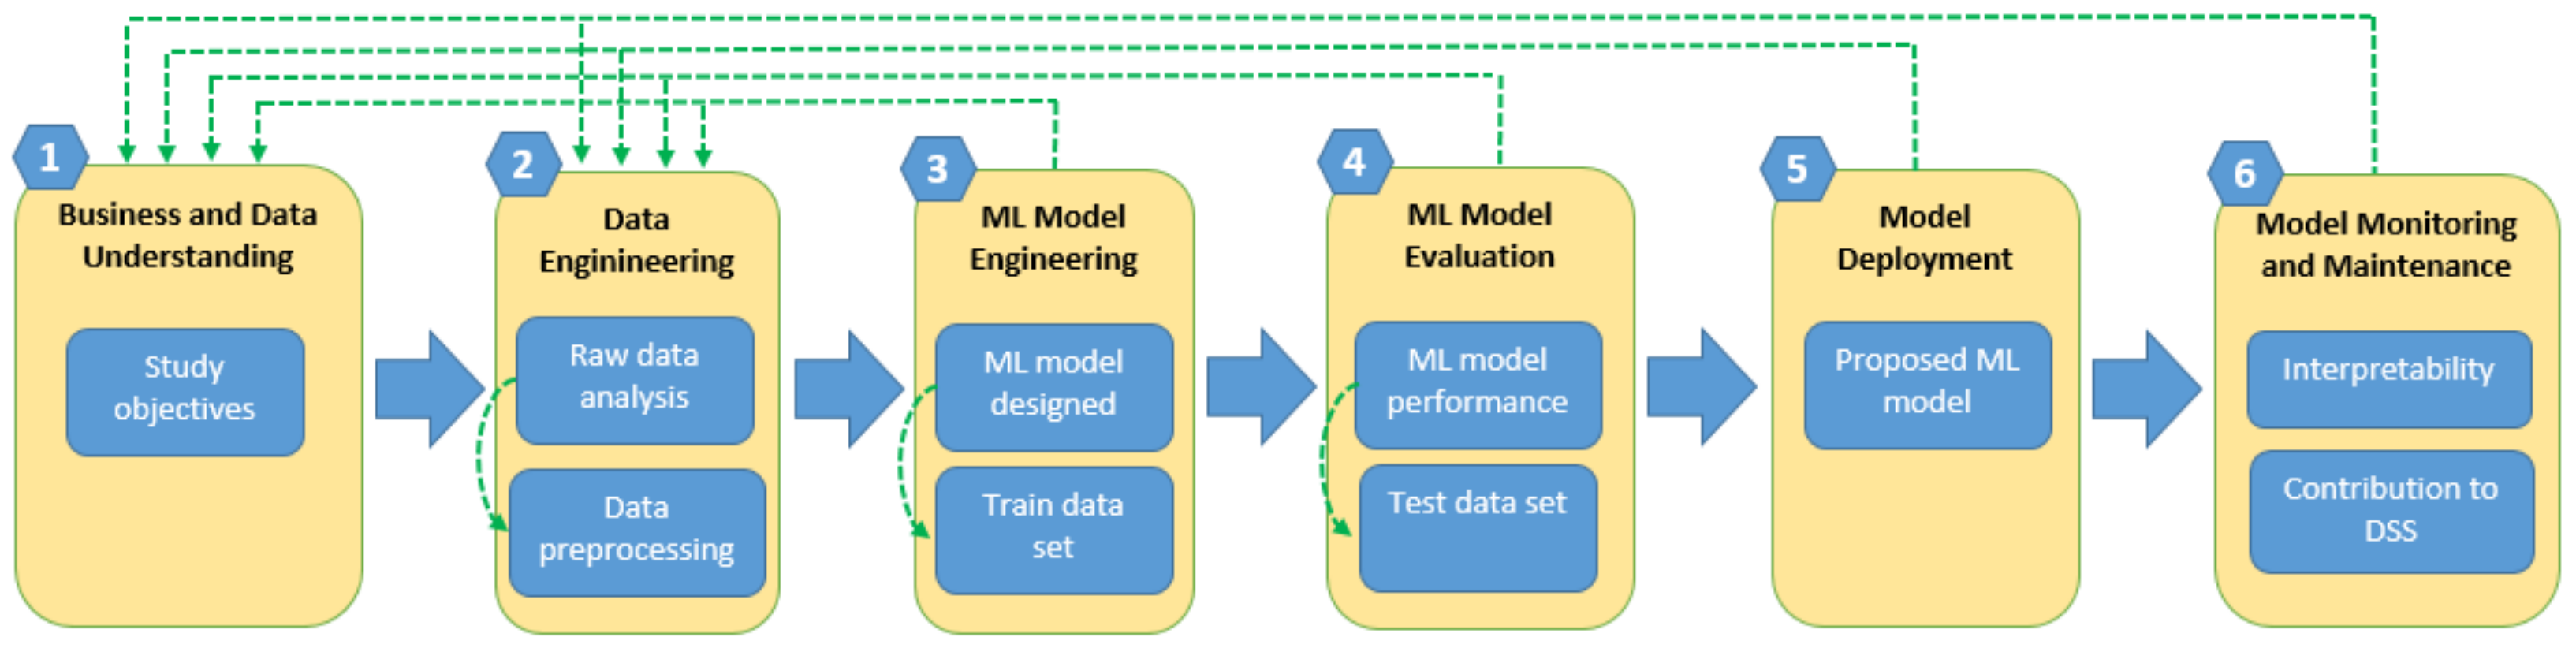
The structure of a patient classification strategy is based on the data methodology for health, CRISP-ML(Q), which is mentioned in different works, such as Kolyshkina and Simoff [88], Studer et al. [89]. This method focused on a standard process for machine learning development and was adapted in our work to improve the management of chronic waiting patients. The process is composed of the following stages: (1) business and data understanding, where we review anonymous patient data and define the objective and feasibility of the project; (2) data engineering, where the characterization and preprocessing of the data are achieved; (3) ML model engineering, choosing the correct algorithm and specifying the predictive model that best fits the available data; (4) ML model evaluation, evaluating the performance of the model and its interpretability; (5) model deployment, where the characteristics of the model allow its implementation in real-world health services; and (6) model monitoring and maintenance, where the conditions of simplicity and interpretability ensure a contribution to decision making in health, as well as considering the possible adjustments required for proper operation. The main components of the methodology are presented in Figure 1.
3.2. Case Study: Chronic Patients under Control Waiting for Medical Attention
According to information provided by the Chilean Ministry of Health, one of the main collateral effects caused by the COVID-19 pandemic has been the suspension of care for chronic patients under medical control. This situation was accentuated when patients did not attend for fear of contagion, causing a substantial increase in people waiting for their medical care. Only 34.1% of patients maintained their medical control (https://www.latercera.com/nacional/noticia/siete-de-cada-10-enfermos-cronicos-suspendieron-sus-controles-por-la-pandemia/ATTIUNC7MJFL5GFZWPYICSEKOM/, accessed on 2 July 2022).
3.2.1. Characterization of The Data
This work contains 5507 records of anonymous patients who remained in control in a Cardiology Unit of a Chilean Health Service until 31 August 2021.
Table 1 shows the primary diagnosis associated with heart disease in chronic patients. In addition, these diseases occur predominantly in men (55.5%). Furthermore, the highest prevalence of control patients appears over 60 years old, representing 78.4% of the cases, followed by patients between 30 and 59 years old, with 20.7%. In a lower range of occurrence, age groups between 15 and 29 years present diseases in only 0.8% of the cases, and ultimately, patients between 0 and 14 years old with 0.06%.
Table 2 details the components that allow the characterization of chronic patients under medical control and are classified into critical events and clinical variables.
Critical events are complications that usually occur in chronic patients under control. The COVID-19 pandemic increased its number. Table 2 shows the critical events defined by the health team of the Cardiology Unit. These are: Urgency; Operating Room; Hospitalization; and Prescription status. The dataset variables representing the critical events can take the value of 0 or 1, representing the condition of “no presence” or “presence”. The patient will remain in this condition for 30 days from its occurrence. For example, for a patient p is observed to have expired prescriptions on 1 January 2022, the Prescription Status (Pre) event will be “presence” and registering one in the dataset. Patient p will remain in that status until 31 January 2022. The above evaluation is performed for all critical events and in all patients under control.
In addition, Table 2 presents the recurrence of critical events (Recu) suffered by patients and that, according to the health team, are classified from 0 to 4 in the dataset regardless of the type of event.
Table 3 shows a summary of 5 random anonymous patient records. For example, the first anonymous patient in Table 3 presents four critical events in the last 30 days. As a matter of fact, the patient had a visit to the emergency unit (Urg = 1); a surgery (Or = 1); a hospital (Hosp = 1); and also, an expired prescription (Pre = 1). The number of recurrent critical events that the patient suffered (Recu = 3) corresponds to a patient with a high level of risk and severity. This recurrence indicator, Recu, was defined by the health team as: Recu = (i.e., ).
The clinical variables are characteristics that allow evaluating the health status of patients at a given time. To refine the priority classification, the health team performs the clinical evaluation of the patients. Continuing with the example of the first patient shown in Table 3, the physician has determined that: they have an indication for percutaneous revascularization, (Per = 1); have maintained the level of dyspnea with respect to the previous clinical evaluation, (Dys = 1); have continued to faint as a result of their illness, (Dys = 1); have increased levels of angina with respect to previous medical controls, (Ang = 2); their left ventricle contraction indicator which presents worrying levels, with an LVEF < 40% in echocardiogram and in medical evaluation, (LVEF = 1); did not have previous revascularization surgeries, (Rev = 1); have an electrical device implant, (Hig = 1); did not miss any planned medical check-ups, (Con = 0); and presented with edema, (Ede = 1) and heart valve prosthesis, (Hea = 1).
Given the critical and clinical variables, the health team designed a prioritization score, Pf, which is computed for each patient (see Table 3). The score is calculated using the dot product between the variables and their relative weights, shown in Table 2. These weights are experimentally obtained by asking a committee of experts.
3.2.2. Raw Data Preprocessing
Using the score of prioritization, Pf, and the expert opinions regarding the critical events and clinical variables, a criterion is built that quantifies the severity of the risk of patients under control who are waiting for care. Let severity be the name of a variable that segments Pf into three levels: (i) a score greater than or equal to 1.4 is considered as “very severe”; (ii) scores between 0.7 and 1.4 are deemed as “medium severe”; and (iii) scores Pf less or equal than 0.7 are viewed as “not severe”. Table 3 shows the values that severity takes for classifying the severity level of the patients in the dataset, where 0 is used to classify the “not severe” patients, 1 to classify “medium severe” patients, and 2 to classify a “very severe” patients.
To carry out a natural ordering of categorical variables that have more than one class in the dataset, such as Recu, Dys and Ang, we used the one-hot encoding strategy, that is, we eliminated the variable encoded as integers and added a new binary variable for each unique integer value. For instance, for the variable Recu, there now exists a Boolean variable called that is true when the patient has suffered up to one critical event. Analogously, , , and assume that the value is true when the patient suffered up to two, three, and more than three critical events, respectively. A similar data transformation is used for the dyspnea (Dys) and angina (Ang), which have three categories.
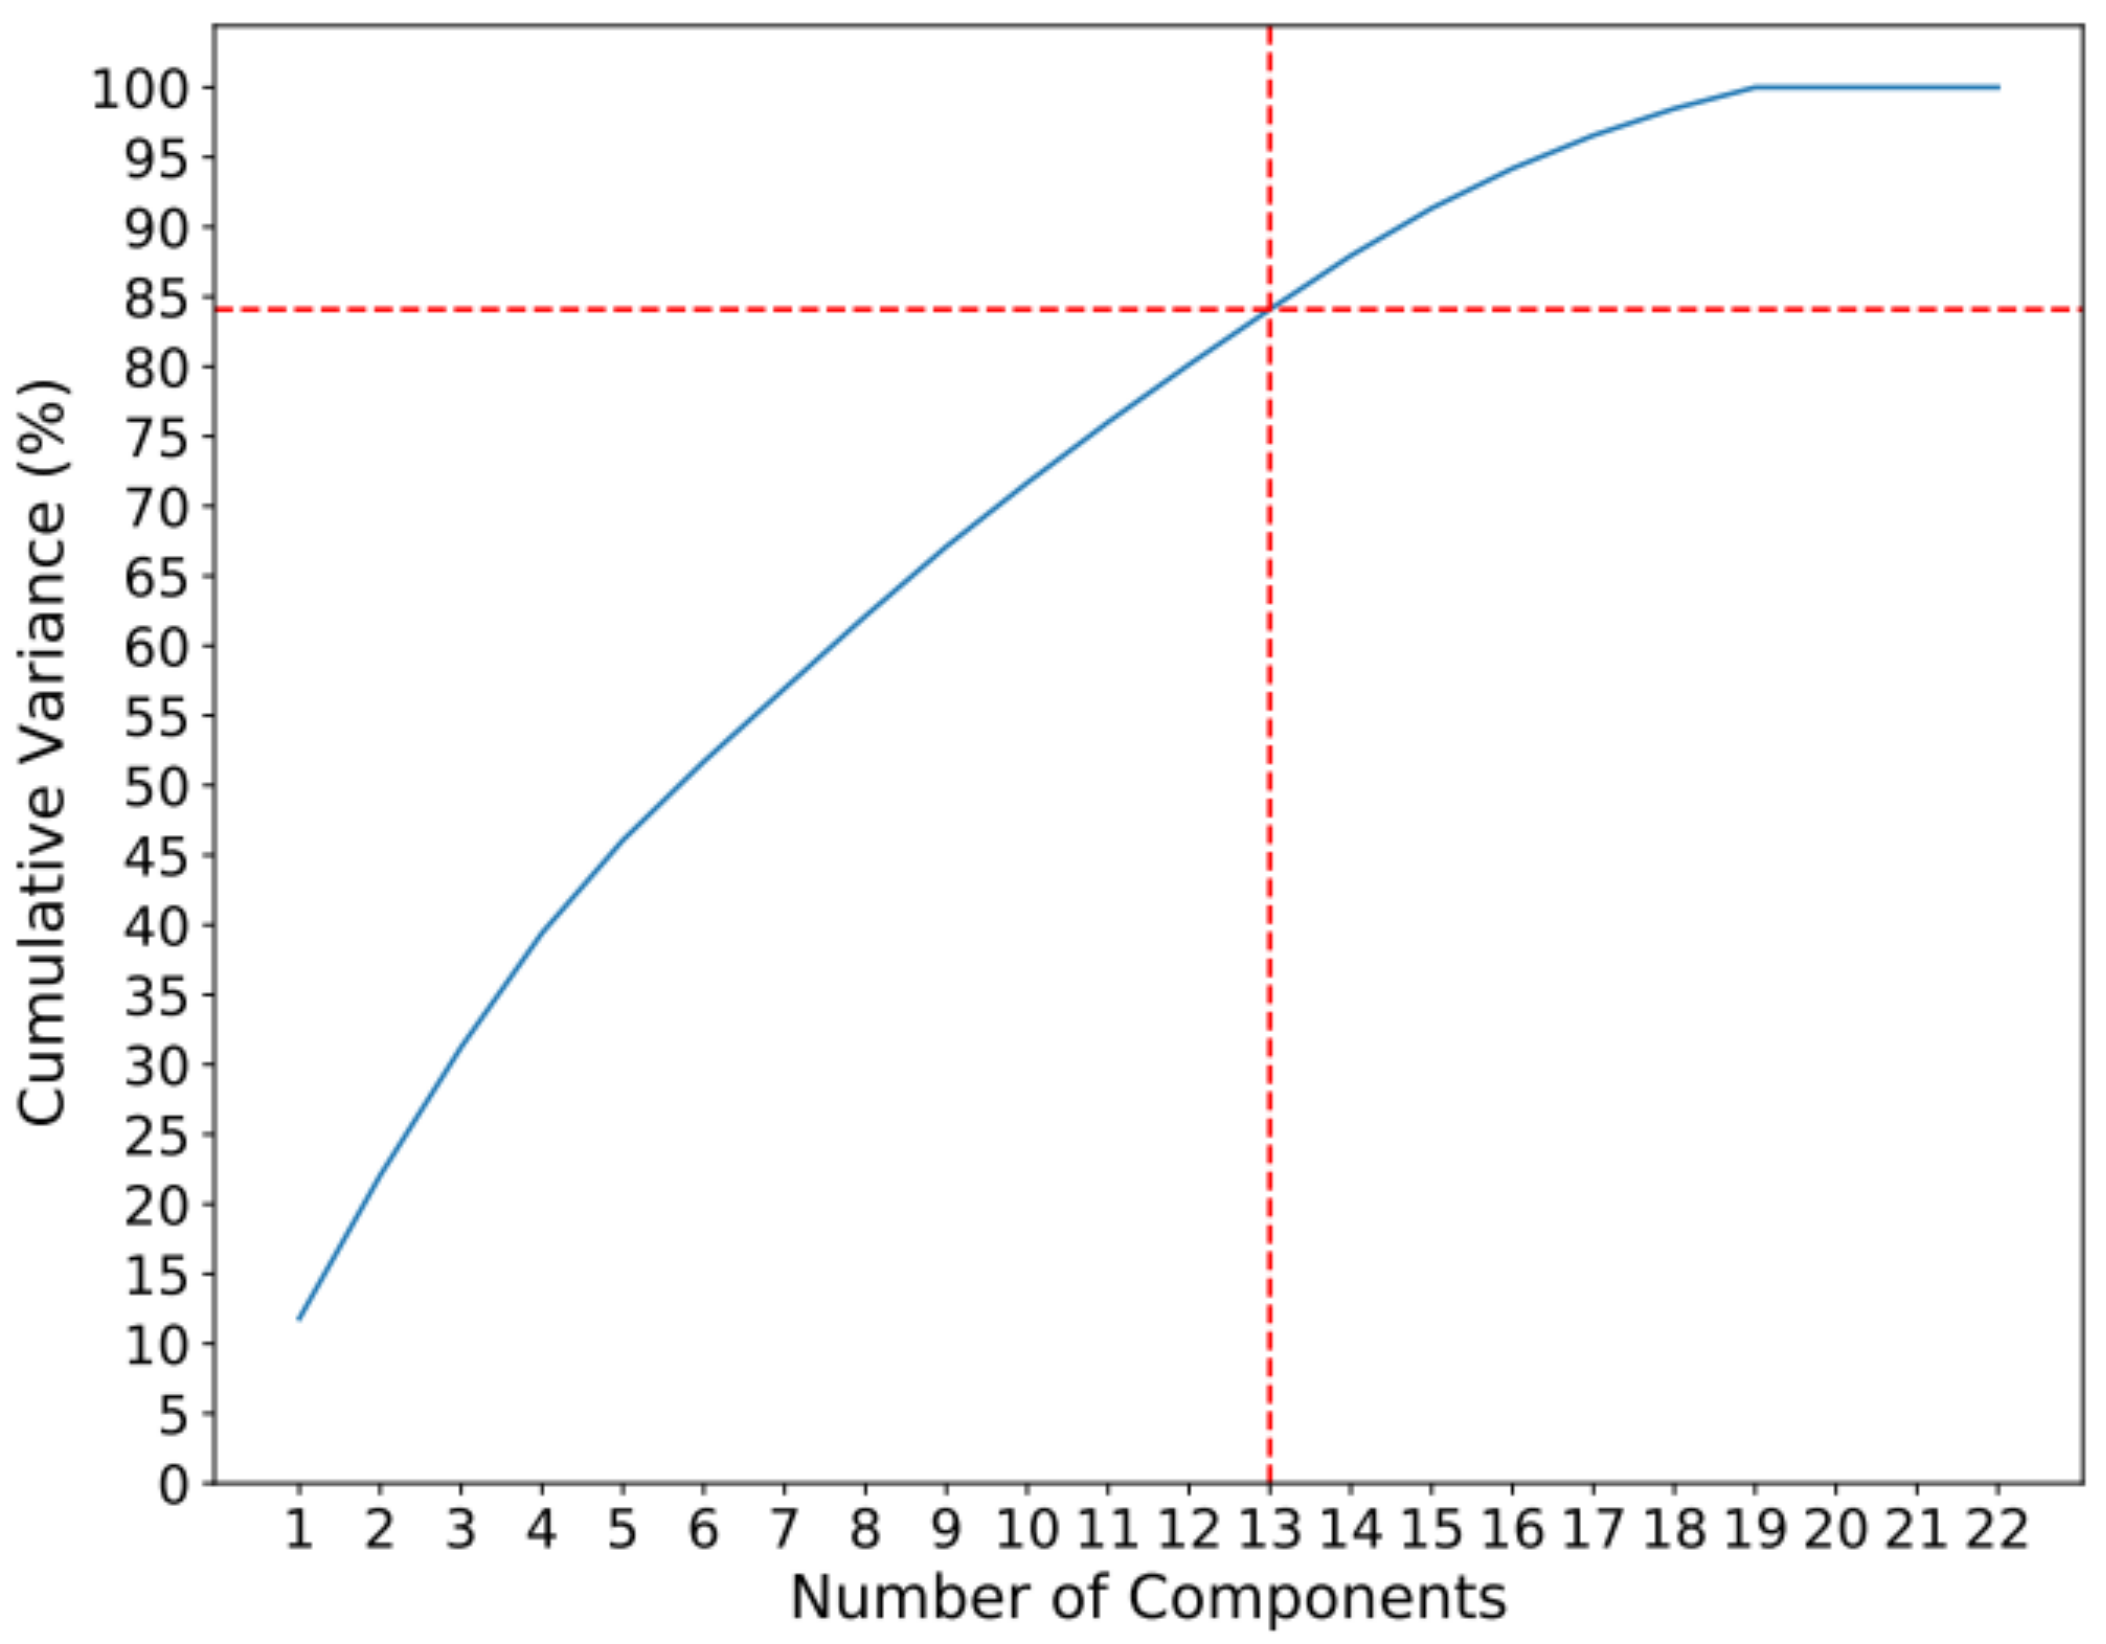
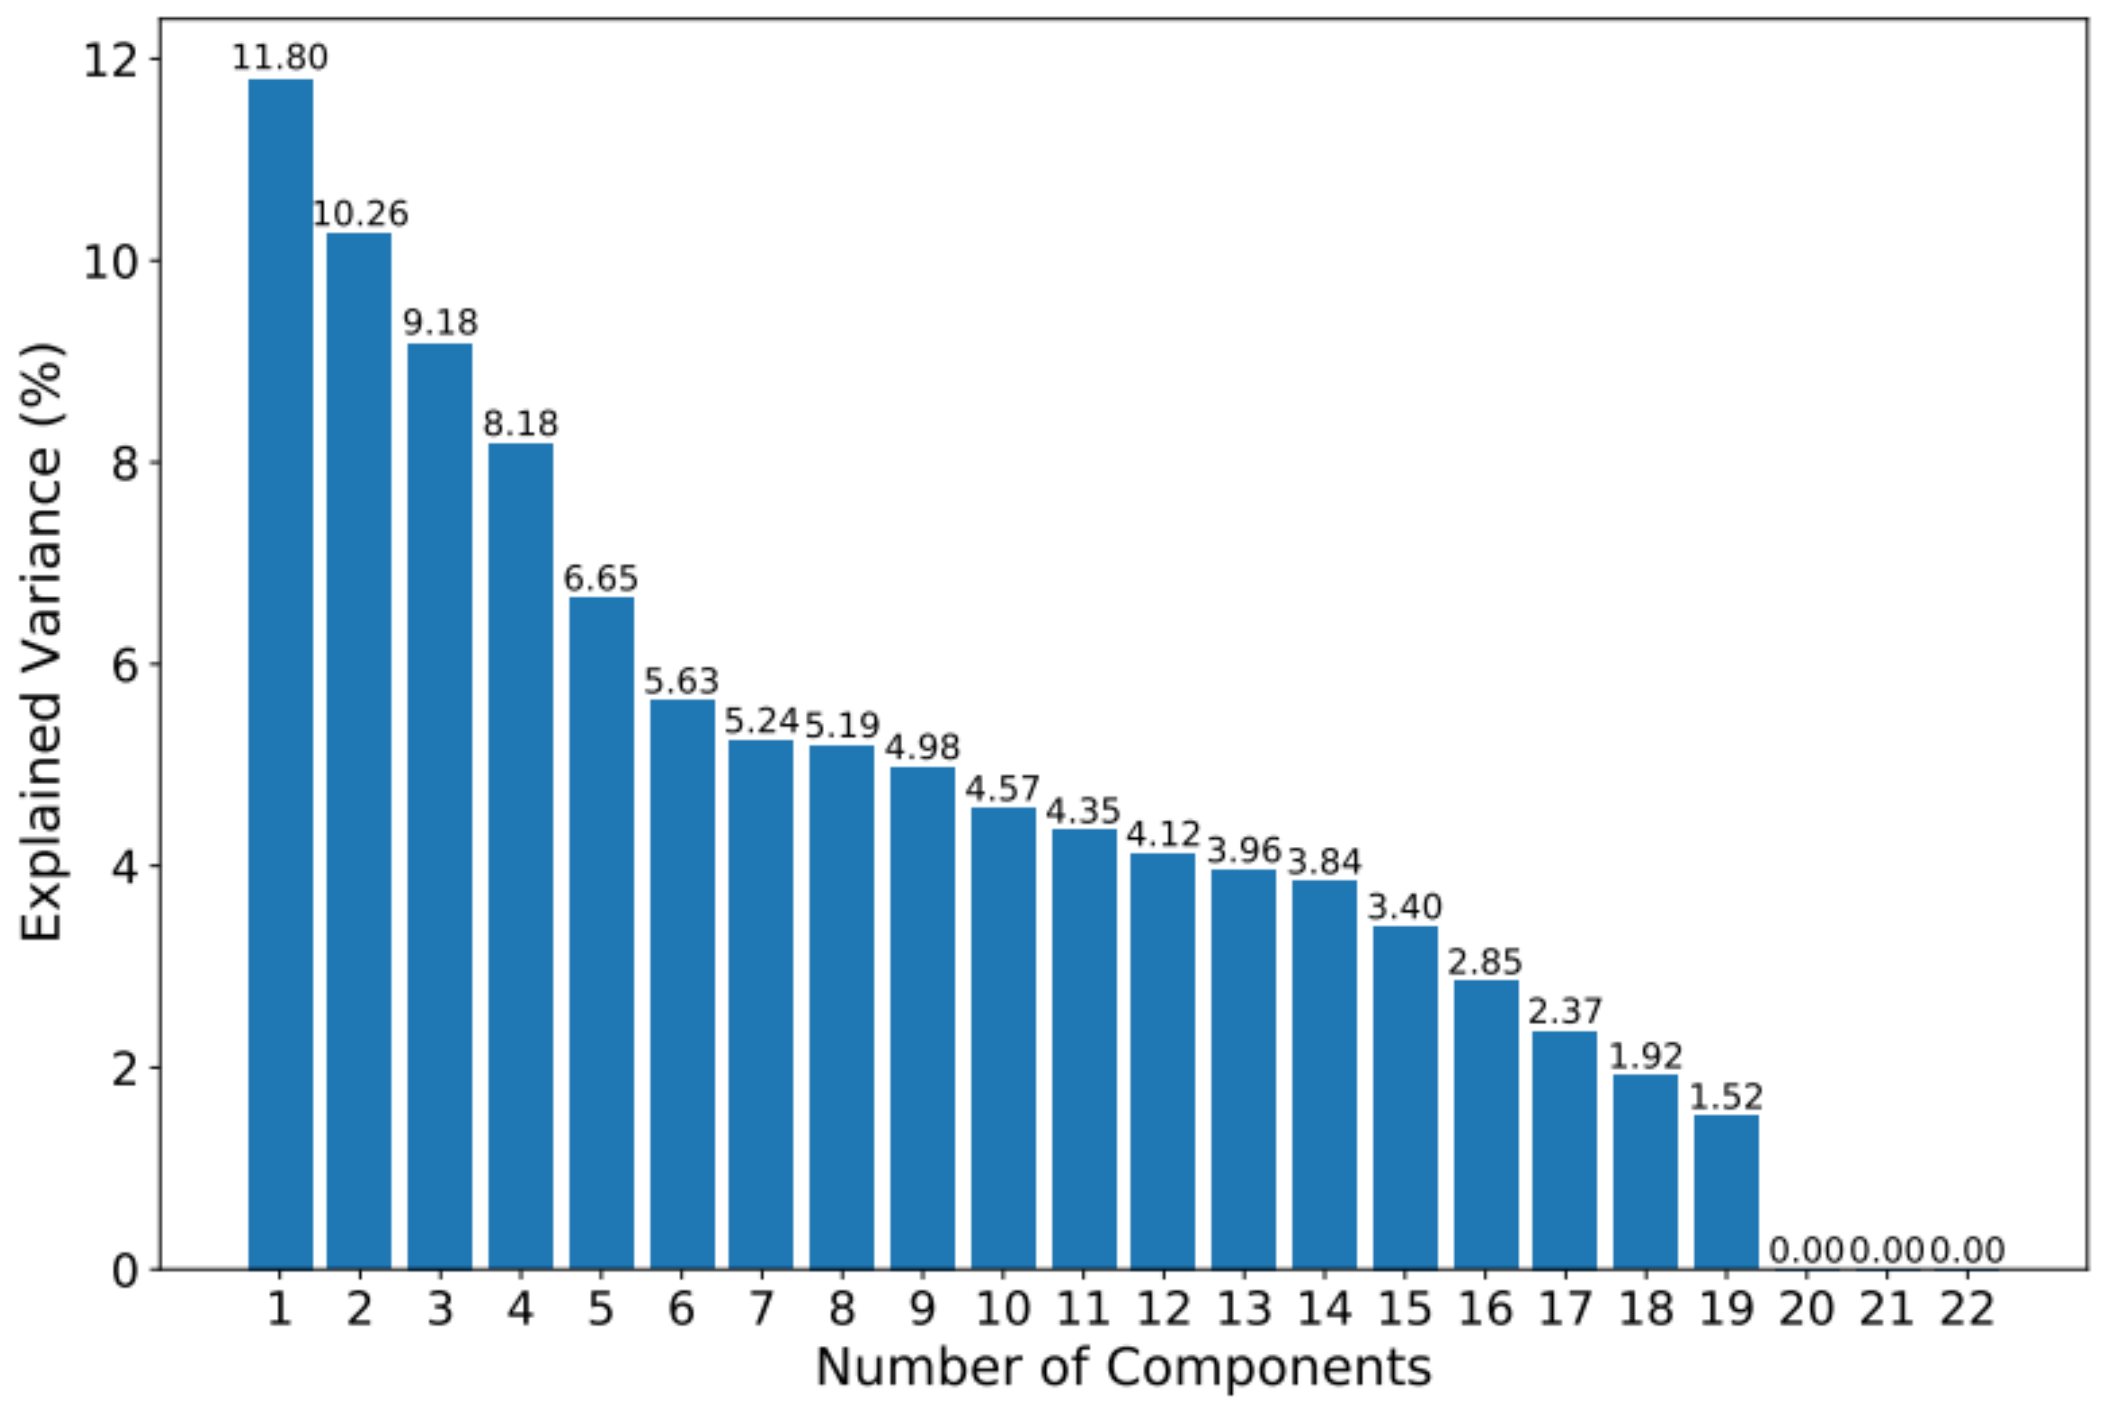
Regarding data understanding, we reduced the dimensions of the dataset through principal component analysis (PCA), generating a reduced number of features that concentrate most of the information of the original data collection. We discovered a minimum number of features that maintains a large proportion of information from the original distribution of the records, all of which is due to the use of eigenvalues and eigenvectors extracted from the covariance matrix. As a selection measure, we use the number of components that cumulatively explain 85% of the variance present in the data. This threshold is in the range generally used in the literature (see, e.g., Loquasto and Seborg [90], Razmkhah et al. [91], Artoni et al. [92]).
3.3. Clustering Strategy to Find Groups Of Patients
To classify patients with similar characteristics, we used a clustering algorithm according to the following procedure:
- We used the label of each cluster as a simile for the severity variable, Severity;
- We determined the median prioritization score, Pf, to associate a severity level to each cluster;
- To automatically detect clusters, we use density-based spatial clustering of applications with noise, DBSCAN, (see, e.g., Schubert et al. [93]), due to its effectiveness in finding nearby elements in various dimensions.
DBSCAN grouped instances close to each other based on the Euclidean distance and a minimum number of data. In addition, it identified outliers present in low-density regions. DBSCAN uses two parameters. The first parameter, called eps, controls how close the points must be to each other to be considered part of a cluster. To determine the optimal value of the parameter eps, we used the methodology proposed in Ester et al. [94], which consists of finding the elbow of the graph of the ordered k-distances. The second parameter, named minPoints, determines the minimum number of points to form a dense region. For this parameter, we follow the recommendation of using a value equal to twice the dimensionality of the data (see, e.g., Schubert et al. [93]).
DBSCAN will automatically output the groups discovered in the data, treating them as labels. In this case, the patients are grouped in terms of the level of severity of the patients. The resultant group label is used to train a supervised ML model that will allow the prediction of the severity of future patients.
We selected a CART decision tree algorithm as the classification scheme. We made this selection because of the good trade-off between accuracy and explainability.
As the validation strategy, we randomly sampled 60% of the dataset for training and the remaining 40% for testing. Then, the grid search approach was adopted to find the optimal parameters. Furthermore, a cross-validation resampling technique was employed to assess the model, and the accuracy was selected as the performance metric.
The data-processing tasks and the application of the clustering algorithm are implemented with the Python language. On the other hand, the classification, rule extraction, and data visualization tasks are implemented in the R language.
4. Results
The main results obtained with the methodology proposed in this work are presented below.
4.1. Identification of Clusters to Classify Chronic Patients
When applying PCA to the dataset, it is observed that the first 13 components contain approximately 85% of the information. The accumulated variance and the variance of each component can be seen in Figure 2 and Figure 3.
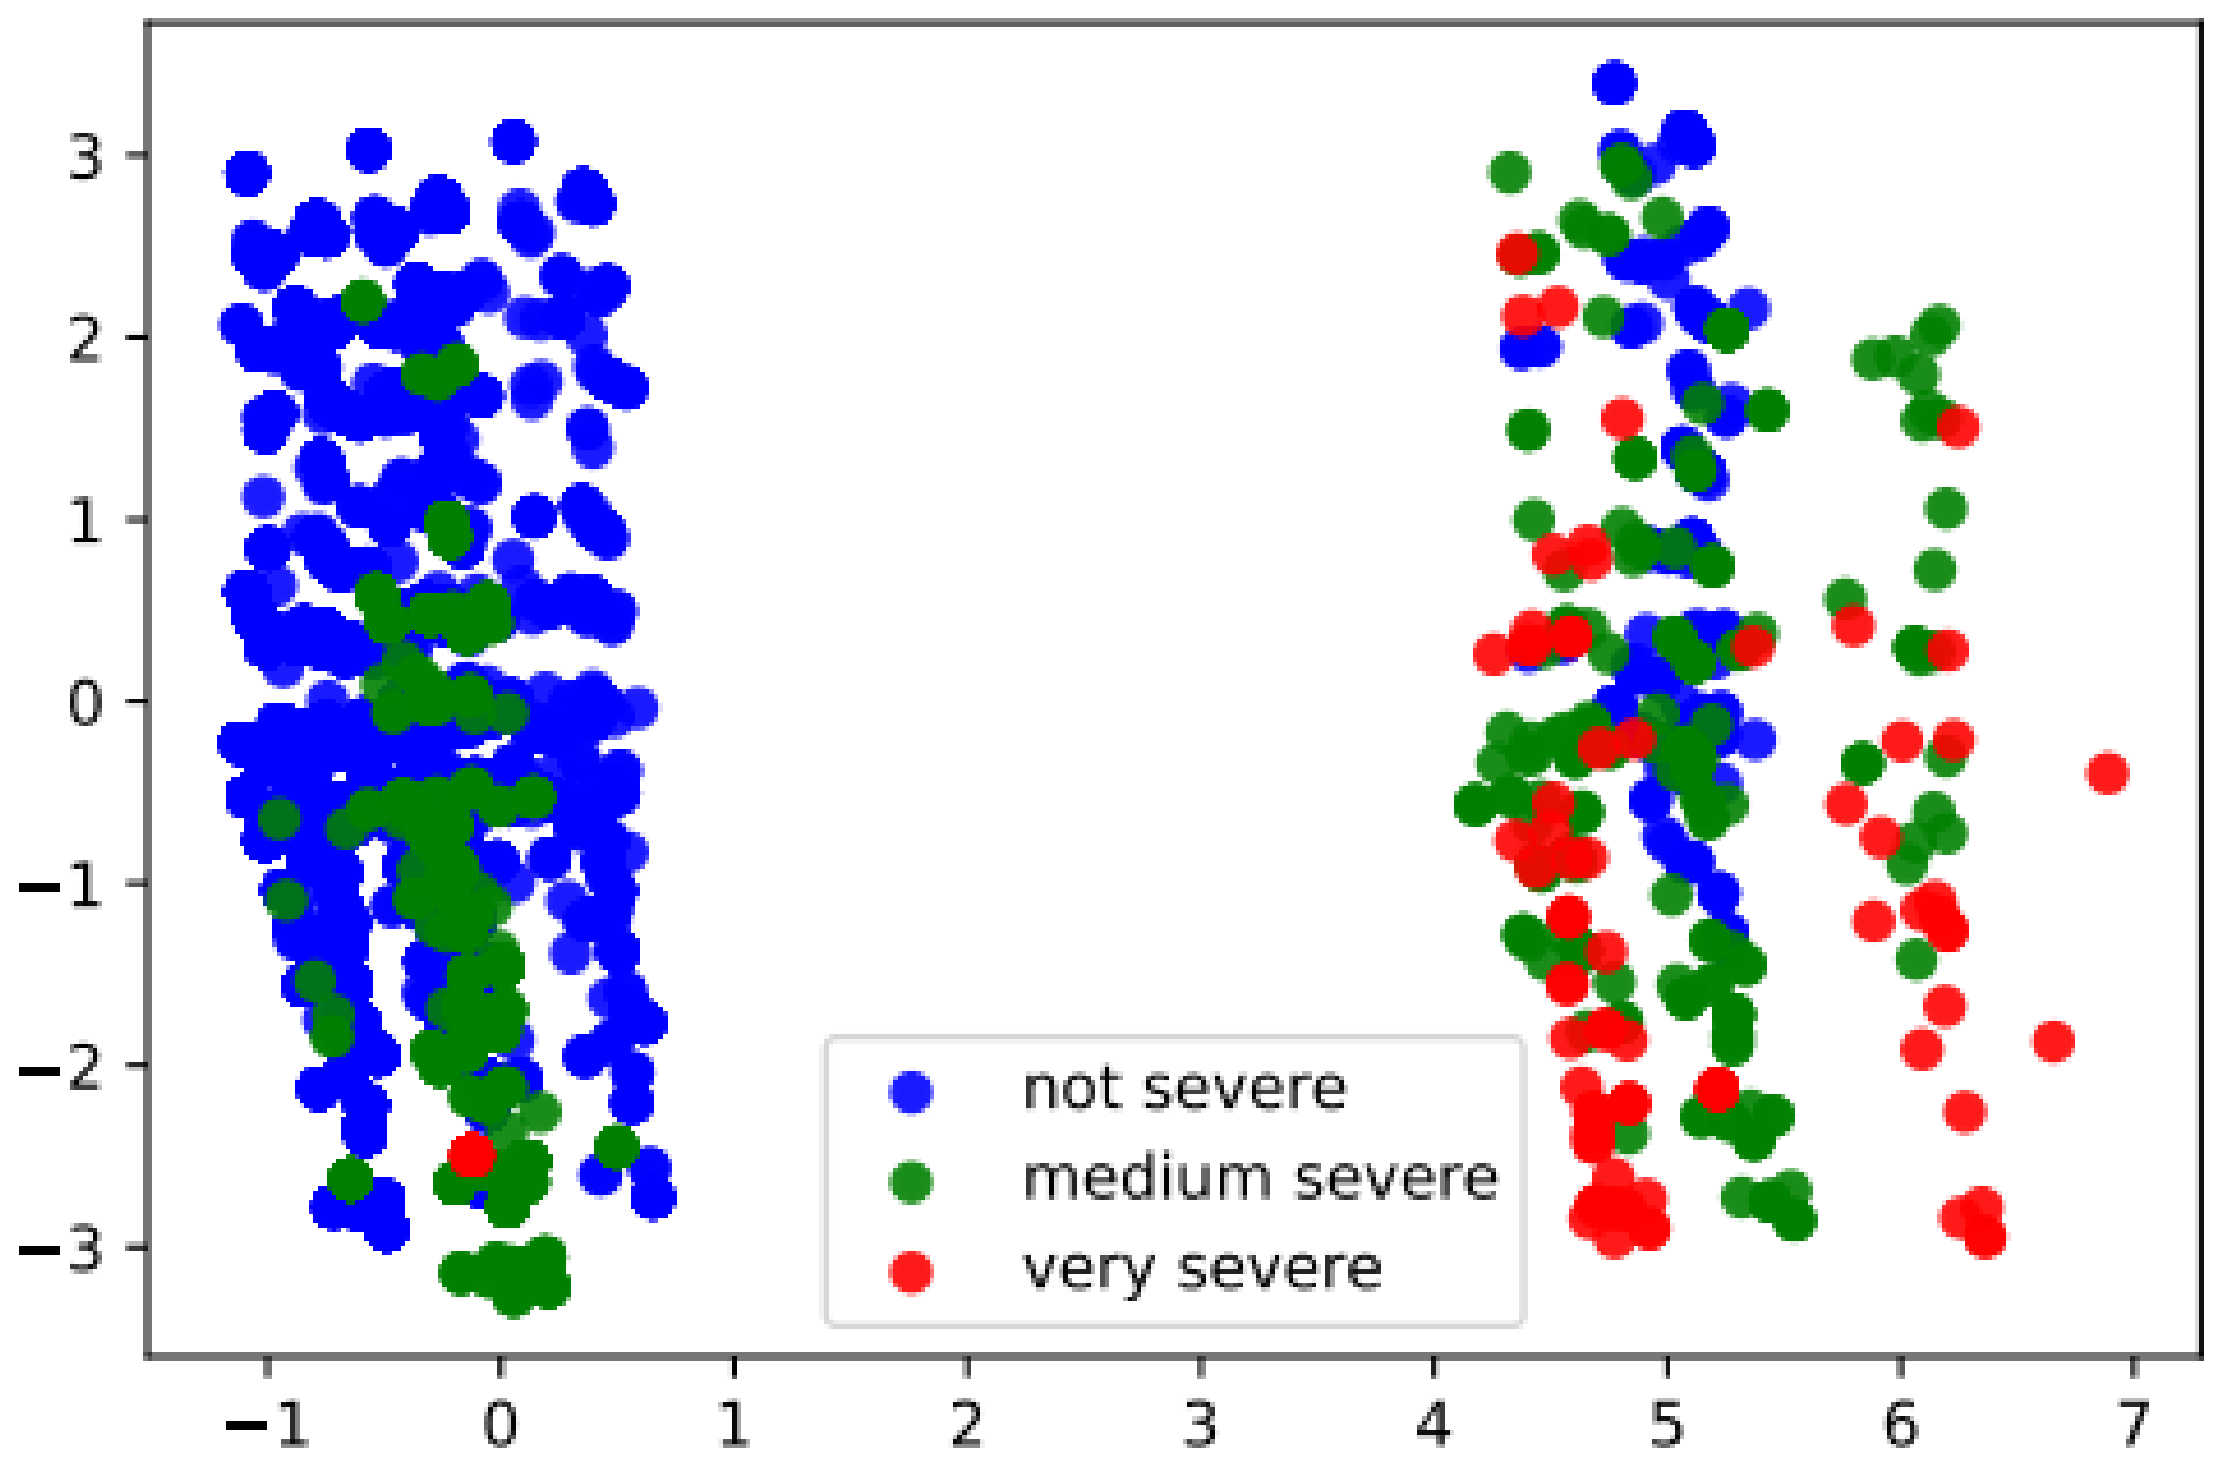
Figure 4 shows a two-dimensional projection that allows the visualization of the patterns of the patients in a reduced data space. Patients are colored according to their level of severity: i.e., “not severe” are classified in blue, those classified as “medium severe” in green, and those classified as “very severe” in red.
Furthermore, and based on the first 13 principal components obtained through PCA, we determined that eps = 5.1384 and minPoints = 24 are the optimal values for the DBSCAN. Using this configuration, we obtained five clusters. The number of elements and the median priority score for each cluster are detailed in Table 4.
Regarding the classification of the clusters, cluster 0 groups the patients with the value of “not severe” and cluster 4 groups the “very severe” patients. Clusters 1, 2, and 3 represent intermediate groupings of severity measured in terms of Pf. Figure 5 shows the first two principal components, and the color of the instances represents the cluster to which each patient belongs.
The labels obtained with the clustering algorithm were used as a target variable by the classification tree. For training, we used 60% of the dataset and the remaining 40% to test the model. The validation process was carried out through cross-validation with five k-fold. The determined model presented an average accuracy of 99.88% in the validation process and 99.96% accuracy in the test set.
4.2. The Algorithm Identifies Prioritization Rules
Figure 6 shows the resultant classification tree, in which five rules allow classifying chronic patients with a high level of certainty. The rules are the following:
- Rule 1: “When Or = 0 and = 0, the decision tree will classify a given patient in cluster 0”;
- Rule 2: “When Or = 1 and = 1, the decision tree will classify a certain patient in cluster 1”;
- Rule 3: “When Or=1; = 0 and = 1, the decision tree will classify a certain patient in cluster 2”;
- Rule 4: “When Or = 0 and = 1, the decision tree will classify a certain patient in cluster 3”;
- Rule 5: “When Or = 1; = 0 and = 0, the decision tree will classify a certain patient in cluster 4”.
5. Discussion
The main advantages of the proposed methodology are the ease of interpretation of its results, the high accuracy in the prediction, and the valuable and understandable knowledge available for health teams when making complex decisions in treating chronic patients at risk.
The results show a powerful method to build rules and accurately classify severity. First, it was possible to build a decision tree based on four questions regarding the patient’s health state; these questions are answered from the data collected during the patients’ attention. The tree comprises five leaves and three levels of depth, constituting a simple and interpretable tree. This tree makes possible the classification of new patients, given a list of clinical variables from that person. Physicians and decision makers can analyze the category assigned to a particular patient and understand which rules determine the output given by the prediction model.
Additionally, the tree specifies the key variables that determine the severity groups. These key factors influence the severity level of the patients, giving valuable knowledge to health teams and decision makers to optimize the management of waiting lists, and ultimately improve the life quality of the patients. The simple model is possible after correct preprocessing and dimensionality reduction procedures, detailed in Section 3.
As a side note, the structure of the tree rules will evolve with time. As technology improves and considering environmental conditions, the size of the population, in addition to other complex factors, it is necessary to continually review the method and its components since the variables or elements that may be affecting the severity of patients continually may be altered due to the changing environment.
As a matter of fact, and if this methodology is reproduced and scaled in other health services with excess demand and difficulties in deciding which patient to care for, it is necessary to consider the conditions of infrastructure, medical availability in the specialty, the available resources, and the clinical condition of the patients in each health institution. These additional features might be added to the dataset; however, it goes beyond the scope of the present work.
From another point of view, several authors such as Chudasama et al. [28], Solanki et al. [42] mentioned the risk, consequences, and impact of the COVID-19 pandemic on chronic patients in general. However, unlike those studies, our present investigation offers the possibility for health teams from various specialties to work in a coordinated and collaborative way with this type of patient during a pandemic, favoring decision making and the development of personalized attention adapted to each case.
Regarding the prioritization strategy, when comparing our research with previous studies, it has the advantage of classifying patients using only four variables and five rules, favoring interpretability. For example, in Silva-Aravena et al. [48] and Silva-Aravena and Morales [87], the authors use 20 and 10 dimensions to prioritize patients. These methods are more complex and challenging to interpret by health teams.
It is essential to consider a control mechanism during the process, which could be manual or automated. Although this strategy proposes a ranking of patients, the final judgment of chronic patients with higher priority and risk of complications will be the responsibility of a Clinical Committee or by a computerized medical protocol with expert supervision. We believe that such a system will grant impartial and timely selection, minimizing the natural clinical variability of the process.
When this method is implemented, we recommend evaluating the qualitative differences, requirements, and considerations of resource management to guarantee that the designed management strategy fulfills its fundamental purpose. Although we obtained good results in terms of accuracy, we suggest that the method be evaluated in future studies that use this strategy in other medical units and health services.
6. Conclusions
In this work, we followed the standard structure of CRISP-ML(Q) to develop a hybrid machine learning methodology for classifying high-risk anonymous waiting patients. The method proposes a novel algorithm that measures the dynamic risk of chronic patients under control while waiting for medical care. Furthermore, a characterization scheme based on multiple data science methods, such as principal component analysis (PCA) for dimensionality reduction, the DBSCAN algorithm to group patients, and decision trees for classification and explainability, support decision making.
Our study used a universe of 5507 anonymous cases of controlled patients waiting for medical care in Chile. The methodology proposes using different classification and selection rules to prioritize chronic patients. In addition, our method provides new management and explicability strategies, thus giving better tools to a specialist for making informed decisions based on data.
The resultant model offered by the approach is the ease of interpreting the classification of chronic patients awaiting medical control. The reduction in the dimension of the data allows us to obtain a classification level of 99.96% for new patients. Furthermore, three only has four classification rules based on a three-level tree. The system identifies the variables Operating Room and Recurrence of Critical Events as the most relevant when classifying chronic patients in the different levels of prioritization.
Although our methodology manages to correctly classify patients, we suggested adopting a strategy to solve the problem of borderline patients. One option to address this situation would be to use a fuzzy logic-based approach. Another alternative would be to set an epsilon parameter, a small range centered on the cutoff point, where scores falling within that range are assigned to the next higher category.
To successfully implement the strategy proposed in this study in the different health services, we recommend having the relevant variables in the processes of classification and prioritization of chronic patients and including the active participation of medical specialists and health teams in general.
Author Contributions
Conceptualization, F.S.-A.; data curation, F.S.-A., H.N.D. and C.A.A.; formal analysis, F.S.-A., H.N.D. and C.A.A.; funding acquisition, C.A.A.; investigation, F.S.-A., H.N.D. and C.A.A.; methodology, F.S.-A., H.N.D. and C.A.A.; project administration, F.S.-A. and H.N.D.; supervision, C.A.A.; validation, H.N.D. and C.A.A.; writing—original draft, F.S.-A. and H.N.D.; writing—review and editing, F.S.-A., H.N.D. and C.A.A. All authors have read and agreed to the published version of the manuscript.
Funding
Hugo Nuñez Delafuente received funding support from the Chilean National Agency of Research and Development, ANID, scholarship grant program PFCHA/Doctorado Becas Chile/2021–21211244.
Conflicts of Interest
The authors declare no conflict of interest.
References
- Kimball, A.B.; Resneck, J.S., Jr. The US dermatology workforce: A specialty remains in shortage. J. Am. Acad. Dermatol. 2008, 59, 741–745. [Google Scholar] [CrossRef] [PubMed]
- Burdiles, P.; Pommier, A.O. El triaje en pandemia: Fundamentos éticos para la asignación de recursos de soporte vital avanzado en escenarios de escasez. Rev. Médica Clínica Las Condes 2021, 32, 61–74. [Google Scholar] [CrossRef]
- Zevallos, L.; Pastor, R.; Moscoso, B. Supply and demand of medical specialists in the health facilities of the Ministry of Health: National, regional and by type of specialty gaps. Rev. Peru. Med. Exp. Y Salud Publica 2011, 28, 177–185. [Google Scholar] [CrossRef] [PubMed]
- Malko, A.V.; Huckfeldt, V. Physician shortage in Canada: A review of contributing factors. Glob. J. Health Sci. 2017, 9, 68. [Google Scholar] [CrossRef]
- Pérez-Cuevas, R.; Contreras-Sánchez, S.E.; Doubova, S.V.; García-Saisó, S.; Sarabia-González, O.; Pacheco-Estrello, P.; Arias-Mendoza, A. Gaps between supply and demand of acute myocardial infarction treatment in Mexico. Salud Pública De México 2020, 62, 540–549. [Google Scholar] [CrossRef]
- Bowen, E.; Deskins, J. Supply and Demand of Health Care Professionals in West Virginia; Bureau of Business & Economic Research: Albuquerque, NM, USA, 2021. [Google Scholar]
- Bazyar, M.; Noori Hekmat, S.; Rafiei, S.; Mirzaei, A.; Otaghi, M.; Khorshidi, A.; Mohammadnejad, S.; Tahmasebi, S.; Amarloei, A.; Jalilian, M. Supply-and-demand projections for the health workforce at a provincial level from 2015 to 2025 in Ilam, Iran. Proc. Singap. Healthc. 2021, 30, 18–27. [Google Scholar] [CrossRef]
- Singla, S. Demand and capacity modelling in healthcare using discrete event simulation. Open J. Model. Simul. 2020, 8, 88–107. [Google Scholar] [CrossRef]
- Armocida, B.; Formenti, B.; Ussai, S.; Palestra, F.; Missoni, E. The Italian health system and the COVID-19 challenge. Lancet Public Health 2020, 5, e253. [Google Scholar] [CrossRef]
- Iyengar, K.P.; Vaishya, R.; Bahl, S.; Vaish, A. Impact of the coronavirus pandemic on the supply chain in healthcare. Br. J. Healthc. Manag. 2020, 26, 1–4. [Google Scholar] [CrossRef]
- Haslam, J.; Redman, M. When demand outstrips supply: A Christian view of the ethics of healthcare resource allocation during the COVID-19 pandemic. Christ. J. Glob. Health 2020, 7, 13–19. [Google Scholar] [CrossRef]
- Leite, H.; Lindsay, C.; Kumar, M. COVID-19 outbreak: Implications on healthcare operations. TQM J. 2020, 33, 247–256. [Google Scholar] [CrossRef]
- Prasad, S.; Holla, V.V.; Neeraja, K.; Surisetti, B.K.; Kamble, N.; Yadav, R.; Pal, P.K. Impact of prolonged lockdown due to COVID-19 in patients with Parkinson’s disease. Neurol. India 2020, 68, 792. [Google Scholar] [PubMed]
- Wang, Y.; Duan, Z.; Ma, Z.; Mao, Y.; Li, X.; Wilson, A.; Qin, H.; Ou, J.; Peng, K.; Zhou, F.; et al. Epidemiology of mental health problems among patients with cancer during COVID-19 pandemic. Transl. Psychiatry 2020, 10, 1–10. [Google Scholar] [CrossRef]
- Mele, D.; Flamigni, F.; Rapezzi, C.; Ferrari, R. Myocarditis in COVID-19 patients: Current problems. Intern. Emerg. Med. 2021, 16, 1123–1129. [Google Scholar] [CrossRef] [PubMed]
- Bae, S.J.; Chung, H.S.; Namgung, M.; Choi, Y.H.; Min, J.H.; Lee, D.H. Comparison of the Clinical Process and Outcomes in Patients after Coronavirus Infection 2019 Outbreak. Medicina 2021, 57, 1086. [Google Scholar] [CrossRef] [PubMed]
- Leclerc, Q.J.; Fuller, N.M.; Keogh, R.H.; Diaz-Ordaz, K.; Sekula, R.; Semple, M.G.; Atkins, K.E.; Procter, S.R.; Knight, G.M. Importance of patient bed pathways and length of stay differences in predicting COVID-19 hospital bed occupancy in England. BMC Health Serv. Res. 2021, 21, 1–15. [Google Scholar] [CrossRef] [PubMed]
- Bekker, R.; uit het Broek, M.; Koole, G. Modeling COVID-19 hospital admissions and occupancy in the Netherlands. Eur. J. Oper. Res. 2022, in press. [Google Scholar] [CrossRef]
- Martínez-Sanz, J.; Pérez-Molina, J.A.; Moreno, S.; Zamora, J.; Serrano-Villar, S. Understanding clinical decision-making during the COVID-19 pandemic: A cross-sectional worldwide survey. EClinicalMedicine 2020, 27, 100539. [Google Scholar] [CrossRef]
- Ayad, S.; Shenouda, R.; Henein, M. The impact of COVID-19 on in-hospital outcomes of st-segment elevation myocardial infarction patients. J. Clin. Med. 2021, 10, 278. [Google Scholar] [CrossRef]
- Lohnberg, J.A.; Salcido, L.; Frayne, S.; Mahtani, N.; Bates, C.; Hauser, M.E.; Breland, J.Y. Rapid conversion to virtual obesity care in COVID-19: Impact on patient care, interdisciplinary collaboration, and training. Obes. Sci. Pract. 2022, 8, 131–136. [Google Scholar] [CrossRef]
- Díaz-Bello, S.; Hernández-Hernández, A.; Guinto-Nishimura, G.Y.; Mondragón-Soto, M.G.; Lem-Carrillo, M.; González-Aguilar, A.; Calleja-Castillo, J.M.; Leyva-Rendón, A.; León-Ortiz, P.; Chávez-Piña, C.M.; et al. Reconversion of neurosurgical practice in times of the SARS-CoV-2 pandemic: A narrative review of the literature and guideline implementation in a Mexican neurosurgical referral center. Neurosurg. Focus 2020, 49, E4. [Google Scholar] [CrossRef] [PubMed]
- Morales-Contreras, M.F.; Leporati, M.; Fratocchi, L. The impact of COVID-19 on supply decision-makers: The case of personal protective equipment in Spanish hospitals. BMC Health Serv. Res. 2021, 21, 1–15. [Google Scholar] [CrossRef] [PubMed]
- Zimmermann, M.; Nkenke, E. Approaches to the management of patients in oral and maxillofacial surgery during COVID-19 pandemic. J. Cranio-Maxillofac. Surg. 2020, 48, 521–526. [Google Scholar] [CrossRef] [PubMed]
- Katulanda, P.; Dissanayake, H.A.; Ranathunga, I.; Ratnasamy, V.; Wijewickrama, P.S.; Yogendranathan, N.; Gamage, K.K.; de Silva, N.L.; Sumanatilleke, M.; Somasundaram, N.P.; et al. Prevention and management of COVID-19 among patients with diabetes: An appraisal of the literature. Diabetologia 2020, 63, 1440–1452. [Google Scholar] [CrossRef] [PubMed]
- Pang, Y.; Liu, Y.; Du, J.; Gao, J.; Li, L. Impact of COVID-19 on tuberculosis control in China. Int. J. Tuberc. Lung Dis. 2020, 24, 545–547. [Google Scholar] [CrossRef]
- Olloquequi, J. COVID-19 Susceptibility in chronic obstructive pulmonary disease. Eur. J. Clin. Investig. 2020, 50, e13382. [Google Scholar] [CrossRef]
- Chudasama, Y.V.; Gillies, C.L.; Zaccardi, F.; Coles, B.; Davies, M.J.; Seidu, S.; Khunti, K. Impact of COVID-19 on routine care for chronic diseases: A global survey of views from healthcare professionals. Diabetes Metab. Syndr. Clin. Res. Rev. 2020, 14, 965–967. [Google Scholar] [CrossRef]
- Astudillo, C.; González-Martínez, L.; Zapata-González, E. Predicting air quality using deep learning in Talca City, Chile. In Proceedings of the 10th International Conference on Pattern Recognition Systems (ICPRS-2019), Institution of Engineering and Technology, Tours, France, 8–10 July 2019; Volume CP761. pp. 5 (24–29). [Google Scholar] [CrossRef]
- Cataldo, A.; Astudillo, C.A.; Gutiérrez-Bahamondes, J.H.; González-Martínez, L.; McQueen, R. Towards an Integrated Maturity Model of System and E-Business Applications in an Emerging Economy. J. Theor. Appl. Electron. Commer. Res. 2020, 15, 2. [Google Scholar] [CrossRef]
- Garriga, M.; Romero-Bravo, S.; Estrada, F.; Escobar, A.; Matus, I.; del Pozo, A.; Astudillo, C.; Lobos, G. Assessing wheat traits by spectral reflectance: Do we really need to focus on predicted trait-values or directly identify the elite genotypes group? Front. Plant Sci. 2017, 8, 280. [Google Scholar] [CrossRef] [Green Version]
- Uddin, M.Z.; Soylu, A. Human activity recognition using wearable sensors, discriminant analysis, and long short-term memory-based neural structured learning. Sci. Rep. 2021, 11, 16455. [Google Scholar] [CrossRef]
- Islam, M.N.; Mustafina, S.N.; Mahmud, T.; Khan, N.I. Machine learning to predict pregnancy outcomes: A systematic review, synthesizing framework and future research agenda. BMC Pregnancy Childbirth 2022, 22, 348. [Google Scholar] [CrossRef] [PubMed]
- Sahlol, A.T.; Kollmannsberger, P.; Ewees, A.A. Efficient Classification of White Blood Cell Leukemia with Improved Swarm Optimization of Deep Features. Sci. Rep. 2020, 10, 2536. [Google Scholar] [CrossRef] [PubMed]
- Ribeiro, M.T.; Singh, S.; Guestrin, C. “Why Should I Trust You?”. In Proceedings of the 22nd ACM SIGKDD International Conference on Knowledge Discovery and Data Mining - KDD ’16, San Francisco, CA, USA, 13–17 August 2016; ACM Press: New York, NY, USA, 2016; pp. 1135–1144. [Google Scholar] [CrossRef]
- Huber, B. The Cost Cure? Assessing Clinical Quality Responses to Maryland’s Global Budget Model. Ph.D Thesis, Georgetown University, Washington, DC, USA, 2019. [Google Scholar]
- Valente, R.; Testi, A.; Tanfani, E.; Fato, M.; Porro, I.; Santo, M.; Santori, G.; Torre, G.; Ansaldo, G. A model to prioritize access to elective surgery on the basis of clinical urgency and waiting time. BMC Health Serv. Res. 2009, 9, 1–15. [Google Scholar] [CrossRef] [PubMed]
- Rathnayake, D.; Clarke, M.; Jayasinghe, V.I. Health system performance and health system preparedness for the post-pandemic impact of COVID-19: A review. Int. J. Healthc. Manag. 2021, 14, 250–254. [Google Scholar] [CrossRef]
- Grossman, M. The Demand for Health; Columbia University Press: New York, NY, USA, 2017. [Google Scholar]
- Alcalde-Rabanal, J.E.; Nigenda, G.; Bärnighausen, T.; Velasco-Mondragón, H.E.; Darney, B.G. The gap in human resources to deliver the guaranteed package of prevention and health promotion services at urban and rural primary care facilities in Mexico. Hum. Resour. Health 2017, 15, 1–11. [Google Scholar] [CrossRef] [PubMed]
- Braithwaite, V.; Nolan, S. Hospital-based addiction medicine healthcare providers: High demand, short supply. J. Addict. Med. 2019, 13, 251. [Google Scholar] [CrossRef] [PubMed]
- Solanki, G.; Wilkinson, T.; Daviaud, E.; Besada, D.; Tamandjou Tchuem, C.; Docrat, S.; Cleary, S. Managing the healthcare demand-supply gap during and after COVID-19: The need to review the approach to healthcare priority-setting in South Africa. SAMJ S. Afr. Med. J. 2021, 111, 20–22. [Google Scholar] [CrossRef]
- Verma, V.R.; Saini, A.; Gandhi, S.; Dash, U.; Koya, M.S.F. Projecting Demand-Supply Gap of Hospital Capacity in India in the face of COVID-19 pandemic using Age-Structured deterministic SEIR model. medRxiv 2020. [Google Scholar] [CrossRef]
- Bowers, J. Waiting list behaviour and the consequences for NHS targets. J. Oper. Res. Soc. 2010, 61, 246–254. [Google Scholar] [CrossRef]
- Sutherland, J.M.; Crump, R.T.; Chan, A.; Liu, G.; Yue, E.; Bair, M. Health of patients on the waiting list: Opportunity to improve health in Canada? Health Policy 2016, 120, 749–757. [Google Scholar] [CrossRef]
- Clement, N.D.; Scott, C.E.; Murray, J.R.; Howie, C.R.; Deehan, D.J.; Collaboration, I.R. The number of patients “worse than death” while waiting for a hip or knee arthroplasty has nearly doubled during the COVID-19 pandemic: A UK nationwide survey. Bone Jt. J. 2021, 103, 672–680. [Google Scholar] [CrossRef] [PubMed]
- Boivin, A.; L’Espérance, A.; Gauvin, F.P.; Dumez, V.; Macaulay, A.C.; Lehoux, P.; Abelson, J. Patient and public engagement in research and health system decision making: A systematic review of evaluation tools. Health Expect. 2018, 21, 1075–1084. [Google Scholar] [CrossRef] [PubMed]
- Silva-Aravena, F.; Álvarez-Miranda, E.; Astudillo, C.A.; González-Martínez, L.; Ledezma, J.G. Patients’ Prioritization on Surgical Waiting Lists: A Decision Support System. Mathematics 2021, 9, 1097. [Google Scholar] [CrossRef]
- Harper, P.R.; Gamlin, H. Reduced outpatient waiting times with improved appointment scheduling: A simulation modelling approach. Spectrum 2003, 25, 207–222. [Google Scholar] [CrossRef]
- Ritschl, P.V.; Wiering, L.; Dziodzio, T.; Jara, M.; Kruppa, J.; Schoeneberg, U.; Raschzok, N.; Butz, F.; Globke, B.; Seika, P.; et al. The Effects of MELD-Based Liver Allocation on Patient Survival and Waiting List Mortality in a country with a low donation rate. J. Clin. Med. 2020, 9, 1929. [Google Scholar] [CrossRef]
- Acuna, J.A.; Zayas-Castro, J.L.; Feijoo, F.; Sankaranarayanan, S.; Martinez, R.; Martinez, D.A. The Waiting Game–How Cooperation Between Public and Private Hospitals Can Help Reduce Waiting Lists. Health Care Manag. Sci. 2022, 25, 100–125. [Google Scholar] [CrossRef]
- Pokorny, M.A.; Wilson, W.J.; Thorne, P.R.; Whitfield, B.C. Is an advanced audiology-led service the solution to the paediatric ENT outpatient waiting list problem? Speech Lang. Hear. 2019, 22, 137–141. [Google Scholar] [CrossRef]
- Taherkhani, N.; Sepehri, M.M.; Khasha, R.; Shafaghi, S. Ranking patients on the kidney transplant waiting list based on fuzzy inference system. BMC Nephrol. 2022, 23, 1–14. [Google Scholar] [CrossRef]
- Déry, J.; Ruiz, A.; Routhier, F.; Gagnon, M.P.; Côté, A.; Ait-Kadi, D.; Bélanger, V.; Deslauriers, S.; Lamontagne, M.E. Patient prioritization tools and their effectiveness in non-emergency healthcare services: A systematic review protocol. Syst. Rev. 2019, 8, 1–7. [Google Scholar] [CrossRef]
- Vijeratnam, S.S.; Candy, B.; Craig, R.; Marshall, A.; Stone, P.; Low, J.T. Palliative care for patients with end-stage liver disease on the liver transplant waiting list: An international systematic review. Dig. Dis. Sci. 2021, 66, 4072–4089. [Google Scholar] [CrossRef]
- Rathnayake, D.; Clarke, M. The effectiveness of different patient referral systems to shorten waiting times for elective surgeries: Systematic review. BMC Health Serv. Res. 2021, 21, 1–13. [Google Scholar] [CrossRef] [PubMed]
- Fields, E.B.; Okudan, G.E.; Ashour, O.M. Rank aggregation methods comparison: A case for triage prioritization. Expert Syst. Appl. 2013, 40, 1305–1311. [Google Scholar] [CrossRef]
- Riff, M.C.; Cares, J.P.; Neveu, B. RASON: A new approach to the scheduling radiotherapy problem that considers the current waiting times. Expert Syst. Appl. 2016, 64, 287–295. [Google Scholar] [CrossRef]
- Breton, M.; Smithman, M.A.; Kreindler, S.A.; Jbilou, J.; Wong, S.T.; Marshall, E.G.; Sasseville, M.; Sutherland, J.M.; Crooks, V.A.; Shaw, J.; et al. Designing centralized waiting lists for attachment to a primary care provider: Considerations from a logic analysis. Eval. Program Plan. 2021, 89, 101962. [Google Scholar] [CrossRef]
- Guo, M.Y.; Crump, R.T.; Karimuddin, A.A.; Liu, G.; Bair, M.J.; Sutherland, J.M. Prioritization and surgical wait lists: A cross-sectional survey of patient’s health-related quality of life. Health Policy 2022, 126, 99–105. [Google Scholar] [CrossRef]
- Gutacker, N.; Siciliani, L.; Cookson, R. Waiting time prioritisation: Evidence from England. Soc. Sci. Med. 2016, 159, 140–151. [Google Scholar] [CrossRef]
- Azizi, M.J.; Vayanos, P.; Wilder, B.; Rice, E.; Tambe, M. Designing fair, efficient, and interpretable policies for prioritizing homeless youth for housing resources. In International Conference on the Integration of Constraint Programming, Artificial Intelligence, and Operations Research; Springer: Berlin/Heidelberg, Germany, 2018; pp. 35–51. [Google Scholar]
- Dorado-Díaz, P.I.; Sampedro-Gómez, J.; Vicente-Palacios, V.; Sánchez, P.L. Applications of artificial intelligence in cardiology. The future is already here. Rev. Espa Nola De Cardiol. Engl. Ed. 2019, 72, 1065–1075. [Google Scholar] [CrossRef]
- Jegatheeswaran, L.; Tolley, N. 120 Artificial Intelligence (AI) Risk-Based Stratification for Surgical Waiting List Prioritisation: A Pilot Study Addressing the NHS Growing Waiting Times. Br. J. Surg. 2022, 109, znac040-012. [Google Scholar] [CrossRef]
- Yates, M.T.; Balmforth, D.; Kirmani, B.H.; Acharya, M.; Jeganathan, R.; Ngaage, D.; Kanani, M.; Deglurkar, I.; Lopez-Marco, A.; Sanders, J.; et al. A multi-centre prospective cohort study of patients on the elective waiting list for cardiac surgery during the COVID-19 pandemic. J. R. Soc. Med. 2022, 1–6. [Google Scholar] [CrossRef]
- Stuart, M.; Mooney, C.; Hrabovsky, M.; Silvestri, G.; Stewart, S. Surgical planning during a pandemic: Identifying patients at high risk of severe disease or death due to COVID-19 in a cohort of patients on a cataract surgery waiting list. Ulst. Med J. 2022, 91, 19. [Google Scholar]
- Petwal, H.; Rani, R. Prioritizing the Surgical Waiting List-Cosine Consistency Index: An Optimized Framework for Prioritizing Surgical Waiting List. J. Med. Imaging Health Informatics 2020, 10, 2876–2892. [Google Scholar] [CrossRef]
- de Almeida, J.R.; Noel, C.W.; Forner, D.; Zhang, H.; Nichols, A.C.; Cohen, M.A.; Wong, R.J.; McMullen, C.; Graboyes, E.M.; Divi, V.; et al. Development and validation of a Surgical Prioritization and Ranking Tool and Navigation Aid for Head and Neck Cancer (SPARTAN-HN) in a scarce resource setting: Response to the COVID-19 pandemic. Cancer 2020, 126, 4895–4904. [Google Scholar] [CrossRef] [PubMed]
- Valente, R.; Di Domenico, S.; Mascherini, M.; Santori, G.; Papadia, F.; Orengo, G.; Gratarola, A.; Cafiero, F.; De Cian, F.; Collaborators. A new model to prioritize waiting lists for elective surgery under the COVID-19 pandemic pressure. Br. J. Surg. 2021, 108, e12–e14. [Google Scholar] [CrossRef] [PubMed]
- Pietrzak, J.R.T.; Maharaj, Z.; Erasmus, M.; Sikhauli, N.; Cakic, J.N.; Mokete, L. Pain and function deteriorate in patients awaiting total joint arthroplasty that has been postponed due to the COVID-19 pandemic. World J. Orthop. 2021, 12, 152. [Google Scholar] [CrossRef] [PubMed]
- Casal-Guisande, M.; Comesaña-Campos, A.; Cerqueiro-Pequeño, J.; Bouza-Rodríguez, J.B. Design and Definition of a New Decision Support System Aimed to the Hierarchization of Patients Candidate to Be Admitted to Intensive Care Units. Healthcare 2022, 10, 587. [Google Scholar] [CrossRef] [PubMed]
- Sapiertein Silva, J.F.; Ferreira, G.F.; Perosa, M.; Nga, H.S.; de Andrade, L.G.M. A machine learning prediction model for waiting time to kidney transplant. PLoS ONE 2021, 16, e0252069. [Google Scholar] [CrossRef]
- Kawakita, S.; Ranasinghe, O.; Wood, E.; Beaumont, J. Personalized Prognostication of Kidney Transplant Candidates on the Waiting List: A Machine Learning Approach; 2020.
- Ahmad, M.A.; Eckert, C.; Teredesai, A. Interpretable machine learning in healthcare. In Proceedings of the 2018 ACM International Conference on Bioinformatics, Computational Biology, and Health Informatics, Washington, DC, USA, 29 August–1 September 2018; pp. 559–560. [Google Scholar]
- Antoniadi, A.M.; Du, Y.; Guendouz, Y.; Wei, L.; Mazo, C.; Becker, B.A.; Mooney, C. Current challenges and future opportunities for XAI in machine learning-based clinical decision support systems: A systematic review. Appl. Sci. 2021, 11, 5088. [Google Scholar] [CrossRef]
- Manresa-Yee, C.; Roig-Maimó, M.F.; Ramis, S.; Mas-Sansó, R. Advances in XAI: Explanation Interfaces in Healthcare. In Handbook of Artificial Intelligence in Healthcare; Springer: Berlin/Heidelberg, Germany, 2022; pp. 357–369. [Google Scholar]
- Panigutti, C.; Perotti, A.; Pedreschi, D. Doctor XAI: An ontology-based approach to black-box sequential data classification explanations. In Proceedings of the 2020 Conference on Fairness, Accountability, and Transparency, Barcelona, Spain, 27–30 January 2020; pp. 629–639. [Google Scholar]
- Zainab, R. Depression Detection and Explanation with Machine Learning. Ph.D Thesis, Stevens Institute of Technology, Hoboken, NJ, USA, 2020. [Google Scholar]
- Kavya, R.; Christopher, J.; Panda, S.; Lazarus, Y.B. Machine Learning and XAI approaches for Allergy Diagnosis. Biomed. Signal Process. Control 2021, 69, 102681. [Google Scholar] [CrossRef]
- Biswas, M.; Kaiser, M.S.; Mahmud, M.; Al Mamun, S.; Hossain, M.; Rahman, M.A. An XAI Based Autism Detection: The Context Behind the Detection. In International Conference on Brain Informatics; Springer: Berlin/Heidelberg, Germany, 2021; pp. 448–459. [Google Scholar]
- Xu, M.; Wong, T.C.; Chin, K.S. A medical procedure-based patient grouping method for an emergency department. Appl. Soft Comput. 2014, 14, 31–37. [Google Scholar] [CrossRef]
- Resta, M.; Sonnessa, M.; Tànfani, E.; Testi, A. Unsupervised neural networks for clustering emergent patient flows. Oper. Res. Health Care 2018, 18, 41–51. [Google Scholar] [CrossRef]
- Kalid, N.; Zaidan, A.; Zaidan, B.; Salman, O.H.; Hashim, M.; Albahri, O.S.; Albahri, A.S. Based on real time remote health monitoring systems: A new approach for prioritization “large scales data” patients with chronic heart diseases using body sensors and communication technology. J. Med Syst. 2018, 42, 1–37. [Google Scholar] [CrossRef]
- Salman, O.H.; Zaidan, A.; Zaidan, B.; Naserkalid, F.; Hashim, M. Novel methodology for triage and prioritizing using “big data” patients with chronic heart diseases through telemedicine environmental. Int. J. Inf. Technol. Decis. Mak. 2017, 16, 1211–1245. [Google Scholar] [CrossRef]
- Martinez, D.A.; Zhang, H.; Bastias, M.; Feijoo, F.; Hinson, J.; Martinez, R.; Dunstan, J.; Levin, S.; Prieto, D. Prolonged wait time is associated with increased mortality for Chilean waiting list patients with non-prioritized conditions. BMC Public Health 2019, 19, 1–11. [Google Scholar] [CrossRef] [PubMed]
- Silva-Aravena, F.; Álvarez-Miranda, E.; Astudillo, C.A.; González-Martínez, L.; Ledezma, J.G. On the data to know the prioritization and vulnerability of patients on surgical waiting lists. Data Brief 2020, 29, 105310. [Google Scholar] [CrossRef] [PubMed]
- Silva-Aravena, F.; Morales, J. Dynamic Surgical Waiting List Methodology: A Networking Approach. Mathematics 2022, 10, 2307. [Google Scholar] [CrossRef]
- Kolyshkina, I.; Simoff, S. Interpretability of machine learning solutions in public healthcare: The CRISP-ML approach. Front. Big Data 2021, 4, 660206. [Google Scholar] [CrossRef] [PubMed]
- Studer, S.; Bui, T.B.; Drescher, C.; Hanuschkin, A.; Winkler, L.; Peters, S.; Müller, K.R. Towards CRISP-ML (Q): A machine learning process model with quality assurance methodology. Mach. Learn. Knowl. Extr. 2021, 3, 392–413. [Google Scholar] [CrossRef]
- Loquasto, F.; Seborg, D. Model Predictive Controller Monitoring Based on Pattern Classification and PCA. In Proceedings of the 2003 American Control Conference, Denver, CO, USA, 4–6 June 2003; Volume 3, pp. 1968–1973. [Google Scholar] [CrossRef]
- Razmkhah, H.; Abrishamchi, A.; Torkian, A. Evaluation of Spatial and Temporal Variation in Water Quality by Pattern Recognition Techniques: A Case Study on Jajrood River (Tehran, Iran). J. Environ. Manag. 2010, 91, 852–860. [Google Scholar] [CrossRef]
- Artoni, F.; Delorme, A.; Makeig, S. Applying Dimension Reduction to EEG Data by Principal Component Analysis Reduces the Quality of Its Subsequent Independent Component Decomposition. NeuroImage 2018, 175, 176–187. [Google Scholar] [CrossRef]
- Schubert, E.; Sander, J.; Ester, M.; Kriegel, H.P.; Xu, X. DBSCAN revisited, revisited: Why and how you should (still) use DBSCAN. ACM Trans. Database Syst. TODS 2017, 42, 1–21. [Google Scholar] [CrossRef]
- Ester, M.; Kriegel, H.P.; Sander, J.; Xu, X. A density-based algorithm for discovering clusters in large spatial databases with noise. In KDD; Institute for ComputerScience, University of Munich: Munich, Germany, 1996; Volume 96, pp. 226–231. [Google Scholar]
Figure 1.
Representation of the CRISP-ML(Q) model of this research.

Figure 2.
Visualization of cumulative variance.

Figure 3.
Visualization of the explained variance of each component.

Figure 4.
Visualization of the classification of patients according to the first two principal components. The colors represent the three levels of severity identified by DBSCAN.
Figure 4.
Visualization of the classification of patients according to the first two principal components. The colors represent the three levels of severity identified by DBSCAN.

Figure 5.
A two-dimensional PCA visualization of the five groups of patients identified by DBSCAN. Colors indicate the group of each patient.
Figure 5.
A two-dimensional PCA visualization of the five groups of patients identified by DBSCAN. Colors indicate the group of each patient.

Figure 6.
Graphical representation of the resulting classification tree. The tree has three levels of depth and five decision rules and determines different levels of severity.
Figure 6.
Graphical representation of the resulting classification tree. The tree has three levels of depth and five decision rules and determines different levels of severity.


Table 1.
Primary diagnosis associated with heart disease in the chronic patients.
| Primary Diagnosis | Cases | % |
|---|---|---|
| Fibrillation | 1563 | 28.4 |
| Heart failure | 969 | 17.6 |
| Hypertension | 821 | 14.9 |
| Cardiomyopathy | 209 | 3.8 |
| Heart attack | 182 | 3.3 |
| Angioplasty | 149 | 2.7 |
| Angina | 88 | 1.6 |
| Arrhythmia | 55 | 1.0 |
| Stenosis | 50 | 0.9 |
| Other diagnoses | 1421 | 25.8 |
Table 2.
The clinical team defines critical and clinical categorical variables to characterize chronic patients under control. (*) the patient with critical events in the last 30 days. (**) variables leveled with one-hot encoding.
Table 2.
The clinical team defines critical and clinical categorical variables to characterize chronic patients under control. (*) the patient with critical events in the last 30 days. (**) variables leveled with one-hot encoding.
| ID | Variable Name | Type of Variable | Values | Weights | In Dataset |
|---|---|---|---|---|---|
| Urg | Urgency (*) | Critical | {no presence, presence} | 0.276 | {0, 1} |
| Or | Operating room (*) | Critical | {no presence, presence} | 0.268 | {0, 1} |
| Hosp | Hospitalization (*) | Critical | {no presence, presence} | 0.262 | {0, 1} |
| Pre | Prescription status (*) | Critical | {no presence, presence} | 0.194 | {0, 1} |
| Recu | Recurrence of critical events (**) | Critical | {0, 1, 2, 3, +3} | 1.000 | {0, 1, 2, 3, 4} |
| Per | Percutaneous revascularization | Clinical | {no indication, indication} | 0.124 | {0, 1} |
| Dys | Dyspnea (**) | Clinical | {no presence, hold, increase} | 0.121 | {0, 1, 2} |
| Fai | Fainting | Clinical | {no presence, presence} | 0.119 | {0, 1} |
| Ang | Angina (**) | Clinical | {no presence, hold, increase} | 0.113 | {0, 1, 2} |
| LVEF | Reduced LVEF | Clinical | {LVEF ≥ 40%, LVEF < 40%} | 0.111 | {0, 1} |
| Rev | Revascularization surgery | Clinical | {no presence, presence} | 0.093 | {0, 1} |
| Hig | High-energy electrical devices | Clinical | {without an implant, with an implant} | 0.085 | {0, 1} |
| Con | Control term expiration | Clinical | {no, yes} | 0.082 | {0, 1} |
| Ede | Edema | Clinical | {no presence, presence} | 0.077 | {0, 1} |
| Hea | Heart valve prosthesis | Clinical | {no presence, presence} | 0.076 | {0, 1} |
Table 3.
Five random data rows showing the characterization of anonymous chronic patients.
| Urg | Or | Hosp | Pre | Recu | Per | Dys | Fai | Ang | Lvef | Rev | Hig | Con | Ede | Hea | Pf | Sever |
|---|---|---|---|---|---|---|---|---|---|---|---|---|---|---|---|---|
| 1 | 1 | 1 | 1 | 3 | 1 | 1 | 1 | 2 | 1 | 0 | 1 | 0 | 1 | 1 | 1.7 | 2 |
| 0 | 1 | 0 | 1 | 1 | 1 | 2 | 1 | 2 | 1 | 0 | 1 | 1 | 1 | 1 | 1.4 | 2 |
| 1 | 1 | 1 | 1 | 3 | 1 | 1 | 0 | 0 | 1 | 0 | 0 | 0 | 0 | 0 | 1.4 | 2 |
| 0 | 1 | 1 | 1 | 2 | 1 | 1 | 1 | 1 | 1 | 1 | 1 | 0 | 0 | 1 | 1.0 | 1 |
| 0 | 0 | 1 | 1 | 1 | 1 | 1 | 1 | 1 | 1 | 1 | 1 | 0 | 0 | 1 | 0.8 | 1 |
Table 4.
Groups of patients according to DBSCAN.
| Cluster | Elements | Median Pf |
|---|---|---|
| 0 | 5572 | 0.45793 |
| 1 | 125 | 0.61129 |
| 2 | 50 | 0.95010 |
| 3 | 39 | 0.98129 |
| 4 | 8 | 1.10618 |
Table 5.
Confusion matrix of test data.
| Predicted | ||||||
|---|---|---|---|---|---|---|
| 0 | 1 | 2 | 3 | 4 | ||
| True | 0 | 2212 | 0 | 0 | 0 | 0 |
| 1 | 0 | 61 | 1 | 0 | 0 | |
| 2 | 0 | 0 | 19 | 0 | 0 | |
| 3 | 0 | 0 | 0 | 21 | 0 | |
| 4 | 0 | 0 | 0 | 0 | 4 | |
Publisher’s Note: MDPI stays neutral with regard to jurisdictional claims in published maps and institutional affiliations. |
© 2022 by the authors. Licensee MDPI, Basel, Switzerland. This article is an open access article distributed under the terms and conditions of the Creative Commons Attribution (CC BY) license (https://creativecommons.org/licenses/by/4.0/).
Share and Cite
MDPI and ACS Style
Silva-Aravena, F.; Delafuente, H.N.; Astudillo, C.A. A Novel Strategy to Classify Chronic Patients at Risk: A Hybrid Machine Learning Approach. Mathematics 2022, 10, 3053. https://doi.org/10.3390/math10173053
AMA Style
Silva-Aravena F, Delafuente HN, Astudillo CA. A Novel Strategy to Classify Chronic Patients at Risk: A Hybrid Machine Learning Approach. Mathematics. 2022; 10(17):3053. https://doi.org/10.3390/math10173053
Chicago/Turabian StyleSilva-Aravena, Fabián, Hugo Núñez Delafuente, and César A. Astudillo. 2022. "A Novel Strategy to Classify Chronic Patients at Risk: A Hybrid Machine Learning Approach" Mathematics 10, no. 17: 3053. https://doi.org/10.3390/math10173053
Note that from the first issue of 2016, this journal uses article numbers instead of page numbers. See further details here.