
Prediction Method of Human Fatigue in an Artificial Atmospheric Environment Based on Dynamic Bayesian Network

1
School of Aeronautic Science and Engineering, Beihang University, Beijing 100191, China
2
Marine Human Factors Engineering Lab, China Institute of Marine Technology & Economy, Beijing 100081, China
3
School of Information Science and Technology, North China University of Technology, Beijing 100144, China
*
Author to whom correspondence should be addressed.
Mathematics 2022, 10(15), 2778; https://doi.org/10.3390/math10152778
Submission received: 29 June 2022
/
Revised: 23 July 2022
/
Accepted: 3 August 2022
/
Published: 5 August 2022
(This article belongs to the Special Issue Advances in Artificial Intelligence: Data, Methods and Interdisciplinary Applications)
Abstract
:Fatigue state usually leads to slow reaction of the human body and its thoughts. It is an important factor causing significant decline in the working ability of workers, an increase in error rate and even major accidents. It would have a more negative impact in an artificial atmospheric environment. The effective prediction of fatigue can contribute to improved working efficiency and reduce the occurrence of accidents. In this paper, a prediction method of human fatigue in an artificial atmospheric environment was established, combining as many as eight input parameters about the cause and effect of human fatigue based on a dynamic Bayesian network in order to achieve a relatively comprehensive and accurate prediction of human fatigue. This fatigue prediction method was checked by experimental results. The results indicate that the established prediction method could provide a relatively reliable way to predict a worker fatigue state in an artificial atmospheric working environment.
1. Introduction
Fatigue is a sensation of lack of physical strength and poor spirit. Once a person is tired, the body and mind will become dull. Fatigue can also be summarized as an extremely complex physiological and psychological state of the human body from the perspective of work or labor, which means that a significant decline occurs in the person’s working ability, and they are unable or unwilling to continue working. Fatigue usually manifests in the imbalance of human physiological and psychological functions, a decline in human working ability, an increase in error rate and so on. In some developing countries, the number of people suffering from fatigue is increasing year by year due to high work intensity. The main reason is the fatigue state caused by long-term overwork, mental tension, improper rest and so on [1,2,3]. Fatigue state in work conditions is usually an important reason for accidents. According to statistics, 20% of traffic accidents in China result from fatigue driving [4]. On the other hand, it may be difficult for people to recognize that they are in a fatigue state. Even if they do, they do not pay much attention to the impact of fatigue. According to a survey in Canada, 58% of drivers admit that they continue to drive when they feel tired or sleepy [5]. An effective prediction of fatigue state can assist in improving work efficiency and can reduce accidents.
The commonly used human fatigue prediction methods mainly judge whether the worker is in fatigue state by performing real-time target characteristic detection, then processing and calculating the detected data. According to different target characteristics, human fatigue state prediction methods can be classified by methods based on worker physiological characteristic parameters, methods based on worker behavior and facial features and methods based on multi-feature fusion and so on.
Generally, the fatigue state of workers can be recognized through several physiological characteristics [6,7,8,9,10]. The fatigue prediction method based on physiological characteristics is performed through the detection of physiological characteristics, including electroencephalogram (EEG), electrocardiogram (ECG) and electromyography (EMG), and the feature extraction and analysis of the signals. The recognition of worker fatigue is based on the analysis and comparison between the detected data and data in a non-fatigue state. Luo et al. [11] presented an adaptive multi-scale entropy feature extraction fatigue driving a prediction algorithm based on an adaptive scaling-factor acquisition algorithm and entropy-feature-extraction algorithm using collected forehead EEG data of car drivers. They verified the effectiveness of the algorithm through experiments. Markus et al. [12] completed the fatigue prediction using a low-cost ECG sensor for worker heart rate variability calculation. Wang et al. [13] performed fatigue recognition through collecting worker EMG of biceps femoris and selecting the EMG peak factor as the feature for fatigue recognition. They stimulated the hand abductor muscle and thumb flexor muscle of workers in order to reduce fatigue.
Fatigue prediction methods based on human behavior and facial features mainly conduct fatigue judgment according to key information on human behavior and facial features acquired by computer vision recognition, including head location, blink frequency and mouth movement, and the processing of this information. Based on the characteristic that the opening range of eyes becomes smaller and the blinking frequency becomes lower during fatigue, Xu et al. [14] proposed a method to detect the fatigue degree of drivers by tracking their eye movements. Poursadeghiyan et al. [15] suggested a fatigue state prediction method that detects facial expression and eye position through the Viola–Jones algorithm. Then, they collected the characteristics, including the driver’s blink duration and frequency, through eye tracking technology. He et al. [16] developed and verified a sensor-based sleepiness detection system. Their system used the sensor to collect the driver’s blink frequency, and judged whether the driver was in fatigue through analysis and processing of the collected data. According to the changes in human mouth characteristics in fatigue state, Knapik et al. [17] presented a fatigue driving detection method based on thermal imaging technology. This method detected the driver’s fatigue state according to yawning recognized by a yawning thermal model. Its main advantage was that it would not interfere with the driver’s work.
Considering that there are great limitations in the prediction of fatigue state according to single-feature information, and reliability and accuracy, detection methods based on multi-feature information fusion were proposed in recent years. Currently, fatigue detection methods based on multi-feature information fusion mainly focused on physiological multi-feature information fusion, worker behavior and face multi-feature information fusion, and different types of multi-feature information fusion. Fu et al. [18] proposed a dynamic fatigue prediction model based on a Hidden Markov Model in which a variety of physiological signals were involved. In this model, the fatigue state was predicted through the calculation of collected EEG, ECG and respiration signals. Hong et al. [19] suggested a fatigue prediction method via EEG measurement in the ear canal, combining conventional photoplethysmography (PPG) and ECG. Ma et al. [20] constructed a worker fatigue prediction system based on multiple characteristics. The system performed fatigue prediction through the acquisition and analysis of eye movement, ECG, EMG and grip force.
At present, researchers are also interested in performing human state prediction through the neural network method. For example, Pimenta et al. [21] constructed a fatigue prediction method through neural network. In this method, fatigue prediction is conducted by collecting the data related to the individual’s interaction with the computer. This research provided a non-invasive system for the continuous mental fatigue classification, which can support effective and efficient fatigue management initiatives, especially in the desk working situation. Champa et al. [22] established a human behavior prediction model based on an artificial neural network through handwriting analysis. In this model, personal traits could be predicted automatically by analyzing an individual’s handwriting with the aid of a computer without human intervention.
Recently, some studies were carried out to develop fatigue prediction methods based on a Bayesian network. Actually, a Bayesian network is a pattern inference model that can directly reflect the interdependence and causal transformation relationship between variable nodes and effectively combine graph theory and probability theory. It can reveal the complex reasoning problem of joint probability distribution among system variables into a series of relatively independent causal reasoning modules to reduce the computational complexity.
Based on a dynamic Bayesian network, this paper constructs a prediction method of human fatigue from the cause and effect of human fatigue, combining several factors including physiological characteristics, psychological characteristics, working performance and working environment. The innovation of this method consists of the following aspect. This method is constructed based on the cause and effect of human fatigue, and consists of as many as eight input parameters, including human body condition parameters and working condition parameters. The fact that many input parameters are involved make it possible to achieve a relatively comprehensive and accurate prediction. In order to verify the accuracy of this prediction method, experiments are performed by recruiting volunteers to participate in an artificial atmospheric environment for a couple of days, and the results indicate that this prediction model is able to make a relatively accurate prediction of human fatigue during long-time work.
2. Materials and Methods
2.1. Principle of Human Fatigue Prediction during Work in an Artificial Atmospheric Environment
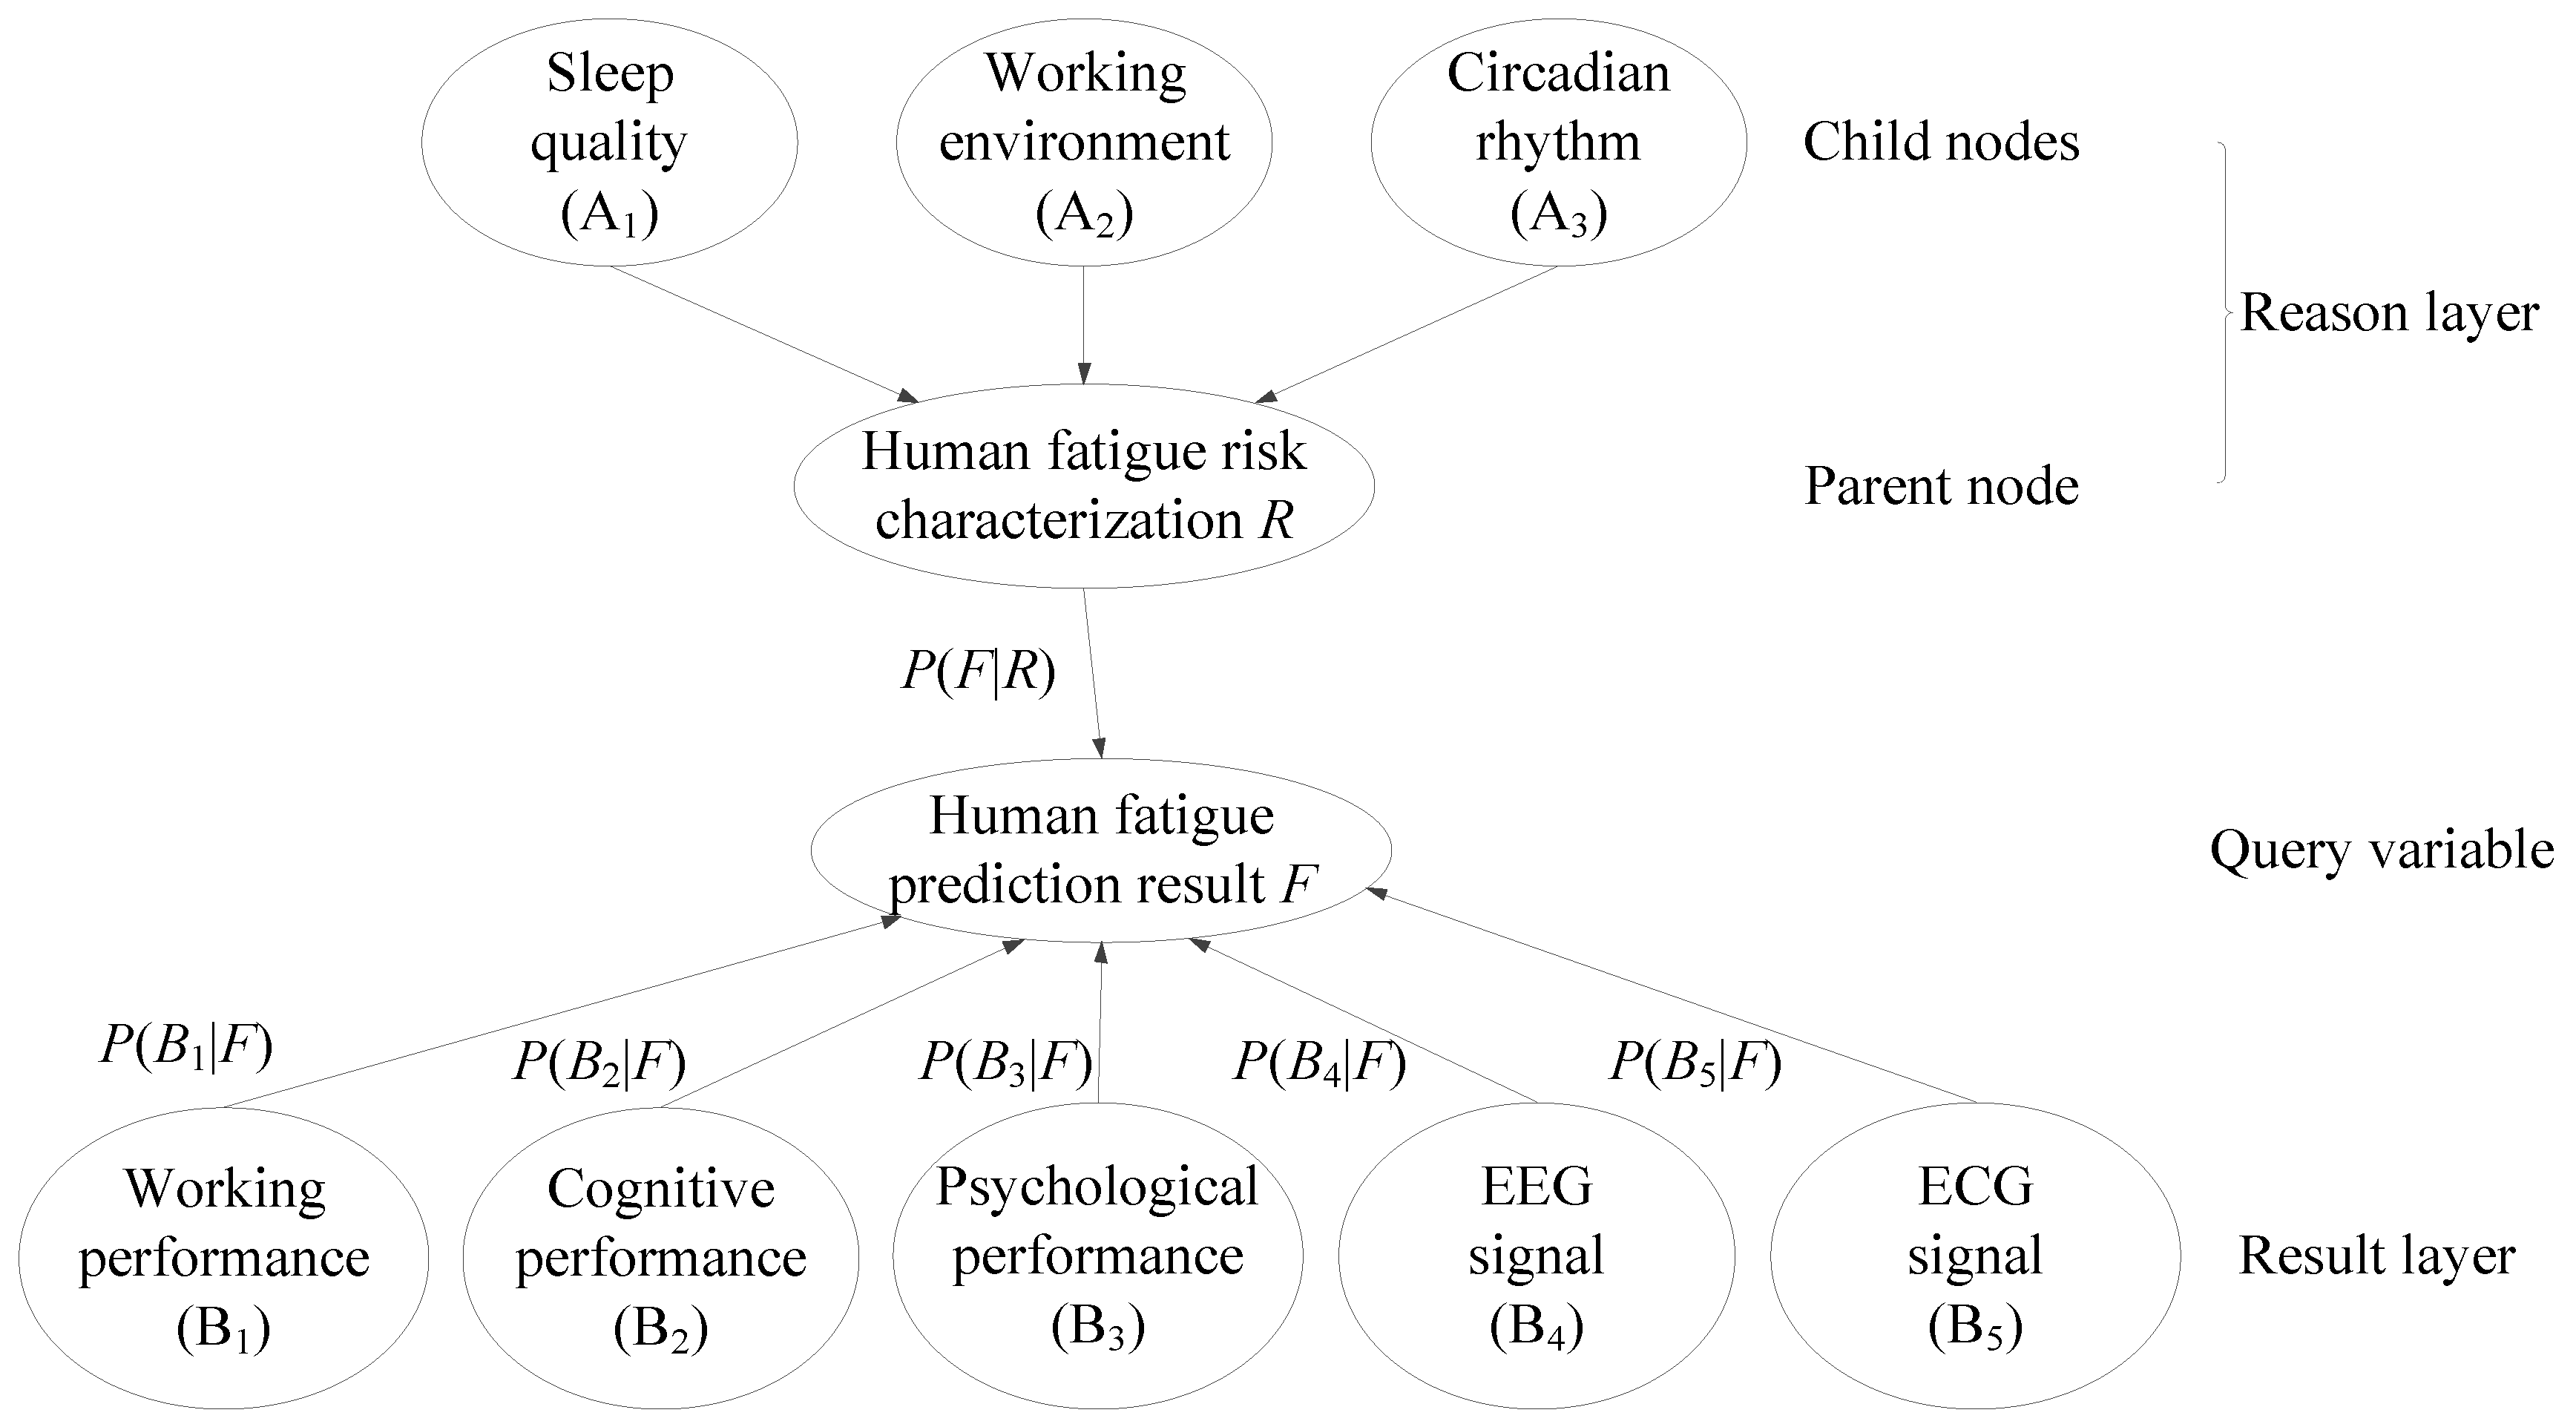
Human fatigue prediction is a complex, multi-dimensional representation problem. Since there is currently no ideal characteristic indicator and method to reveal human fatigue state in an artificial atmospheric environment, it is necessary to select indicators for human fatigue prediction from human fatigue analysis considering human working performance, cognition, psychology and physiology. Human fatigue prediction can be divided into the reason of human fatigue (i.e., reason layer) and the result of human fatigue (i.e., result layer). Referencing to the previous research [7,23,24,25,26,27,28], the reason layer is divided into four indicators, namely sleep quality (A1), working environment (A2), circadian rhythm (A3) and human fatigue at the previous time (A4). The result layer is divided into five indicators, namely working performance (B1), cognitive performance (B2), psychological performance (B3), EEG signal (B4) and ECG signal (B5). On this basis, the human fatigue prediction method will be constructed, as shown in Figure 1.
2.2. Fatigue Prediction Model Based on Bayes Network
2.2.1. Bayes Network
Bayesian network is a pattern inference model based on Bayesian theory, combining graph theory and probability theory effectively. Combining the intuitiveness of graph theory and the relevant knowledge of probability theory, a Bayesian network can quantitatively express uncertain hidden variables, parameters or states in the form of probabilistic reasoning, which is difficult to observe. The computational complexity is reduced by disassembling the complex reasoning problem of joint probability distribution between system variables into a series of relatively independent causal reasoning modules. Therefore, Bayesian network and the extended Dynamic Bayesian Network (DBN) model are one of the most effective theoretical models in the field of information fusion for uncertain knowledge expression and reasoning. Due to these characteristics, this paper uses DBN network to establish the human fatigue prediction method [7,23,24,25,26,27,28].
The multiple information fusion prediction process of human fatigue state using Bayesian network is a probabilistic reasoning process used to predict human fatigue state from the cause and effect of human fatigue. Based on the above analysis, this paper firstly establishes the Static Bayesian Network (SBN) and defines the nodes in the network, as follows. The reason layer child nodes contain three reason variables, namely sleep quality (A1), working environment (A2) and circadian rhythm (A3). The reason layer parent node is the human fatigue risk characterization variable, R, determined by the above reason variables. The result layer child nodes contain five result variables, namely working performance (B1), cognitive performance (B2), psychological performance (B3), EEG signal (B4) and ECG signal (B5). The query variable is human fatigue prediction result, F. This network includes the following two types of network parameters. The first type is the conditional probability, P(F|R), describing the relationship between the reason layer parent node parameter, R, and the query variable, F. The second type is the conditional probabilities, P(B1|F), P(B2|F), P(B3|F), P(B4|F) and P(B5|F), describing the relationship between the query variable, F, and result layer child nodes. Hence, the SBN model is established as shown in Figure 1.
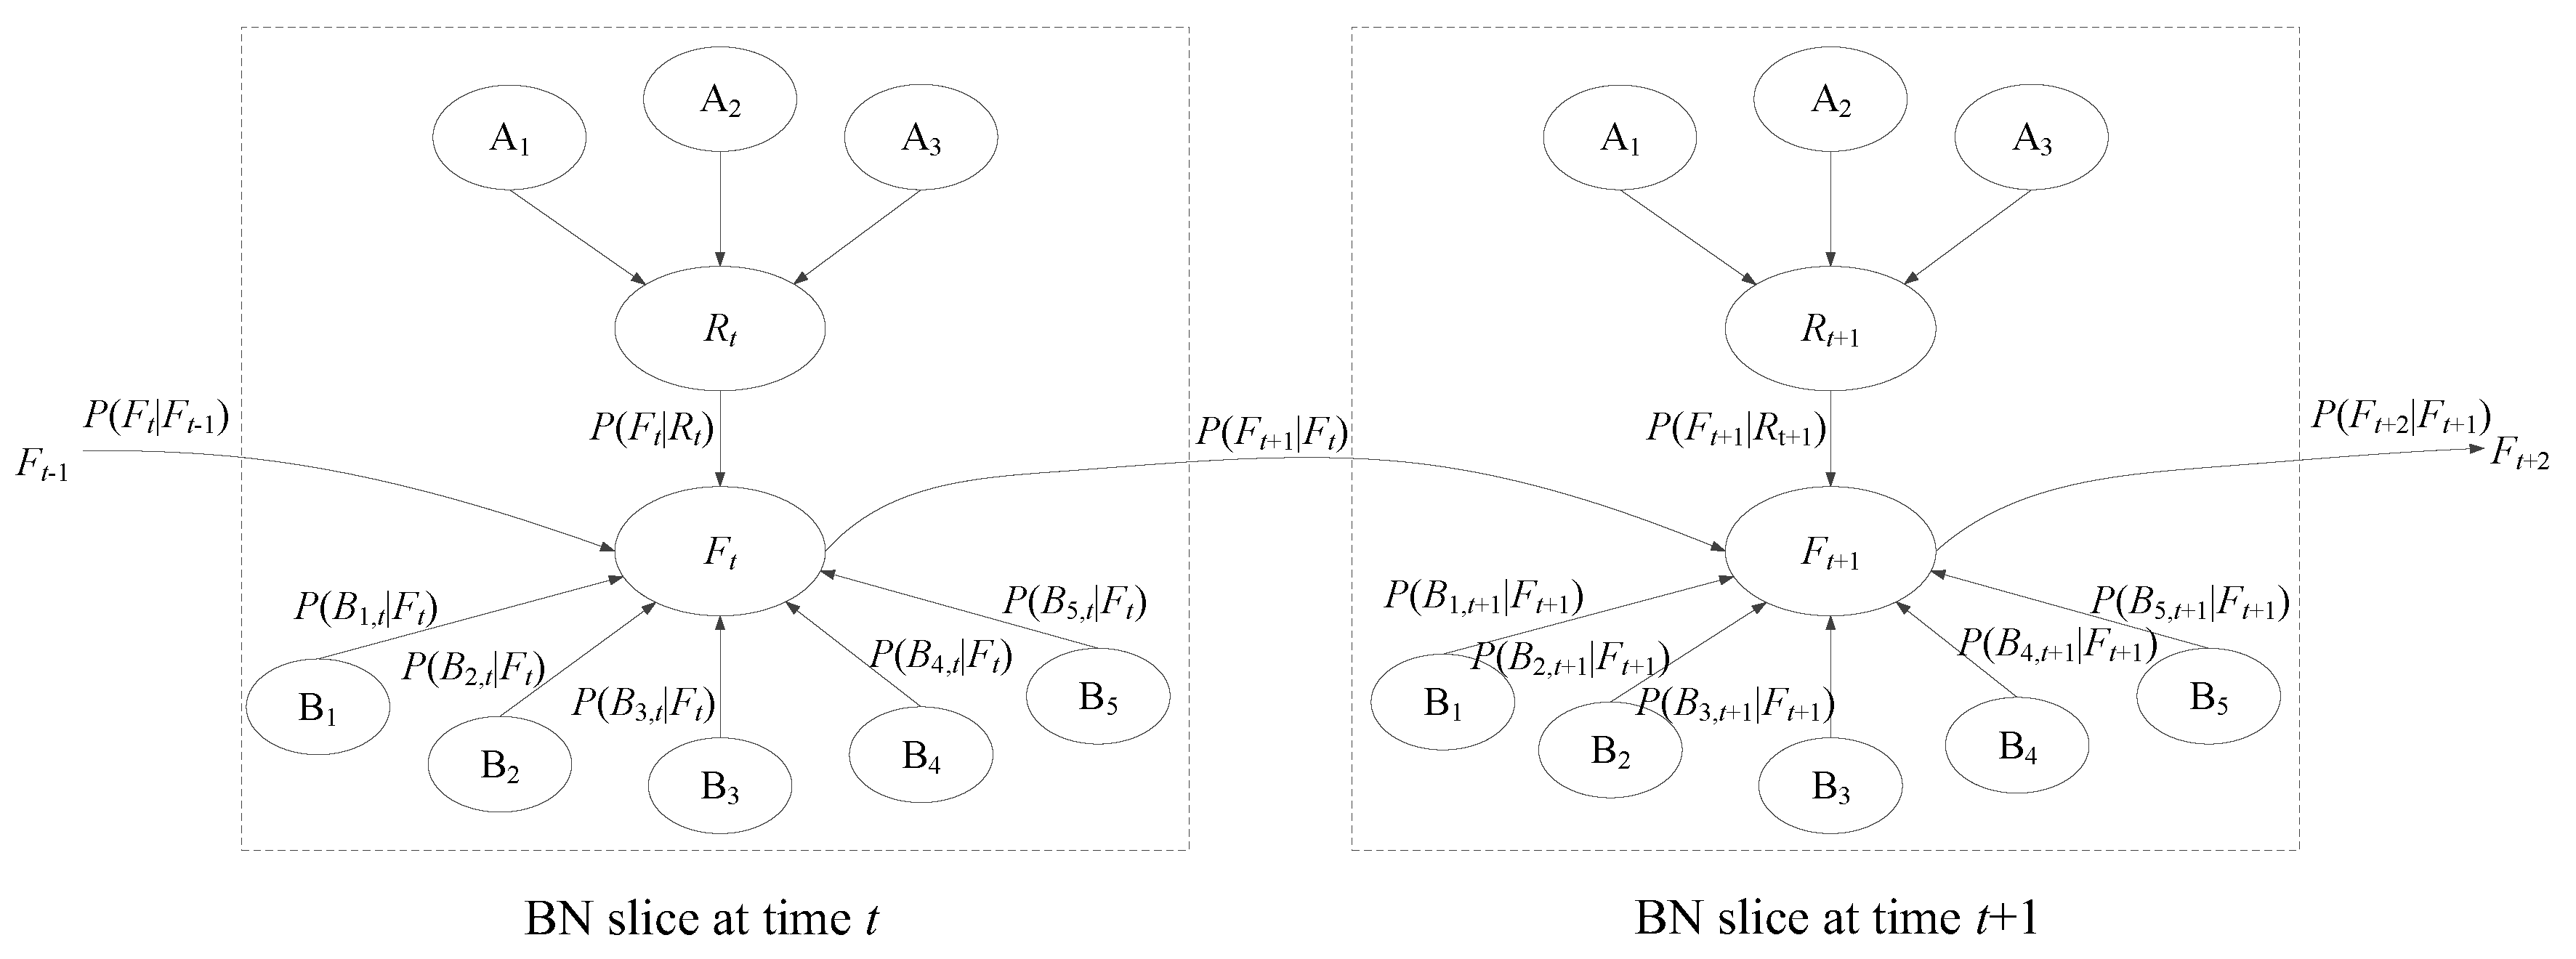
However, the above SBN model does not involve the time factor and the correlation of variables in time series. Therefore, it is not suitable for time-varying systems [25,29,30,31]. Considering that the human fatigue state is a continuous process in time, the time factor is added to the above SBN model to form a dynamic probability reasoning model with the function of processing time series data, namely the DBN [7,23,24,25,26,27,28]. The DBN is the expansion of SBN in time series and is constructed by multiple static Bayes Network (BN) slices interacting in time series. Each BN slice represents one probabilistic reasoning network at a time. The relationship between two adjacent BN slices is established according to the hidden Markov model, so that the implicit variable, Ft, in the Bayesian network at time t is not only related to the values of the parent node and child node variables observed at time t, but is also affected by the value of the implicit variable, Ft−1, at time t−1. Based on this, the above SBN model is expanded in time series to obtain the human fatigue state prediction model based on DBN, as shown in Figure 2.
2.2.2. Origins and Values of Probabilities in the Model
The variable values in each node in the above DBN are defined according to the following method. In order to express the states of reason layer child nodes, we use Ai = 0 (i = 1, 2, 3) to indicate normal sleep quality (A1), normal working environment (A2) or daytime circadian rhythm (A3). Correspondingly, Ai = 1 (i = 1, 2, 3) indicates poor sleep quality (A1), poor working environment (A2) or night circadian rhythm (A3). In order to express the states of result layer child nodes, we use Bi = 0 (i = 1, 2, 3) to denote working performance, cognitive performance or psychological performance improvements compared with the previous time, and Bi = 1 (i = 1, 2, 3) to denote working performance, cognitive performance or psychological performance deteriorations compared with the previous time. We use Bi = 0 (i = 4, 5) to indicate that rhythm of EEG (B4) or LF/HF of ECG (B5) is higher than that at the previous time. Correspondingly, Bi = 1 (i = 4, 5) indicates that the rhythm of EEG (B4) or LF/HF of ECG (B5) is greater than or equal to that at the previous time, and Bi = 2 (i = 4, 5) indicates that rhythm of EEG (B4) or LF/HF of ECG (B5) decreases compared to that at the previous time. The human fatigue risk characterization variable, R, is designed as the reason layer parent node determined by various dimensions. Finally, Ft = 1 or Ft = 0 is designed as the query variable to reveal whether the worker is in fatigue state or not.
According to the previous research [7,23,24,25,26,27,28], the values of the conditional probability, P(F|R), are shown in Table 1, and the values of the conditional probability, P(Ft|Ft−1), are shown in Table 2. Among the conditional probabilities between the query variable, F, and result layer child nodes, P(B1|F), P(B2|F) and P(B3|F), were determined by previous experiments, and P(B4|F) and P(B5|F) were determined by previous research [27], as shown in Table 3.
2.2.3. Prior Estimation of Human Fatigue Risk
- 1.
- Test and quantitative method of child nodes in the reason layer
The child nodes in the reason layer, as described above, contain sleep quality (A1), working environment (A2) and circadian rhythm (A3). The probabilities, P(Ai = j) (i = 1, 2, 3 j = 0, 1), from the quantization of these indicators are designed as input variables of this model. The quantifying method of child nodes are described below.
① Sleep quality (A1)
A sleep quality evaluation is conducted by filling in the sleep quality evaluation scale. Sleep quality is divided into 1~4 levels, where level 1 or 2 represent good sleep quality, and level 3 or 4 represent poor sleep quality. Obviously, P(A1 = 0) equals 1 for 1 or 2 level and P(A1 = 1) equals 1 for 3 or 4 level.
② Working environment (A2)
The working environment can be divided into temperature and noise, which are measured during the work. The probability of a good or poor working environment, P(A2 = j) (j = 0,1), related to temperature and noise, is determined [7,23,24,25,26,27,28] as shown in Table 4.
③ Circadian rhythm (A3)
Circadian rhythm is divided into daytime working (8:00~20:00) and night working (20:00~8:00 of the next day). Obviously, P(A3 = 0) equals 1 for daytime working and P(A3 = 1) equals 1 for night working.
- 2.
- Prior estimation of human fatigue risk
In this model, the probability distribution of the query variable of human fatigue at time t, Ft, depends on Rt and Ft−1. In other words, Rt and Ft−1 are two parent nodes of Ft. We use P(Ft|Rt,Ft−1) to express human fatigue prior estimation with known A1, A2, A3 and Ft−1. According to the total probability formula, the prior probability distribution of Ft can be expressed as the following:
2.2.4. Prediction of Human Fatigue
- 1.
- Test and quantitative method of child nodes in reason layer
The result layer child nodes, as described above, include working performance (B1), cognitive performance (B2), psychological performance (B3), EEG signal (B4) and ECG signal (B5), and the parameter Bi,t (i = 1, 2, 3, 4, 5) from the quantization of these indicators are designed as input variables of this model. The quantifying method of each child node is described below.
① Working performance (B1)
The Multi-Attribute Task Battery (MATB) task is conducted through the NASA-developed MATB-II platform based on multi-task situational operations to evaluate the work performance and workload of workers [32]. During the work, the MATB was performed. Its response time and accuracy rate were calculated. The ratio of reaction time to accuracy rate, b1, is used to reveal working performance. The input variable B1,t at time t depends on the comparison between the above ratio at present and at the previous time. Specifically, B1,t = 0 when b1,t > b1,t−1, and B1,t = 1 when b1,t ≤ b1,t−1.
② Cognitive performance (B2)
The Psychomotor Vigilance Test (PVT) is conducted during the work, and the reaction time, b2, is calculated in order to indicate the cognitive performance [33]. The input variable at time t, B2,t, depends on the comparison between the reaction time at present and that at the previous time. Specifically, B2,t = 0 when b2,t > b2,t−1, and B2,t = 1 when b2,t ≤ b2,t−1.
③ Psychological performance (B3)
A psychological performance evaluation is conducted by filling in the Positive and Negative Affect Scale (PANAS) scale, where positive and negative emotions are evaluated [34,35]. The score by positive emotion minus negative emotion, b3, is used to indicate psychological performance. The input variable at time t, B3,t, depends on the comparison between the score at present and that at the previous time. Specifically, B3,t = 0 when b3,t > b3,t−1, and B3,t = 1 when b3,t ≤ b3,t−1.
④ EEG signal (B4)
An EEG test is performed during the work, and the α rhythm value, b4, is calculated to indicate the EEG signal. The input variable at time t, B4,t, depends on the comparison between the α rhythm at present and at the previous time. Specifically, B4,t = 0 when b4,t > b4,t−1, B4,t = 1 when b4,t = b4,t−1, and B4,t = 2 when b4,t < b4,t−1.
⑤ ECG signal (B5)
The ECG test is performed during the work, and the LF/HF value, b5, is calculated to indicate the ECG signal. The input variable at time t, B5,t, depends on the comparison between LF/HF at present and at the previous time. Specifically, B5,t = 0 when b5,t > b5,t−1, B5,t = 1 when b5,t = b5,t−1, and B5,t = 2 when b5,t < b5,t−1.
- 2.
- Prediction of human fatigue
According to the previously calculated human fatigue prior estimation, P(Ft|Rt,Ft−1), and result layer child nodes, further human fatigue evaluation can be conducted. Firstly, according to the Bayesian formula:
Considering the conditional independence between reason layer parent nodes, Rt, Ft−1 and result layer child nodes, Bi,t (i = 1, 2, 3, 4, 5), further conversion is carried out according to the Bayesian formula, as follows:
Considering that the prior probability distribution of node Ft depends on parent nodes Rt and Ft−1, and the conditional independence among child nodes, the joint probability distribution of result layer child nodes can be expressed as follows based on the total probability formula:
Substitute Equation (4) into Equation (3) to obtain the final fatigue prediction as follows:
- 3.
- Subjective evaluation of human fatigue
The subjective evaluation of human fatigue in this paper is performed by requesting subjects to fill in the Karolinska Sleepiness Scale (KSS), which is widely used in the subjective evaluation of human fatigue [36,37,38]. During the work, the subjects are requested to fill in the KSS, and human fatigue subjective evaluation, Et, is calculated according to KSS score, St: Et = (St−1)/8. The accuracy of the prediction method of human fatigue is evaluated by comparing P(Ft = 1|B1,t,B2,t,B3,t,B4,t,B5,t,Rt,Ft−1) and Et.
3. Experimental Verification of Prediction Method
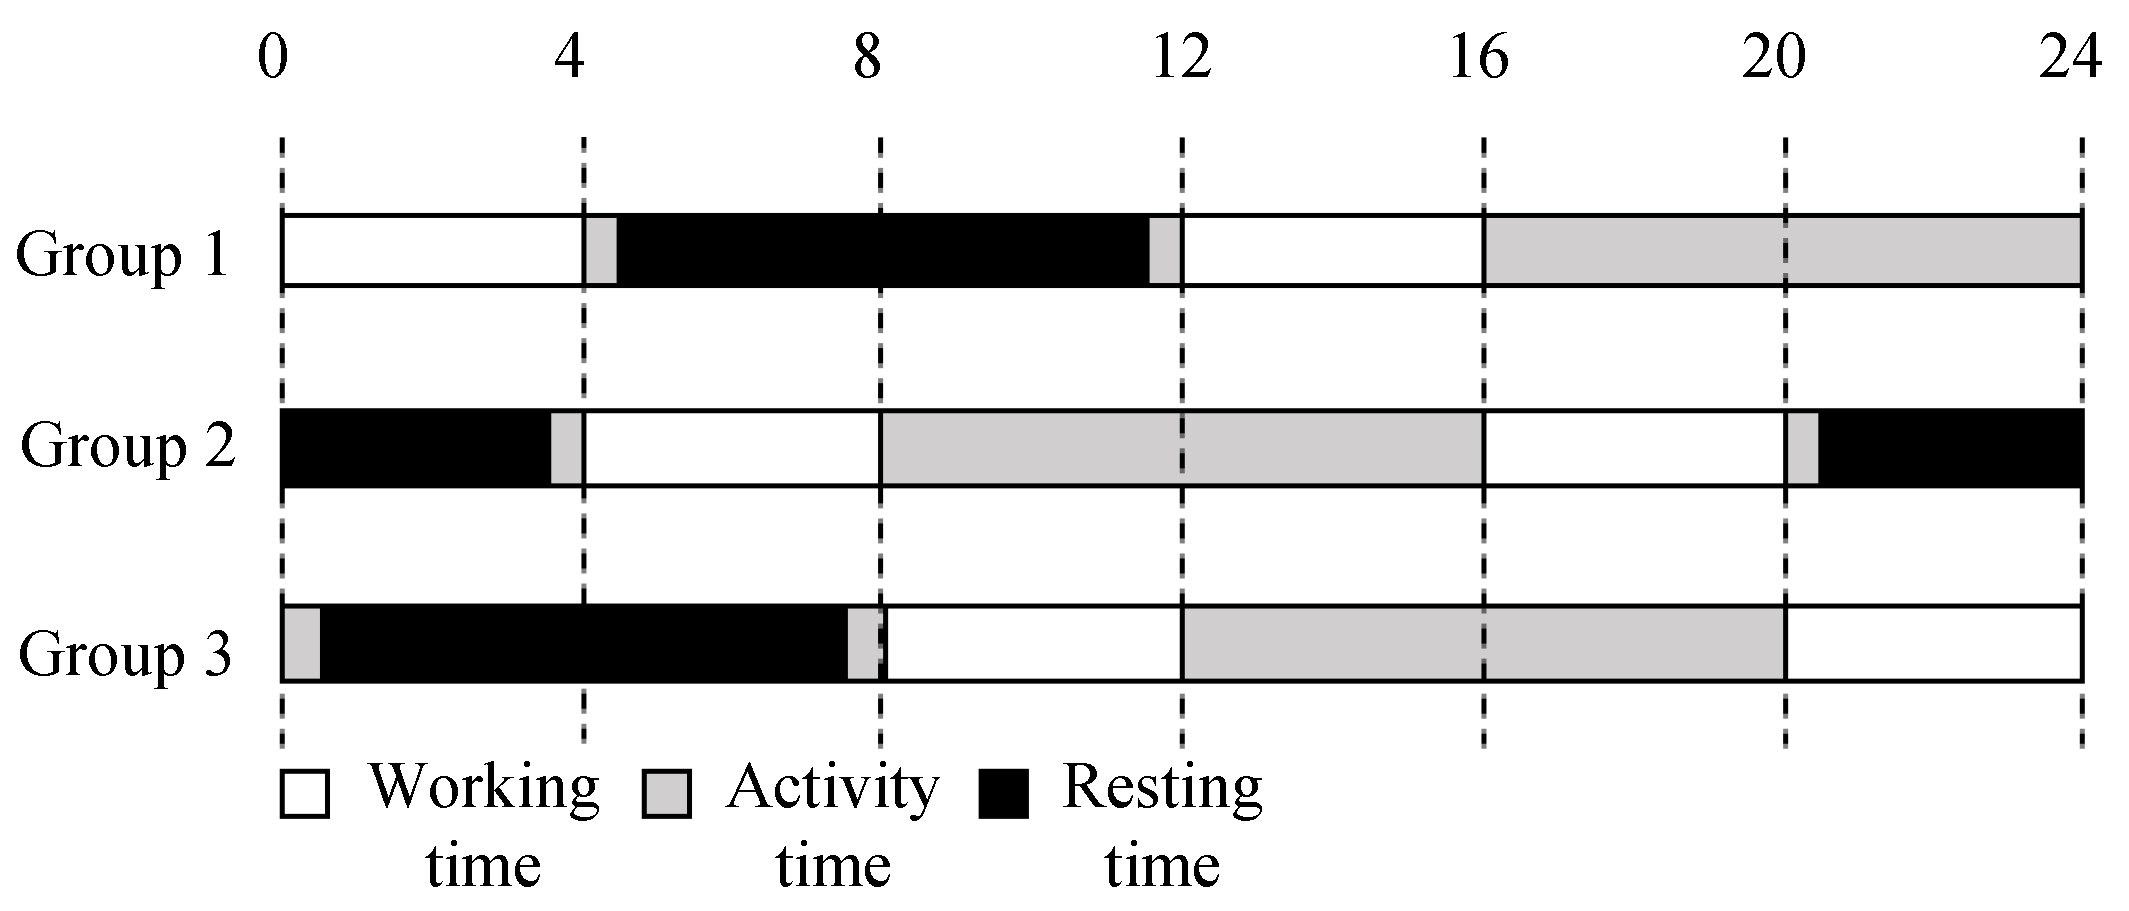
In this paper, the accuracy of this prediction method of human fatigue is evaluated through an experiment. In the experiment, 15 subjects numbered 1~15 were asked to complete 9 days of isolated living in a simulated cabin, during which they completed tasks and tests. The atmospheric environment was controlled artificially through the environmental control system of the simulated cabin. Subjects were divided into three classes: Subjects 1~5 for Group 1, Subjects 6~10 for Group 2 and Subjects 11~15 for Group 3. Different working time, activity time and rest time were arranged for different groups, where working time included two periods every day, as shown in Figure 3. In each working period, the MATB task and the PVT task were performed, and the KSS scale and PANAS were filled in by subjects. In order to obtain EEG and ECG data, subjects were asked to wear EEG caps and ECG test equipment while working. In addition, subjects filled in the sleep evaluation scale at the end of their sleep.
4. Results and Discussion
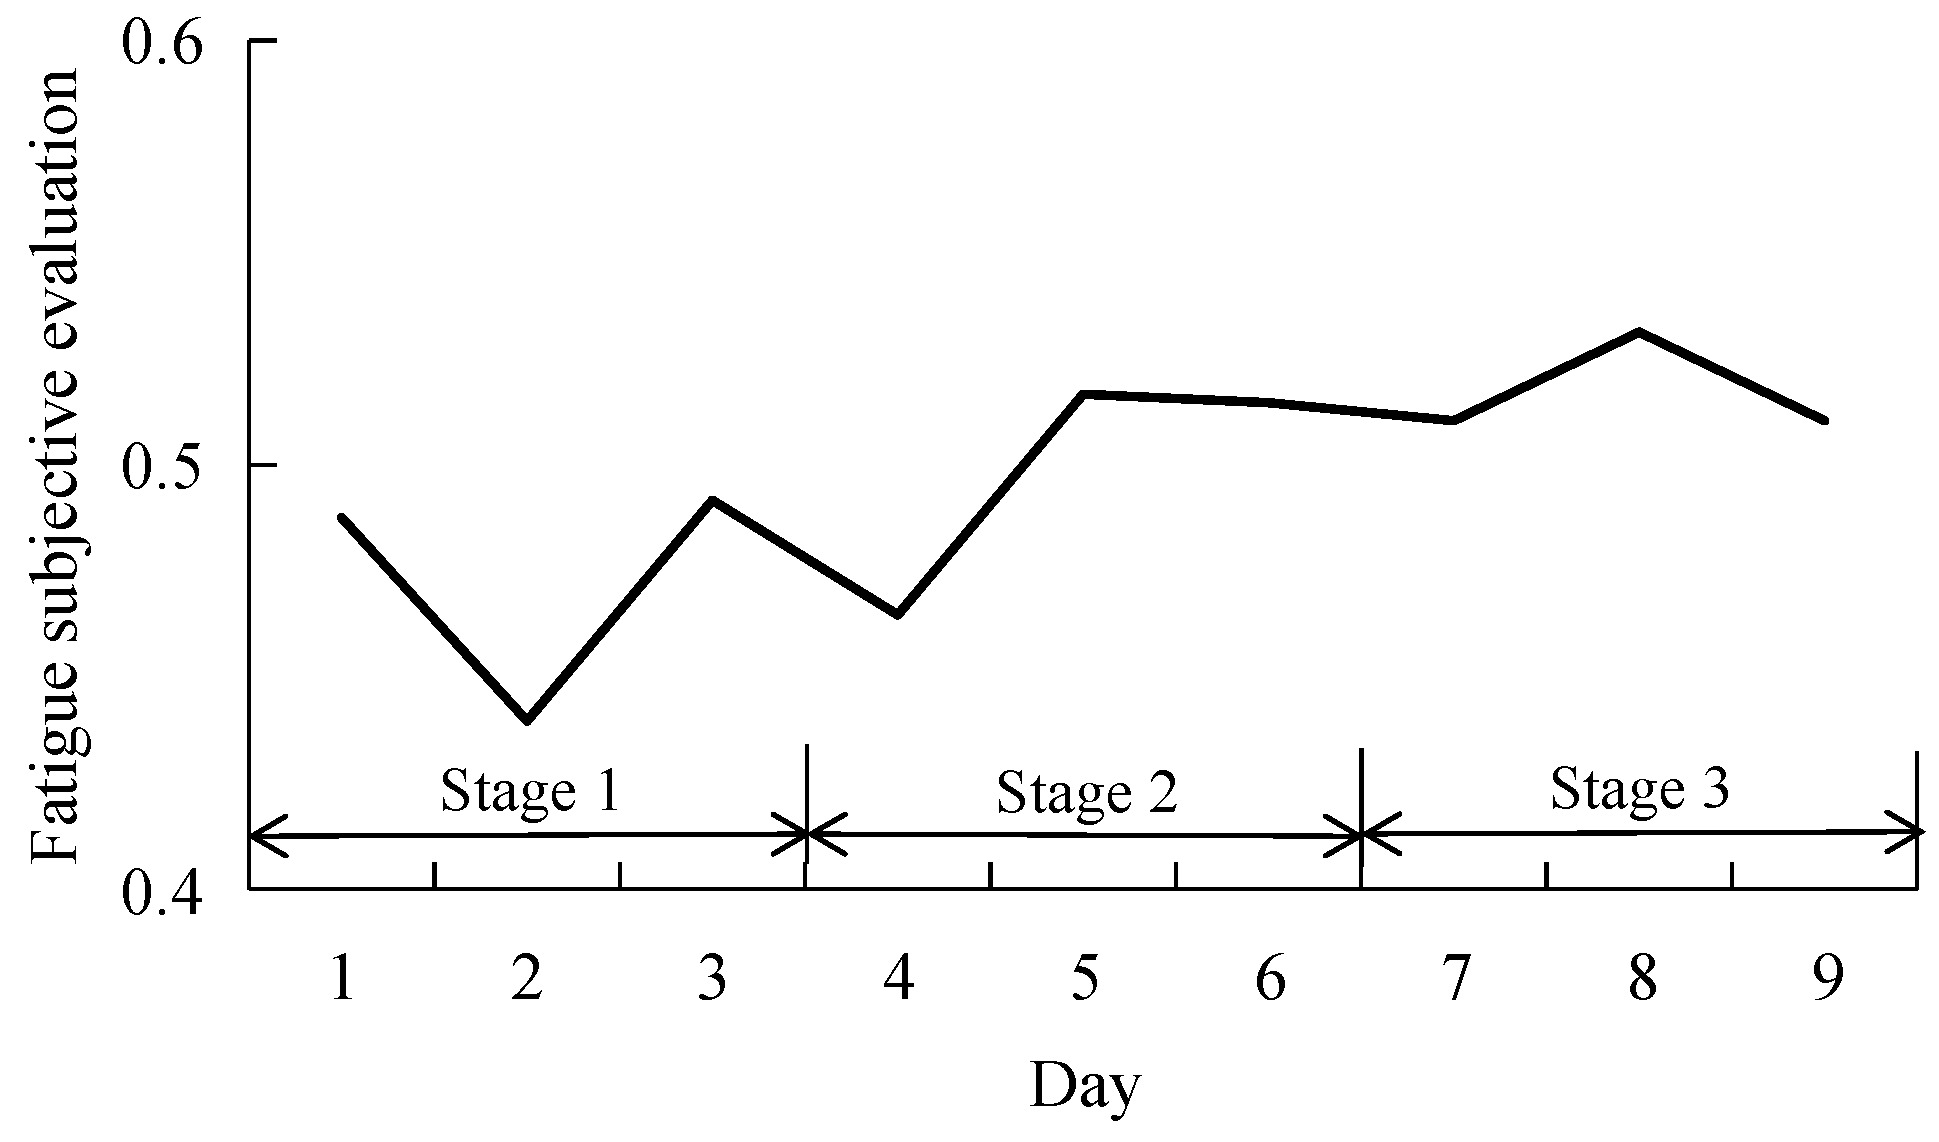
In order to determine the changing trend in human fatigue over time, the mean fatigue subjective evaluation of all subjects for each day is calculated according to experimental results, as shown in Figure 4. In this figure, the changing human fatigue trend in our experiments is divided into three stages. Human fatigue subjective evaluation values in Stage 2 and Stage 3 are higher than those in Stage 1. In other words, subjects tend to be more fatigued with the increase in experimental time.
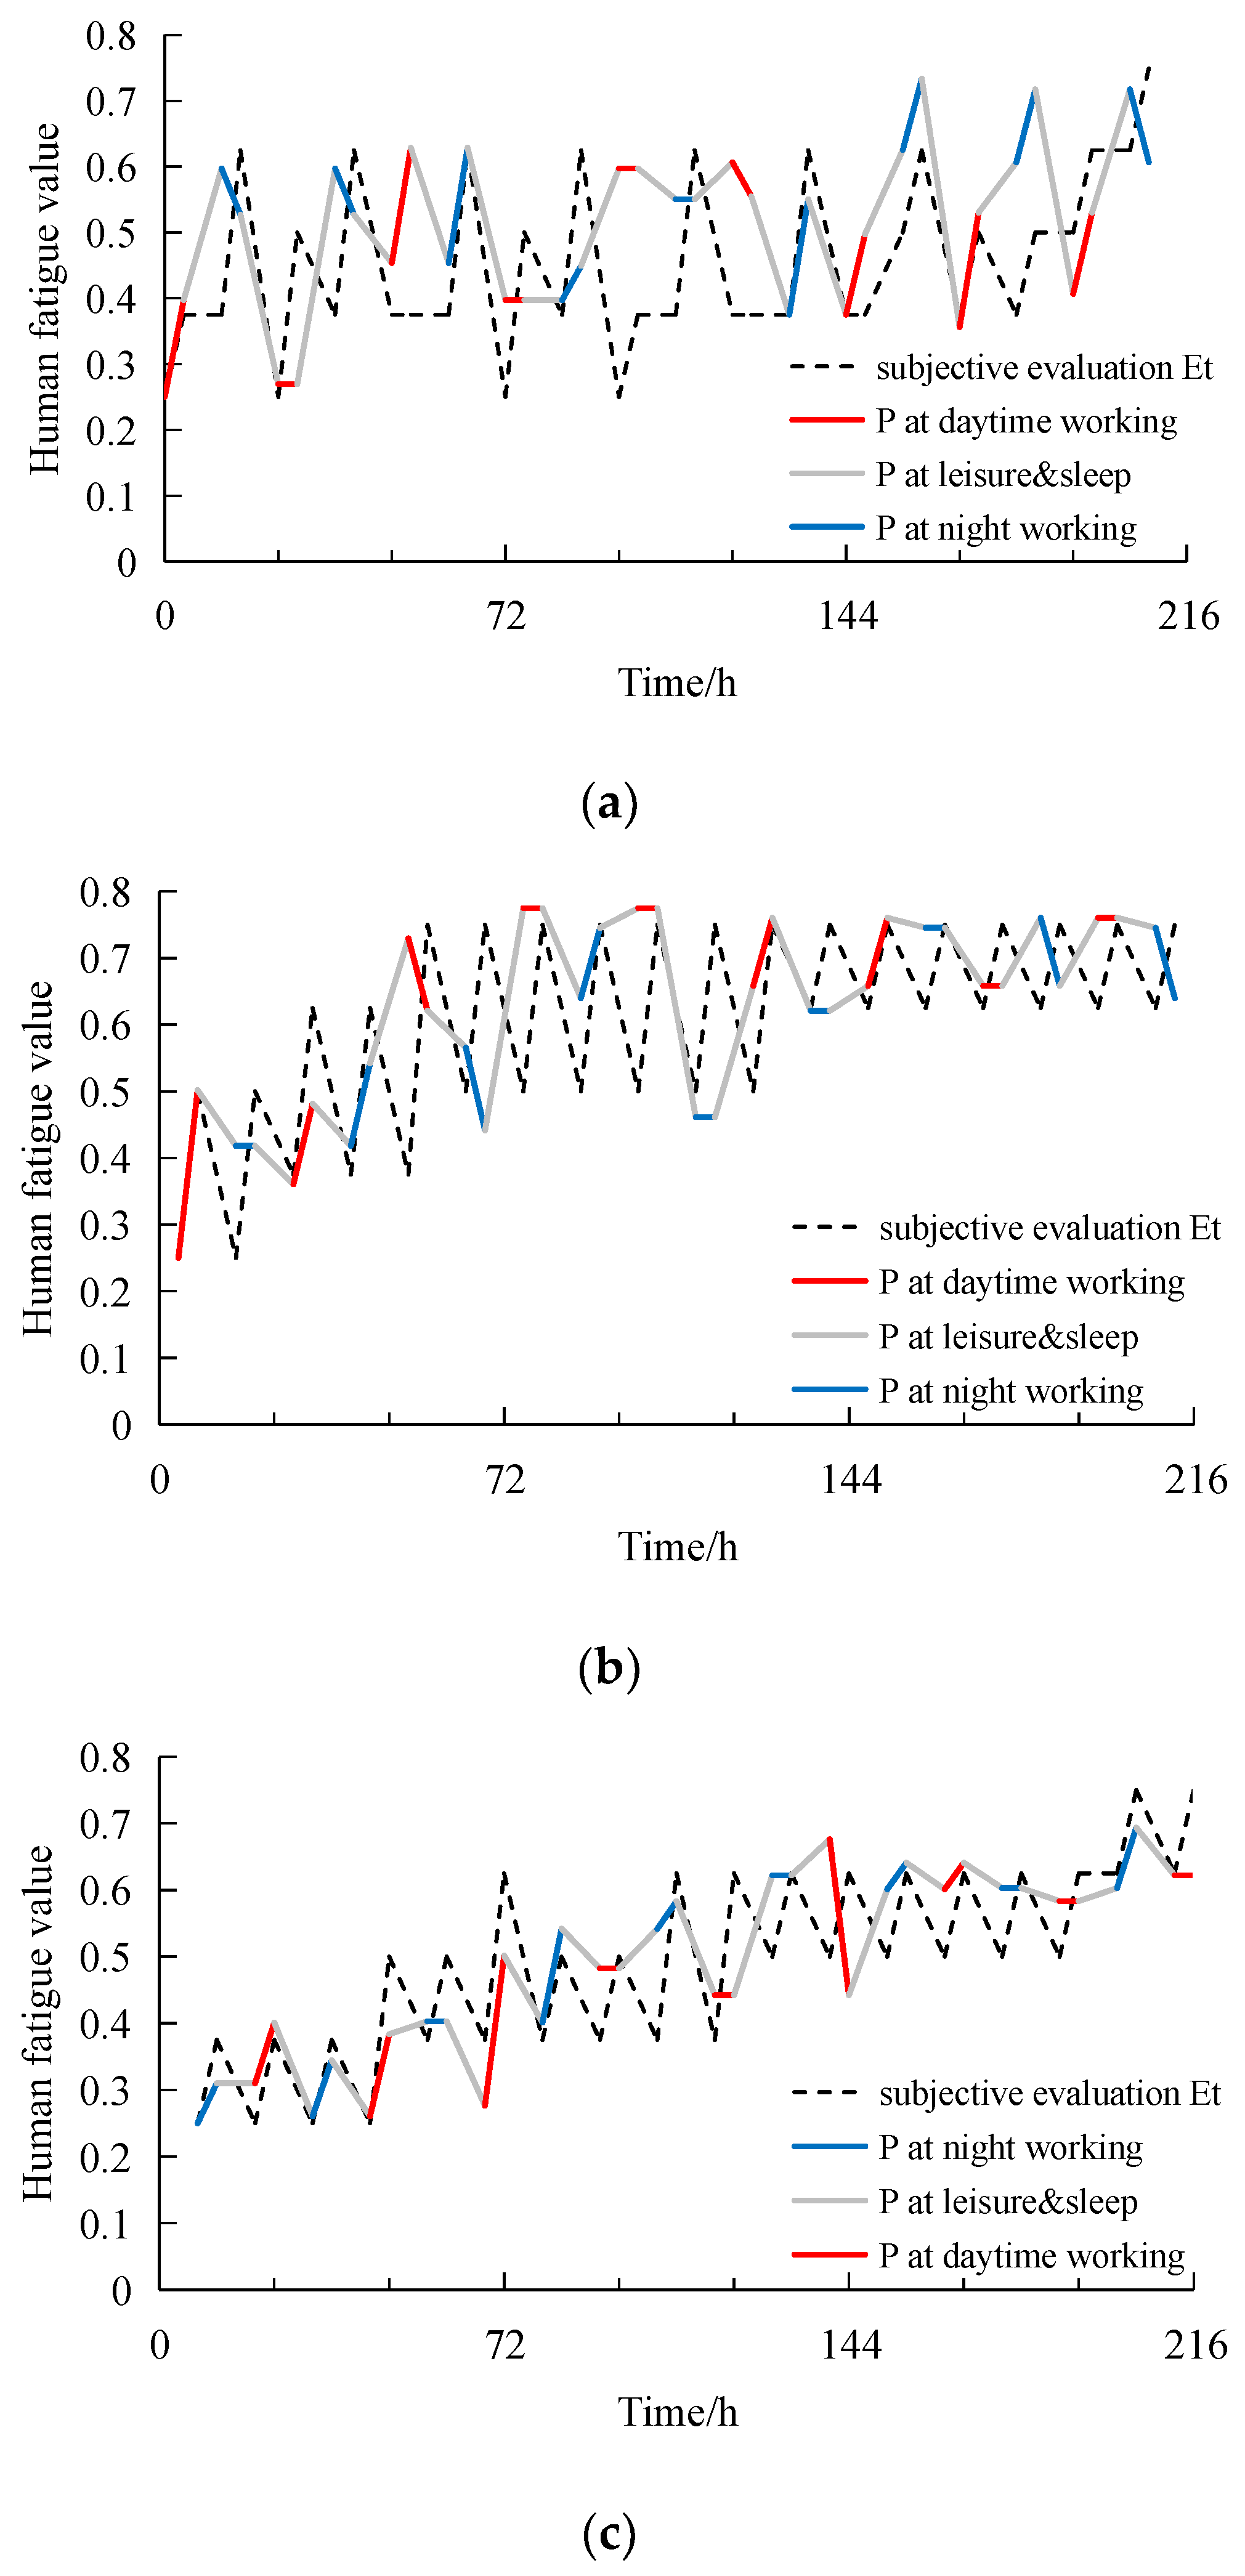
In order to verify the accuracy of this prediction method, the changes in human fatigue probability, P(Ft = 1|B1,t,B2,t,B3,t,B4,t,B5,t,Rt,Ft−1), and subjective evaluation, Et, are compared according to the model prediction and experimental results. Due to limitations on the article space, only the data of three subjects, Subjects 2, 9 and 15, are shown in Figure 5. Different subjects have different sensations regarding fatigue. In general, however, the changes in Et for the majority of subjects are consistent with the general trend. It can be seen from Figure 5 that this prediction method can make a relatively good prediction of human fatigue for each subject in each section. The mean prediction errors for Subjects 2, 9 and 15 are 29.8%, 18.9% and 14.4%, respectively. It can be seen from both model prediction results and experimental results that most subjects tend to be more fatigued in Stage 2 and Stage 3 than in Stage 1. This indicates that the human fatigue prediction method established in this paper could predict the human fatigue changing trend with time. Through the comparison of human fatigue between daytime working and night working, it can be concluded that subjects usually feel more fatigued during night work than during daytime work. This can also be predicted by the established model. According to the above analysis, this model can be used as a relatively reliable worker fatigue prediction method.
In this study, a fatigue prediction method considering eight input parameters is constructed to predict worker fatigue state comprehensively and accurately. Compared with the previous studies on worker fatigue prediction, the advantage of this method mainly consists of the following aspects. Firstly, compared with the prediction methods based on a single characteristic, including the fatigue driving prediction algorithm of Luo et al. [11] and the fatigue degree detection method of Xu et al. [14], this fatigue prediction method, based on eight characteristics, is a combination of cause and effect of human fatigue, which can achieve relatively comprehensive fatigue prediction. Secondly, compared with fatigue prediction methods based on a single characteristic, including physiological characteristics, behavioral features or facial features, this method usually has higher accuracy. Thirdly, compared with fatigue prediction methods based on facial features, such as the fatigue state prediction method of Poursadeghiyan et al. [15], this method would hardly interfere with the worker’s work. On the other hand, relatively mature methods for measurement and analysis of the characteristics have been selected in this fatigue prediction method.
Although this prediction method has the aforementioned advantages, further research is needed to improve the prediction performance of this method. Generally, relatively accurate predictions can be realized, and the changing trend in human fatigue value can be predicted by this model. However, relatively large differences between fatigue prediction results and subjective evaluation results still can be observed infrequently, especially for Subjects 2 and 9. In order to improve the prediction accuracy to a higher level, further research is expected to be performed in the future.
5. Conclusions
This research constructs a human fatigue prediction method for work in an artificial atmospheric environment based on a dynamic Bayesian network, focusing on the reason for and effect of human fatigue. Furthermore, an experiment is conducted requesting that subjects complete tasks in the artificial atmospheric environment, and this prediction method is verified through comparison between prediction results and experimental results. The following conclusions can be drawn:
- (1)
- The fatigue prediction results are close to subjective evaluation results. The mean prediction error is relatively low for each subject. It shows that this method can make a relatively accurate prediction of human fatigue in each period, which can be a relatively reliable worker fatigue prediction method. Considering eight different characteristics, this method can make a relatively comprehensive and accurate prediction of human fatigue. To improve the prediction performance, it is necessary to perform further research in the future.
- (2)
- Workers tend to be more fatigued as time goes on, according to prediction results and subjective evaluation results. This method can accurately predict changes in the human fatigue trend over time.
Author Contributions
Conceptualization, L.P.; methodology, L.P.; software, L.G.; validation, L.P., P.L. and L.G.; formal analysis, P.L.; investigation, P.L.; resources, L.P.; data curation, X.W.; writing—original draft preparation, L.P.; writing—review and editing, P.L.; visualization, H.Q.; supervision, L.P.; project administration, P.L.; funding acquisition, L.P. All authors have read and agreed to the published version of the manuscript.
Funding
This research was funded by the National Key R&D Program of China funded by Senhua Lai, grant number 2017YFB1201100, and the Liao Ning Revitalization Talents Program funded by Mingdong Zhou, grant number XLYC1802092.
Institutional Review Board Statement
The study was conducted in accordance with the Declaration of Helsinki, and approved by the Ethics Committee of BEIHANG UNIVERSITY (protocol code: BM201900078 and date of approval: 23 June 2019).
Informed Consent Statement
Informed consent was obtained from all subjects involved in the study.
Data Availability Statement
Restrictions apply to the availability of these data. Data was obtained from Marine Human Factors Engineering Lab, China Institute of Marine Technology & Economy, and are available from Xin Wang with the permission of Marine Human Factors Engineering Lab, China Institute of Marine Technology & Economy.
Acknowledgments
The authors thank the volunteers invited in the experiment for their cooperation in the experimental research. All individuals included in this section have consented to the acknowledgment.
Conflicts of Interest
The authors declare no conflict of interest.
References
- Akerstedt, T.; Kecklund, G. Age, gender and early morning highway accidents. J. Sleep Res. 2010, 10, 105–110. [Google Scholar] [CrossRef] [PubMed]
- Dawson, D.; Feyer, A.-M.; Gander, P.; Hartley, L.; Haworth, N.; Williamson, A. Fatigue Expert Group: Options for Regulatory Approach to Fatigue in Drivers of Heavy Vehicles in Australia and New Zealand; National Road Transfer Commission: Canberra, Australia, 2001.
- Horne, J.A.; Reyner, L.A. Driver sleepiness. J. Sleep Res. 2010, 4, 23–29. [Google Scholar] [CrossRef] [PubMed]
- MacLean, A.W. Chapter 40: Sleep and driving. In Handbook of Behavioral Neuroscience; Elsevier: Amsterdam, The Netherlands, 2019; Volume 30, pp. 611–622. [Google Scholar]
- Jiang, K.; Ling, F.; Feng, Z.; Wang, K.; Shao, C. Why do drivers continue driving while fatigued? An application of the theory of planned behaviour. Transp. Res. Part A Policy Pract. 2017, 98, 141–149. [Google Scholar] [CrossRef]
- Picard, R.W.; Vyzas, E.; Healey, J. Toward Machine Emotional Intelligence: Analysis of Affective Physiological State. IEEE Trans. Pattern Anal. Mach. Intell. 2001, 23, 1175. [Google Scholar] [CrossRef] [Green Version]
- Ji, Q.; Zhu, Z.; Lan, P. Real-time nonintrusive monitoring and prediction of driver fatigue. IEEE Trans. Veh. Technol. 2004, 53, 1052–1068. [Google Scholar] [CrossRef] [Green Version]
- Roberts, S.; Rezek, I.; Everson, R.; Stone, H.; Wilson, S.; Alford, C. Automated assessment of vigilance using committees of radial basis function analysers. IEE Proc. -Sci. Meas. Technol. 2000, 147, 333–338. [Google Scholar] [CrossRef] [Green Version]
- Watanabe, T.; Watanabe, K. Noncontact method for sleep stage estimation. IEEE Trans. Biomed. Eng. 2004, 51, 1735–1748. [Google Scholar] [CrossRef]
- Wilson, B.J.; Bracewell, T.D. Alertness monitor using neural networks from EEG analysis. In Proceedings of the IEEE Workshop on Neural Networks for Signal Processing X, Sydney, Australia, 11–13 December 2000; pp. 814–820. [Google Scholar]
- Luo, H.; Qiu, T.; Liu, C.; Huang, P. Research on fatigue driving detection using forehead EEG based on adaptive multi-scale entropy. Biomed. Signal Process Control. 2019, 51, 50–58. [Google Scholar] [CrossRef]
- Gromer, M.; Salb, D.; Walzer, T.; Madrid, N.M.; Seepold, R. ECG sensor for detection of driver’s drowsiness. Procedia Comput. Sci. 2019, 159, 1938–1946. [Google Scholar] [CrossRef]
- Wang, H. Detection and alleviation of driving fatigue based on EMG and EMS/EEG using wearable sensor. In Proceedings of the 5th EAI International Conference on Wireless Mobile Communication and Healthcare-“Transforming Healthcare through Innovations in Mobile and Wireless Technologies”, London, UK, 14–16 October 2015. [Google Scholar]
- Xu, J.; Min, J.; Hu, J. Real-time eye tracking for the assessment of driver fatigue. Healthc. Technol. Lett. 2018, 5, 54–58. [Google Scholar] [CrossRef]
- Poursadeghiyan, M.; Mazloumi, A.; Saraji, G.N.; Baneshi, M.M.; Khammar, A.; Ebrahimi, M.H. Using image processing in the proposed drowsiness detection system design. Iran. J. Public Health. 2018, 47, 1371–1378. [Google Scholar] [PubMed]
- He, J.; Choi, W.; Yang, Y.; Lu, J.; Wu, X.; Peng, K. Detection of driver drowsiness using wearable devices: A feasibility study of the proximity sensor. Appl. Ergon. 2017, 65, 473–480. [Google Scholar] [CrossRef] [PubMed]
- Knapik, M.; Cyganek, B. Driver’s fatigue recognition based on yawn detection in thermal images. Neurocomputing 2019, 338, 274–292. [Google Scholar] [CrossRef]
- Fu, R.; Wang, H.; Zhao, W. Dynamic driver fatigue detection using hidden Markov model in real driving condition. Expert Syst. Appl. 2016, 63, 397–411. [Google Scholar] [CrossRef]
- Hong, S.; Kwon, H.; Choi, S.H.; Park, K.S. Intelligent system for drowsiness recognition based on ear canal electroencephalography with photoplethysmography and electrocardiography. Inf. Sci. 2018, 453, 302–322. [Google Scholar] [CrossRef]
- Ma, Z.; Yao, S.; Zhao, J.; Qian, J.; Su, J.; Dai, J. Research on Drowsy-driving Monitoring and Warning System Based on Multi-feature Comprehensive Evaluation. IFAC-PapersOnLine 2018, 51, 784–789. [Google Scholar] [CrossRef]
- Pimenta, A.; Carneiro, D.; Neves, J.; Novais, P. A neural network to classify fatigue from human–computer interaction. Neurocomputing 2016, 172, 413–426. [Google Scholar] [CrossRef]
- Champa, H.N.; AnandaKumar, K.R. Artificial Neural Network for Human Behavior Prediction through Handwriting Analysis. Int. J. Comput. Appl. 2010, 2, 36–41. [Google Scholar] [CrossRef]
- Ahmed, S. Human Fatigue in Prolonged Mentally Demanding Work-Tasks: An Observational Study in the Field. Ph.D. Thesis, Mississippi State University, Starkville, MS, USA, 17 August 2013. [Google Scholar]
- Lan, P.; Ji, Q.; Looney, C.G. Information fusion with Bayesian networks for monitoring human fatigue. In Proceedings of the Fifth International Conference on Information Fusion, Annapolis, MD, USA, 8–11 July 2002. [Google Scholar] [CrossRef]
- Ji, Q.; Lan, P.; Looney, C. A probabilistic framework for modeling and real-time monitoring human fatigue. IEEE Trans. Syst. Man Cybern.-Part A Syst. Hum. 2006, 36, 862–875. [Google Scholar] [CrossRef]
- Tan, S.; Qian, K.; Fu, X.; Bhattacharya, P. BAUT: A Bayesian Driven Tutoring System. In Proceedings of the Seventh International Conference on Information Technology: New Generations, Las Vegas, NV, USA, 12–14 April 2010. [Google Scholar]
- Yang, G.; Lin, Y.; Bhattacharya, P. A driver fatigue recognition model based on information fusion and dynamic Bayesian network. Inf. Sci. 2010, 180, 1942–1954. [Google Scholar] [CrossRef]
- Yue, Z.; Xu, X.; Yang, G. Unsupervised Tibetan speech features Learning based on Dynamic Bayesian Networks. In Proceeding of the 21st International Conference on Pattern Recognition (ICPR), Tsukuba, Japan, 11–15 November 2012. [Google Scholar]
- Li, X.; Ji, Q. Active affective State detection and user assistance with dynamic Bayesian networks. IEEE Trans. Syst. Man Cybern.-Part A Syst. Hum. 2005, 35, 93–105. [Google Scholar] [CrossRef]
- Zhang, Y.; Ji, Q. Active and dynamic information fusion for multisensor systems with dynamic Bayesian networks. IEEE Trans. Syst. Man Cybern. Part B (Cybern.) 2006, 36, 467–472. [Google Scholar] [CrossRef]
- Zhang, Y.; Ji, Q.; Looney, C.G. Active information fusion for decision making under uncertainty. In Proceedings of the 5th International Conference on Information Fusion, Annapolis, MD, USA, 8–11 July 2002. [Google Scholar]
- Stader, S.; Leavens, J.; Gonzalez, B.; Fontaine, V.; Mouloua, M.; Alberti, P. Effects of Display and Task Features on System Monitoring Performance in the Original Multi-Attribute Task Battery and MATB-II. Proc. Hum. Factors Ergon. Soc. Annu. Meet. 2013, 57, 1435–1439. [Google Scholar] [CrossRef]
- Dinges, D.F.; Powell, J.W. Microcomputer analyses of performance on a portable, simple visual RT task during sustained operations. Behav. Res. Methods Instrum. Comput. 1985, 17, 652–655. [Google Scholar] [CrossRef]
- Mackinnon, A.; Jorm, A.F.; Christensen, H.; Korten, A.E.; Jacomb, P.A.; Rodgers, B. A short form of the Positive and Negative Affect Schedule: Evaluation of factorial validity and invariance across demographic variables in a community sample. Personal. Individ. Differ. 1999, 27, 405–416. [Google Scholar] [CrossRef]
- Watson, D.; Clark, L.A.; Tellegen, A. Development and validation of brief measures of positive and negative affect: The PANAS scales. J. Personal. Soc. Psychol. 1988, 54, 1063–1070. [Google Scholar] [CrossRef]
- Akerstedt, T.; Gillberg, M. Subjective and objective sleepiness in the active individual. Int. J. Neurosci. 1990, 52, 29–37. [Google Scholar] [CrossRef]
- Kaida, K.; Takahashi, M.; Åkerstedt, T.; Nakata, A.; Otsuka, Y.; Haratani, T.; Fukasawa, K. Validation of the karolinska sleepiness scale against performance and EEG variables. Clin. Neurophysiol. 2006, 117, 1574–1581. [Google Scholar] [CrossRef]
- Kecklund, G.; Åkerstedt, T. Sleepiness in long distance truck driving: An ambulatory EEG study of night driving. Ergonomics 1993, 36, 1007–1017. [Google Scholar] [CrossRef]
Figure 1.
SBN human fatigue prediction model.

Figure 2.
Human fatigue prediction model based on DBN.

Figure 3.
Schedule of the experiment.

Figure 4.
Mean fatigue subjective evaluation.

Figure 5.
Comparison between P(Ft = 1|B1,t,B2,t,B3,t,B4,t,B5,t,Rt,Ft−1) and Et. (a) Subject 2; (b) Subject 9; (c) Subject 15.
Figure 5.
Comparison between P(Ft = 1|B1,t,B2,t,B3,t,B4,t,B5,t,Rt,Ft−1) and Et. (a) Subject 2; (b) Subject 9; (c) Subject 15.


Table 1.
Values of the conditional probability, P(F|R).
| Condition | P(F = 1|R) | |||
|---|---|---|---|---|
| Sleep Quality (A1) | Working Environment (A2) | Circadian Rhythm (A3) | R | |
| Good | Good | Daytime | (0,0,0) | 0.05 |
| Night | (0,0,1) | 0.15 | ||
| Poor | Daytime | (0,1,0) | 0.27 | |
| Night | (0,1,1) | 0.51 | ||
| Poor | Good | Daytime | (1,0,0) | 0.77 |
| Night | (1,0,1) | 0.88 | ||
| Poor | Daytime | (1,1,0) | 0.89 | |
| Night | (1,1,1) | 0.98 | ||
Table 2.
Values of the conditional probability, P(Ft|Ft−1).
| Condition | P(Ft = 1|Ft−1) | |
|---|---|---|
| Fatigue State at the Previous Time | Ft−1 | |
| Alertness | 0 | 0.1425 |
| Fatigue | 1 | 0.8587 |
Table 3.
Values of the conditional probability, P(Bi|F) (i = 1,2,3,4,5).
| Condition | P(Bi|F) (i = 1,2,3) | |
|---|---|---|
| Fatigue State | F | |
| Alertness | 0 | P(B1 = 0|F = 0) = 0.5072 P(B1 = 1|F = 0) = 0.4928 |
| P(B2 = 0|F = 0) = 0.618 P(B2 = 1|F = 0) = 0.382 | ||
| P(B3 = 0|F = 0) = 0.5373 P(B3 = 1|F = 0) = 0.4627 | ||
| P(B4 = 0|F = 0) = 0.91 P(B4 = 1|F = 0) = 0.08 P(B4 = 2|F = 0) = 0.01 | ||
| P(B5 = 0|F = 0) = 0.93 P(B5 = 1|F = 0) = 0.06 P(B5 = 2|F = 0) = 0.01 | ||
| Fatigue | 1 | P(B1 = 0|F = 1) = 0.4893 P(B2 = 1|F = 1) = 0.5107 |
| P(B2 = 0|F = 1) = 0.4954 P(B2 = 1|F = 1) = 0.5046 | ||
| P(B3 = 0|F = 1) = 0.1284 P(B3 = 1|F = 1) = 0.8716 | ||
| P(B4 = 0|F = 1) = 0.01 P(B4 = 1|F = 1) = 0.08 P(B4 = 2|F = 1) = 0.91 | ||
| P(B5 = 0|F = 1) = 0.01 P(B5 = 1|F = 1) = 0.06 P(B5 = 2|F = 1) = 0.93 | ||
Table 4.
Values of the probability, P(A2 = 1).
| Condition | P(A2 = 1) | |
|---|---|---|
| Temperature | Noise | |
| High | High | 0.94 |
| Normal | 0.8 | |
| Normal | High | 0.73 |
| Normal | 0.1 | |
Publisher’s Note: MDPI stays neutral with regard to jurisdictional claims in published maps and institutional affiliations. |
© 2022 by the authors. Licensee MDPI, Basel, Switzerland. This article is an open access article distributed under the terms and conditions of the Creative Commons Attribution (CC BY) license (https://creativecommons.org/licenses/by/4.0/).
Share and Cite
MDPI and ACS Style
Pang, L.; Li, P.; Guo, L.; Wang, X.; Qu, H. Prediction Method of Human Fatigue in an Artificial Atmospheric Environment Based on Dynamic Bayesian Network. Mathematics 2022, 10, 2778. https://doi.org/10.3390/math10152778
AMA Style
Pang L, Li P, Guo L, Wang X, Qu H. Prediction Method of Human Fatigue in an Artificial Atmospheric Environment Based on Dynamic Bayesian Network. Mathematics. 2022; 10(15):2778. https://doi.org/10.3390/math10152778
Chicago/Turabian StylePang, Liping, Pei Li, Liang Guo, Xin Wang, and Hongquan Qu. 2022. "Prediction Method of Human Fatigue in an Artificial Atmospheric Environment Based on Dynamic Bayesian Network" Mathematics 10, no. 15: 2778. https://doi.org/10.3390/math10152778
Note that from the first issue of 2016, this journal uses article numbers instead of page numbers. See further details here.