
Has the COVID-19 Pandemic Affected Mathematics Achievement? A Case Study of University Students in Social Sciences


Abstract
:1. Introduction
2. Review of Related Literature
3. Research Objectives
4. Materials and Methods
4.1. Measurement Instrument and Data Collection
4.2. Statistical Methods
4.2.1. Measurement Model Evaluation
- Step 1: model overall fit evaluation,
- Step 2: confirmatory factor analysis,
- Step 3: multi-group confirmatory factor analysis.
Step 1: Model Overall Fit Evaluation
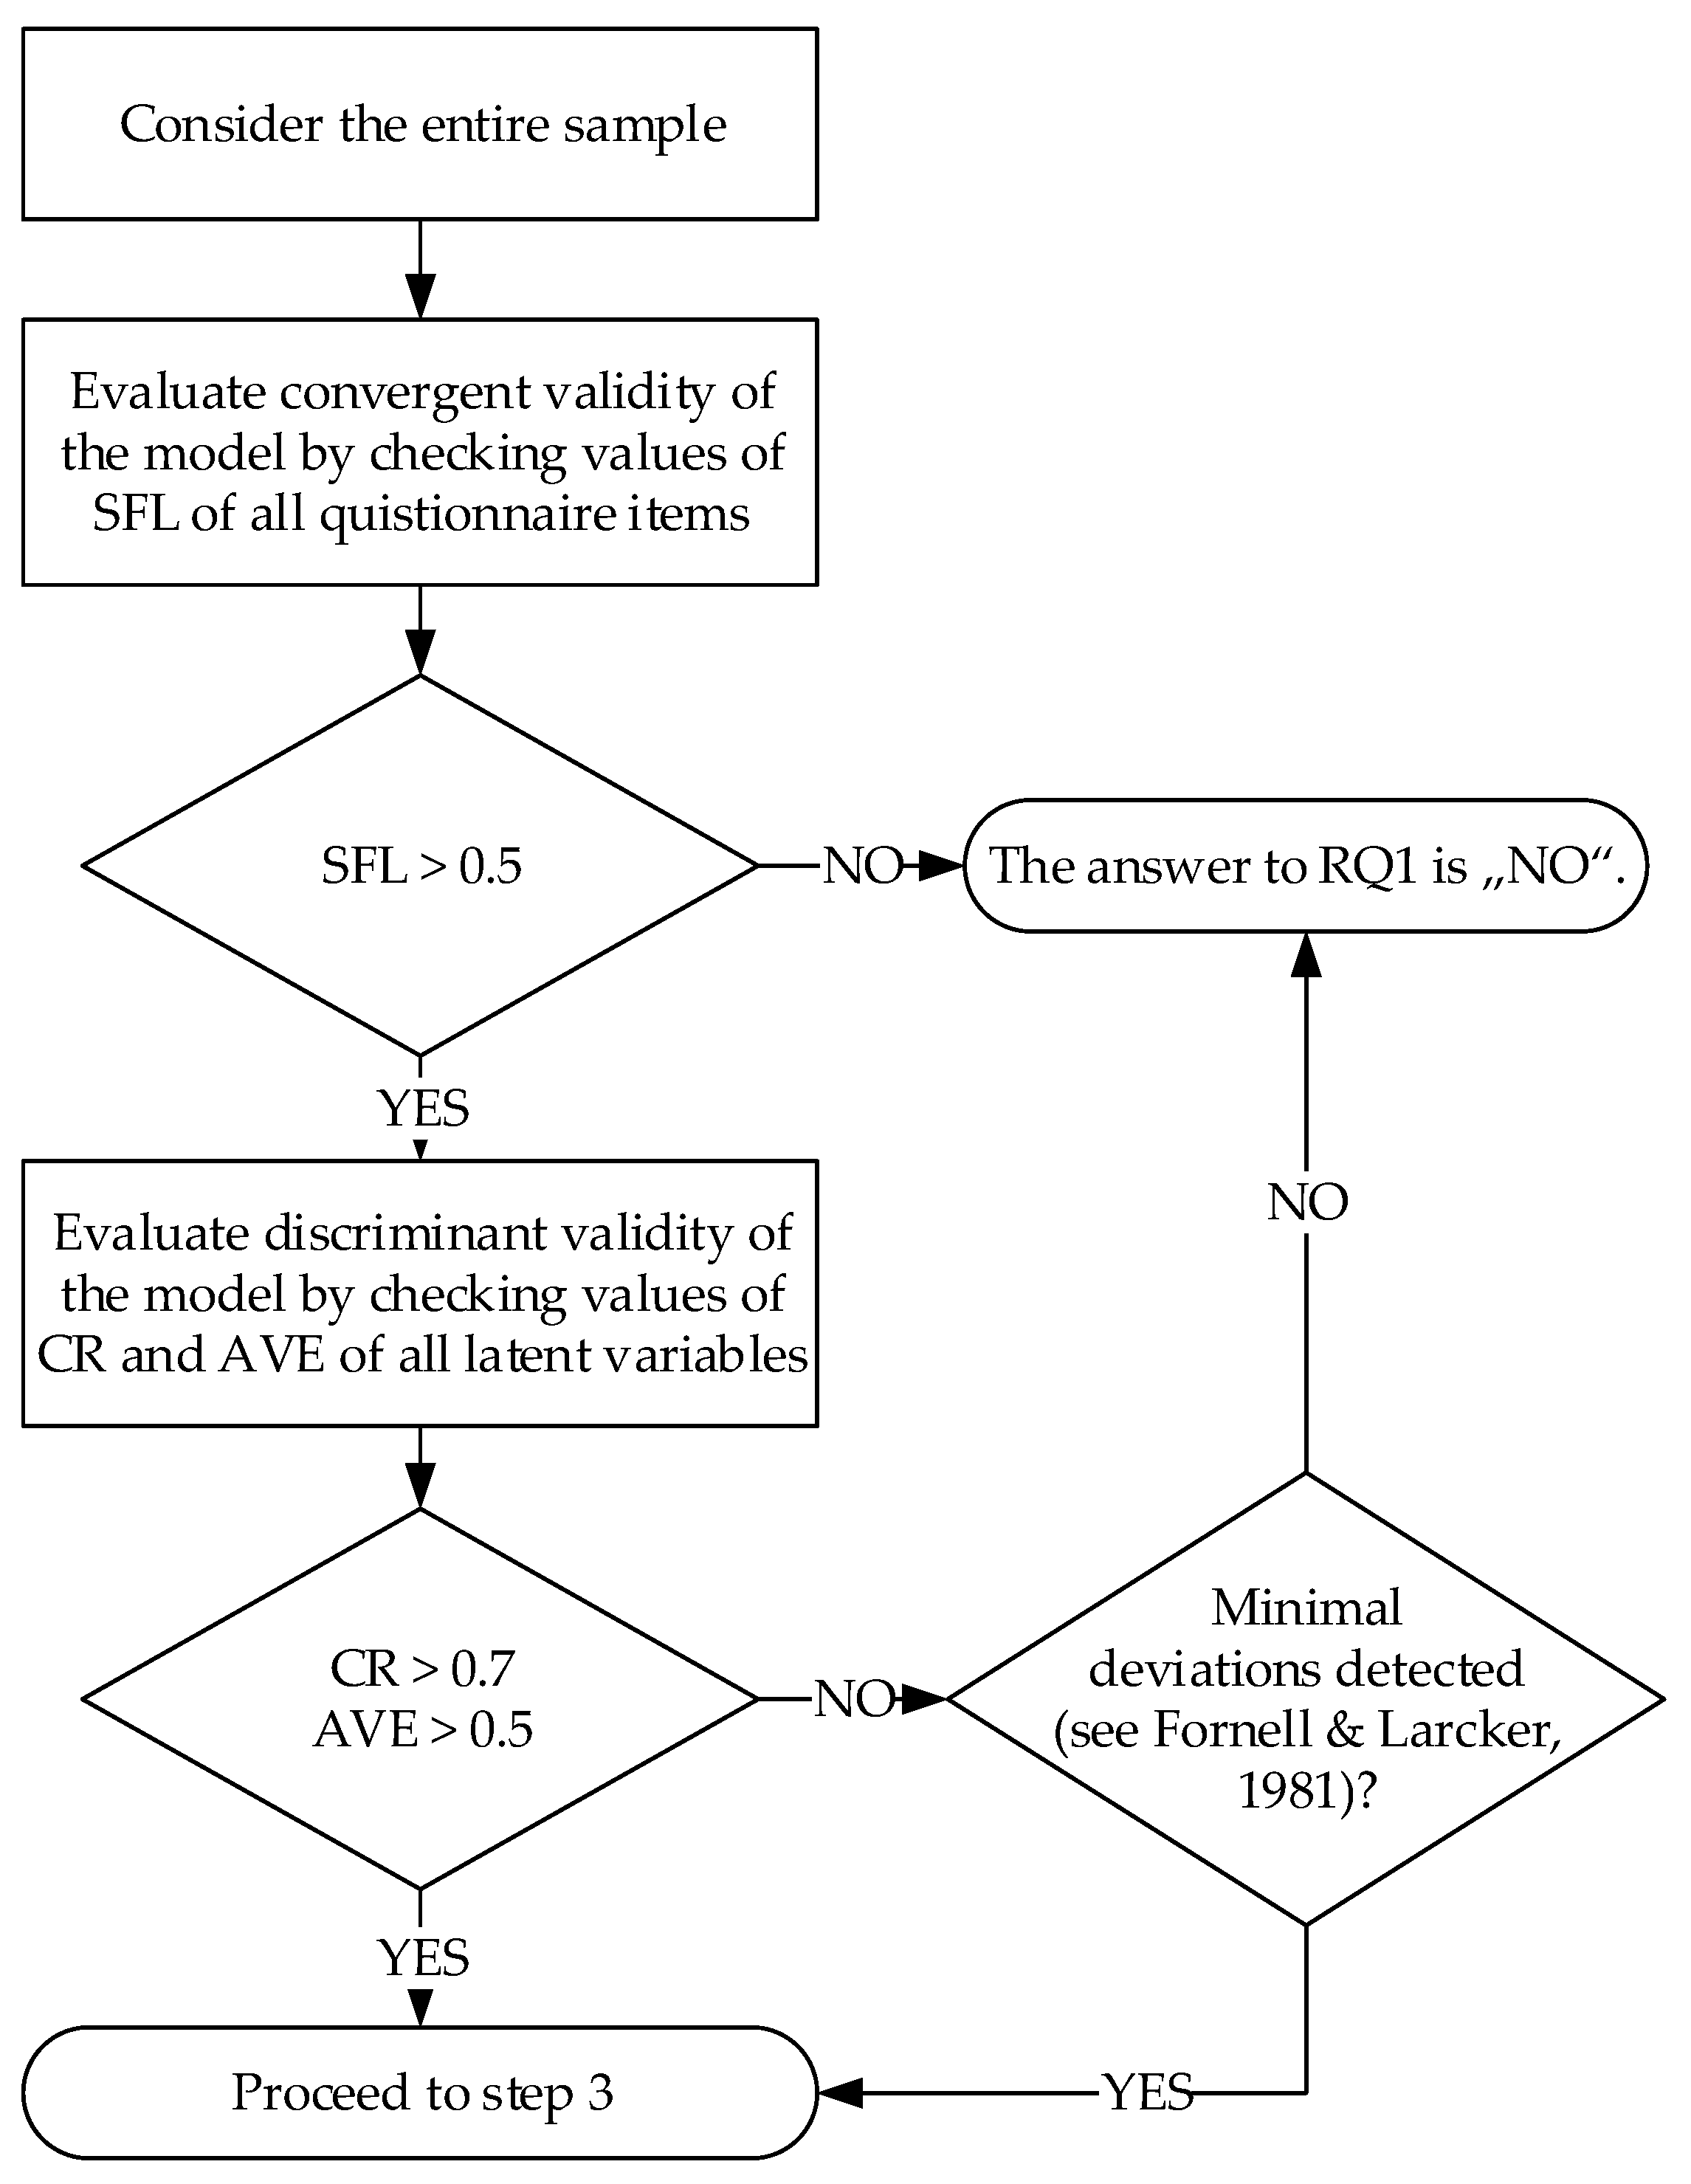
Step 2: Confirmatory Factor Analysis
- convergent validity:
- ○
- standardized factor loadings (SFL), SFL > 0.5 for all questionnaire items;
- discriminant validity:
- ○
- composite reliability (CR), CR > 0.7
- ○
- average variance extracted (AVE), AVE > 0.5 for all latent variables (i.e., model constructs).
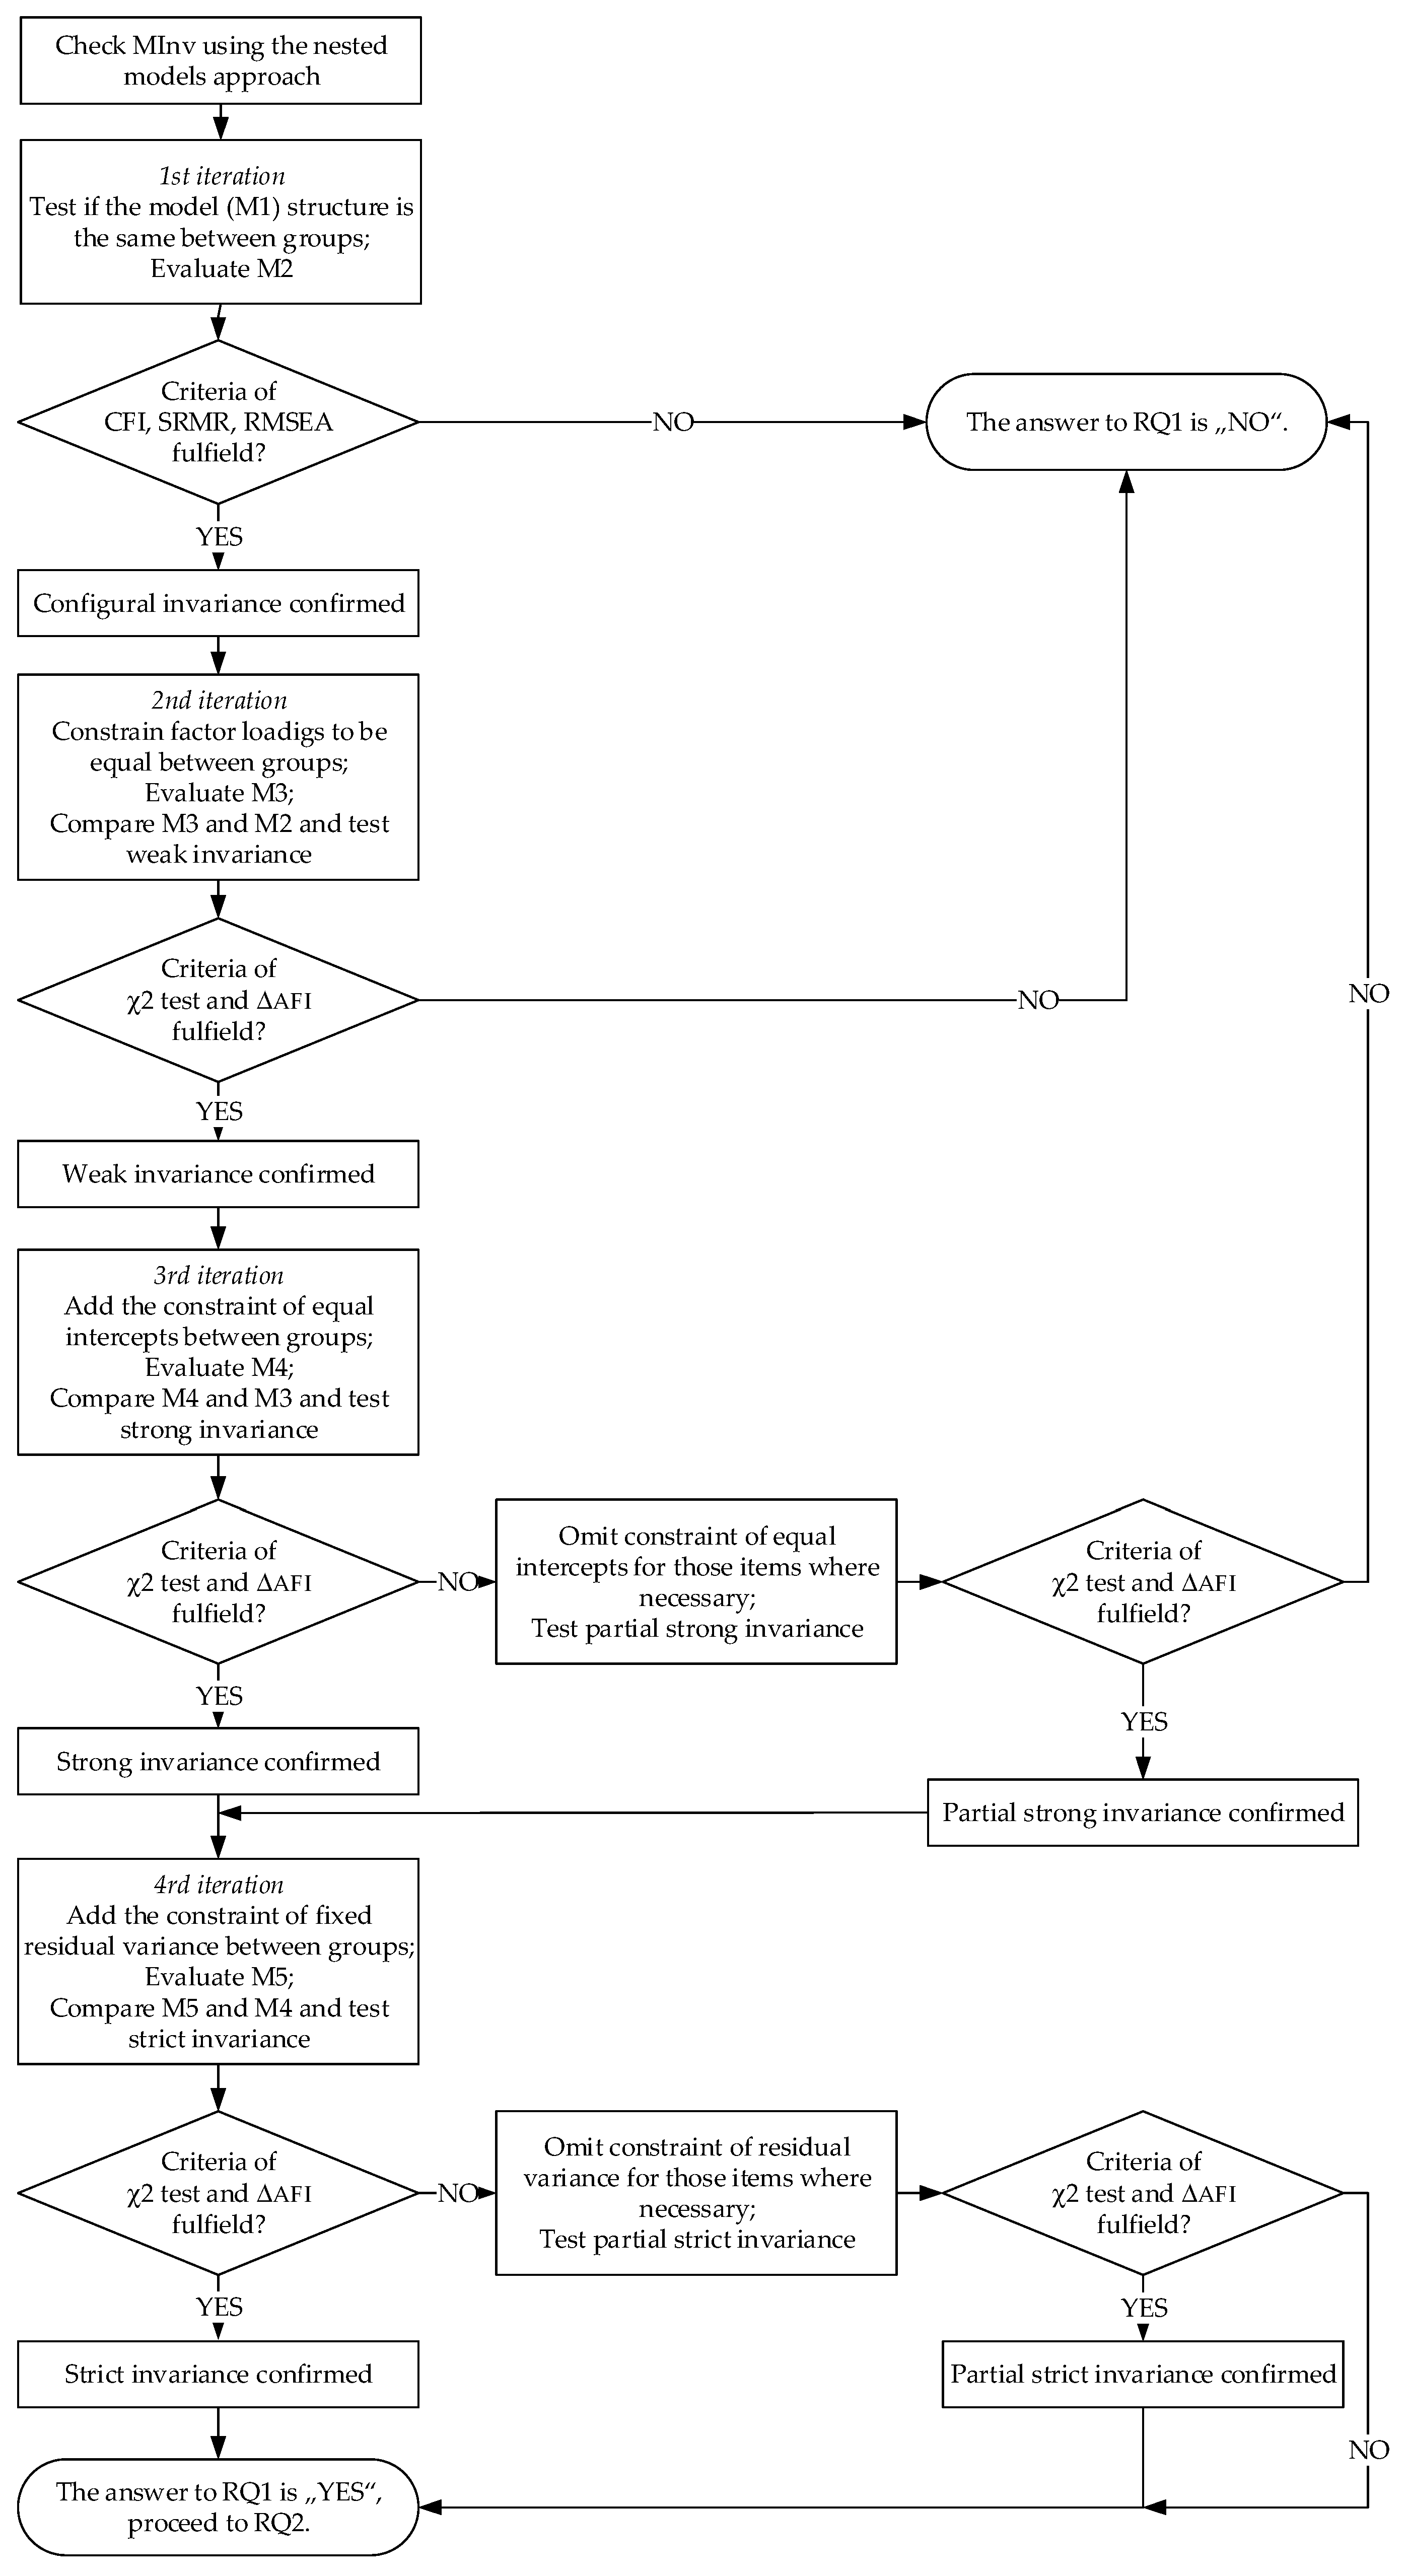
Step 3: Multi-Group Confirmatory Factor Analysis
4.2.2. Structural Model Analysis
5. Results
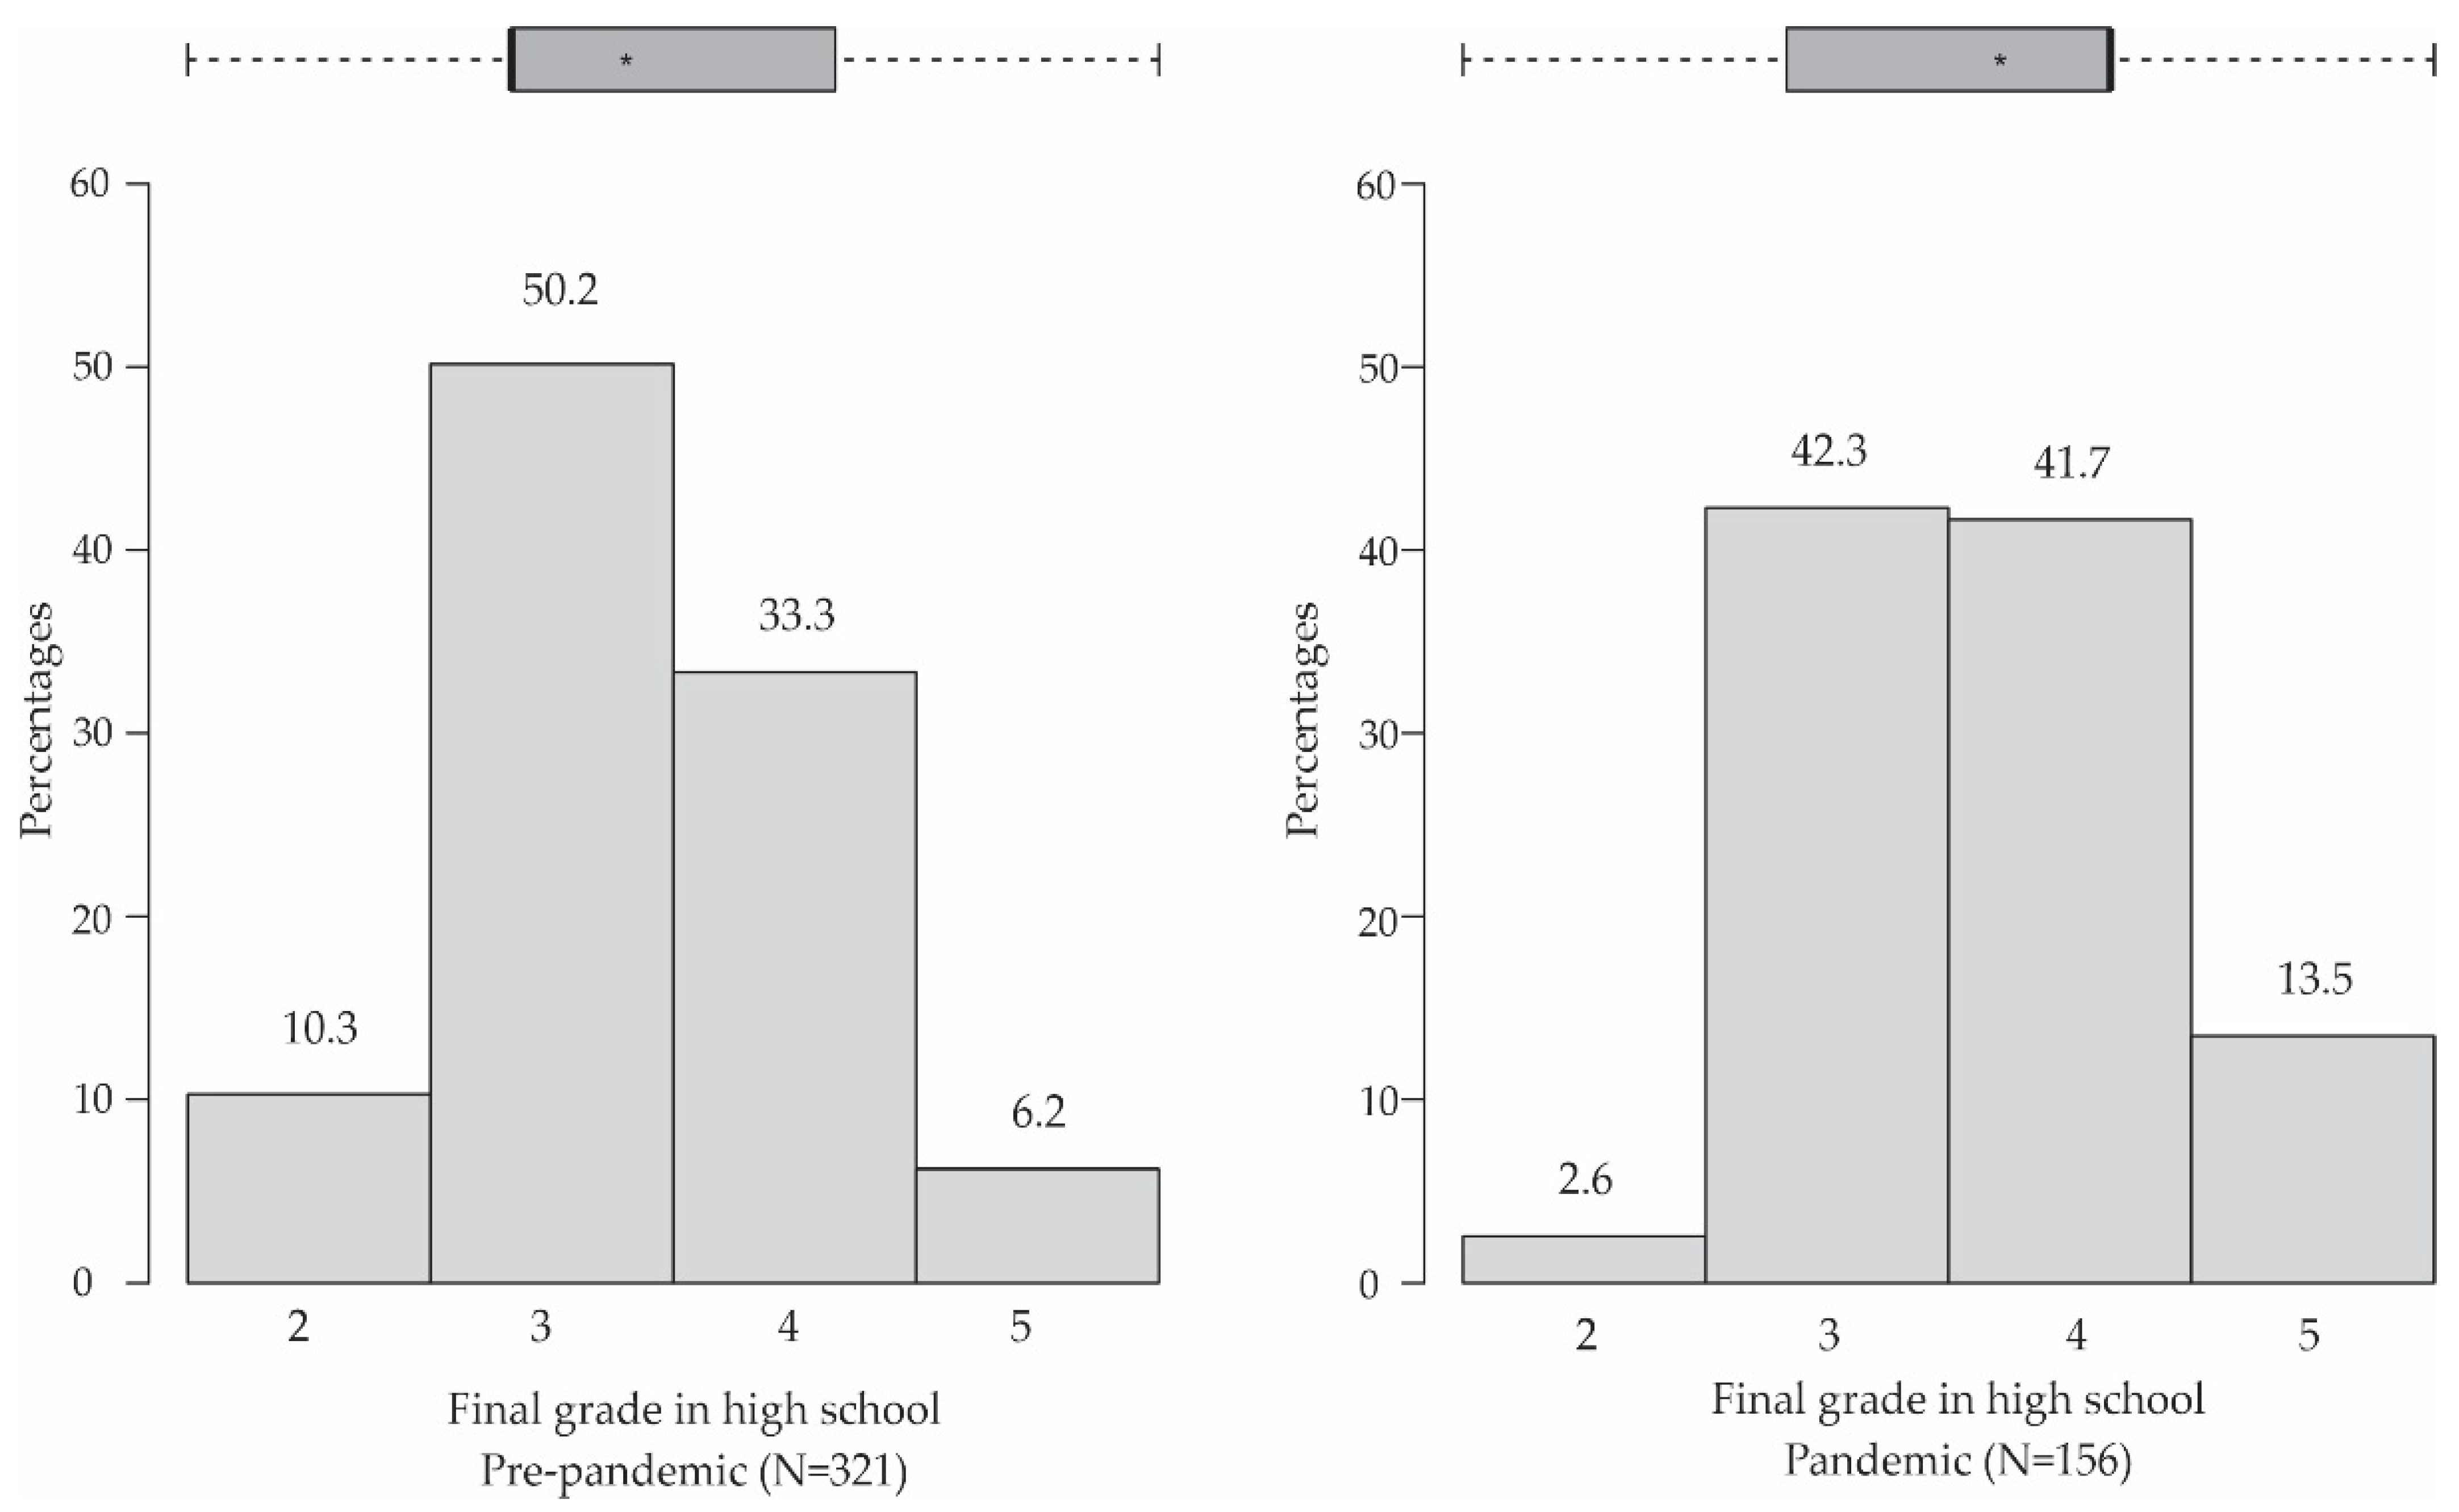
5.1. Sample Characteristics
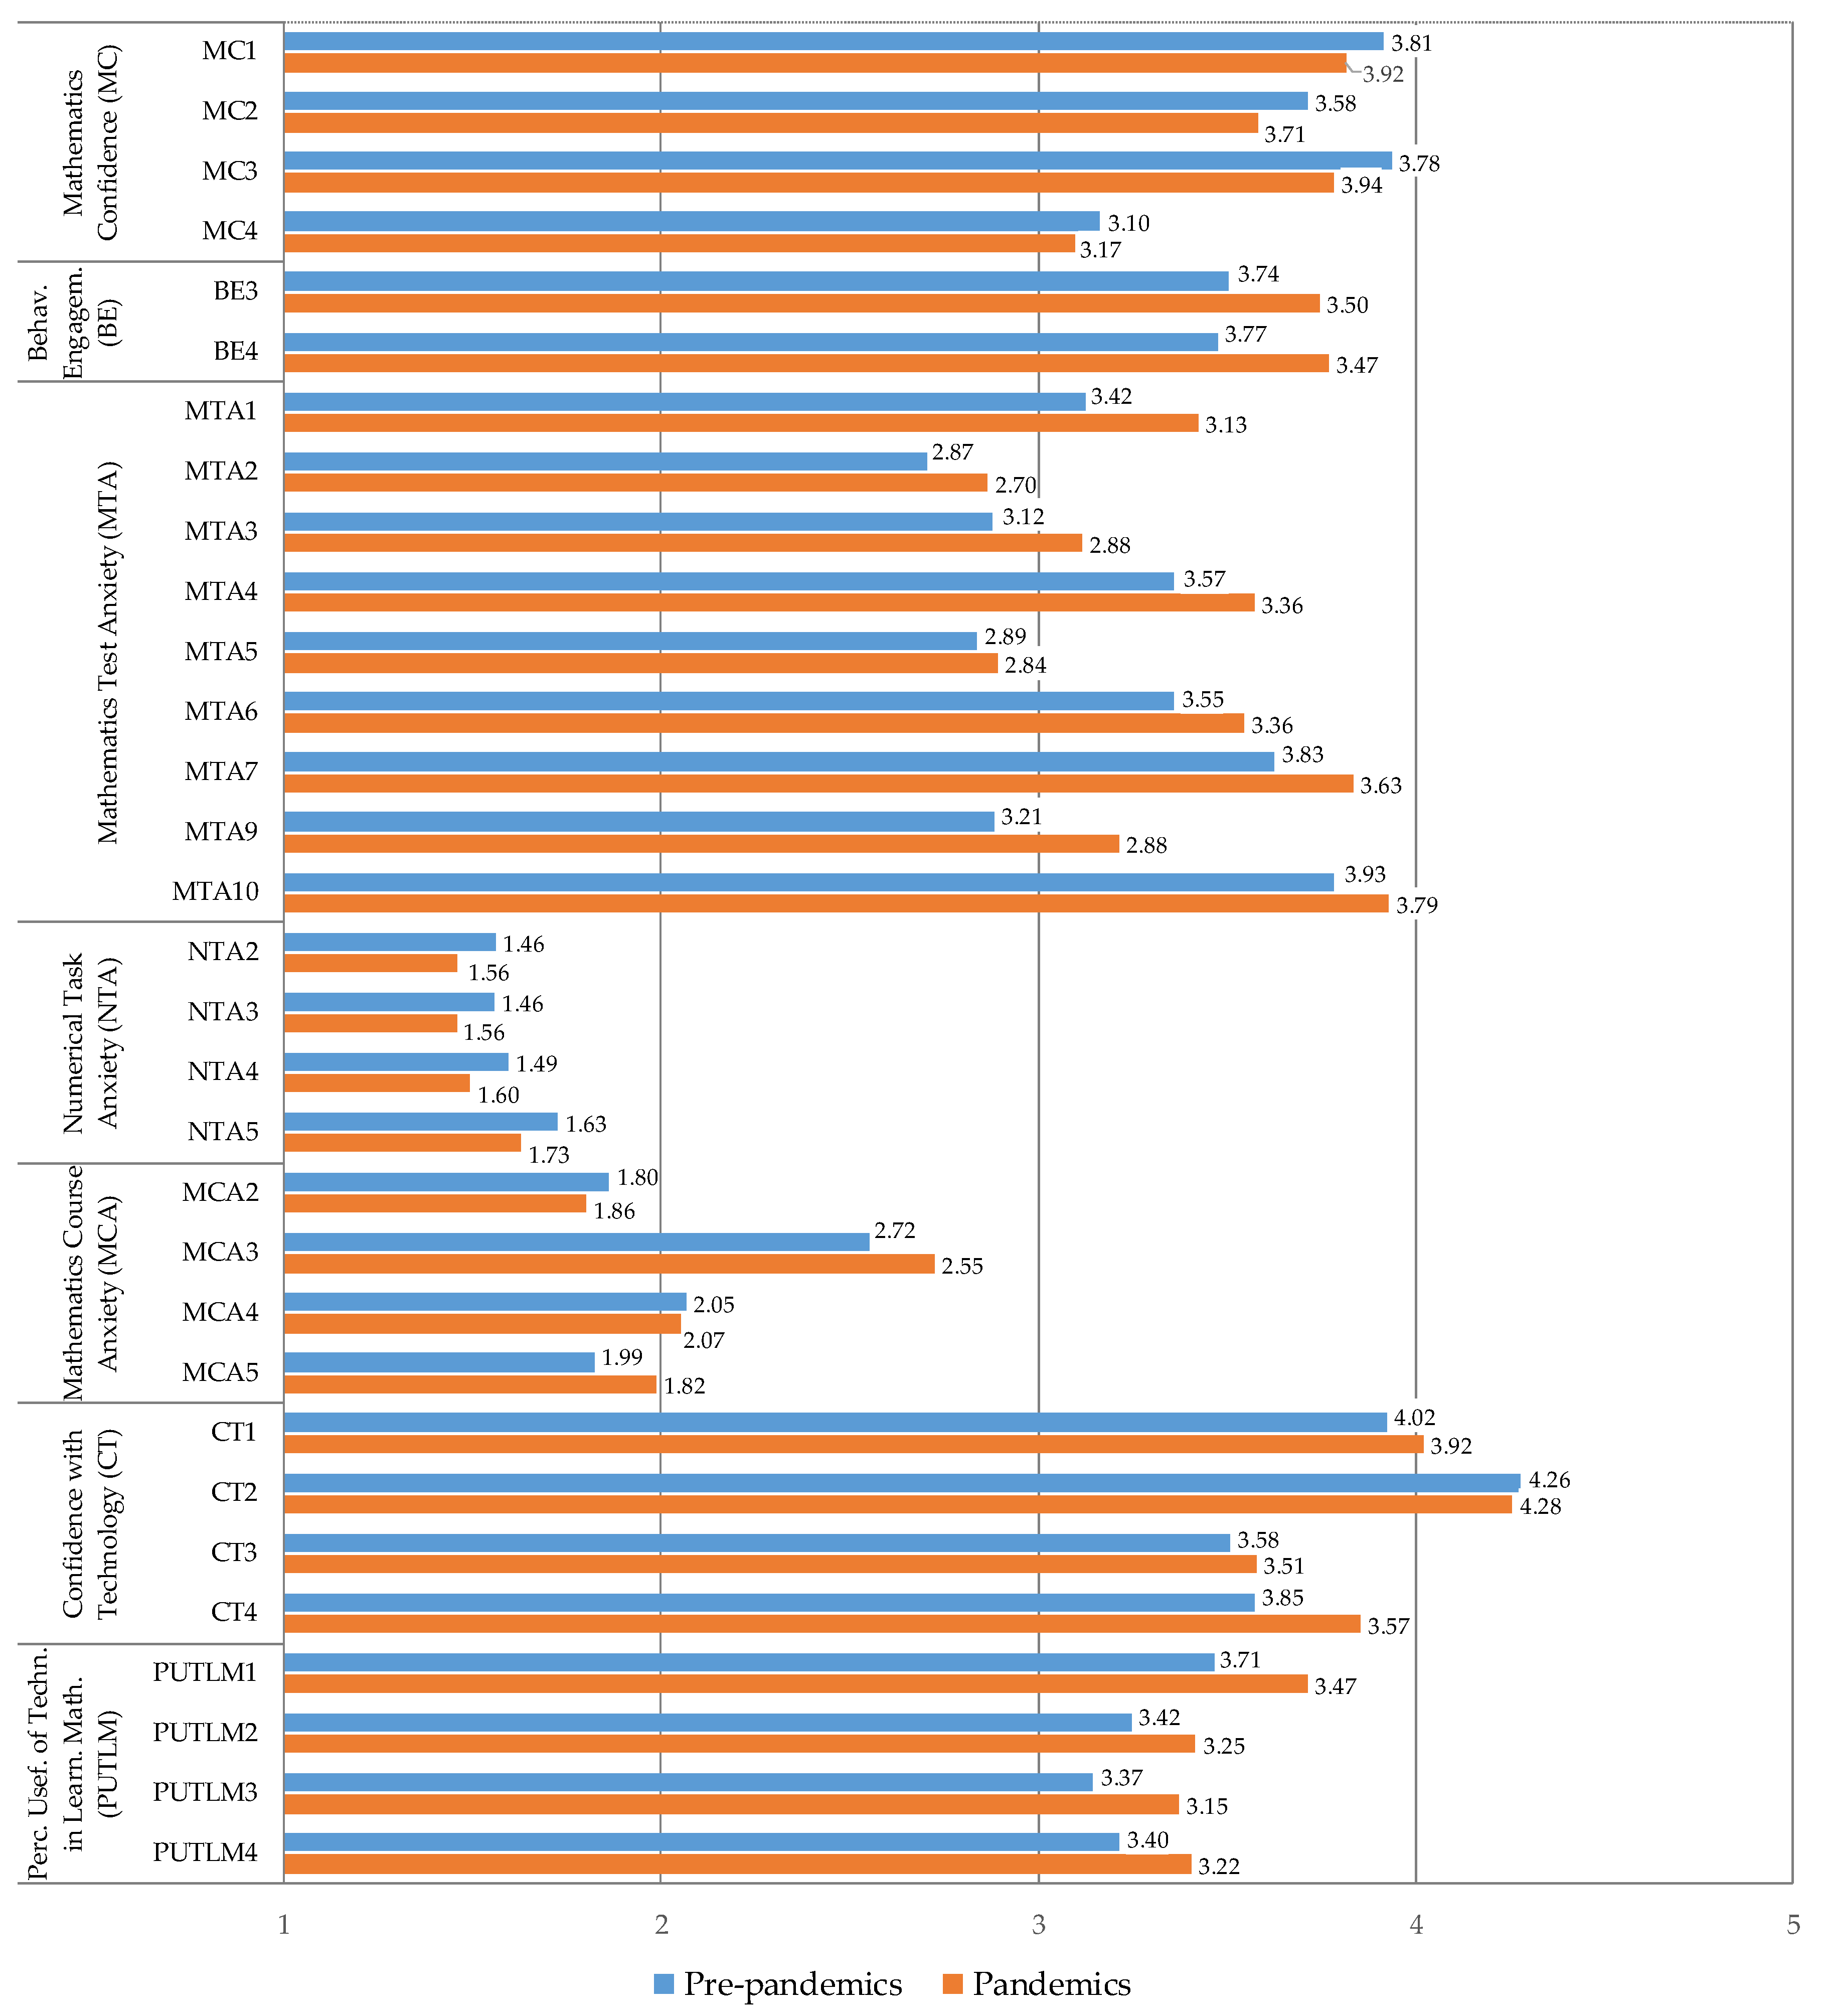
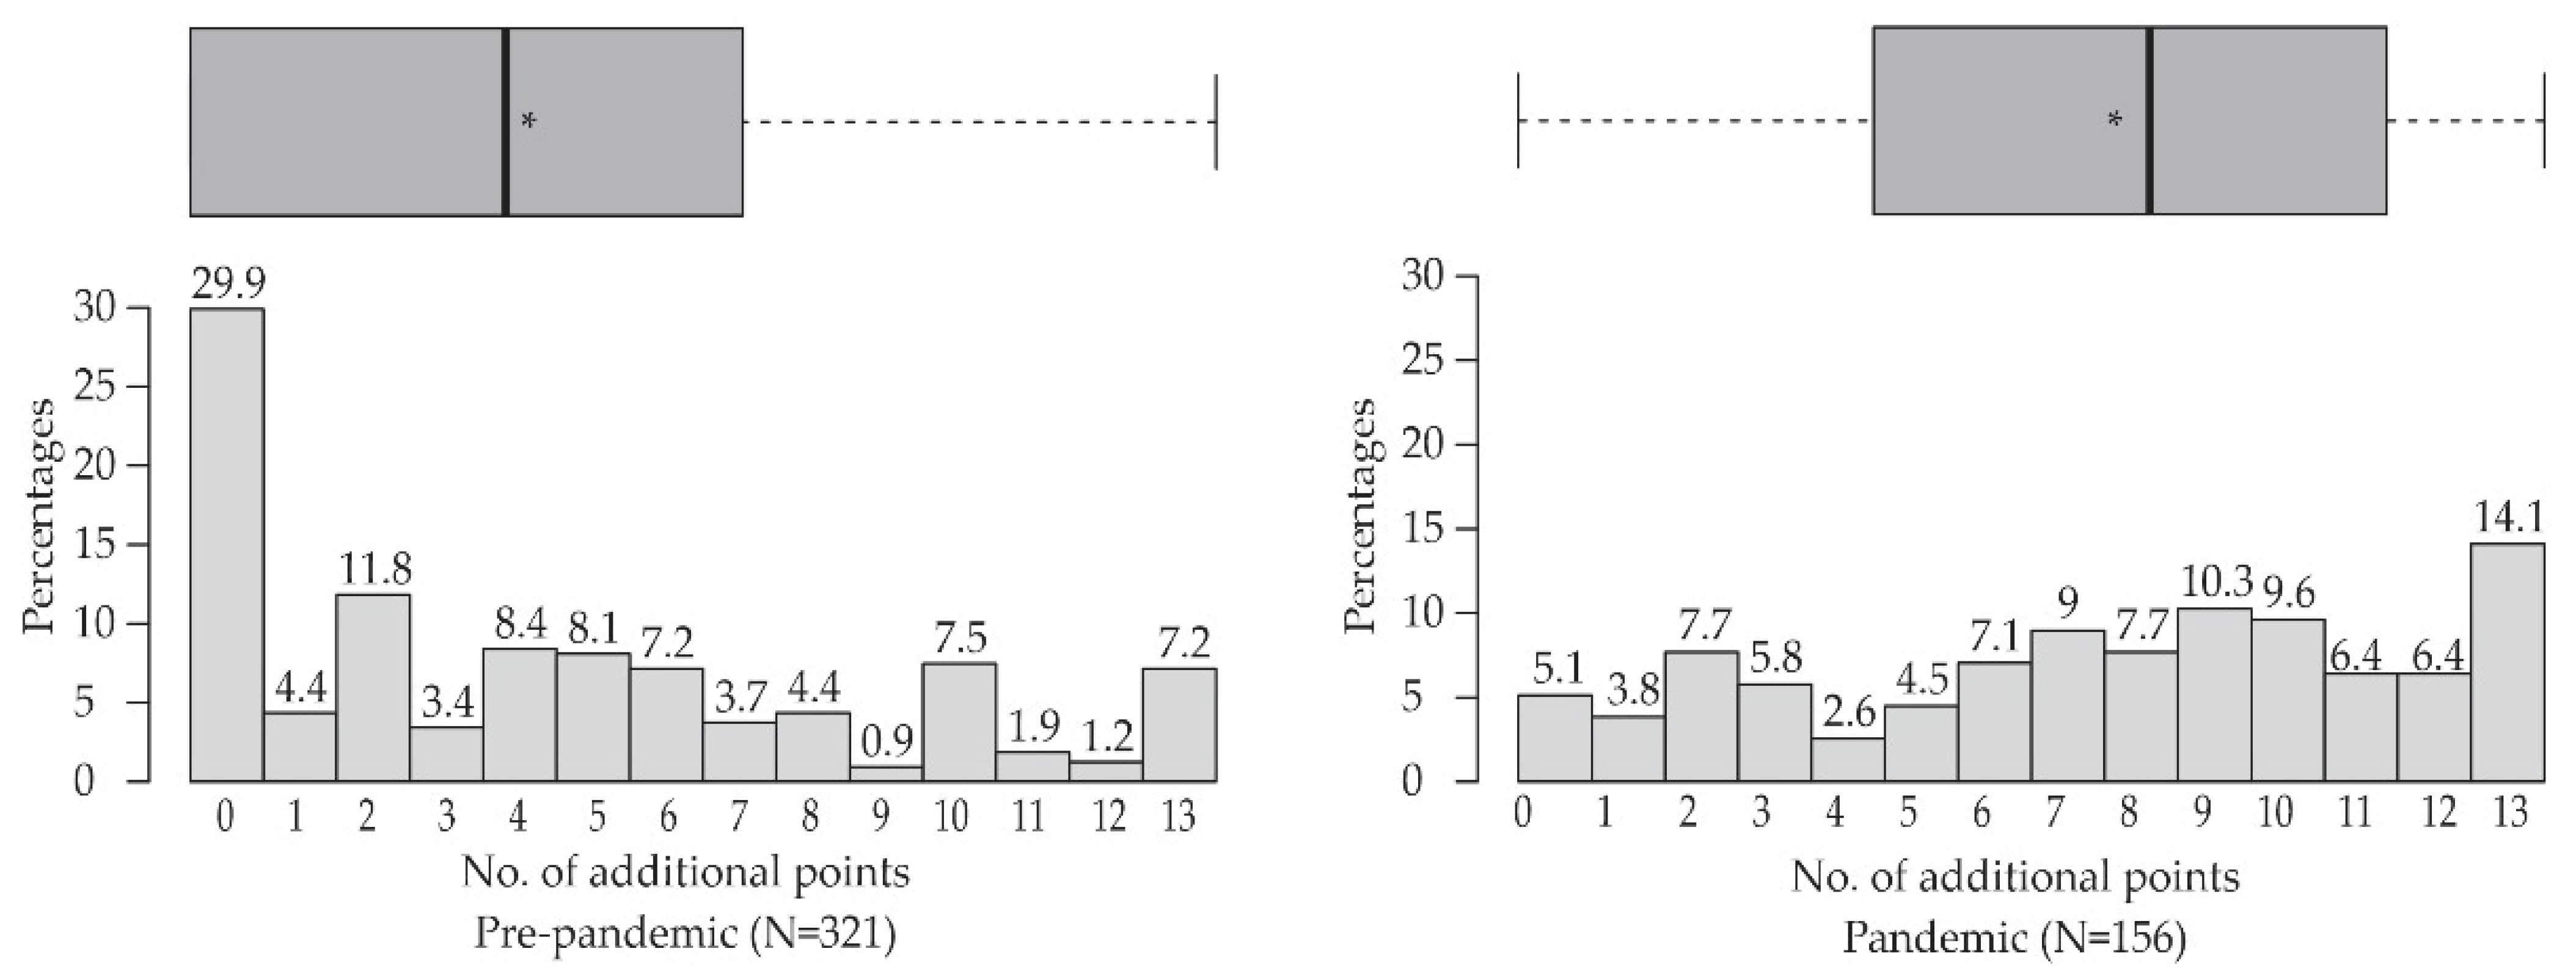
5.2. Descriptive Statistics
5.3. Measurement Model Evaluation
5.3.1. Step 1: Model Overall Fit Evaluation
5.3.2. Step 2: Confirmatory Factor Analysis
5.3.3. Step 3: Multi-Group Confirmatory Factor Analysis
5.4. Structural Model Analysis
5.4.1. Structural Model Evaluation
5.4.2. Hypotheses Testing
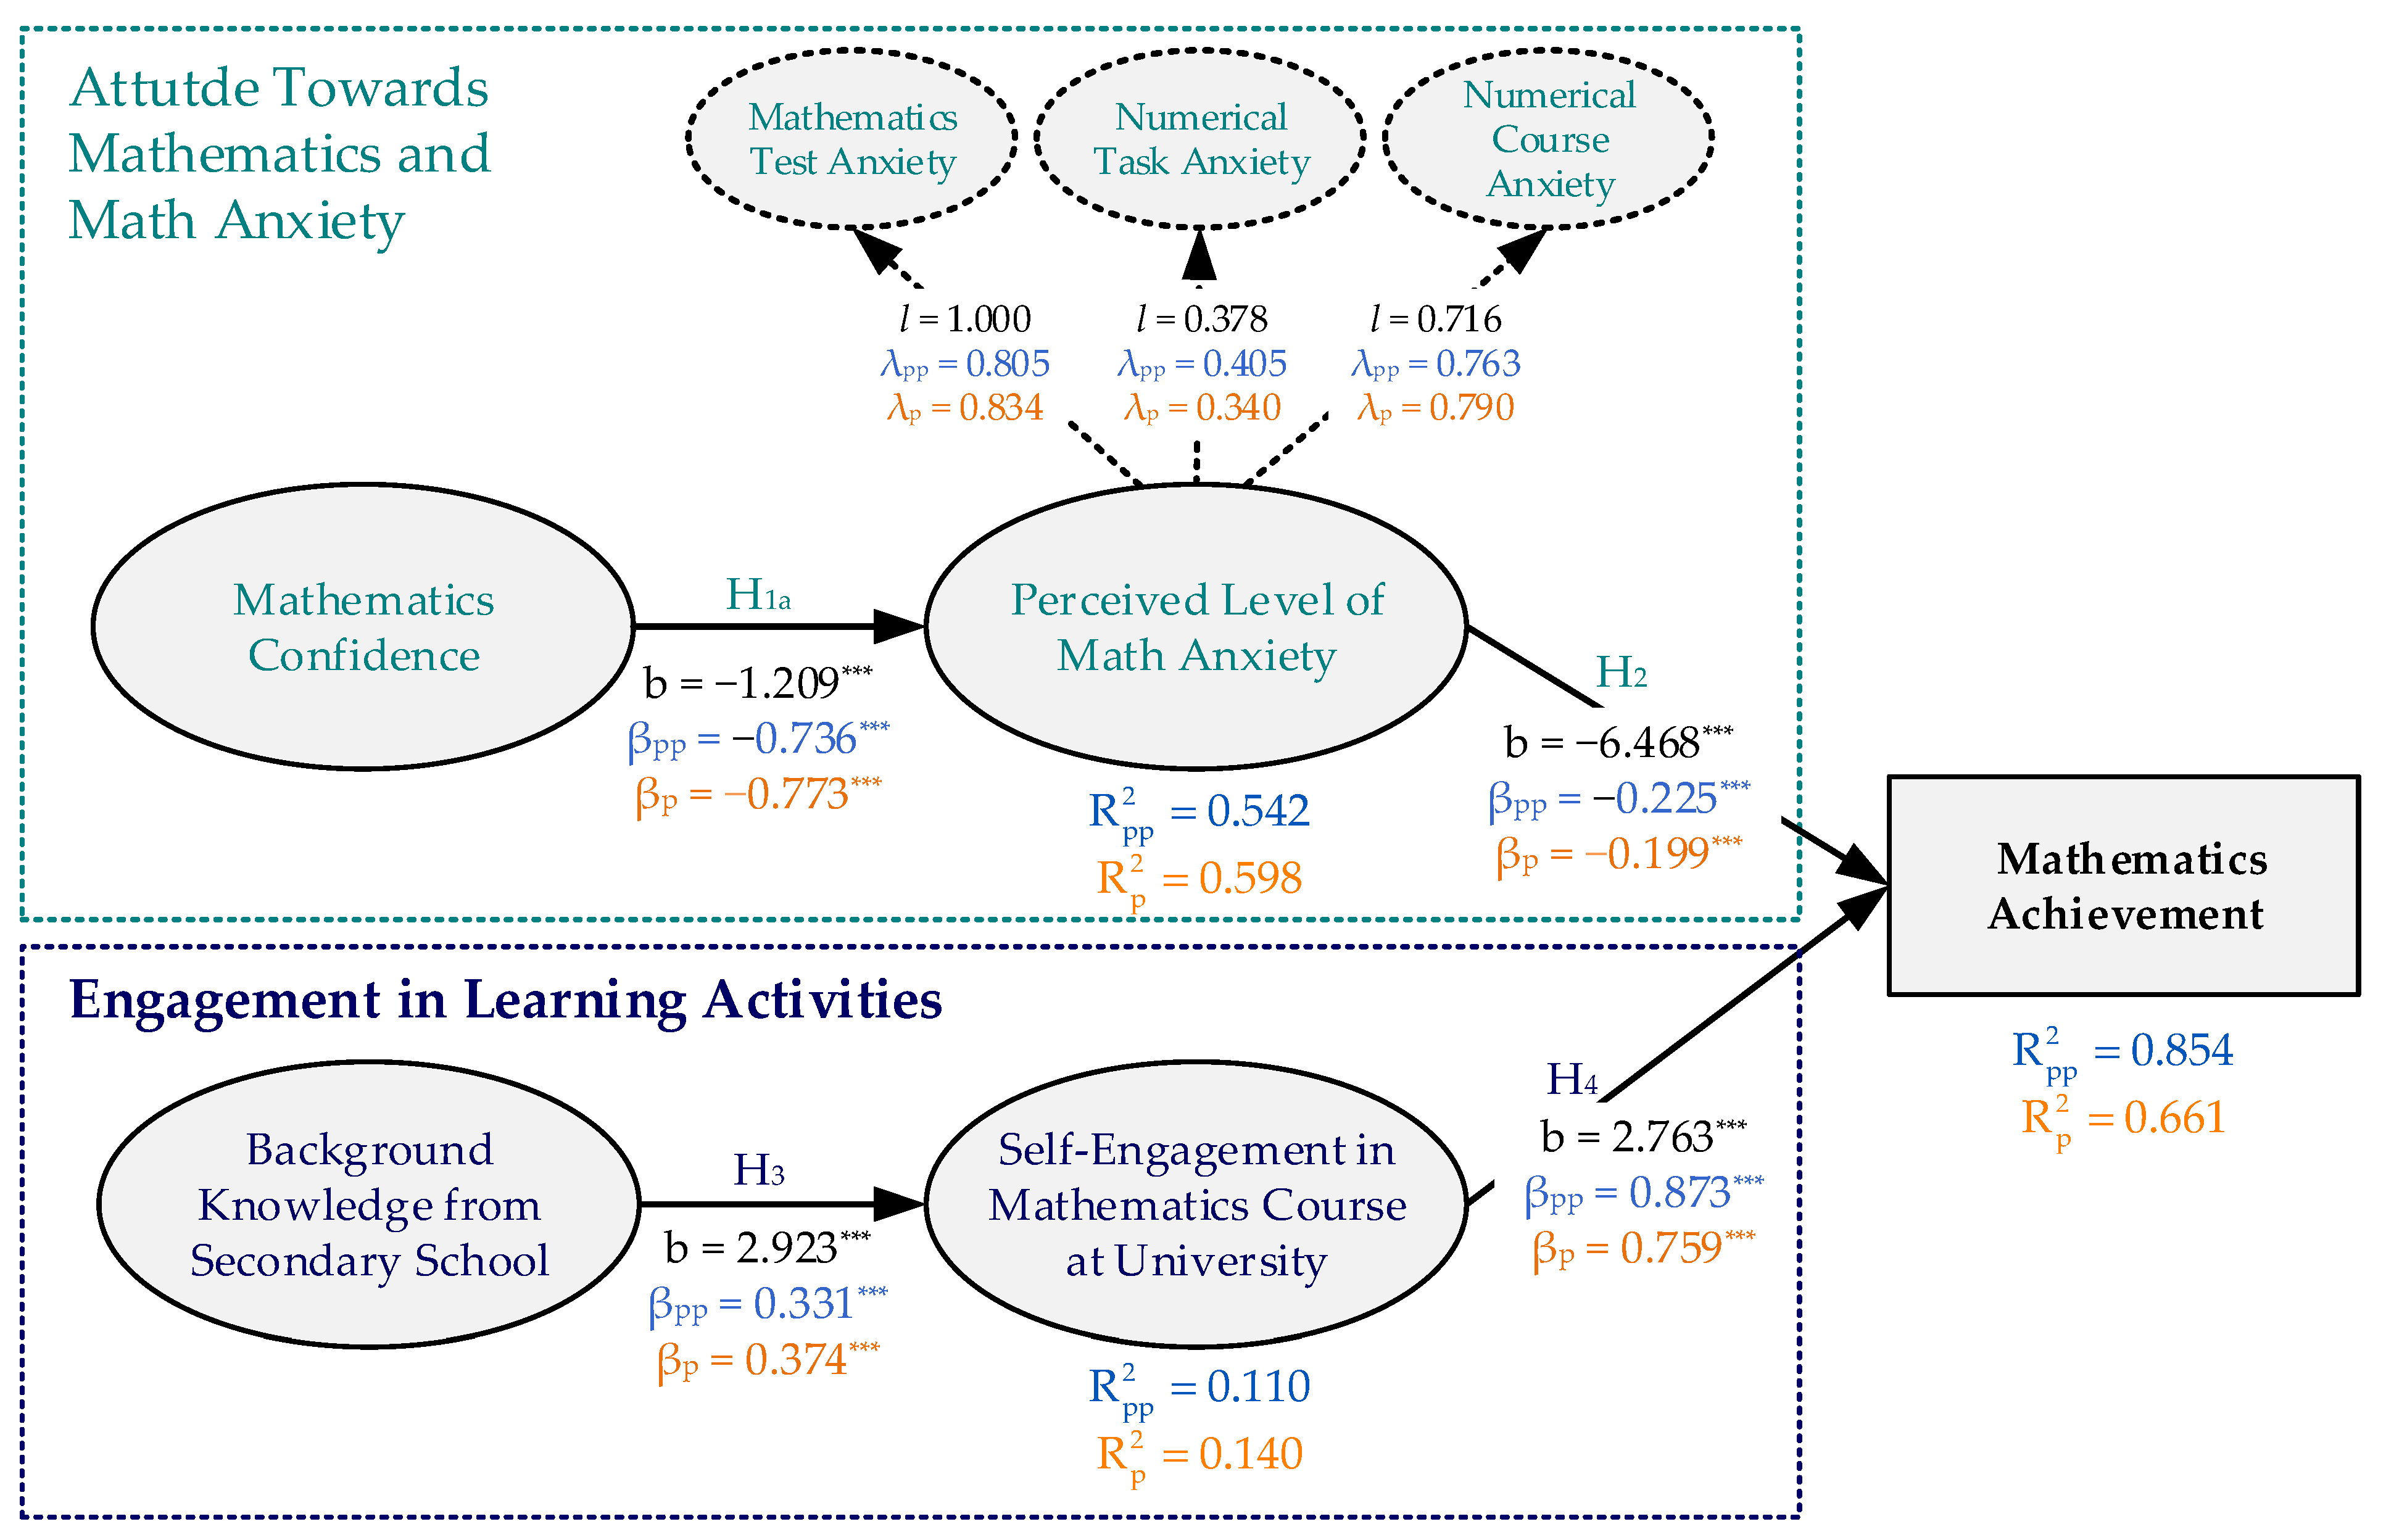
5.4.3. Final Model
6. Discussion and Conclusions
- familiarity with the Moodle learning platform. Even before the pandemic, parts of some courses at our faculty were conducted online via Moodle. Therefore, the professors had at least basic knowledge of and some experience with preparing lessons, quizzes, and other e-activities available in this environment;
- well-adjusted study materials. We strived to construct an authentic and engaging online learning experience. A number of online study materials were made available, including recorded classes and tutorials. In the regular annual student survey at the end of the course, these recordings were highlighted as extremely helpful and important in enriching the learning experience. This is consistent with the findings of Busto et al. [71]. Similarly, in [18], recordings were reported as a useful resource for re-watching portions of a lecture, especially in mathematics courses, where lessons are often broken down by concepts using specific examples;
- a positive attitude of students. We agree with Takács et al. [11], who found that students were capable of effectively adapting to the virtual teaching modality. They recently explored the characteristics and changes in coping skills of university students in three age groups. They found that students pre-pandemic and during the pandemic did not differ with regard to coping skills, but confirmed changes over the past 20 years. The younger students were found to be fast at processing information and less socially efficient compared to older students. Students of generation Z (born between 1995 and 2012) generally see new situations as a positive challenge and deal with them creatively. Vergara [72] also found that students had a positive attitude toward learning mathematics and strong persistence despite the challenges they encountered;
- accessibility and responsiveness of professors. The lack of communication between students (most of the first-year students did not know each other) led to an increased volume of messages and questions addressed directly to the professors. Although it was very time-consuming, we tried to respond in a timely manner. Timely feedback on student work is highly encouraged so that they will maintain a positive outlook in terms of their capabilities [73].
Author Contributions
Funding
Informed Consent Statement
Data Availability Statement
Acknowledgments
Conflicts of Interest
Appendix A

| Construct | Questionnaire Item | Unst. Factor Loading | Error Term | Z-Value | Stand. Factor Loading |
|---|---|---|---|---|---|
| Mathematics Confidence (MC) | MC1 | 1.000 | - a | - a | 0.563 |
| MC2 | 1.607 | 0.146 | 11.013 | 0.806 | |
| MC3 | 1.374 | 0.130 | 10.603 | 0.757 | |
| MC4 | 2.002 | 0.173 | 11.558 | 0.866 | |
| Behavioral Engagement (BE) | BE3 | 1.000 | - a | - a | 0.728 |
| BE4 | 1.237 | 0.113 | 10.941 | 0.896 | |
| Mathematics Test Anxiety (MTA) | MTA1 | 1.000 | - a | - a | 0.735 |
| MTA2 | 0.928 | 0.053 | 17.359 | 0.758 | |
| MTA3 | 1.018 | 0.047 | 21.758 | 0.811 | |
| MTA4 | 1.031 | 0.042 | 24.366 | 0.811 | |
| MTA5 | 0.943 | 0.070 | 13.516 | 0.687 | |
| MTA6 | 1.090 | 0.070 | 15.490 | 0.806 | |
| MTA7 | 1.084 | 0.068 | 15.906 | 0.767 | |
| MTA9 | 0.858 | 0.058 | 14.831 | 0.639 | |
| MTA10 | 0.815 | 0.068 | 11.986 | 0.580 | |
| Numerical Task Anxiety (NTA) | NTA2 | 1.000 | - a | - a | 0.920 |
| NTA3 | 0.991 | 0.037 | 26.950 | 0.931 | |
| NTA4 | 0.986 | 0.033 | 30.322 | 0.925 | |
| NTA5 | 1.000 | 0.050 | 19.970 | 0.857 | |
| Mathematics Course Anxiety (MCA) | MCA1 | 1.000 | - a | - a | 0.660 |
| MCA2 | 1.330 | 0.159 | 8.365 | 0.730 | |
| MCA3 | 1.156 | 0.089 | 13.048 | 0.724 | |
| MCA4 | 1.146 | 0.099 | 11.597 | 0.695 | |
| Perceived Level of Mathematics Anxiety (PLMA) | MTA | 1.000 | - a | - a | 0.814 |
| NTA | 0.401 | 0.088 | 4.533 | 0.379 | |
| MCA | 0.735 | 0.097 | 7.613 | 0.801 | |
| Background Knowledge from Secondary School (BKSS) | Grade in mathematics in final year | 1.000 | - a | - a | 0.936 |
| Grade in mathematics at matura | 0.727 | 0.082 | 8.896 | 0.649 | |
| Final grade in high school | 0.533 | 0.049 | 10.954 | 0.594 | |
| Self-Engagement in Mathematics Course at University (SEMCU) | e-Activities | 1.000 | - a | - a | 0.783 |
| Additional points | 0.268 | 0.039 | 6.776 | 0.544 | |
| Confidence With Technology (CT) | CT1 | 1.000 | - a | -a | 0.880 |
| CT2 | 0.689 | 0.044 | 15.834 | 0.721 | |
| CT3 | 1.115 | 0.056 | 19.849 | 0.848 | |
| CT4 | 0.782 | 0.053 | 14.650 | 0.658 | |
| Perceived Usefulness of Technology in Learning Mathematics (PUTLM) | PUTLM1 | 1.000 | - a | - a | 0.880 |
| PUTLM2 | 0.689 | 0.044 | 15.834 | 0.721 | |
| PUTLM3 | 1.115 | 0.056 | 19.849 | 0.848 | |
| PUTLM4 | 0.782 | 0.053 | 14.650 | 0.658 |
References
- Chaturvedi, K.; Vishwakarma, D.K.; Singh, N. COVID-19 and its impact on education, social life and mental health of students: A survey. Child. Youth Serv. Rev. 2021, 121, 105866. [Google Scholar] [CrossRef] [PubMed]
- Al-Maskari, A.; Al-Riyami, T.; Kunjumuhammed, S.K. Students academic and social concerns during COVID-19 Pandemic. Educ. Inf. Technol. 2022, 27, 1–21. [Google Scholar] [CrossRef] [PubMed]
- Pokhrel, S.; Chhetri, R. A literature review on impact of COVID-19 pandemic on teaching and learning. High. Educ. Future 2021, 8, 133–141. [Google Scholar] [CrossRef]
- Clark, A.E.; Nong, H.; Zhu, H.; Zhu, R. Compensating for academic loss: Online learning and student performance during the COVID-19 pandemic. China Econ. Rev. 2021, 68, 101629. [Google Scholar] [CrossRef]
- Camacho-Zuñiga, C.; Pego, L.; Escamilla, J.; Hosseini, S. The impact of the COVID-19 pandemic on students’ feelings at high school, undergraduate, and postgraduate levels. Heliyon 2021, 7, e06465. [Google Scholar] [CrossRef]
- Hammerstein, S.; König, C.; Dreisörner, T.; Frey, A. Effects of COVID-19-related school closures on student achievement—A systematic review. Front. Psychol. 2021, 12, 746289. [Google Scholar] [CrossRef]
- Panagouli, E.; Stavridou, A.; Savvidi, C.; Kourti, A.; Sergentanis, T.; Tsitsika, A. School performance among children and adolescents during COVID-19 pandemic: A Systematic review. Children 2021, 8, 1134. [Google Scholar] [CrossRef]
- Svaleryd, H.; Vlachos, J. COVID-19 and School Closures; GLO Discussion Paper Series; Global Labor Organization (GLO): Geneva, Switzerland, 2022. [Google Scholar]
- Soesanto, R.H.; Dirgantoro, K.P.S. Commemorating one-year of the COVID-19 pandemic: Indonesian and international issues of secondary and tertiary mathematics learning. Int. J. Stud. Educ. Sci. 2021, 2, 18–35. [Google Scholar] [CrossRef]
- Al Ghazali, F. Challenges and opportunities of fostering learner autonomy and self-access learning during the COVID-19 pandemic. Stud. Self-Access Learn. J. 2020, 11, 114–127. [Google Scholar] [CrossRef]
- Takács, R.; Takács, S.; Kárász, J.T.; Horváth, Z.; Oláh, A. Exploring coping strategies of different generations of students starting university. Front. Psychol. 2021, 12, 740569. [Google Scholar] [CrossRef]
- De Paola, M.; Gioia, F.; Scoppa, V. Online Teaching, Procrastination and Students’ Achievement: Evidence from COVID-19 Induced Remote Learning; IZA Discussion Papers; Institute of Labor Economics (IZA): Bonn, Germany, 2022. [Google Scholar]
- Kofoed, M.S.; Gebhart, L.; Gilmore, D.; Moschitto, R. Zooming to Class?: Experimental Evidence on College Students’ Online Learning during COVID-19; IZA Discussion Papers; Institute of Labor Economics (IZA): Bonn, Germany, 2021. [Google Scholar]
- Orlov, G.; McKee, D.; Berry, J.; Boyle, A.; DiCiccio, T.; Ransom, T.; Rees-Jones, A.; Stoye, J. Learning during the COVID-19 Pandemic: It is not who you teach, but how you teach. Econ. Lett. 2021, 202, 109812. [Google Scholar] [CrossRef]
- Gonzalez, T.; De la Rubia, M.A.; Hincz, K.P.; Comas-Lopez, M.; Subirats, L.; Fort, S.; Sacha, G.M. Influence of COVID-19 confinement on students’ performance in higher education. PLoS ONE 2020, 15, e0239490. [Google Scholar] [CrossRef] [PubMed]
- Pócsová, J.; Mojžišová, A.; Takáč, M.; Klein, D. The impact of the COVID-19 pandemic on teaching mathematics and students’ knowledge, skills, and grades. Educ. Sci. 2021, 11, 225. [Google Scholar] [CrossRef]
- Tomal, J.; Rahmati, S.; Boroushaki, S.; Jin, L.; Ahmed, E. The impact of COVID-19 on students’ marks: A Bayesian hierarchical modeling approach. METRON 2021, 79, 57–91. [Google Scholar] [CrossRef] [PubMed]
- Bonsangue, M.V.; Clinkenbeard, J.E. A Comparison of American student and faculty experiences in mathematics courses during the COVID-19 pandemic. Int. J. Educ. Res. Open 2021, 2, 100075. [Google Scholar] [CrossRef]
- Brezavšček, A.; Jerebic, J.; Rus, G.; Žnidaršič, A. Factors influencing mathematics achievement of university students of social sciences. Mathematics 2020, 8, 2134. [Google Scholar] [CrossRef]
- Kline, R.B. Convergence of Structural Equation Modeling and Multilevel Modeling. In The SAGE Handbook of Innovation in Social Research Methods; SAGE Publications Ltd.: London, UK, 2011; pp. 562–589. [Google Scholar]
- Beaujean, A.A. Latent Variable Modeling Using R: A Step-by-Step Guide; Routledge: New York, NY, USA, 2014. [Google Scholar]
- Gao, Y.; Wong, S.L.; Khambari, M.N.; Noordin, N. A Bibliometric analysis of the scientific production of e-learning in higher education (1998–2020). Int. J. Inf. Educ. Technol. 2022, 12, 390–399. [Google Scholar] [CrossRef]
- Paiva, J.; Abreu, A.; Costa, E. Distance learning in higher education during the COVID-19 pandemic: A systematic literature review. Res. Bull. Cad. Investig. Master E-Bus. 2021, 1, 1–12. [Google Scholar]
- Del Carmen Valls Martínez, M.; Martín-Cervantes, P.A.; Sánchez Pérez, A.M.; del Carmen Martínez Victoria, M. Learning mathematics of financial operations during the COVID-19 Era: An assessment with partial least squares structural equation modeling. Mathematics 2021, 9, 2120. [Google Scholar] [CrossRef]
- Alangari, T.S. Online STEM education during COVID-19 period: A systematic review of perceptions in higher education. Eurasia J. Math. Sci. Technol. Educ. 2022, 18, em2105. [Google Scholar] [CrossRef]
- Ní Fhloinn, E.; Fitzmaurice, O. Challenges and opportunities: Experiences of mathematics lecturers engaged in emergency remote teaching during the COVID-19 pandemic. Mathematics 2021, 9, 2303. [Google Scholar] [CrossRef]
- Bloom, B.S.; Englehart, M.D.; Furst, E.J.; Hill, W.H.; Krathwohl, D.R. Taxonomy of Educational Objectives, Handbook I: The Cognitive Domain; David McKay Co. Inc.: New York, NY, USA, 1956. [Google Scholar]
- Rosillo, N.; Montes, N. Escape room dual mode approach to teach maths during the COVID-19 era. Mathematics 2021, 9, 2602. [Google Scholar] [CrossRef]
- Mendoza Velazco, D.; Cejas, M.; Rivas, G.; Varguillas, C. Anxiety as a prevailing factor of performance of university mathematics students during the COVID-19 pandemic. Educ. Sci. J. 2021, 23, 94–113. [Google Scholar] [CrossRef]
- Lanius, M.; Jones, T.F.; Kao, S.; Lazarus, T.; Farrell, A. Unmotivated, depressed, anxious: Impact of the COVID-19 emergency transition to remote learning on undergraduates’ math anxiety. J. Humanist Math. 2022, 12, 148–171. [Google Scholar] [CrossRef]
- Ludwig, J. Poor performance in undergraduate math: Can we blame it on COVID-19 Despair? Int. J. Innov. Sci. Math. 2021, 9, 31–40. [Google Scholar]
- Reinhold, F.; Schons, C.; Scheuerer, S.; Gritzmann, P.; Richter-Gebert, J.; Reiss, K. Students’ coping with the self-regulatory demand of crisis-driven digitalization in university mathematics instruction: Do motivational and emotional orientations make a difference? Comput. Hum. Behav. 2021, 120, 106732. [Google Scholar] [CrossRef]
- Kargar, M.; Tarmizi, R.A.; Bayat, S. Relationship between mathematical thinking, mathematics anxiety and mathematics attitudes among university students. Procedia—Soc. Behav. Sci. 2010, 8, 537–542. [Google Scholar] [CrossRef] [Green Version]
- Enu, J.; Agyman, O.K.; Nkum, D. Factors influencing students’ mathematics performance in some selected colleges of education in Ghana. Int. J. Educ. Learn. Dev. 2015, 3, 68–74. [Google Scholar]
- Khedhiri, S. The determinants of mathematics and statistics achievement in higher education. Mod. Appl. Sci. 2016, 10, 60. [Google Scholar] [CrossRef]
- Nunez-Pena, M.I.; Suarez-Pellicioni, M.; Bono, R. Effects of math anxiety on student success in higher education. Int. J. Educ. Res. 2013, 58, 36–43. [Google Scholar] [CrossRef] [Green Version]
- Pierce, R.; Stacey, K.; Barkatsas, A. A scale for monitoring students’ attitudes to learning mathematics with technology. Comput. Educ. 2007, 48, 285–300. [Google Scholar] [CrossRef] [Green Version]
- Alexander, L.; Martray, C.R. The development of an abbreviated version of the mathematics anxiety rating scale. Meas. Eval. Couns. Dev. 1989, 22, 143–150. [Google Scholar] [CrossRef]
- Baloğlu, M.; Zelhart, P.F. Psychometric properties of the revised mathematics anxiety rating scale. Psychol. Rec. 2007, 57, 593–611. [Google Scholar] [CrossRef]
- Eng, T.H.; Li, V.L.; Julaihi, N.H. The relationships between students’ underachievement in mathematics courses and influencing factors. Procedia—Soc. Behav. Sci. 2010, 8, 134–141. [Google Scholar] [CrossRef] [Green Version]
- Nicholas, J.; Poladian, L.; Mack, J.; Wilson, R. Mathematics preparation for university: Entry, pathways and impact on performance in first year science and mathematics subjects. Int. J. Innov. Sci. Math. Educ. 2015, 23, 37–51. [Google Scholar]
- Joyce, C.; Hine, G.; Anderton, R. The association between secondary mathematics and first year university performance in health sciences. Issues Educ. Res. 2017, 27, 770–783. [Google Scholar]
- Anderton, R.; Hine, G.; Joyce, C. Secondary school mathematics and science matters: Predicting academic success for secondary students transitioning into university allied health and science courses. Int. J. Innov. Sci. Math. Educ. 2017, 25, 34–47. [Google Scholar]
- McMillan, J.; Edwards, D. Performance in first year mathematics and science subjects in Australian universities: Does senior secondary mathematics background matter? Final Report. High. Educ. Res. 2019. [Google Scholar]
- Hailikari, T.; Nevgi, A.; Komulainen, E. Academic self-beliefs and prior knowledge as predictors of student achievement in mathematics: A structural model. Educ. Psychol. 2008, 28, 59–71. [Google Scholar] [CrossRef]
- Faulkner, F.; Hannigan, A.; Fitzmaurice, O. The role of prior mathematical experience in predicting mathematics performance in higher education. Int. J. Math. Educ. Sci. Technol. 2014, 45, 648–667. [Google Scholar] [CrossRef] [Green Version]
- Warwick, J. Mathematical self-efficacy and student engagement in the mathematics classroom. MSOR Connect. 2008, 8, 31–37. [Google Scholar] [CrossRef]
- Linnenbrink, E.A.; Pintrich, P.R. The role of self-efficacy beliefs instudent engagement and learning intheclassroom. Read. Writ. Q. 2003, 19, 119–137. [Google Scholar] [CrossRef]
- Li, Q.; Ma, X. A Meta-analysis of the effects of computer technology on school students’ mathematics learning. Educ. Psychol. Rev. 2010, 22, 215–243. [Google Scholar] [CrossRef]
- Attard, C.; Holmes, K. “It Gives You That Sense of Hope”: An exploration of technology use to mediate student engagement with mathematics. Heliyon 2020, 6, e02945. [Google Scholar] [CrossRef]
- Cheung, A.C.; Slavin, R.E. The effectiveness of educational technology applications for enhancing mathematics achievement in K-12 classrooms: A meta-analysis. Educ. Res. Rev. 2013, 9, 88–113. [Google Scholar] [CrossRef]
- Elmer, T.; Mepham, K.; Stadtfeld, C. Students under lockdown: Comparisons of students’ social networks and mental health before and during the COVID-19 Crisis in Switzerland. PLoS ONE 2020, 15, e0236337. [Google Scholar] [CrossRef]
- Schumacker, E.; Lomax, G. A Beginner’s Guide to Structural Equation Modelling, 4th ed.; Routledge: London, UK, 2016. [Google Scholar]
- Kline, R.B. Principles and Practice of Structural Equation Modeling; Guilford Publications: New York, NY, USA, 2015. [Google Scholar]
- Koufteros, X.A. Testing a model of pull production: A paradigm for manufacturing research using structural equation modeling. J. Oper. Manag. 1999, 17, 467–488. [Google Scholar] [CrossRef]
- MacCallum, R.; Browne, M.; Sugawara, H.M. Power analysis and determination of sample size for covariance structure modeling. Psychol. Methods 1996, 1, 130–149. [Google Scholar] [CrossRef]
- Hu, L.; Bentler, P.M. Cutoff criteria for fit indexes in covariance structure analysis: Conventional criteria versus new alternatives. Struct. Equ. Model. 1999, 6, 1–55. [Google Scholar] [CrossRef]
- Teo, T.; Zhou, M. Explaining the intention to use technology among university students: A structural equation modeling approach. J. Comput. High. Educ. 2014, 26, 124–142. [Google Scholar] [CrossRef]
- Cheung, G.W.; Rensvold, R.B. Evaluating goodness-of-fit indexes for testing measurement invariance. Struct. Equ. Model. 2002, 9, 233–255. [Google Scholar] [CrossRef]
- Fornell, C.; Larcker, D.F. Evaluating structural equation models with unobservable variables and measurement error. J. Mark. Res. 1981, 18, 39–50. [Google Scholar] [CrossRef]
- Cheung, G.W.; Lau, R.S. A direct comparison approach for testing measurement invariance. Organ. Res. Methods 2012, 15, 167–198. [Google Scholar] [CrossRef]
- Tracey, T.J.; Xu, H. Use of multi-group confirmatory factor analysis in examining measurement invariance in counseling psychology research. Eur. J. Couns. Psychol. 2017, 6, 75–82. [Google Scholar] [CrossRef]
- Immekus, J.C. Multigroup CFA and alignment approaches for testing measurement invariance and factor score estimation: Illustration with the schoolwork-related anxiety survey across countries and gender. Methodology 2021, 17, 22–38. [Google Scholar] [CrossRef]
- Putnick, D.L.; Bornstein, M.H. Measurement invariance conventions and reporting: The state of the art and future directions for psychological research. Dev. Rev. 2016, 41, 71–90. [Google Scholar] [CrossRef] [Green Version]
- Miceli, G.N.; Barbaranelli, C. Structural Equations Modeling: Theory and Applications in Strategic Management. In Research Methods for Strategic Management; Routledge: London, UK, 2015. [Google Scholar]
- Brown, G.T.L.; Harris, L.R.; O’Quin, C.; Lane, K.E. Using multi-group confirmatory factor analysis to evaluate cross-cultural research: Identifying and understanding non-invariance. Int. J. Res. Method Educ. 2017, 40, 66–90. [Google Scholar] [CrossRef]
- Chen, F.F. Sensitivity of goodness of fit indexes to lack of measurement invariance. Struct. Equ. Model. 2007, 14, 464–504. [Google Scholar] [CrossRef]
- Rosseel, Y.; Jorgensen, T.D.; Rockwood, N.; Oberski, D.; Byrnes, J.; Vanbrabant, L.; Savalei, V.; Merkle, E.; Hallquist, M.; Rhemtulla, M.; et al. Lavaan: Latent Variable Analysis. [R package]. 2022. Available online: https://cran.r-project.org/web/packages/lavaan/index.html (accessed on 15 February 2022).
- Jorgensen, T.D.; Pornprasertmanit, S.; Schoemann, A.M.; Rosseel, Y.; Miller, P.; Quick, C.; Garnier-Villarreal, M.; Selig, J.; Boulton, A.; Preacher, K.; et al. SemTools: Useful Tools for Structural Equation Modeling. [Computer Software]. 2022. Available online: https://CRAN.R-project.org/package=semTools (accessed on 15 February 2022).
- Trenholm, S.; Peschke, J.; Chinnappan, M. A review of fully online undergraduate mathematics instruction through the lens of large-scale research (2000–2015). PRIMUS 2019, 29, 1080–1100. [Google Scholar] [CrossRef]
- Busto, S.; Dumbser, M.; Gaburro, E. A Simple but efficient concept of blended teaching of mathematics for engineering students during the COVID-19 pandemic. Educ. Sci. 2021, 11, 56. [Google Scholar] [CrossRef]
- Vergara, C.R. Mathematics resilience and achievement goals: Exploring the role of non-cognitive factors to mathematics performance of university students amidst of Pandemic. Open Access Libr. J. 2021, 8, 1–10. [Google Scholar] [CrossRef]
- Bringula, R.; Reguyal, J.J.; Tan, D.D.; Ulfa, S. Mathematics self-concept and challenges of learners in an online learning environment during COVID-19 pandemic. Smart Learn. Environ. 2021, 8, 22. [Google Scholar] [CrossRef]
- Baltà-Salvador, R.; Olmedo-Torre, N.; Peña, M.; Renta-Davids, A.I. Academic and emotional effects of online learning during the COVID-19 pandemic on engineering students. Educ. Inf. Technol. 2021, 26, 7407–7434. [Google Scholar] [CrossRef] [PubMed]
- Brooks, S.K.; Webster, R.K.; Smith, L.E.; Woodland, L.; Wessely, S.; Greenberg, N.; Rubin, G.J. The psychological impact of quarantine and how to reduce it: Rapid review of the evidence. Lancet 2020, 395, 912–920. [Google Scholar] [CrossRef] [Green Version]
- Voltmer, E.; Köslich-Strumann, S.; Walther, A.; Kasem, M.; Obst, K.; Kötter, T. The Impact of the COVID-19 pandemic on stress, mental health and coping behavior in German university students—A longitudinal study before and after the onset of the pandemic. BMC Public Health 2021, 21, 1385. [Google Scholar] [CrossRef]


| Model Construct | No. of Items a | Rating Scale | References | |
|---|---|---|---|---|
| Mathematics Confidence (MC) | 4 | 5-point Likert-type scale: 1 (“I do not agree at all”) to 5 (“I agree completely”) | [33,34,35,36] | |
| Behavioral Engagement (BE) | 2 | 5-point Likert-type scale: 1 (“I do not agree at all”) to 5 (“I agree completely”) | [37] | |
| Perceived Level of Math Anxiety (PLMA) | Mathematics Test Anxiety (MTA) | 9 | 5-point Likert-type scale: 1 (“no anxiety”) to 5 (“high anxiety”) | [36,38,39] |
| Numerical Task Anxiety (NTA) | 4 | |||
| Math. Course Anxiety (MCA) | 4 | |||
| Background Knowledge from Secondary School (BKSS) | Grade in math in final year | 1 | Achieved grade from 2 (sufficient) to 5 (excellent) | [35,40,41,42,43,44,45,46] |
| Grade in math at matura b | 1 | |||
| Final grade in high school | 1 | |||
| Self-Engagement in Math. Course at Univ. (SEMCU) | e-Activities | 1 | % of points earned (0–100%) | [46,47,48] |
| Additional points | 1 | Number of points earned (0–13) | ||
| Confidence with Technology (CT) | 4 | 5-point Likert-type scale: 1 (“I do not agree at all”) to 5 (“I agree completely”) | [37] | |
| Perceived Usefulness of Technology in Learning Mathematics (PUTLM) | 4 | 5-point Likert-type scale: 1 (“I do not agree at all”) to 5 (“I agree completely”) | [37,49,50,51] | |
| Mathematics Achievement (MA) | 1 | % of points achieved on final exam | ||
| Hypothesis | Path | Expected Sign | Hypothesis Supported? |
|---|---|---|---|
| H1a | MC → PLMA | − | Yes |
| H1b | BE → PLMA | − | No |
| H2 | PLMA → MA | − | Yes |
| H3 | BKSS → SEMCU | + | Yes |
| H4 | SEMCU → MA | + | Yes |
| H5 | CT → PUTLM | + | Yes |
| H6 | PUTLM → MA | + | No |
| Model Construct | Questionnaire Item | Pre-Pandemic | Pandemic | ||
|---|---|---|---|---|---|
| M | SD | M | SD | ||
| Mathematics Confidence (MC) | I have a mathematical mind. (MC1) | 3.92 | 0.808 | 3.81 | 0.878 |
| I can get good results in mathematics. (MC2) | 3.71 | 0.908 | 3.58 | 0.983 | |
| I know I can handle difficulties in mathematics. (MC3) | 3.94 | 0.821 | 3.78 | 0.904 | |
| I am confident with mathematics. (MC4) | 3.17 | 1.079 | 3.10 | 1.094 | |
| Behavioral Engagement (BE) | If I make mistakes, I work until I have corrected them. (BE3) | 3.50 | 0.926 | 3.74 | 0.976 |
| If I cannot do a problem, I keep trying different ideas. (BE4) | 3.47 | 0.939 | 3.77 | 0.956 | |
| Mathematics Test Anxiety (MTA) | Studying for a math test. (MTA1) | 3.13 | 1.264 | 3.42 | 1.186 |
| Taking the math section of the college entrance exam. (MTA2) | 2.70 | 1.114 | 2.87 | 1.131 | |
| Taking an exam (quiz) in a math course. (MTA3) | 2.88 | 1.138 | 3.12 | 1.158 | |
| Taking an exam (final) in a math course. (MTA4) | 3.36 | 1.146 | 3.57 | 1.192 | |
| Thinking about an upcoming math test one week before. (MTA5) | 2.84 | 1.239 | 2.89 | 1.293 | |
| Thinking about an upcoming math test one day before. (MTA6) | 3.36 | 1.238 | 3.55 | 1.236 | |
| Thinking about an upcoming math test one hour before. (MTA7) | 3.63 | 1.281 | 3.83 | 1.314 | |
| Receiving your final math grade in the mail. (MTA9) | 2.88 | 1.219 | 3.21 | 1.223 | |
| Being given a “pop” quiz in a math class. (MTA10) | 3.79 | 1.292 | 3.93 | 1.271 | |
| Numerical Task Anxiety (NTA) | Being given a set of numerical problems involving addition to solve on paper. (NTA2) | 1.56 | 0.907 | 1.46 | 0.740 |
| Being given a set of s subtraction problems to solve. (NTA3) | 1.56 | 0.882 | 1.46 | 0.740 | |
| Being given a set of multiplication problems to solve. (NTA4) | 1.60 | 0.879 | 1.49 | 0.749 | |
| Being given a set of division problems to solve. (NTA5) | 1.73 | 0.968 | 1.63 | 0.805 | |
| Mathematics Course Anxiety (MCA) | Watching a teacher work on an algebraic equation on the blackboard. (MCA2) | 1.86 | 1.037 | 1.80 | 1.037 |
| Signing up for a math course. (MCA3) | 2.55 | 1.209 | 2.72 | 1.313 | |
| Listening to another student explain a mathematical formula. (MCA4) | 2.07 | 1.095 | 2.05 | 1.088 | |
| Walking into a math class. (MCA5) | 1.82 | 1.100 | 1.99 | 1.180 | |
| Confidence with Technology (CT) | I am good at using computers. (CT1) | 3.92 | 0.967 | 4.02 | 0.898 |
| I am good at using things like VCRs, DVDs, MP3s, and mobile phones. (CT2) | 4.28 | 0.800 | 4.26 | 0.786 | |
| I can fix a lot of computer problems. (CT3) | 3.51 | 1.143 | 3.58 | 0.984 | |
| I can master any computer program needed for school. (CT4) | 3.57 | 1.004 | 3.85 | 0.928 | |
| Perceived Usefulness of Technology in Learning Mathematics (PUTLM) | I like using computers for mathematics. (PUTLM1) | 3.47 | 1.151 | 3.71 | 1.029 |
| Using computers in mathematics is worth the extra effort. (PUTLM2) | 3.25 | 1.120 | 3.42 | 1.119 | |
| Mathematics is more interesting when using computers. (PUTLM3) | 3.15 | 1.225 | 3.37 | 1.108 | |
| Computers help me learn mathematics better. (PUTLM4) | 3.22 | 1.222 | 3.40 | 1.190 | |
| Background Knowledge from Secondary School (BKSS) | Grade in mathematics in the final year | 3.11 | 0.882 | 3.28 | 0.935 |
| Grade in mathematics at matura | 3.20 | 0.934 | 3.25 | 0.988 | |
| Final grade in high school | 3.36 | 0.749 | 3.66 | 0.741 | |
| Self-Engagement in Math. Course at Univ. (SEMCU) | e-Activities | 73.57 | 11.988 | 78.57 | 9.363 |
| Additional points | 4.28 | 4.184 | 7.55 | 4.010 | |
| Mathematics Achievement (MA) | % of points achieved on final exam | 65.93 | 22.801 | 68.62 | 24.385 |
| χ2 | df | χ2/df | CFI | SRMR | RMSEA | RMSEA 90% CI | ||
|---|---|---|---|---|---|---|---|---|
| Entire Sample | 1392.42 | 570 | 2.44 | 0.911 | 0.064 | 0.058 | 0.054, 0.061 | |
| Subsamples | Pre-pandemic | 1173.11 | 570 | 2.06 | 0.911 | 0.065 | 0.060 | 0.055, 0.065 |
| Pandemic | 893.88 | 570 | 1.57 | 0.886 | 0.079 | 0.062 | 0.053, 0.068 | |
| Model Construct | CR | AVE | MC | BE | MTA | NTA | MCA | BKSS | SEMCU | CT | PUTLM |
|---|---|---|---|---|---|---|---|---|---|---|---|
| MC | 0.851 | 0.602 | 0.776 a | ||||||||
| BE | 0.799 | 0.667 | 0.550 | 0.817 a | |||||||
| MTA | 0.912 | 0.538 | −0.649 | −0.402 | 0.733 a | ||||||
| NTA | 0.949 | 0.822 | −0.227 | −0.153 | 0.205 | 0.907 a | |||||
| MCA | 0.798 | 0.498 | −0.523 | −0.375 | 0.629 | 0.497 | 0.706 a | ||||
| BKSS | 0.787 | 0.568 | 0.417 | 0.324 | −0.328 | −0.028 | −0.248 | 0.646 a | |||
| SEMCU | 0.658 | 0.560 | 0.527 | 0.375 | −0.384 | −0.320 | −0.384 | 0.317 | 0.748 a | ||
| CT | 0.864 | 0.622 | 0.247 | 0.197 | −0.155 | −0.187 | −0.144 | 0.113 | 0.232 | 0.789 a | |
| PUTLM | 0.917 | 0.735 | 0.213 | 0.205 | −0.073 | −0.088 | −0.071 | 0.020 | 0.193 | 0.455 | 0.857 a |
| Model (Model Comparison) | χ2 (Δχ2) | df | CFI (ΔCFI) | SRMR (ΔSRMR) | RMSEA (ΔRMSEA) | RMSEA 90% CI | p (Chi-Square Test) |
|---|---|---|---|---|---|---|---|
| M2 Configural invariance | 1996.256 | 1116 | 0.910 | 0.063 | 0.059 | 0.055, 0.063 | / |
| M3 Weak invariance (M2) | 2020.728 (27.878) | 1143 (27) | 0.909 (−0.001) | 0.064 (0.001) | 0.058 (−0.001) | 0.054, 0.062 | 0.4173 |
| M4 Strong invariance (M3) | 2080.724 (60.883) | 1170 (27) | 0.906 (−0.003) | 0.066 (0.002) | 0.059 (0.001) | 0.055, 0.063 | 0.0002 |
| M4a Partial strong invariance (M3) | 2065.358 (44.545) | 1169 (26) | 0.908 (−0.001) | 0.065 (0.001) | 0.058 (0.000) | 0.054, 0.062 | 0.0132 |
| M4b Partial strong invariance (M3) | 2052.452 (30.985) | 1168 (25) | 0.909 (0.000) | 0.064 (0.000) | 0.058 (0.000) | 0.054, 0.062 | 0.1895 |
| M5 Strict invariance (M4b) | 2104.861 (56.786) | 1204 (36) | 0.905 (−0.004) | 0.065 (0.001) | 0.058 (0.000) | 0.054, 0.062 | 0.0151 |
| Structural Model (SM) | χ2 | df | p | CFI | SRMR | RMSEA | RMSEA |
|---|---|---|---|---|---|---|---|
| (Model Comparison) | (Δχ2) | (Δdf) | (ΔCFI) | (ΔSRMR) | (ΔRMSEA) | 90% CI | |
| SM1 Partial strong invariance | 2472.28 | 1282 | / | 0.894 | 0.090 | 0.061 | 0.057, 0.065 |
| SM2 Structural coefficients | 2365.56 | 1289 | 0.2976 | 0.894 | 0.094 | 0.061 | 0.057, 0.064 |
| (SM1) | −106.72 | 7 | 0 | 0.004 | 0 |
| Hypothesis/Path | Group | b | β | z | p | Hypothesis Supported? |
|---|---|---|---|---|---|---|
| H1a: MC → PLMA | Pre-pandemic | −1.088 | −0.678 *** | −6.909 | 0.000 | Yes |
| Expected sign: − | Pandemic | −0.698 *** | ||||
| H1b: BE → PLMA | Pre-pandemic | −0.120 | −0.107 * | −1.812 | 0.070 | No |
| Expected sign: − | Pandemic | −0.116 * | ||||
| H2: PLMA → MA | Pre-pandemic | −6.379 | −0.221 *** | −4.134 | 0.000 | Yes |
| Expected sign: − | Pandemic | −0.199 *** | ||||
| H3: BKSS → SEMCU | Pre-pandemic | 2.936 | 0.331 *** | 3.789 | 0.000 | Yes |
| Expected sign: + | Pandemic | 0.375 *** | ||||
| H4: SEMC → MA | Pre-pandemic | 2.766 | 0.875 *** | 9.700 | 0.000 | Yes |
| Expected sign: + | Pandemic | 0.758 *** | ||||
| H5: CT → PUTLM | Pre-pandemic | 0.512 | 0.460 *** | 8.939 | 0.000 | Yes |
| Expected sign: + | Pandemic | 0.452 *** | ||||
| H6: PUTLM→ MA | Pre-pandemic | −0.253 | −0.011 * | −0.320 | 0.749 | No |
| Expected sign: + | Pandemic | −0.009 * |
Publisher’s Note: MDPI stays neutral with regard to jurisdictional claims in published maps and institutional affiliations. |
© 2022 by the authors. Licensee MDPI, Basel, Switzerland. This article is an open access article distributed under the terms and conditions of the Creative Commons Attribution (CC BY) license (https://creativecommons.org/licenses/by/4.0/).
Share and Cite
Žnidaršič, A.; Brezavšček, A.; Rus, G.; Jerebic, J. Has the COVID-19 Pandemic Affected Mathematics Achievement? A Case Study of University Students in Social Sciences. Mathematics 2022, 10, 2314. https://doi.org/10.3390/math10132314
Žnidaršič A, Brezavšček A, Rus G, Jerebic J. Has the COVID-19 Pandemic Affected Mathematics Achievement? A Case Study of University Students in Social Sciences. Mathematics. 2022; 10(13):2314. https://doi.org/10.3390/math10132314
Chicago/Turabian StyleŽnidaršič, Anja, Alenka Brezavšček, Gregor Rus, and Janja Jerebic. 2022. "Has the COVID-19 Pandemic Affected Mathematics Achievement? A Case Study of University Students in Social Sciences" Mathematics 10, no. 13: 2314. https://doi.org/10.3390/math10132314