
Transmission Line Object Detection Method Based on Label Adaptive Allocation


1
School of Control and Computer Engineering, North China Electric Power University, Beijing 102206, China
2
School of Information, North China University of Technology, Beijing 100144, China
*
Author to whom correspondence should be addressed.
Mathematics 2022, 10(12), 2150; https://doi.org/10.3390/math10122150
Submission received: 9 May 2022
/
Revised: 12 June 2022
/
Accepted: 16 June 2022
/
Published: 20 June 2022
(This article belongs to the Special Issue Advances in Artificial Intelligence: Data, Methods and Interdisciplinary Applications)
Abstract
:Inspection of the integrality of components and connecting parts is an important task to maintain safe and stable operation of transmission lines. In view of the fact that the scale difference of the auxiliary component in a connecting part is large and the background environment of the object is complex, a one-stage object detection method based on the enhanced real feature information and the label adaptive allocation is proposed in this study. Based on the anchor-free detection algorithm FCOS, this method is optimized by expanding the real feature information of the adjacent feature layer fusion and the semantic information of the deep feature layer, as well as adaptively assigning the label through the idea of pixel-by-pixel detection. In addition, the grading ring image is sliced in original data to improve the proportion of bolts in the dataset, which can clear the appearance features of small objects and reduce the difficulty of detection. Experimental results show that this method can eliminate the background interference in the GT (ground truth) as much as possible in object detection process, and improve the detection accuracy for objects with a narrow shape and small size. The evaluation index AP (average precision) increased by 4.1%. Further improvement of detection accuracy lays a foundation for the realization of efficient real-time patrol inspection.
Keywords:
transmission line object; detection method; enhanced real feature information; label adaptively allocation; FCOSMSC:
68T071. Introduction
The high-voltage transmission line in field environment is the basic transportation hardware of electric power, its operation with safety and stability significantly affects the national economy and people’s livelihood. In the high-voltage transmission line, a large number of important connecting components such as insulators, bolts, pins, and various soft connecting components play crucial roles in maintaining the safe and stable operation of transmission line [1]. Therefore, in order to prevent the interruption accident of electric power transportation caused by the looseness, disconnection, and loss of connecting components, it is of great significance to detect the operation status of these important objects in the high-voltage transmission line [2]. At present, the traditional manual inspection method has been gradually replaced by UAVs with greater flexibility and efficiency. In the transmission line inspection by UAV, the detection objects mainly include insulators [3,4,5], insulator self-explosion [6,7], vibration damper [8,9], bird species [10], and other components [11].
Object detection methods can be divided into traditional machine learning and deep learning. Traditional machine learning has good detection performance for large objects in a uniform background. However, in this method, the features of object should be selected manually, which causes the detection accuracy to mainly be affected by subjective factors. At the same time, traditional machine learning is unable to deal with multiclass object detection tasks in a complex background. Compared with traditional machine learning, deep learning has a good performance in image classification, object detection, and instance segmentation. The detection algorithms based on deep learning can be divided into the anchor-base and anchor-free algorithms. First, the anchor-base object detection algorithms include the two-stage and the one-stage algorithms. The core of two-stage algorithm is additional classification and localization of task on the candidate regions that are generated in first stage. The two-stage algorithm includes Faster R-CNN [12], R-FCN [13], and FPN [14]. While the one-stage algorithm is directly used for classification and localization of task without the candidate regions, which includes YOLOv2 [15], YOLOv3 [16], YOLOv4 [17], SSD [18], and Retina-Net [19]. Second, the anchor-free algorithms include the key points and object center algorithms. The main task of the former algorithm is to find and pair the key points and then obtain the bounding box, which includes CornerNet [20], ExtremeNet [21], and CenterNet [22]. The latter algorithm is similar to the anchor-base algorithm, which includes YOLO [23], FSAF [24], and FCOS [25]. It is worth noting that although the object center detection algorithm has a simple process and a fast training speed, it may face the problem of class-imbalance in training stage.
The performance of the object detection method is mainly determined by its feature extraction ability. In the feature extraction module, the depth of network structure determines the expressive ability. The shallow feature map contains a lot of detailed localization information, while the deep feature map contains more semantic features. Convolution and downsampling operations can enhance the semantic features in the deep feature layer, but also simultaneously lose the localization information. Therefore, taking the network depth as the only determination parameter is not conducive to small object detection. Therefore, great efforts have been made to optimize the feature extraction module. Deng et al. [26] proposed a feature texture transfer module for small object detection, which could extract detailed feature information in the super-resolution feature layer. Lim et al. [27] connected the multiscale feature layers and used them to enhance the contextual information of objects. Zhou et al. [28] replaced CSPDarknet in YOLO4 with depthwise separable convolution and fused features of the same channel and size to increase shallow details and deep semantic information.
The detection methods based on deep learning have been widely used in the inspection of transmission line objects; however, how to improve the real detection accuracy and performance is still a hot research spot. For the insulator object in transmission line, Deng et al. [29] improved the detection performance by changing the lightweight network of backbone and loss function, and raised the detection speed through partitioning algorithm. Based on the Faster RCNN, Zhao et al. [30] detected the insulator object in a complex background by clipping object image, which could eliminate the confusion of background noise and illumination. Li et al. [31] proposed a global- and pixel-level segmentation detection model to realize high-accuracy insulator defect detection in a complex background. Furthermore, Liang et al. [32] proposed a multicategory defect dataset of transmission line, which could improve the robustness of the detection model in a complex light environment. Ma et al. [33] proposed a method that could realize real-time detection and localization of insulators by combing binocular stereo vision and a global positioning system. Gu et al. [34] proposed a method that used Faster RCNN to locate bolts and used Retina-Net to detect defects, which greatly reduced the difficulty of pin defect detection. To sum up, these results have achieved the identification and fault detection of various objects in transmission line. However, the diversity of objects and complexity of actual background environments are still the important factors that cause poor accuracy of object detection. How to effectively eliminate the interference factors in background and further improve detection accuracy is still the focus and difficulty in the field of object detection.
In order to improve the detection accuracy of transmission line objects with a large scale difference and in a complex background, an object detection method that combines the enhanced real feature information and the label adaptive allocation is proposed. In this method, the FCOS algorithm is used as the basic framework—the feature extraction and the division of positive and negative sample are the two main aspects. With the help of pixel-by-pixel allocation of positive and negative sample and bivariate Gaussian distribution, the training process can rapidly converge and the most negative effect of background on detection accuracy can be eliminated. An experimental dataset is used to examine the accuracy of the proposed detection method.
2. Detection Object
2.1. Glass Insulator
The glass insulator is widely used in high-voltage transmission lines. The aerial images of transmission lines were obtained by a four-winged UAV with NIKON D90 and AF VR Zoom-Nikkor 80–400 mm f/4.5–5.6 D ED. In this study, the background of detection object comprised only the sky, which was defined as the uniform background; meanwhile, the background was composed of the complex ground environment and the overlapped tower in visual field, which was defined as the complex background. The statistical analysis showed that 70% of the data contained a complex terrain background, and the remaining data only contained a uniform background. The biggest threat to the safe operation of transmission line is the burst of insulator umbrella skirt. Figure 1 shows the missed umbrella skirt of insulator in transmission line; the simulated three-dimensional image, the real image with a uniform background, and a complex background are shown in (a), (b), and (c), respectively.
2.2. Fittings
Fittings in transmission line are used to support, connect, and protect conductors, which include counterweights, strain clamps, adjustment plates, triangle joint plates, grading rings, and tighten part bolts. Bolts are used to connect the insulators, equalizing rings and towers. Bolts are composed of a screw, nut, and pin, in which the role of the pin is to prevent the drop of the nut. For the pin, due to its small size and lack of corresponding public datasets, few researchers have carried out researches on pin detection. Figure 2 shows the front and bottom views of the simulated three-dimensional image of the bolt component, which are the most common imaging angles in dataset. It can be found that the proportion scale of pin in the whole inspection image is small. In fact, the number of inspection samples of the bolt with a missing pin is rare; as the background of the inspection image is complex and diverse, small components are easy confused. These adverse facts cause difficulties in label data collection and object detection model construction.
3. Method
3.1. The Optimized FCOS Algorithm
In this paper, the basic network structure is the one-stage, anchor-free object detection algorithm FCOS (Fully Convolutional One-stage Detection) [25], which is a pixel-by-pixel detection algorithm. The optimized FCOS is mainly composed of a feature extraction network, feature pyramid network, and detection head corresponding to each feature level layer. The detection head includes three branches: classification, centerness, and regression. The network structure of the optimized FCOS algorithm is shown in the top of Figure 3. P5’ is obtained by 1 × 1 convolution of C5, P4’ is fused by sub-pixel of C5 and C4 through 1 × 1 convolution, P3’ layer is fused by sub-pixel of C4 and C3 through 1 × 1 convolution, and P6 and P7 are obtained by downsampling P5’, P3 is obtained by 1 × 1 convolution of P3’, P4 is fused by downsampling of P3 and P4’ through 1 × 1 convolution, P5 is fused by downsampling of P4 and P5’ through 1 × 1 convolution. The classification, regression, and centerness calculations of the five feature layers are carried out through four convolution modules. The multiplied result of the centerness and the classification confidence is used to filter out the bounding box that is away from the center point.
The real feature information is added to the shallow layer in feature extraction network, and the bivariate Gaussian function is added in the training process of centerness branch to obtain the overall framework of detection model. As shown in Figure 3, in the top-down connection of feature extraction, sub-pixel convolution is used to replace 1 × 1 convolution and upsampling in FCOS, which reduces the information loss caused by interpolation in upsampling. Then, the bottom-up connection is added to transfer the low-level features with more localization information to the high-level features, so that the feature output layer not only has semantic features, but also has more real high-resolution location information for localization tasks. The purple box in Figure 3 shows the training process of positive and negative samples. Compared with the calculation of positive and negative samples of FCOS algorithm, this paper adds the bivariate Gaussian distribution of object as a prior knowledge in the calculation process of positive and negative weights, the sample weight is multiplied by the sample confidence to obtain a positive/negative sample. The process mentioned above is called the Label Adaptive Allocation (LAA). The advantages of label adaptive allocation are that the convergence of training process of irregular objects with a large background in ground truth is fast and the corresponding detection accuracy is high; however, for objects with regular shapes, label adaptive allocation is not very beneficial and has low-performance. The optimal detection performance is obtained by jointly calculating the loss function of positive and negative samples so as to achieve LAA at the pixel level.
3.2. Real Feature Information in Feature Pyramid Network
The feature pyramid network is used to adapt to the size change in detection, and realize the detection of objects with different sizes at different scales by combining multiscale information. The shallow feature has a high resolution, which is beneficial to detect and locate small objects. However, the reduction of channel number through 1 × 1 convolution and the linear interpolation of the upsampling operation in the top-down structure of the feature pyramid network leads to a loss of real feature information and reduction in location accuracy, as shown in Figure 4a. The real feature information structure is shown in Figure 4b. A new feature is obtained by the fused high-level feature (sub-pixel convolution) and low-level feature (1 × 1 convolution). In this way, the real resolution of shallow features is enhanced, and the information loss caused by channel reduction and linear interpolation is reduced. On the basis of improving the shallow feature information, a lateral bottom-up connection is further added to enhance the semantic information. The enhanced spatial information and semantic information are combined to optimize the classification and localization tasks at the same time. The method mentioned above is the enhanced real feature information feature pyramid network, whose structure is shown in the feature pyramid network in Figure 3.
3.3. Label Adaptive Allocation Object Detection
When making image-level prediction of object, one-stage detection has always lacked the candidate region generated by RPN networks, which leads to the imbalance between positive and negative samples. It is difficult to be completely filled by an object in the bounding annotation box; so, the initial positive sample set contains some false positive samples in the background area, which causes a false predication. Therefore, the redundant areas of the background should be avoided as the positive sample in the training process. This paper introduces the binary classification task of foreground and background—namely, the implicit-Objectness without explicit labels—and dynamically adjusts the weight of positive and negative samples by data-driven method so as to reduce the influence of false positive samples on detection accuracy.
In order to improve the accuracy of the one-stage detection methods FCOS and RetinaNet, the ground truth (GT) is directly assigned to the FPN layer in the corresponding scale through a prior scale setting. However, this fixed center sampling strategy mistakenly sets the pixel that is not located on object in the GT as the positive sample, which reduces the detection performance. In order to remove the background contained in the GT, a binary classification branch such as implicit-Objectness is introduced. Implicit-Objectness directly takes the position weight of bounding box as a positive sample auxiliary task and removes the prediction box with large offset. In the initial training, all samples are positive in the GT, but the label is trainable. The center weight that can fit the object distribution is obtained by Gaussian distribution. By combining the confidence weighting module, the positive and negative weight map is generated in a data-driven way to modify the predicted results; therefore, the adaptive allocation of positive and negative sample is achieved.
In this paper, the weights of positive and negative samples were obtained by center weighting module and confidence weighting module. The adjustment process for positive and negative weights is shown in the violet dashed box in Figure 3 and the positive and negative samples are adjusted dynamically. First of all, all positions in the GTs of different-level feature maps of each instance were taken as positive samples, and the other positions were taken as negative samples. The prediction of positive and negative samples was adjusted by the positive weights and negative weights in the training process. The adjustment process is as follows:
- (1)
- The center weight module is used to learn the center weight offset of a fitting foreground object in GT box, and the areas in each FPN layer that do not fall into the GT box are set as negative sample. The classification loss function and the localization loss function of each position i is constructed. Initializing the loss function:
- (2)
- In order to measure the classification and localization performance of a position i, the loss function is transformed into classification–localization joint confidence. The conversion process is as follows:
- (3)
- As the negative weight outside the GT box is 1, the lower the confidence in the GT is, the closer to the negative sample it is. So, the exponential function is used to transform the confidence to obtain the expression of weight:where ; this is to satisfy that when the confidence is close to 0, is close to 1, and when the confidence is close to 1, should be as large as possible.
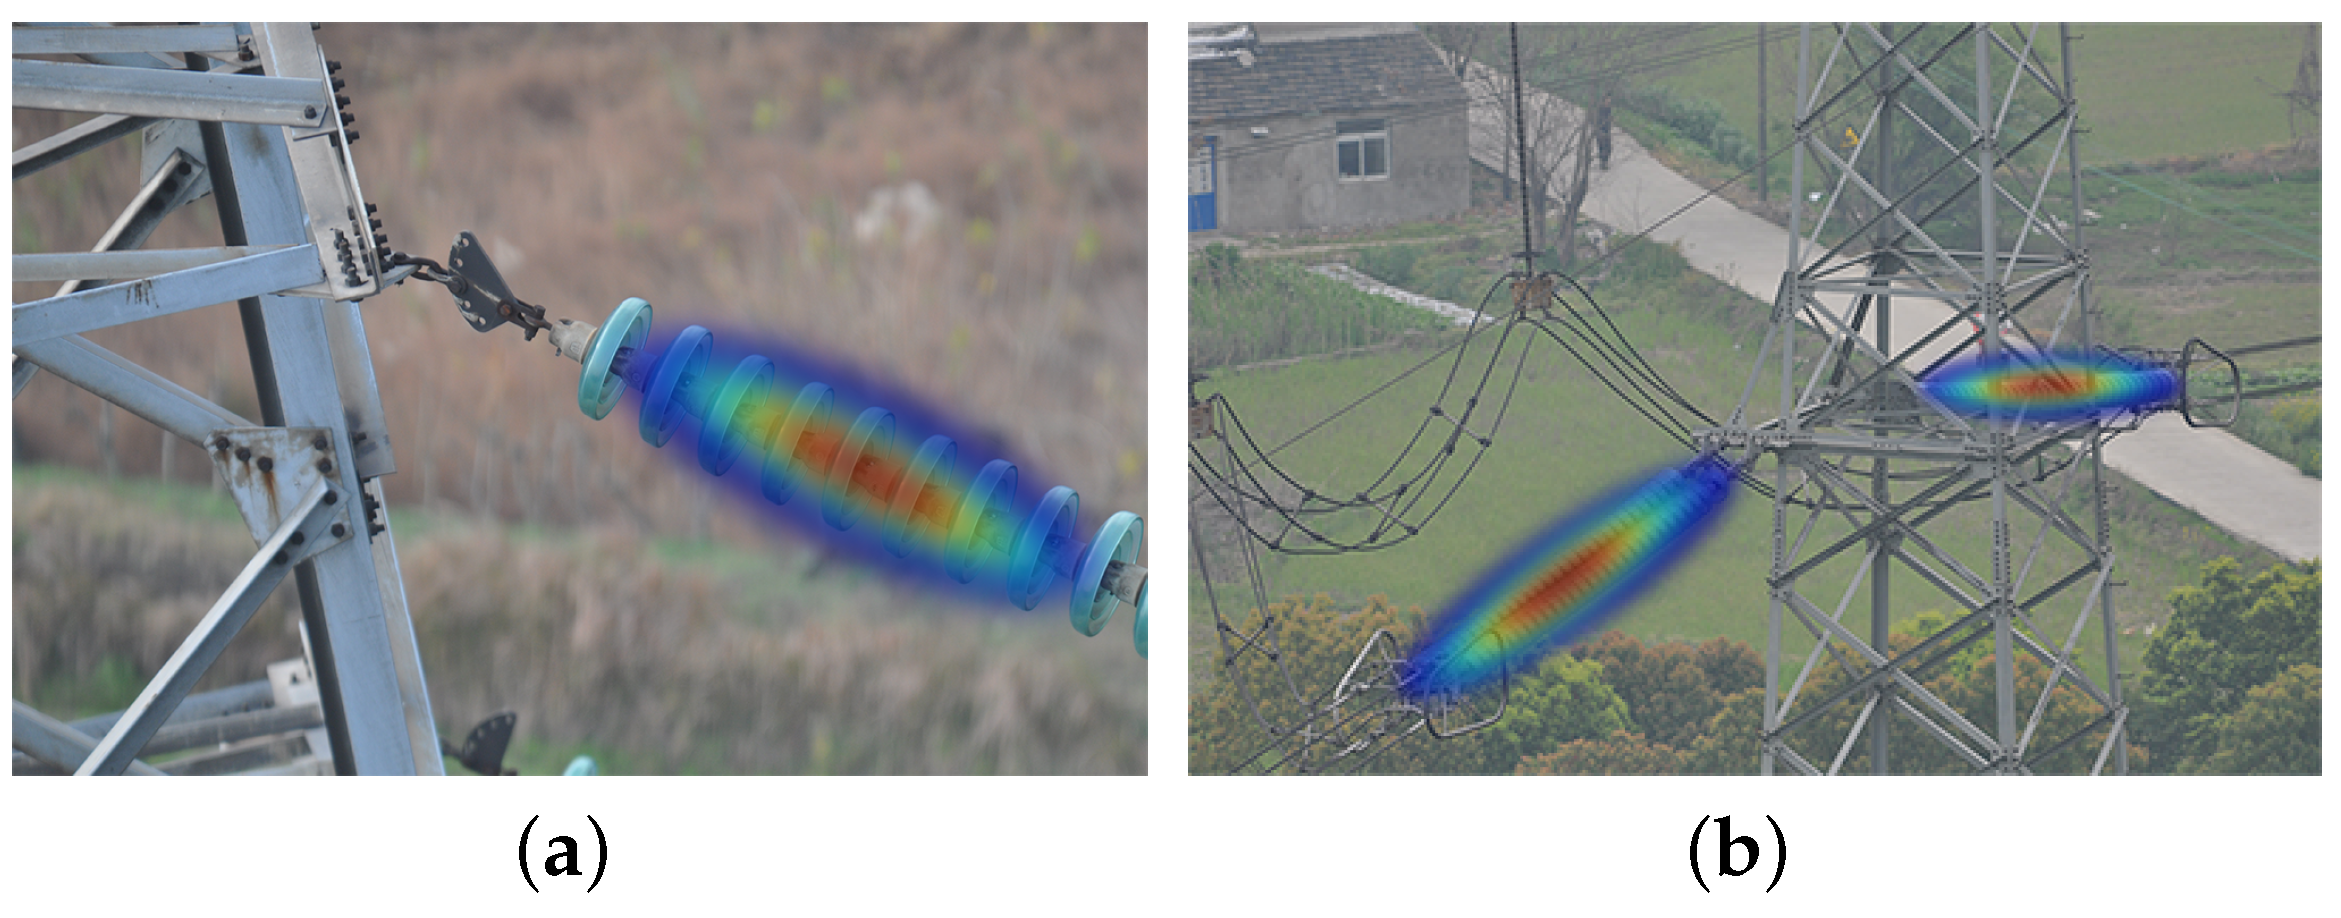
Due to the prior distribution of various learned objects being added as the guidance of training, the network parameters can skip over the random distribution learning process and enter the training process quickly and steadily. In order to flexibly fit the object distribution in the process of training, the weighting function G (Equation (5)) of bivariate Gaussian distribution is used to represent the object distribution.
where represents the offset of a location i of object from the center point in the x and y direction, and are the learnable parameters of (K,2) and (K,2,2), K represents the category of dataset, represents the center offset of each kind of sample, and represents the importance of each location to the object; the bivariate Gaussian distribution can adjust size and angle of the distribution according to the object shape. Figure 5 shows the fitting effect of Gaussian function on the insulator surface. The bivariate Gaussian distribution can fit the center point and rotation angle of insulator by adjusting its own parameters. The univariate Gaussian distribution can only fit the shape of insulator by adjusting the center, length, and width of the distribution.
Positive sample weight is obtained by combining the confidence weight and the center weight, which is expressed as
where represents the sum of the predicted locations of object n in all feature layers.
The false positive sample in the GT has no localization confidence, and the cannot be calculated by the loss function. So, is obtained by calculating the maximum value between the box of location candidate i and the GT. is close to 0 and the is close to 1, the probability of negative sample in the location candidate is high, and vice versa; so, the negative sample weight is expressed as
Finally, the loss function of the training process is
where N represents the object category, S represents all position sets of all feature layers, and only represents the classification probability , excluding the localization confidence, .
4. Experiments
4.1. Experimental Environment and Datasets
The data of this paper were collected strictly according to the inspection standard of UAV, and the dataset was constructed with reference to the ”Rules for Defect Classification of Overhead Transmission Line“ and COCO dataset labeling format. In order to improve the generalization performance of the proposed method on condition of the effects of visual field, illumination, and environment noise, in this study, the origin dataset was augmented to the double, through rotating the angle of visual field, changing luminance, and adding Gaussian noise. The dataset contains 3490 images and 13,884 annotation objects, included nine object classes, counterweight (CW), stay wire double plate (SWDP), grading ring (GR), strain clamp (SC), normal pin (NP), loss pin (LP), adjusting plate (ADP), insulator (INS), and insulator skirt missing (ISM). The image size is 4288 × 2848; the insulator is a large object while the proportion of each pin in the whole image is less than 0.10%, which meets the definition of the relative size of small object. By slicing the high-resolution image in the training and inference, the proportion of small object pixels in slice image in dataset was improved, making the texture features of small objects more obvious. Detailed slicing aid needed to be amplified according to the characteristics of dataset. According to the proportion of 7:1:2, the dataset was divided into training set, validation set, and test set. Table 1 shows the number of objects in the dataset.
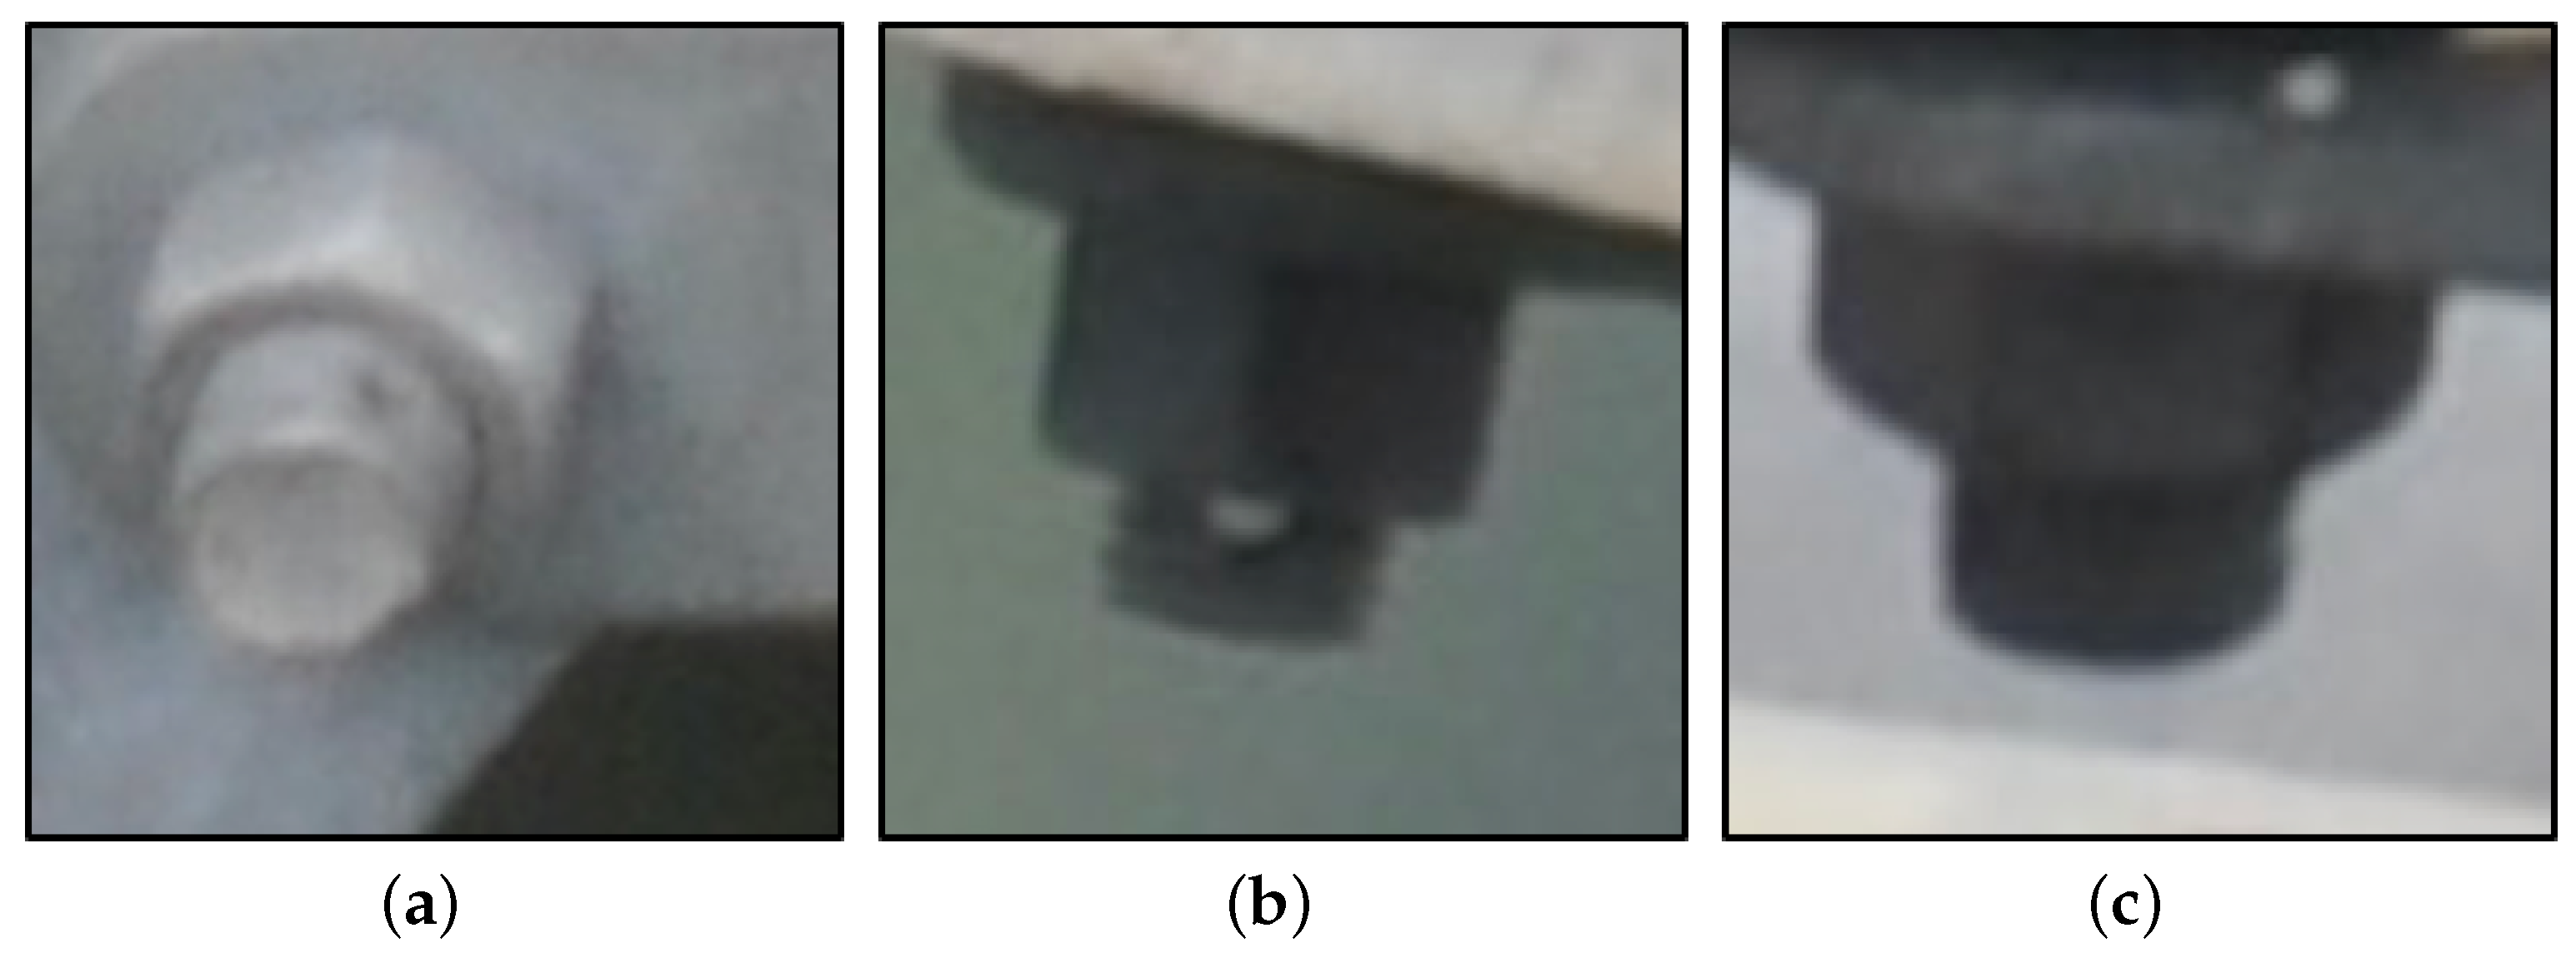
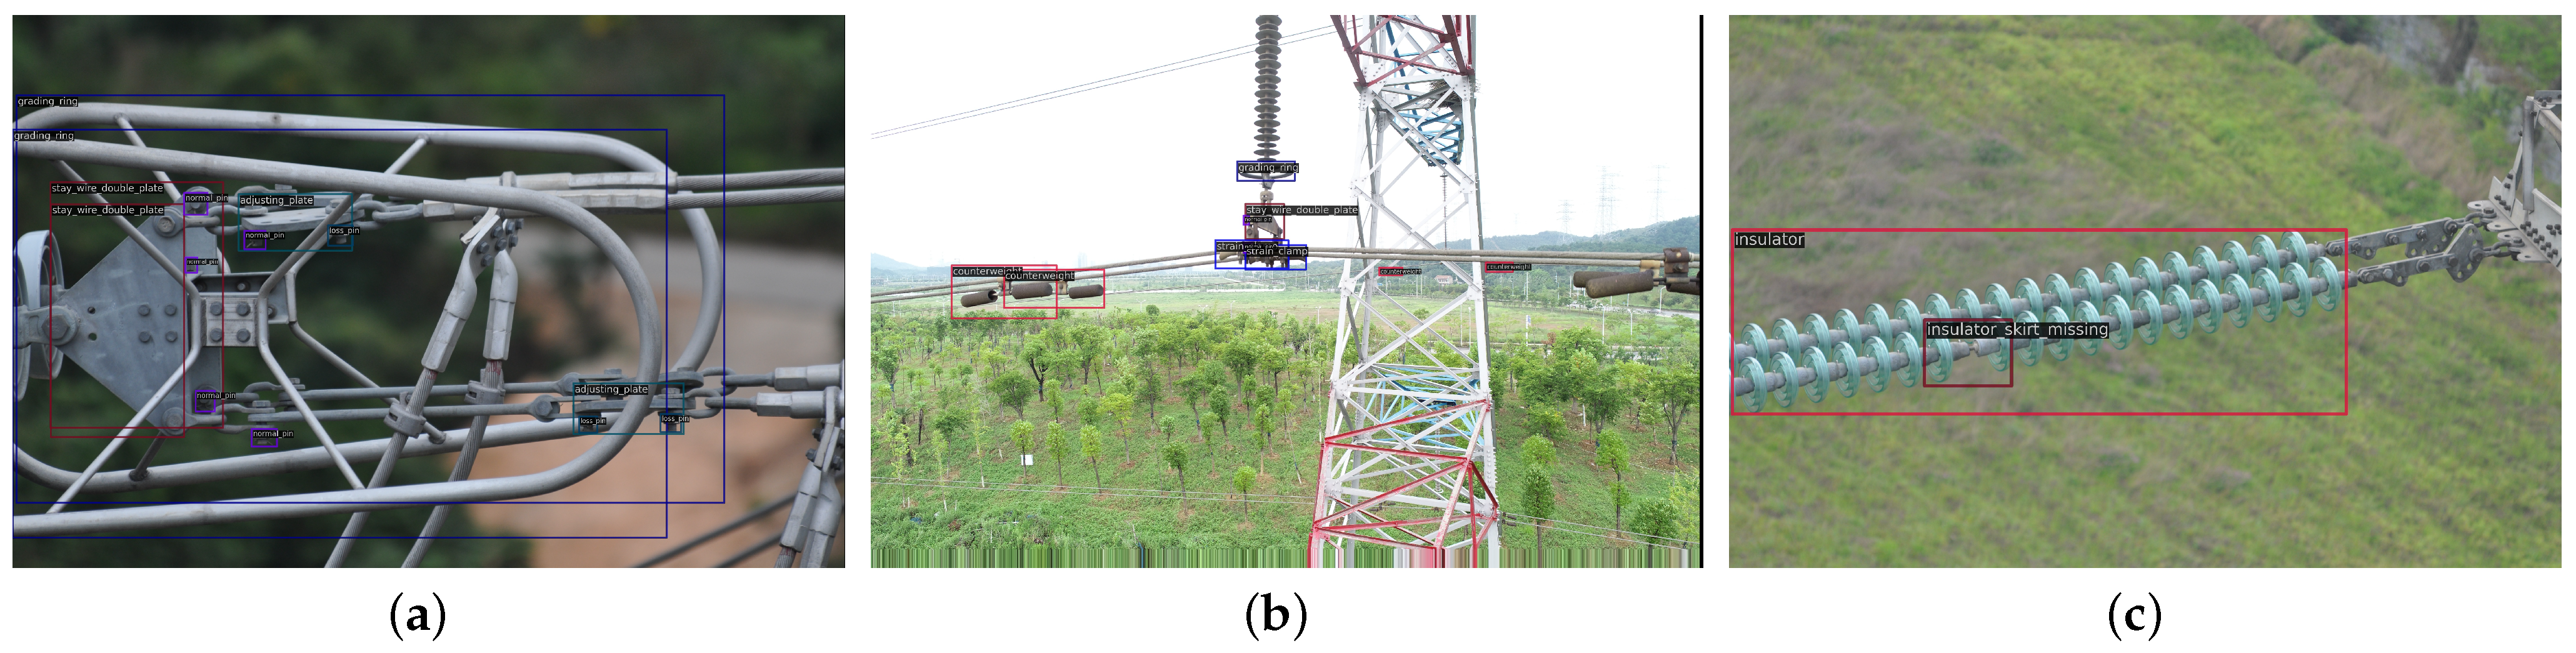
Among the nine object types in this paper, there are two types of defect objects: the missed insulator skirt and the missed pin. Among them, the size of pin is small; so, the distinguishability between defect and normal states of the pin is low. The lack of the pin is mainly reflected in synchronization with the bolt. Bolts with a normal pin are shown in Figure 6. Figure 6a–c are the bottle view of the complete bolt structure and the front view of the visible and the invisible pins, respectively. Figure 7a–c shows the bottle view of the bolt with the missed pin, the front view of the visible pin hole, and the front view of the invisible pin hole, respectively. Under the influence of the reflected light, the complete bolt structure in Figure 6c is easily confused with the missed pin in bolt structure in Figure 7c, which causes difficulty for distinguishing the pin from the visible hole. Figure 8 shows the environment scene of typical object aggregation. Figure 8a is the scene of grading ring structure, which includes stay wire double plate, adjusting plate, and multiple bolts. Figure 8b is the scene of strain clamp structure, which includes counterweight, grading ring, stay wire double plate, strain clamp, and bolt. Figure 8c is the scene of insulator structure, which includes the insulator and defect of insulator skirt missing.
The hardware configuration is a GPU Nvidia GTX2080ti, 11 GB video memory and the software platform is Ubuntu 20.04. Based on the Pytorch framework, a multiscale object detection model for transmission lines is constructed. Limited by the small dataset and various forms of samples, the backbone network is initialized by the pretraining model trained on ImageNet, and the model parameters are fine-tuned. The size of original image is large; in this study, we resize the short edge of the input image to 1200 and the long edge to 1999. The learning time is about 15 h, and the initial learning rate is set to 0.02. The optimization strategy is random gradient descent method (Stochastic Gradient Descent, SGD), in which the weight attenuation coefficient is set to 0.0005, the momentum is set to 0.9, the number of iterations is 36, and the learning rate is multiplied by 10-1 when epoch is 27 and 33, respectively. In this paper, precision, recall, and average precision are used to measure the test results.
4.2. Results
In experiment, 320 grading ring images with dense small- and medium-sized objects were selected for slicing. The dataset was sliced and magnified according to the two slice settings, 1024 pixels with 20% overlap rate and 512 pixels with 10% overlap rate. The size of bolt ranged from 30 to 120, the size of the adjusting plate ranged from 40 and 300, and most of the other components were larger than 512. It should be noted that the slicing seriously destroys the integrity of the object. Table 2 shows the label number of object with less effect of the slicing.
In order to verify the effectiveness of this detection method and slicing setting for transmission line object detection, this method is compared with the most representative algorithms, which includes the one-stage algorithms, YOLOv4, RetinaNet, and FCOS; two-stage algorithm, Faster R-CNN; and multistage detection methods, Cascade R-CNN and DetectoRS.
Comparisons between the experimental results and the state-of-the-art method are shown in Table 3. Results show that the model with RFI and LAA can improve the detection accuracy, especially for narrow insulators. Compared with FCOS, the RFI-LAA algorithm improves the average precision (AP) of the insulator by 5.3%. Two slice settings are added to the high-resolution image to increase the pixel proportion of small objects, which greatly improves the detection accuracy of adjusting plate, normal pin, and loss pin. At the same time, slicing destroys the integrity of large objects such as stay wire double plate and grading ring, which are strongly related to small objects. In the case of 1024 pixels with 20% overlap rate slice, the average precision (AP) of adjusting plate, normal pin, and loss pin are improved by 2.1%, 17.2%, 19.9%, respectively. In the case of 512 pixels with 10% overlap rate slice, the average precision of adjusting plate, normal pin, and loss pin are improved by 5%, 32%, and 33.4%, respectively. In these two cases, the average precision (AP) of grading ring are reduced by 4.3% and 5.5%, respectively.
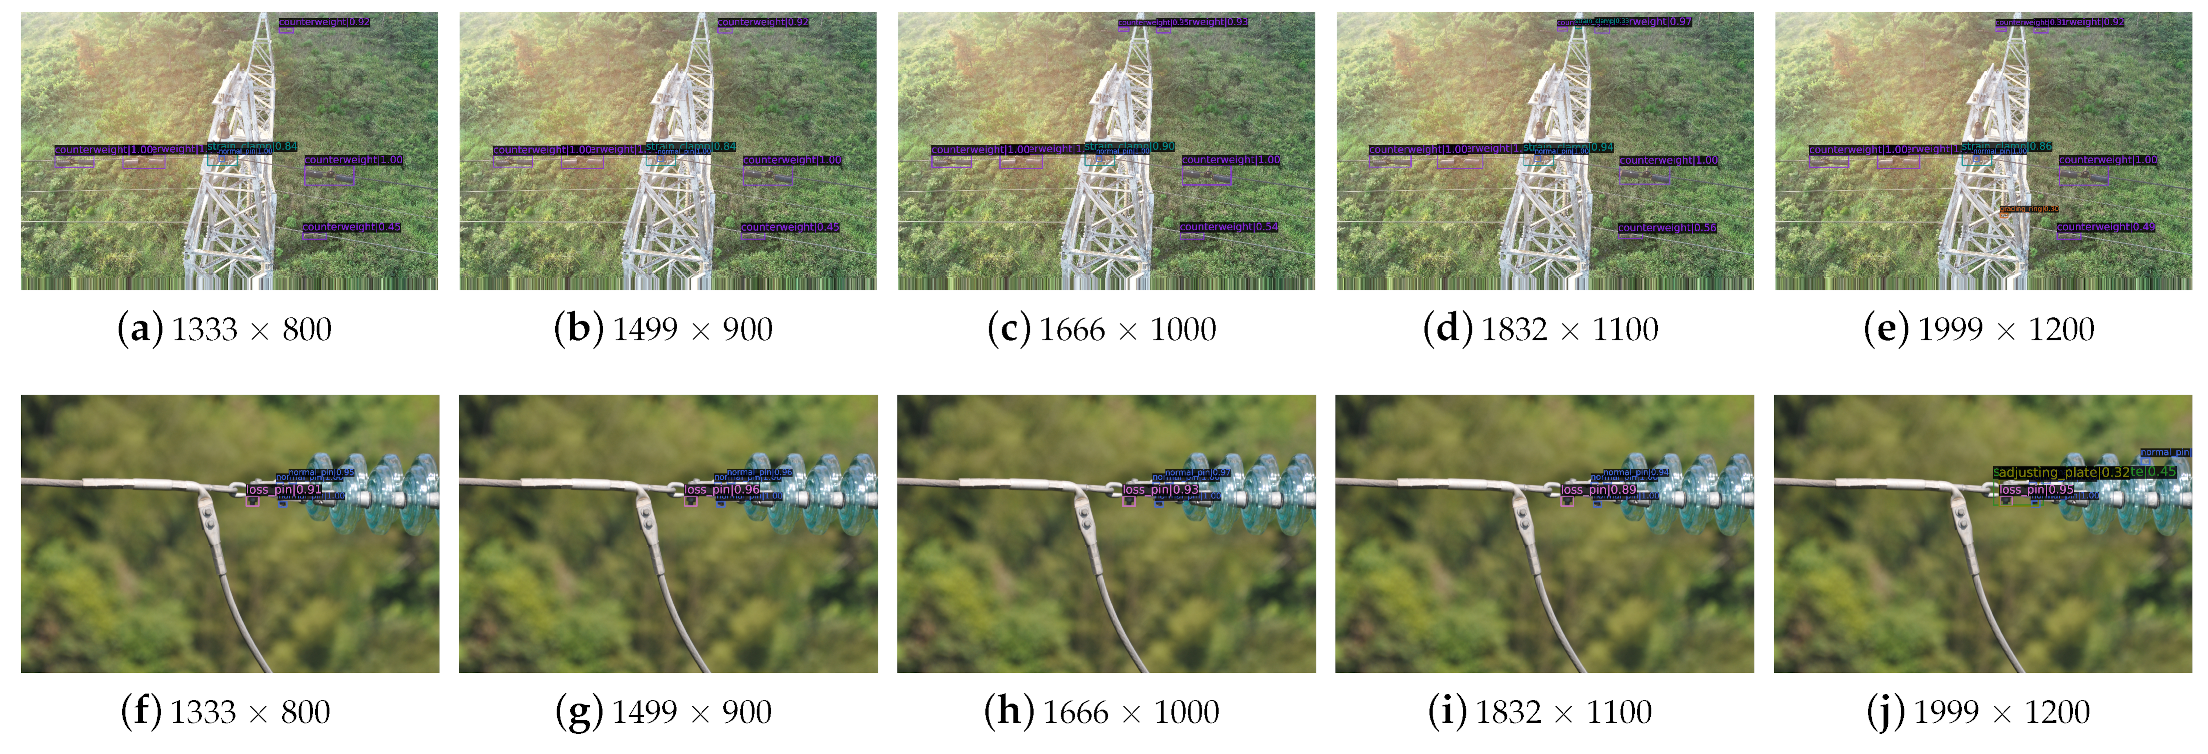
In order to verify the detection accuracy of this method as the input image size was reduced, in this study, the image size was reduced by 8%, 17%, 25%, and 33%. The experiments were carried out on the detection of the original dataset where the input image size is 1999 × 1200, and four training datasets where the input image sizes were reduced to 1832 × 1100, 1666 × 1000, 1499 × 900, 1333 × 800. The corresponding learning times for original dataset and four training datasets were about 15 h, 14 h, 13 h, 12 h, and 11 h, respectively. The detection results are shown in Table 4. It can be found that, with the increase in input image size, the average precision for all detected objects is increased, especially for the small object of normal pin, but the corresponding flops are also greatly increased. In addition, although the maximum reduction of input image size is 33%, the decrease in detection accuracy of this proposed method is smaller than 10%, which indicates that this method can still yield relatively good results when the size of input image is reduced.
Figure 9 shows the visual results of detected objects with different image size. In Figure 9a, b with small image size, the two counterweight objects located in the top-left visual field are not successfully detected. With the increase in image size, in Figure 9d, the strain clamp located in the top visual field can be detected. In Figure 9e with maximum image size, the small grading ring located in the tower in central visual field is successfully detected. The compared results between Figure 9f–j show that when the input image size is large, the small object of stay wire double plate can be detected in Figure 9j. In summary, the decrease in image size certainly leads to the missed detection of some small or unclear objects, but the objects that are in the majority of the image can be successfully detected by this proposed method.
4.3. Ablation Experiment
The ablation experiment is carried out on the basis of 512 pixels with 10% overlap rate slice expansion. The compared results of ablation experiment are shown in Table 5. The AP of the four methods are compared. Based on the FCOS algorithm, while the real feature information enhanced in the feature pyramid, the AP, AP50, and AP75 improved by 1.3%, 1.7%, and 0.7%, respectively. The above compared results show that the average precision of detection improved while the shallow real feature information and semantic information are added to the feature output layer. After adding label adaptive allocation, the AP, AP50, and AP75 increased by 2.8%, 3.8%, and 2.7%, respectively. The compared results show that the division of positive and negative samples in the candidate location is realized through label adaptive allocation, which effectively solves the reduction in detection accuracy caused by background in the detection model. After combining the two improved methods, the AP, AP50, and AP75 increased by 4.1%, 6.6%, and 3.5%, respectively. The improvement in the average precision shows that the enhancement of real feature information and label adaptive allocation strategy played an effective role in the detection of transmission line objects in a complex background.
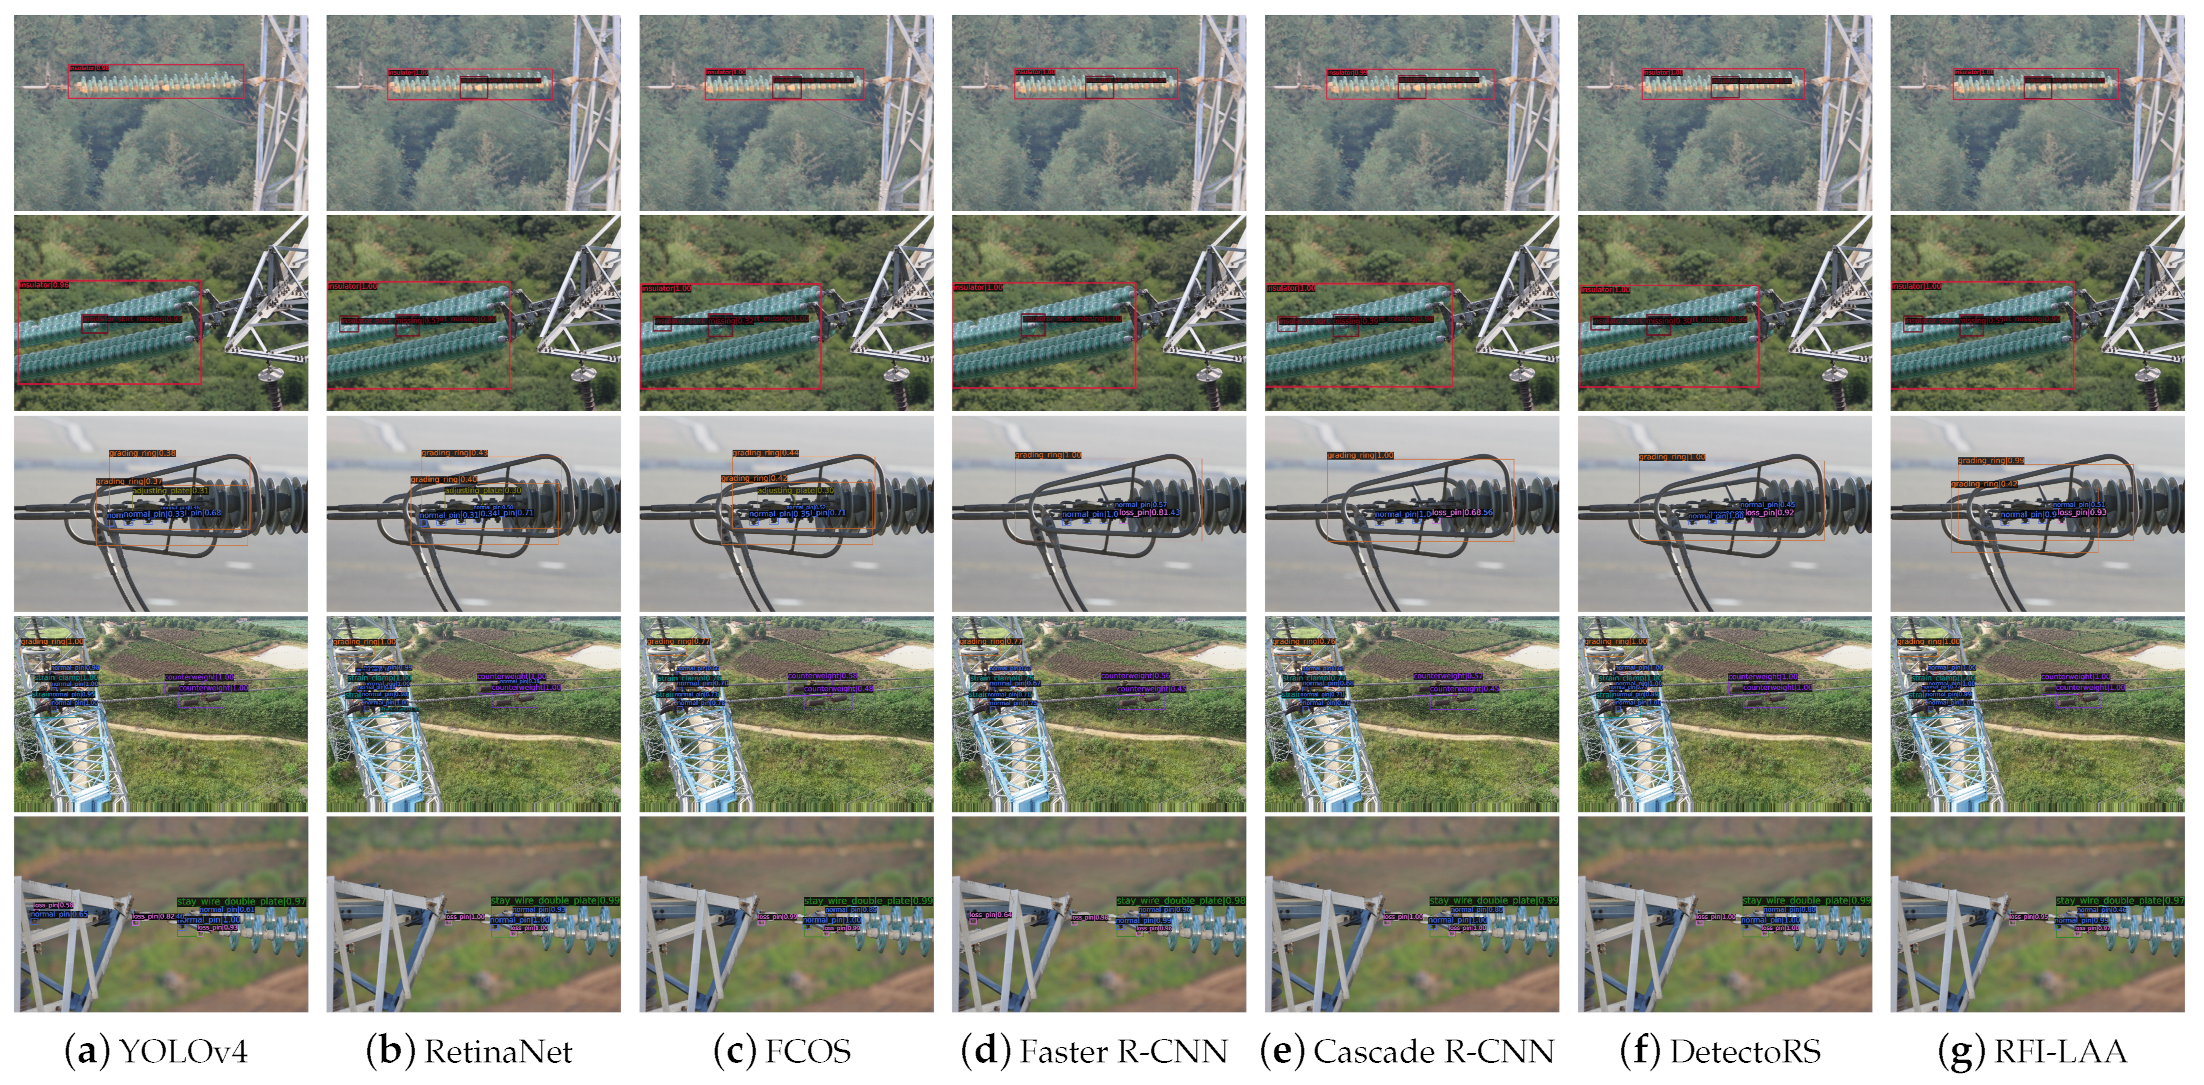
In order to intuitively show the detection results, the tested results are compared visually, as shown in Figure 10. Five main scenarios are considered in the inspection of transmission line, double string insulators, parallel double string insulators, grading ring, strain clamp, and tower connection. By comparing the detection results of the most representative algorithm with the algorithm in this paper, we found that YOLOv4 and Faster R-CNN failed to detect missed insulator skirt due to occlusion. In the grading ring scene, the RFI-LAA algorithm not only detected the grading ring and the adjusting plate, but also accurately detected the pin state, which is difficult to detect. For the strain clamp scene, DetectoRS and RFI-LAA successfully detected the corroded pins on the stay wire double plate, which were not detected by other algorithms. In the scene of the tower connection, many bolts without pins on tower were mistakenly detected as missed pins, but only the RFI-LAA algorithm accurately excluded these easily misdetected objects and correctly detected the normal state bolts, which are easy to be confused under the reflected light.
5. Conclusions
The effort of this paper can improve the detection average precision of objects with small size and irregular shape, such as bolts and insulators in a complex environment. Compared with the origin FCOS, the average precision of the optimized RFI-LAA algorithm is improved by 4.1% in a slice expansion dataset.
Compared with the feature pyramid network, this paper changes the partial convolution connection in the top-down structure and adds the bottom-up structure to make full use of the real feature information and location information in the feature, so as to improve the detection performance of small objects. Compared with the fixed center sampling strategy in one-stage detection, this paper realizes the adaptive allocation of positive and negative sample labels in space and scale through the combination of adjustable Gaussian distribution and confidence weight, so as to reduce the interference of background to the detection accuracy.
To sum up, the one-stage detection method for transmission line object based on enhanced real feature information and label adaptive allocation is proposed in this paper, this method enhances the real feature information in the feature extraction stage and dynamically filters out the background information in detection frame. Experimental results confirm that this algorithm not only improves the accuracy detection of transmission line object, but also successfully makes a contribution to the surface state detection of other hardware and components in transmission line.
Author Contributions
Conceptualization, L.Z. and H.Q.; methodology, L.Z., Z.Z. and H.Q.; software, L.Z.; validation, L.Z.; formal analysis, L.Z., Z.Z. and H.Q.; writing—original draft preparation, L.Z., C.L., Z.Z. and H.Q.; writing—review and editing, L.Z.,C.L., Z.Z. and H.Q.; visualization, L.Z.; funding acquisition, Z.Z. All authors have read and agreed to the published version of the manuscript.
Funding
This research was funded by National Key R&D Program of China OF FUNDER grant number 2020YFB1600704.
Institutional Review Board Statement
Not applicable.
Informed Consent Statement
Not applicable.
Data Availability Statement
Not applicable.
Conflicts of Interest
The authors declare no conflict of interest.
References
- Park, K.C.; Motai, Y.; Yoon, J.R. Acoustic Fault Detection Technique for High-Power Insulators. IEEE Trans. Ind. Electron. 2017, 64, 9699–9708. [Google Scholar] [CrossRef]
- Meng, L.; Peng, Z.; Zhou, J.; Zhang, J.; Lu, Z.; Baumann, A.; Du, Y. Real-Time Detection of Ground Objects Based on Unmanned Aerial Vehicle Remote Sensing with Deep Learning: Application in Excavator Detection for Pipeline Safety. Remote. Sens. 2020, 12, 182. [Google Scholar] [CrossRef] [Green Version]
- Chen, W.; Li, Y.; Li, C. A visual detection method for foreign objects in power lines based on mask R-CNN. Int. J. Ambient. Comput. Intell. 2020, 11, 34–47. [Google Scholar] [CrossRef]
- Chen, W.; Li, Y.; Zhao, Z. InsulatorGAN: A Transmission Line Insulator Detection Model Using Multi-Granularity Conditional Generative Adversarial Nets for UAV Inspection. Remote. Sens. 2021, 13, 3971. [Google Scholar] [CrossRef]
- Qiu, Z.; Zhu, X.; Liao, C.; Shi, D.; Qu, W. Detection of Transmission Line Insulator Defects Based on an Improved Lightweight YOLOv4 Model. Appl. Sci. 2022, 12, 1207. [Google Scholar] [CrossRef]
- Pan, L.; Chen, L.; Zhu, S.; Tong, W.; Guo, L. Research on Small Sample Data-Driven Inspection Technology of UAV for Transmission Line Insulator Defect Detection. Information 2022, 13, 276. [Google Scholar] [CrossRef]
- Chen, W.; Li, Y.; Zhao, Z. Missing-Sheds Granularity Estimation of Glass Insulators Using Deep Neural Networks Based on Optical Imaging. Sensors 2022, 22, 1737. [Google Scholar] [CrossRef]
- Chen, W.; Li, Y.; Zhao, Z. Transmission Line Vibration Damper Detection Using Deep Neural Networks Based on UAV Remote Sensing Image. Sensors 2022, 22, 1892. [Google Scholar] [CrossRef]
- Chen, W.; Li, Y.; Zhao, Z. Transmission Line Vibration Damper Detection Using Multi-Granularity Conditional Generative Adversarial Nets Based on UAV Inspection Images. Sensors 2022, 22, 886. [Google Scholar] [CrossRef]
- Qiu, Z.; Zhu, X.; Liao, C.; Shi, D.; Kuang, Y.; Li, Y.; Zhang, Y. Detection of bird species related to transmission line faults based on lightweight convolutional neural network. IET Gener. Transm. Distrib. 2022, 16, 869–881. [Google Scholar] [CrossRef]
- Zhang, H.; Wu, L.; Chen, Y.; Chen, R.; Kong, S.; Wang, Y.; Hu, J.; Wu, J. Attention-Guided Multitask Convolutional Neural Network for Power Line Parts Detection. IEEE Trans. Instrum. Meas. 2022, 71, 1–13. [Google Scholar] [CrossRef]
- Ren, S.; He, K.; Girshick, R.; Sun, J. Faster R-CNN: Towards Real-Time Object Detection with Region Proposal Networks. In Proceedings of the Advances in Neural Information Processing Systems, Montreal, Canada, 7–12 December 2015; Cortes, C., Lawrence, N., Lee, D., Sugiyama, M., Garnett, R., Eds.; Curran Associates, Inc.: Red Hook, NY, USA, 2015; Volume 28. [Google Scholar]
- Dai, J.; Li, Y.; He, K.; Sun, J. R-FCN: Object Detection via Region-based Fully Convolutional Networks. arXiv 2016, arXiv:1605.06409. Available online: https://doi.org/10.48550/ARXIV.1605.06409 (accessed on 21 June 2021).
- Lin, T.Y.; Dollár, P.; Girshick, R.; He, K.; Hariharan, B.; Belongie, S. Feature pyramid networks for object detection. In Proceedings of the IEEE Conference on Computer Vision and Pattern Recognition, Honolulu, HI, USA, 21–26 July 2017; pp. 2117–2125. [Google Scholar]
- Redmon, J.; Farhadi, A. YOLO9000: Better, faster, stronger. In Proceedings of the IEEE Conference on Computer Vision and Pattern Recognition, Honolulu, HI, USA, 21–26 July 2017; pp. 7263–7271. [Google Scholar]
- Redmon, J.; Farhadi, A. Yolov3: An incremental improvement. arXiv 2018, arXiv:1804.02767. [Google Scholar]
- Dewi, C.; Chen, R.C.; Jiang, X.; Yu, H. Deep convolutional neural network for enhancing traffic sign recognition developed on Yolo V4. Multimed. Tools Appl. 2022, 1–25. [Google Scholar] [CrossRef]
- Liu, W.; Anguelov, D.; Erhan, D.; Szegedy, C.; Reed, S.; Fu, C.Y.; Berg, A.C. SSD: Single Shot MultiBox Detector. In Proceedings of the Computer Vision—ECCV 2016, Amsterdam, Netherlands, 8–16 October 2016; Leibe, B., Matas, J., Sebe, N., Welling, M., Eds.; Springer International Publishing: Cham, Switzerland, 2016; pp. 21–37. [Google Scholar]
- Lin, T.Y.; Goyal, P.; Girshick, R.; He, K.; Dollar, P. Focal Loss for Dense Object Detection. In Proceedings of the IEEE International Conference on Computer Vision (ICCV), Venice, Italy, 22–29 October 2017. [Google Scholar]
- Law, H.; Deng, J. CornerNet: Detecting Objects as Paired Keypoints. In Proceedings of the European Conference on Computer Vision (ECCV), Munich, Germany, 8–14 September 2018. [Google Scholar]
- Zhou, X.; Zhuo, J.; Krahenbuhl, P. Bottom-Up Object Detection by Grouping Extreme and Center Points. In Proceedings of the IEEE/CVF Conference on Computer Vision and Pattern Recognition (CVPR), Long Beach, CA, USA, 15–20 June 2019. [Google Scholar]
- Duan, K.; Bai, S.; Xie, L.; Qi, H.; Huang, Q.; Tian, Q. CenterNet: Keypoint Triplets for Object Detection. In Proceedings of the IEEE/CVF Conference on Computer Vision and Pattern Recognition (CVPR), Long Beach, CA, USA, 15–20 June 2019. [Google Scholar]
- Redmon, J.; Divvala, S.; Girshick, R.; Farhadi, A. You Only Look Once: Unified, Real-Time Object Detection. In Proceedings of the IEEE Conference on Computer Vision and Pattern Recognition (CVPR), Las Vegas, NV, USA, 27–30 June 2016. [Google Scholar]
- Zhu, C.; He, Y.; Savvides, M. Feature Selective Anchor-Free Module for Single-Shot Object Detection. In Proceedings of the IEEE/CVF Conference on Computer Vision and Pattern Recognition (CVPR), Long Beach, CA, USA, 15–20 June 2019. [Google Scholar]
- Tian, Z.; Shen, C.; Chen, H.; He, T. FCOS: Fully Convolutional One-Stage Object Detection. In Proceedings of the IEEE/CVF Conference on Computer Vision and Pattern Recognition (CVPR), Long Beach, CA, USA, 15–20 June 2019; pp. 9627–9636. [Google Scholar]
- Deng, C.; Wang, M.; Liu, L.; Liu, Y.; Jiang, Y. Extended Feature Pyramid Network for Small Object Detection. IEEE Trans. Multimed. 2022, 24, 1968–1979. [Google Scholar] [CrossRef]
- Lim, J.S.; Astrid, M.; Yoon, H.J.; Lee, S.I. Small Object Detection using Context and Attention. In Proceedings of the 2021 International Conference on Artificial Intelligence in Information and Communication (ICAIIC), Jeju Island, Korea, 13–16 April 2021; pp. 181–186. [Google Scholar] [CrossRef]
- Zhou, X.; Xu, X.; Liang, W.; Zeng, Z.; Shimizu, S.; Yang, L.T.; Jin, Q. Intelligent Small Object Detection for Digital Twin in Smart Manufacturing With Industrial Cyber-Physical Systems. IEEE Trans. Ind. Inform. 2022, 18, 1377–1386. [Google Scholar] [CrossRef]
- Deng, F.; Xie, Z.; Mao, W.; Li, B.; Shan, Y.; Wei, B.; Zeng, H. Research on edge intelligent recognition method oriented to transmission line insulator fault detection. Int. J. Electr. Power Energy Syst. 2022, 139, 108054. [Google Scholar] [CrossRef]
- Zhao, W.; Xu, M.; Cheng, X.; Zhao, Z. An Insulator in Transmission Lines Recognition and Fault Detection Model Based on Improved Faster RCNN. IEEE Trans. Instrum. Meas. 2021, 70, 1–8. [Google Scholar] [CrossRef]
- Li, X.; Su, H.; Liu, G. Insulator Defect Recognition Based on Global Detection and Local Segmentation. IEEE Access 2020, 8, 59934–59946. [Google Scholar] [CrossRef]
- Liang, H.; Zuo, C.; Wei, W. Detection and Evaluation Method of Transmission Line Defects Based on Deep Learning. IEEE Access 2020, 8, 38448–38458. [Google Scholar] [CrossRef]
- Ma, Y.; Li, Q.; Chu, L.; Zhou, Y.; Xu, C. Real-Time Detection and Spatial Localization of Insulators for UAV Inspection Based on Binocular Stereo Vision. Remote. Sens. 2021, 13, 230. [Google Scholar] [CrossRef]
- Chaoyue, G.; Zhe, L.; Jintao, S.; Gehao, S.; Xiuchen, J. Pin Defect Detection Method of UAV Patrol Overhead Line Based on Cascaded Convolution Network. J. Phys. Conf. Ser. 2020, 1659, 012021. [Google Scholar] [CrossRef]
- Bochkovskiy, A.; Wang, C.Y.; Liao, H.Y.M. YOLOv4: Optimal Speed and Accuracy of Object Detection. arXiv 2020, arXiv:2004.10934. [Google Scholar] [CrossRef]
- Cai, Z.; Vasconcelos, N. Cascade R-CNN: Delving Into High Quality Object Detection. In Proceedings of the IEEE Conference on Computer Vision and Pattern Recognition (CVPR), Salt Lake City, UT, USA, 18–23 June 2018; pp. 6154–6162. [Google Scholar]
- Qiao, S.; Chen, L.C.; Yuille, A. DetectoRS: Detecting Objects With Recursive Feature Pyramid and Switchable Atrous Convolution. In Proceedings of the IEEE/CVF Conference on Computer Vision and Pattern Recognition (CVPR), Long Beach, CA, USA, 15–20 June 2019; pp. 10213–10224. [Google Scholar]
Figure 1.
(a) 3D display of defect insulator with umbrella skirt missed. (b) Real defect insulator with a uniform background. (c) Real defect insulator with a complex background.
Figure 1.
(a) 3D display of defect insulator with umbrella skirt missed. (b) Real defect insulator with a uniform background. (c) Real defect insulator with a complex background.

Figure 2.
3D display of the bolt. Position relationship between the pin and the bolt from the (a) front view and (b) from the bottom view. Bolt component without the pin (c) from the front view and (d) from the bottom view.
Figure 2.
3D display of the bolt. Position relationship between the pin and the bolt from the (a) front view and (b) from the bottom view. Bolt component without the pin (c) from the front view and (d) from the bottom view.

Figure 3.
Detection architecture for label adaptive allocation based on real feature information enhancement.
Figure 3.
Detection architecture for label adaptive allocation based on real feature information enhancement.

Figure 4.
Two different feature fusion methods. (a) The feature layer is enlarged with 1 × 1 convolution and upsampling. (b) Sub-pixel convolution is used to replace 1 × 1 convolution and upsampling to reduce the loss of real feature information in the feature transfer.
Figure 4.
Two different feature fusion methods. (a) The feature layer is enlarged with 1 × 1 convolution and upsampling. (b) Sub-pixel convolution is used to replace 1 × 1 convolution and upsampling to reduce the loss of real feature information in the feature transfer.

Figure 5.
Projection of Gaussian distribution acts on the insulator surface. (a) Fitting effect of bivariate Gaussian distribution. (b) Fitting effect of bivariate Gaussian distribution on the left side and univariate Gaussian distribution on the right side.
Figure 5.
Projection of Gaussian distribution acts on the insulator surface. (a) Fitting effect of bivariate Gaussian distribution. (b) Fitting effect of bivariate Gaussian distribution on the left side and univariate Gaussian distribution on the right side.

Figure 6.
Multiangle image of complete bolt structure. (a) Bottle view. (b) Front view of visible pin. (c) Front view of invisible pin.
Figure 6.
Multiangle image of complete bolt structure. (a) Bottle view. (b) Front view of visible pin. (c) Front view of invisible pin.

Figure 7.
Multiangle image of bolt structure with missing pin. (a) Bottle view. (b) Front view of visible pin. (c) Front view of invisible pin.
Figure 7.
Multiangle image of bolt structure with missing pin. (a) Bottle view. (b) Front view of visible pin. (c) Front view of invisible pin.

Figure 8.
Typical object types in transmission line. (a) Scene of grading ring structure. (b) Scene of strain clamp structure. (c) Scene of insulator structure.
Figure 8.
Typical object types in transmission line. (a) Scene of grading ring structure. (b) Scene of strain clamp structure. (c) Scene of insulator structure.

Figure 9.
Visual results of detection of objects with different image sizes.

Figure 10.
Comparison of visual detection results.


Table 1.
The number of objects.
| Object Type | CW | SWDP | GR | SC | ADP | NP | LP | INS | ISM |
|---|---|---|---|---|---|---|---|---|---|
| Label Number | 1604 | 912 | 853 | 858 | 972 | 6621 | 594 | 1018 | 452 |
Table 2.
The number of objects.
| Slicing Setting | Slice Dataset Number | Adjusting Plate | Normal Pin | Loss Pin |
|---|---|---|---|---|
| 1024 pix with 20% | 6400 | 626 | 4806 | 467 |
| 512 pix with 10% | 22,400 | 1454 | 9216 | 830 |
Table 3.
Comparison of results of all kinds of detection algorithms.
| Detection Algorithms | Backbone | CW | SWDP | GR | SC | ADP | NP | LP | INS | ISM | mAP |
|---|---|---|---|---|---|---|---|---|---|---|---|
| YOLOv4 [35] | Darknet-53 | 0.791 | 0.803 | 0.896 | 0.894 | 0.682 | 0.464 | 0.287 | 0.852 | 0.903 | 0.730 |
| RetinaNet [19] | ResNeXt-101 | 0.794 | 0.82 | 0.903 | 0.904 | 0.784 | 0.472 | 0.294 | 0.859 | 0.912 | 0.749 |
| FCOS [25] | ResNet-50 | 0.802 | 0.832 | 0.915 | 0.902 | 0.799 | 0.488 | 0.301 | 0.867 | 0.919 | 0.758 |
| Faster R-CNN [12] | ResNet-101 | 0.784 | 0.799 | 0.886 | 0.864 | 0.746 | 0.501 | 0.321 | 0.846 | 0.91 | 0.739 |
| Cascade R-CNN [36] | ResNet-50 | 0.822 | 0.845 | 0.921 | 0.91 | 0.804 | 0.542 | 0.342 | 0.874 | 0.922 | 0.776 |
| DetectoRS [37] | ResNet-50 | 0.862 | 0.932 | 0.926 | 0.822 | 0.573 | 0.369 | 0.901 | 0.936 | 0.796 | |
| RFI-LAA | ResNet-50 | 0.833 | 0.885 | 0.937 | 0.948 | 0.826 | 0.601 | 0.402 | 0.920 | 0.969 | 0.813 |
| RFI-LAA(1024pix) | ResNet-50 | 0.836 | 0.892 | 0.894 | 0.944 | 0.847 | 0.873 | 0.601 | 0.916 | 0.962 | 0.863 |
| RFI-LAA(512pix) | ResNet-50 | 0.838 | 0.89 | 0.872 | 0.939 | 0.876 | 0.921 | 0.736 | 0.919 | 0.964 | 0.884 |
Table 4.
Detection results of objects with different image sizes.
| Input Size | CW | SWDP | GR | SC | ADP | NP | LP | INS | ISM | mAP | Flops |
|---|---|---|---|---|---|---|---|---|---|---|---|
| 1333 × 800 | 0.803 | 0.849 | 0.898 | 0.903 | 0.786 | 0.549 | 0.376 | 0.908 | 0.936 | 0.779 | 187.13 |
| 1499 × 900 | 0.81 | 0.851 | 0.902 | 0.915 | 0.793 | 0.558 | 0.379 | 0.912 | 0.945 | 0.785 | 247.06 |
| 1666 × 1000 | 0.819 | 0.869 | 0.914 | 0.927 | 0.805 | 0.566 | 0.385 | 0.911 | 0.955 | 0.795 | 304.03 |
| 1832 × 1100 | 0.822 | 0.873 | 0.924 | 0.936 | 0.817 | 0.574 | 0.394 | 0.914 | 0.962 | 0.802 | 367.44 |
| 1999 × 1200 | 0.833 | 0.885 | 0.937 | 0.948 | 0.826 | 0.601 | 0.402 | 0.92 | 0.969 | 0.813 | 426.53 |
Table 5.
Compared results of ablation experiment.
| NECK | HEAD | AP% | AP% | AP% | |
|---|---|---|---|---|---|
| FPN | RFI-FPN | LLA | |||
| √ | 53.1 | 81.8 | 44.8 | ||
| √ | 54.4 | 83.5 | 45.5 | ||
| √ | √ | 55.9 | 85.6 | 47.5 | |
| √ | √ | 57.2 | 88.4 | 48.3 | |
Publisher’s Note: MDPI stays neutral with regard to jurisdictional claims in published maps and institutional affiliations. |
© 2022 by the authors. Licensee MDPI, Basel, Switzerland. This article is an open access article distributed under the terms and conditions of the Creative Commons Attribution (CC BY) license (https://creativecommons.org/licenses/by/4.0/).
Share and Cite
MDPI and ACS Style
Zhao, L.; Liu, C.; Zhang, Z.; Qu, H. Transmission Line Object Detection Method Based on Label Adaptive Allocation. Mathematics 2022, 10, 2150. https://doi.org/10.3390/math10122150
AMA Style
Zhao L, Liu C, Zhang Z, Qu H. Transmission Line Object Detection Method Based on Label Adaptive Allocation. Mathematics. 2022; 10(12):2150. https://doi.org/10.3390/math10122150
Chicago/Turabian StyleZhao, Lijuan, Chang’an Liu, Zheng Zhang, and Hongquan Qu. 2022. "Transmission Line Object Detection Method Based on Label Adaptive Allocation" Mathematics 10, no. 12: 2150. https://doi.org/10.3390/math10122150
Note that from the first issue of 2016, this journal uses article numbers instead of page numbers. See further details here.