
Mass Spectrometry and Pharmacological Approaches to Measuring Cooption and Reciprocal Activation of Receptor Tyrosine Kinases
 , , , and
Abstract
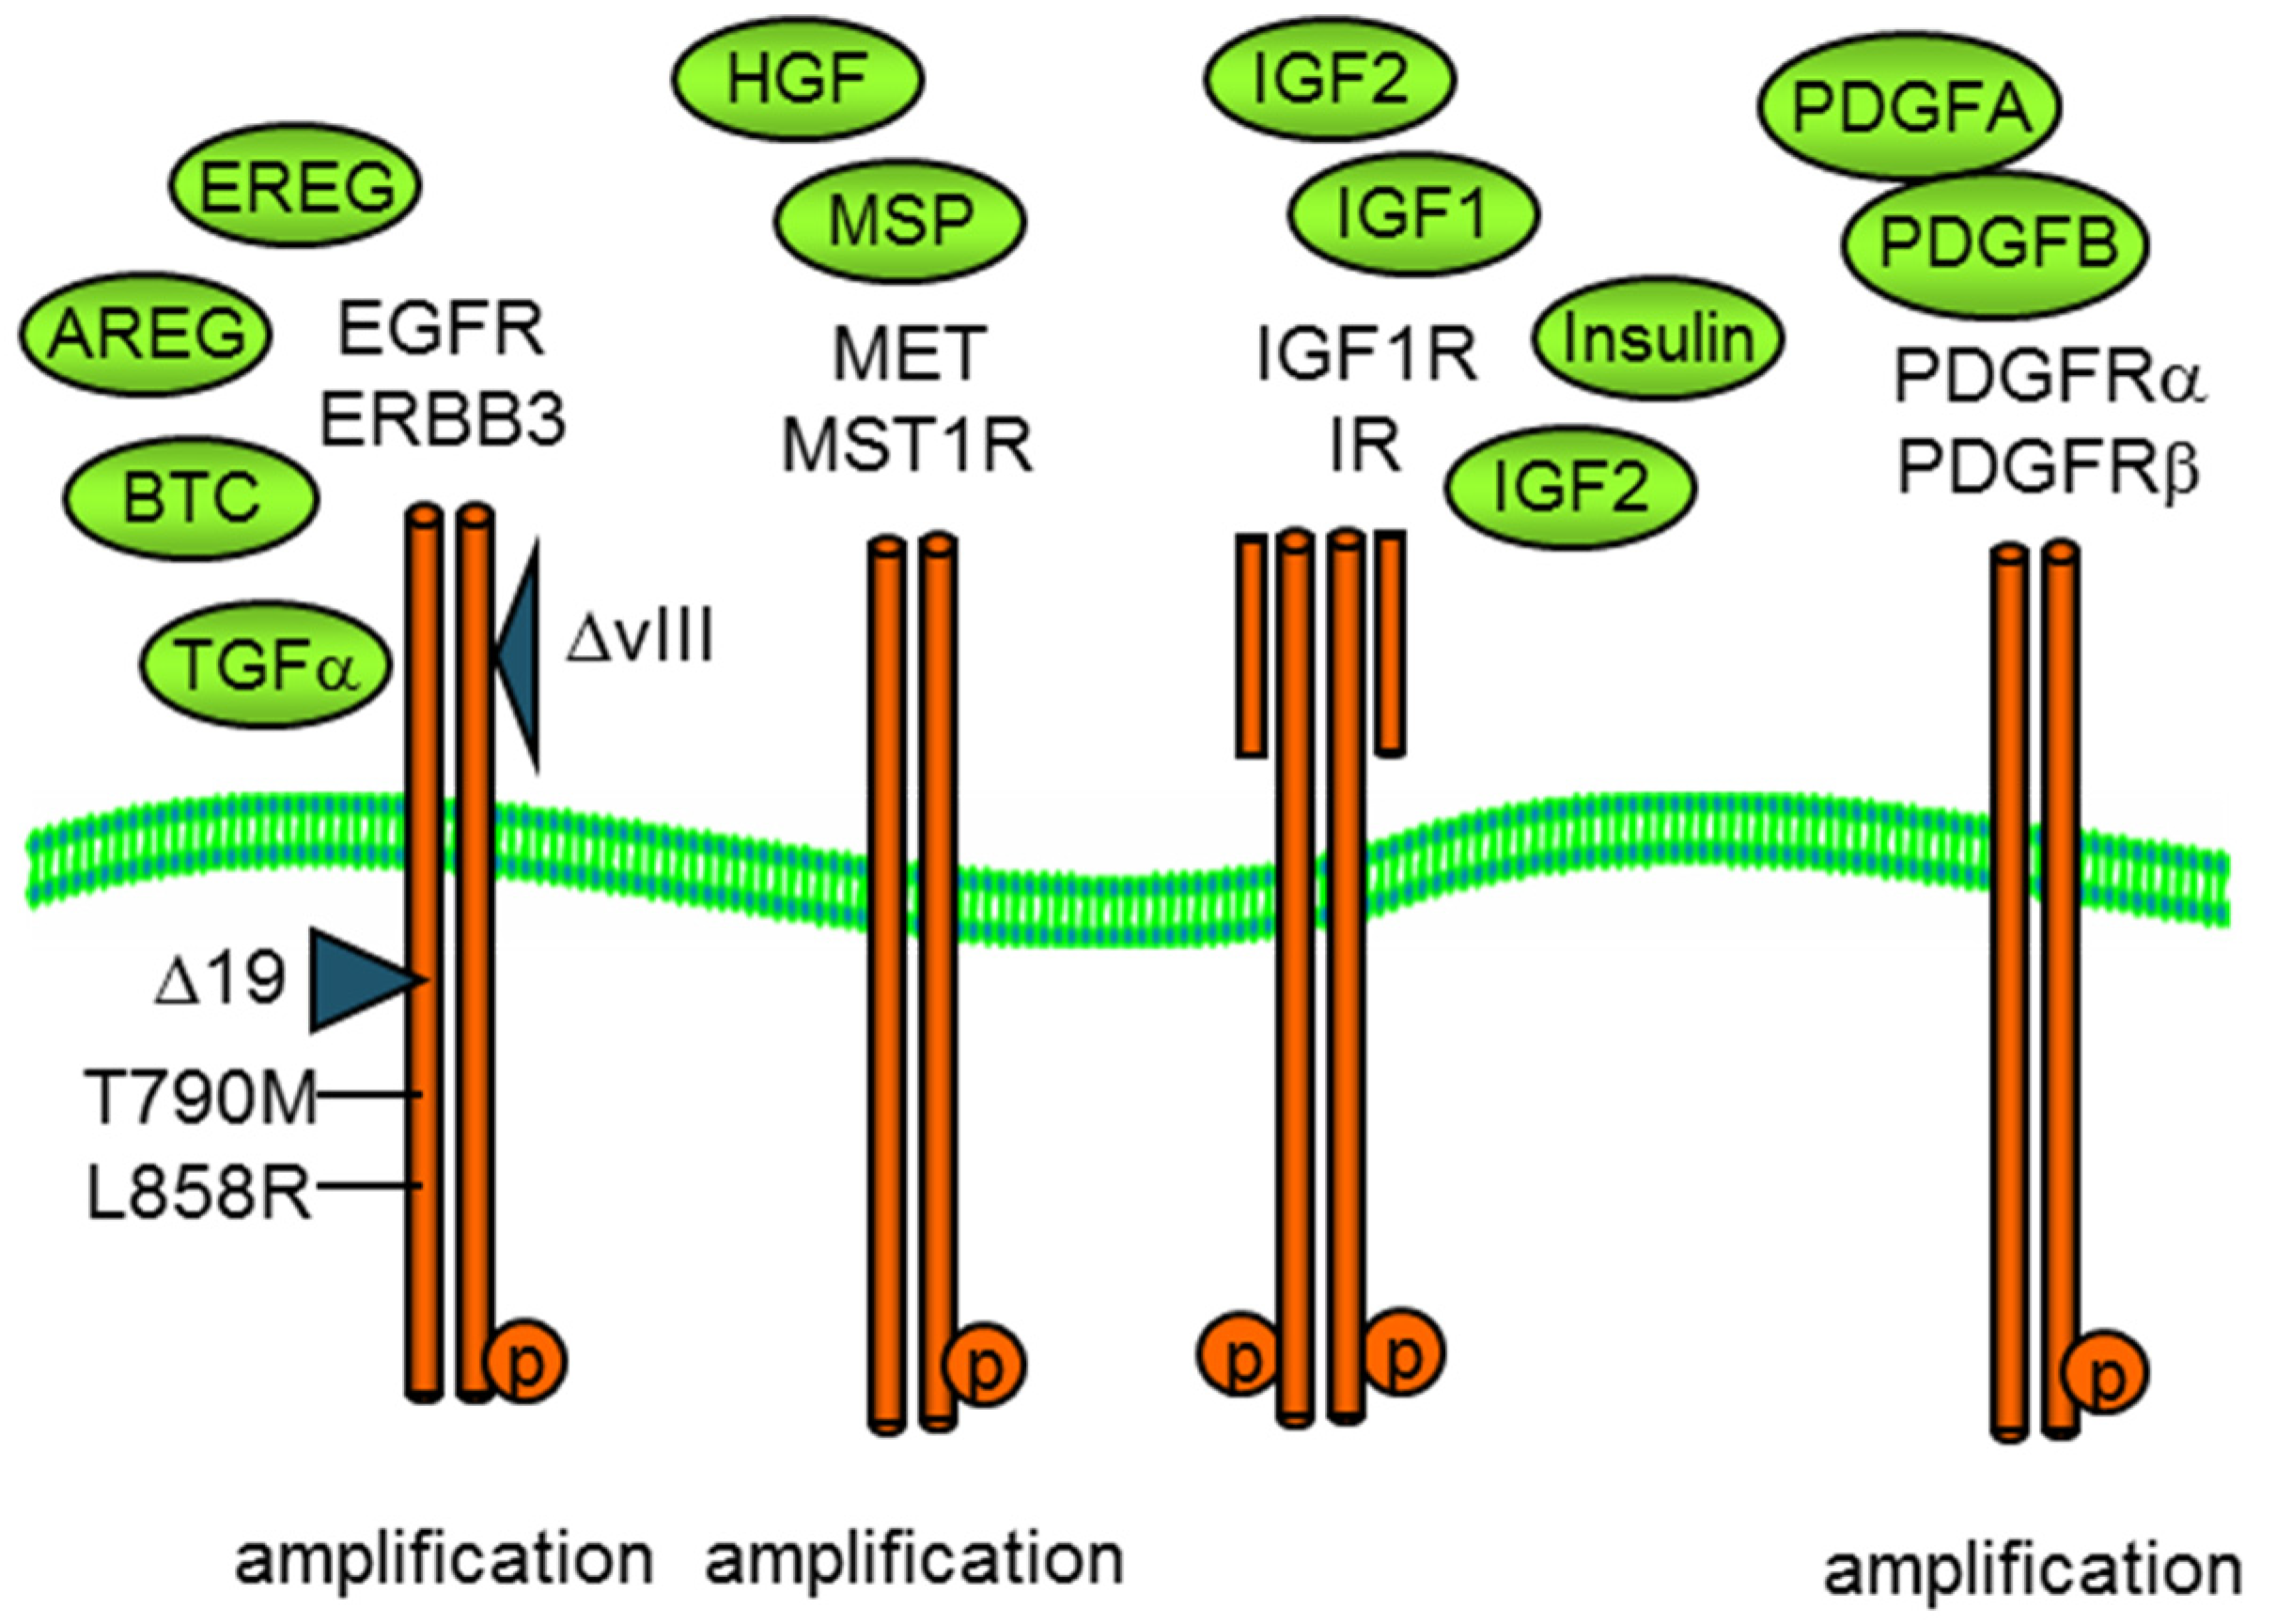
:1. Introduction
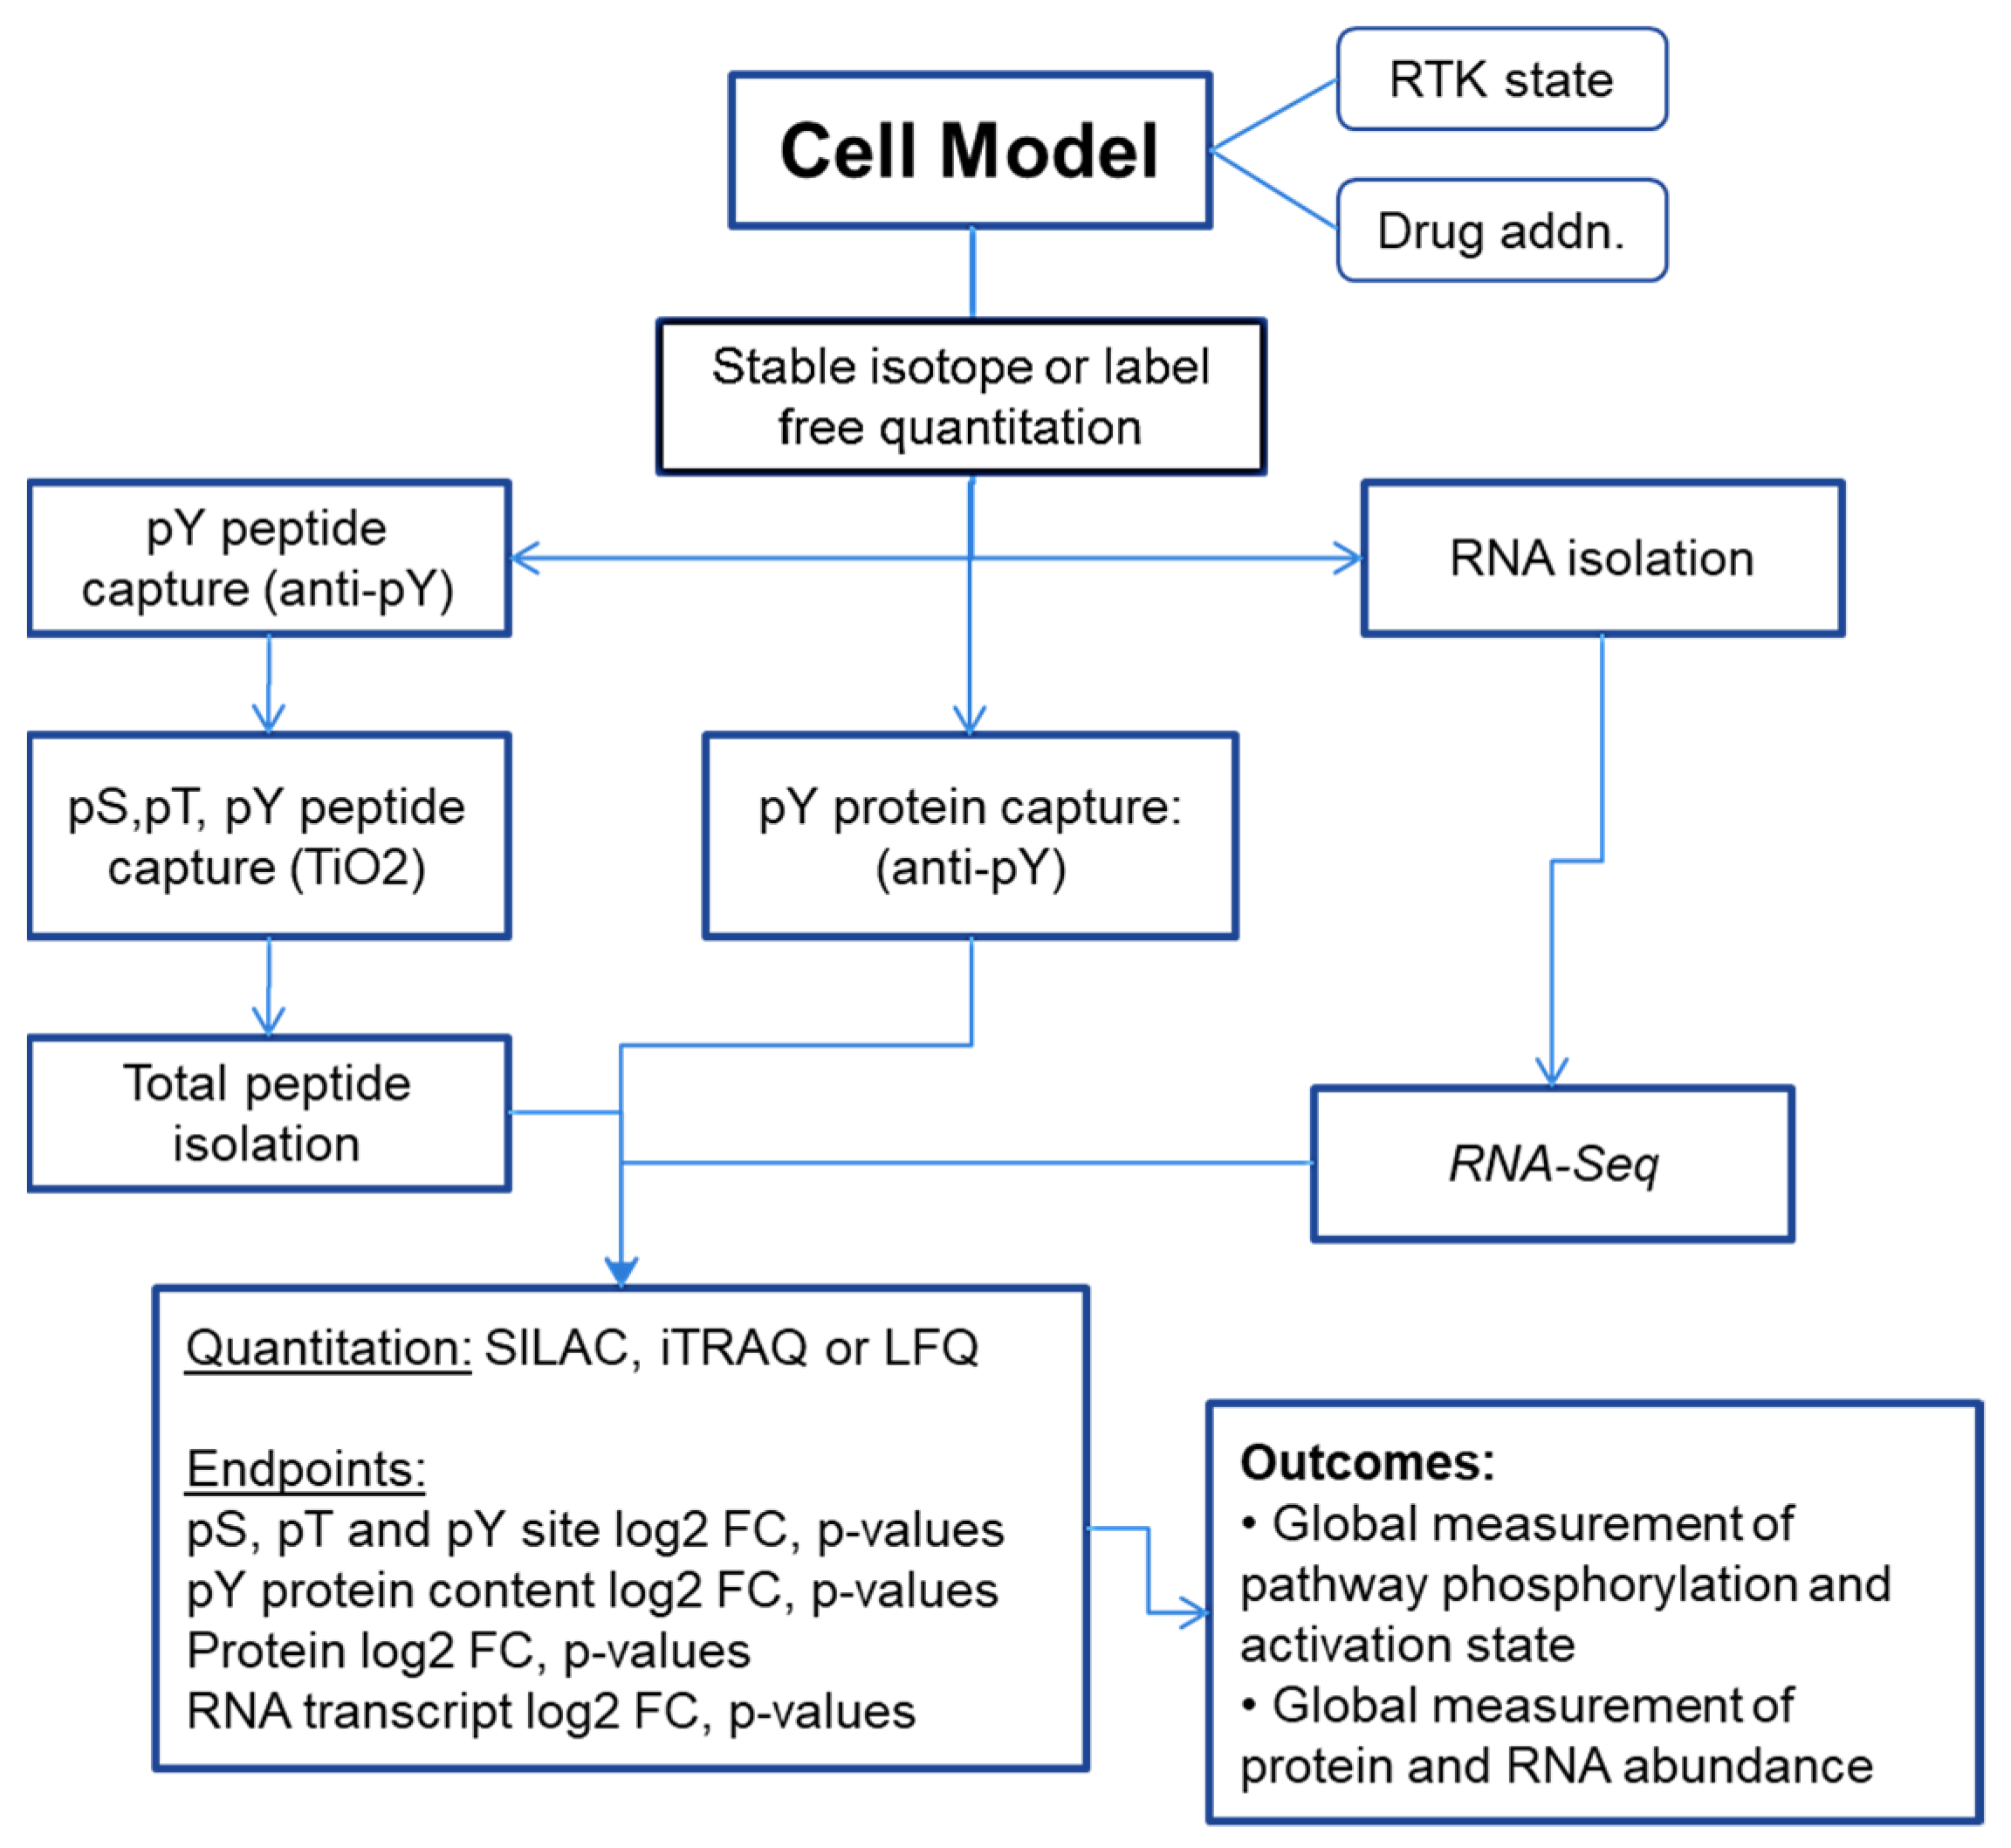
2. Methods
2.1. Cell Culture, Inhibitors, Antibodies, and Immunoblot
2.2. Phosphoprotein and Phosphopeptide Isolation
2.3. LC-MS/MS and Data Analysis Conditions
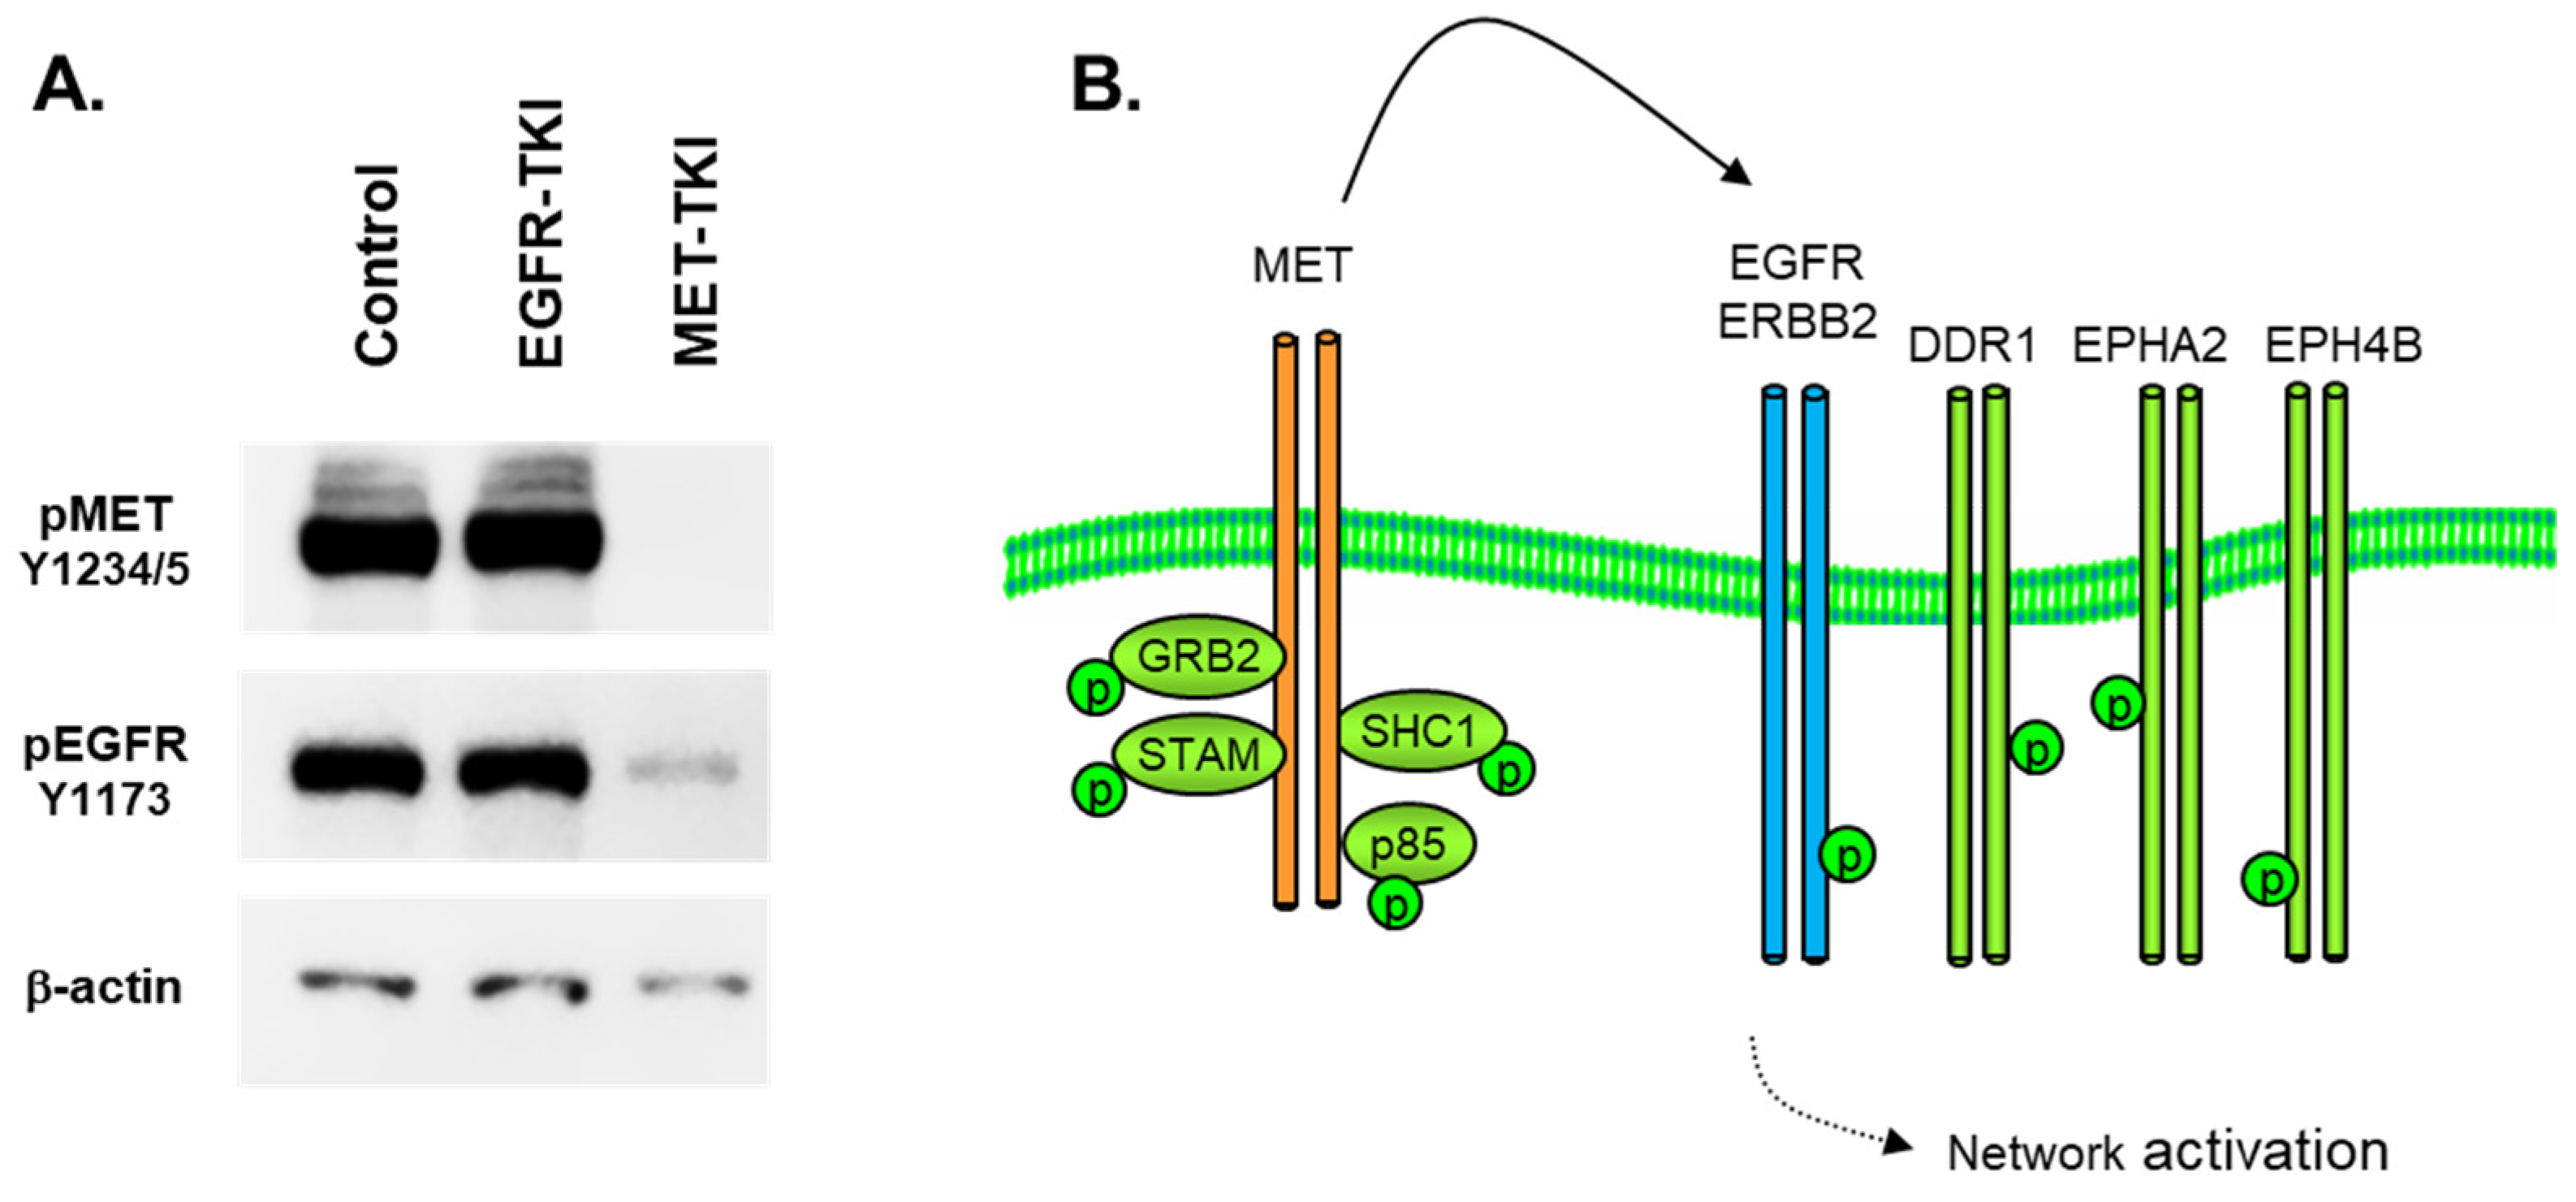
3. Results and Discussion
3.1. Approaches for Defining and Measuring RTK Signaling Networks
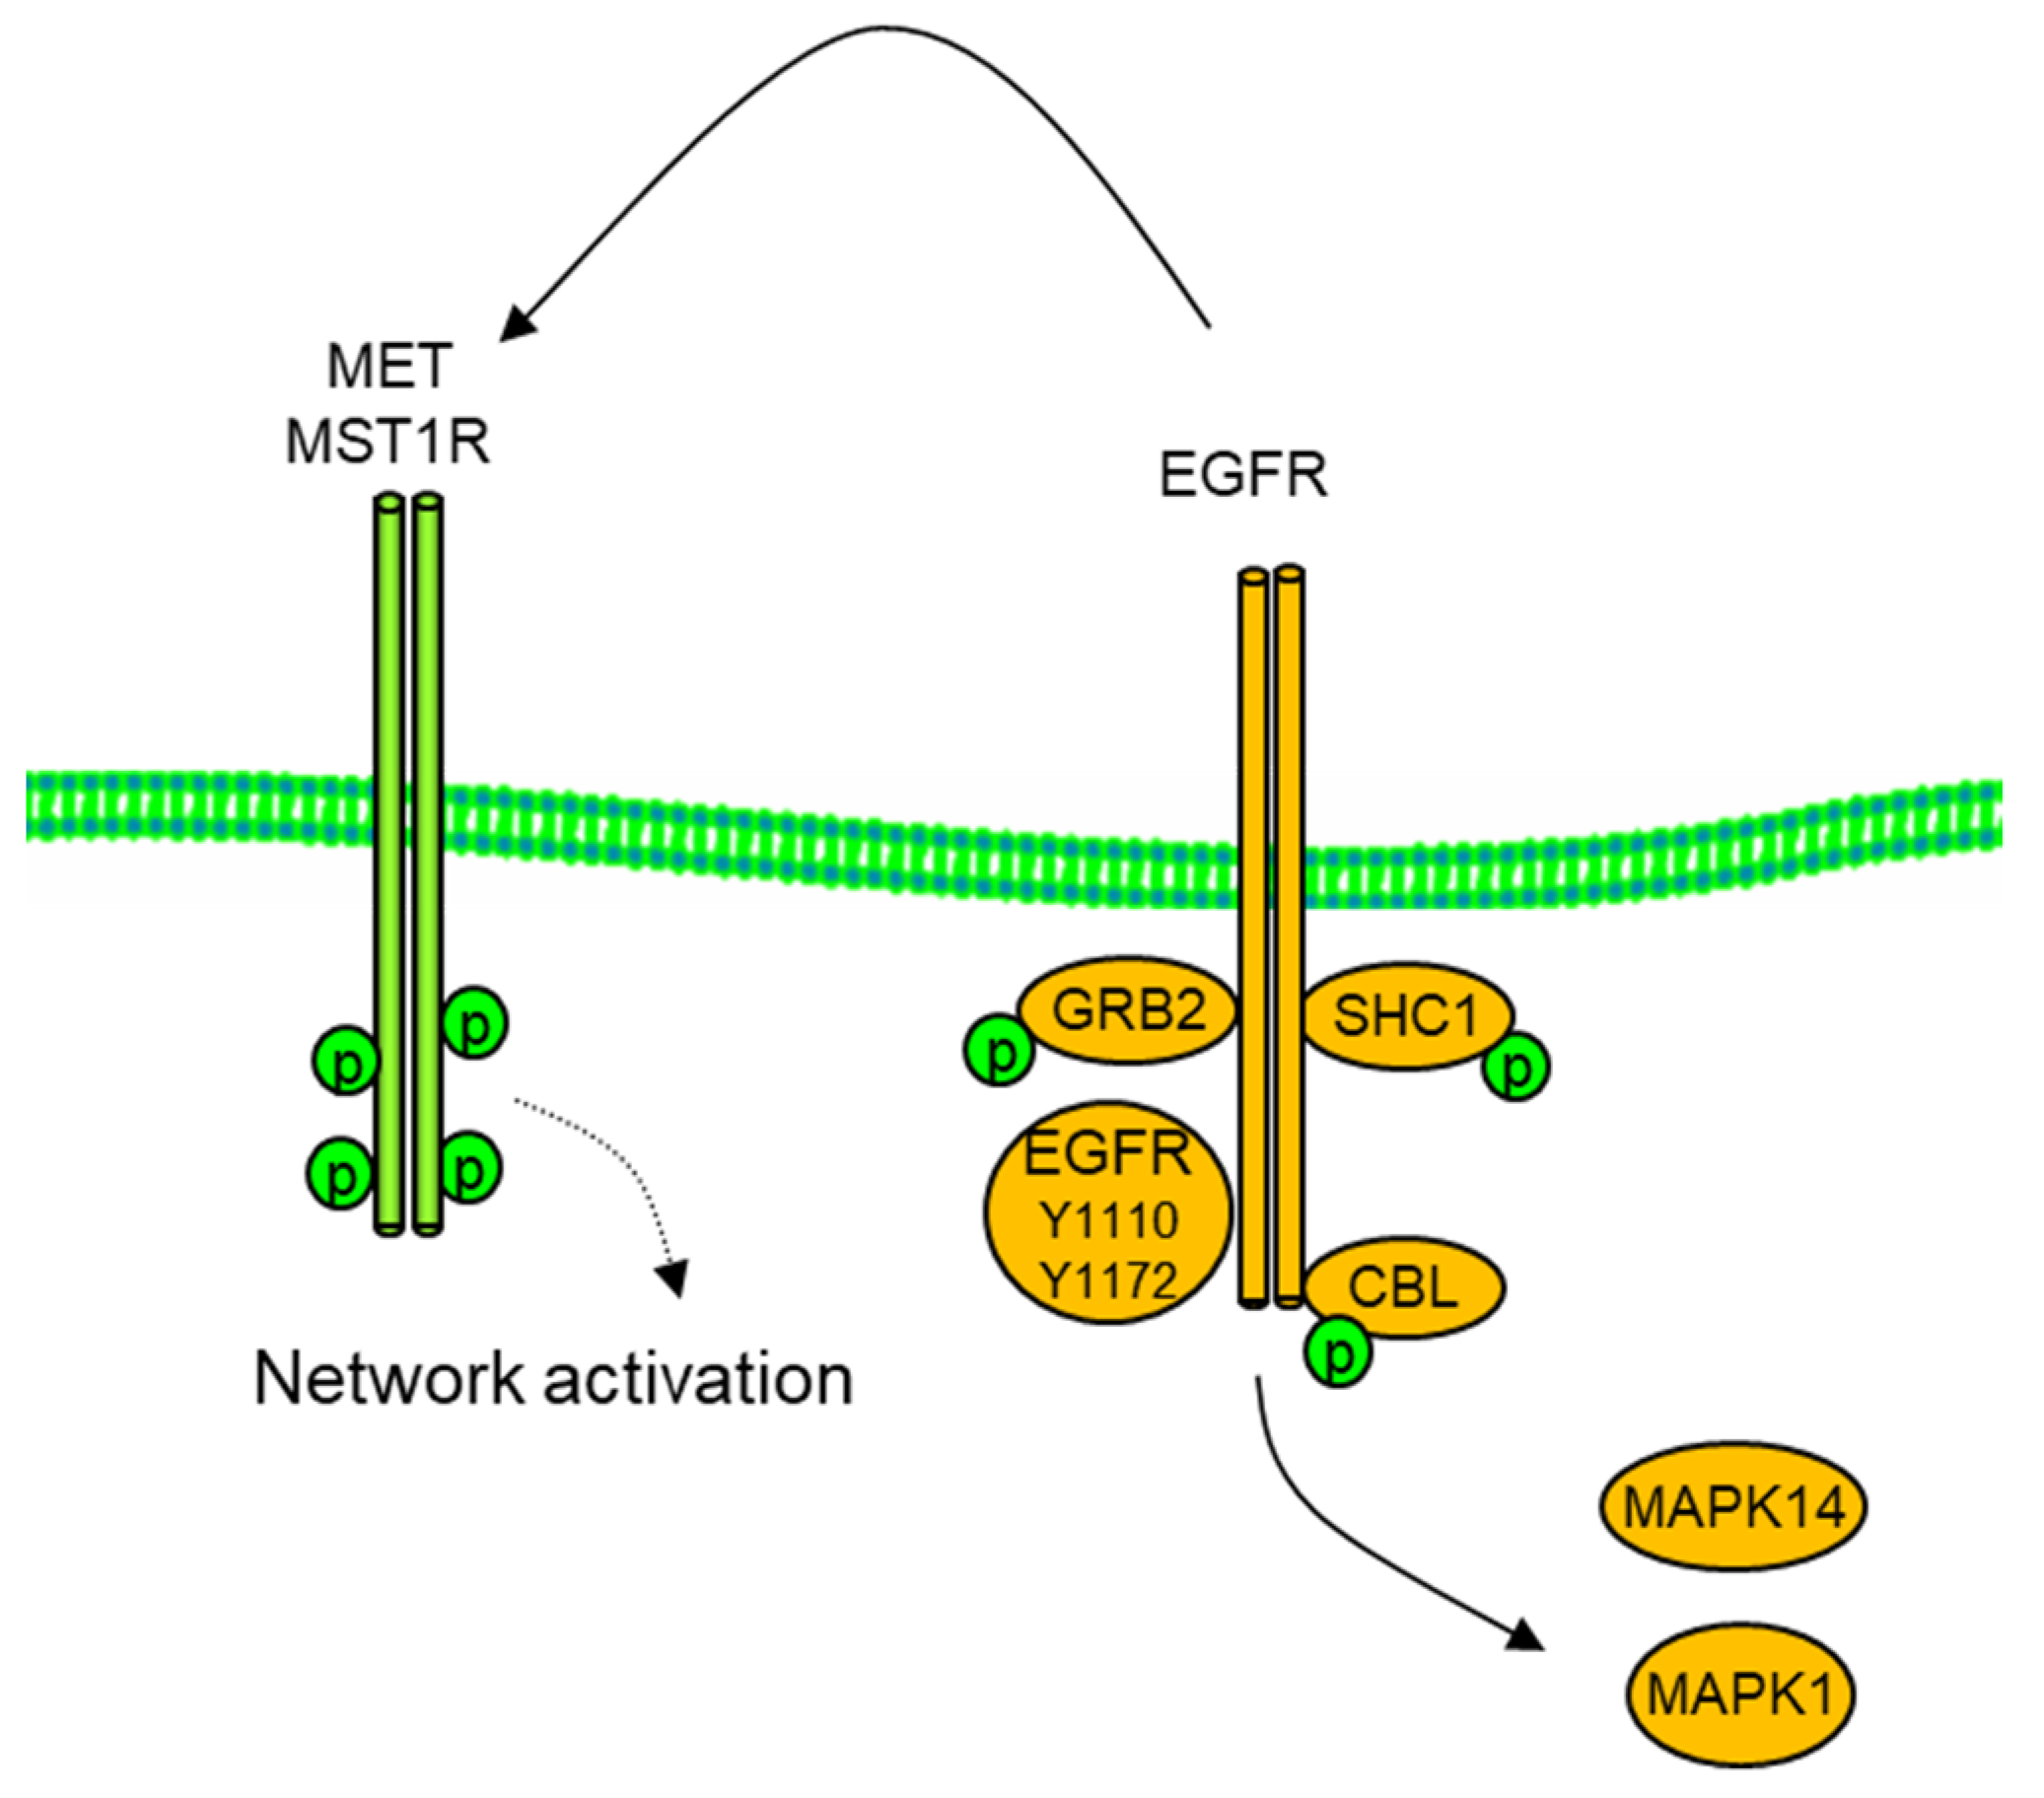
3.2. MET Co-Option of Parallel Pathways in MET-Amplified Cells
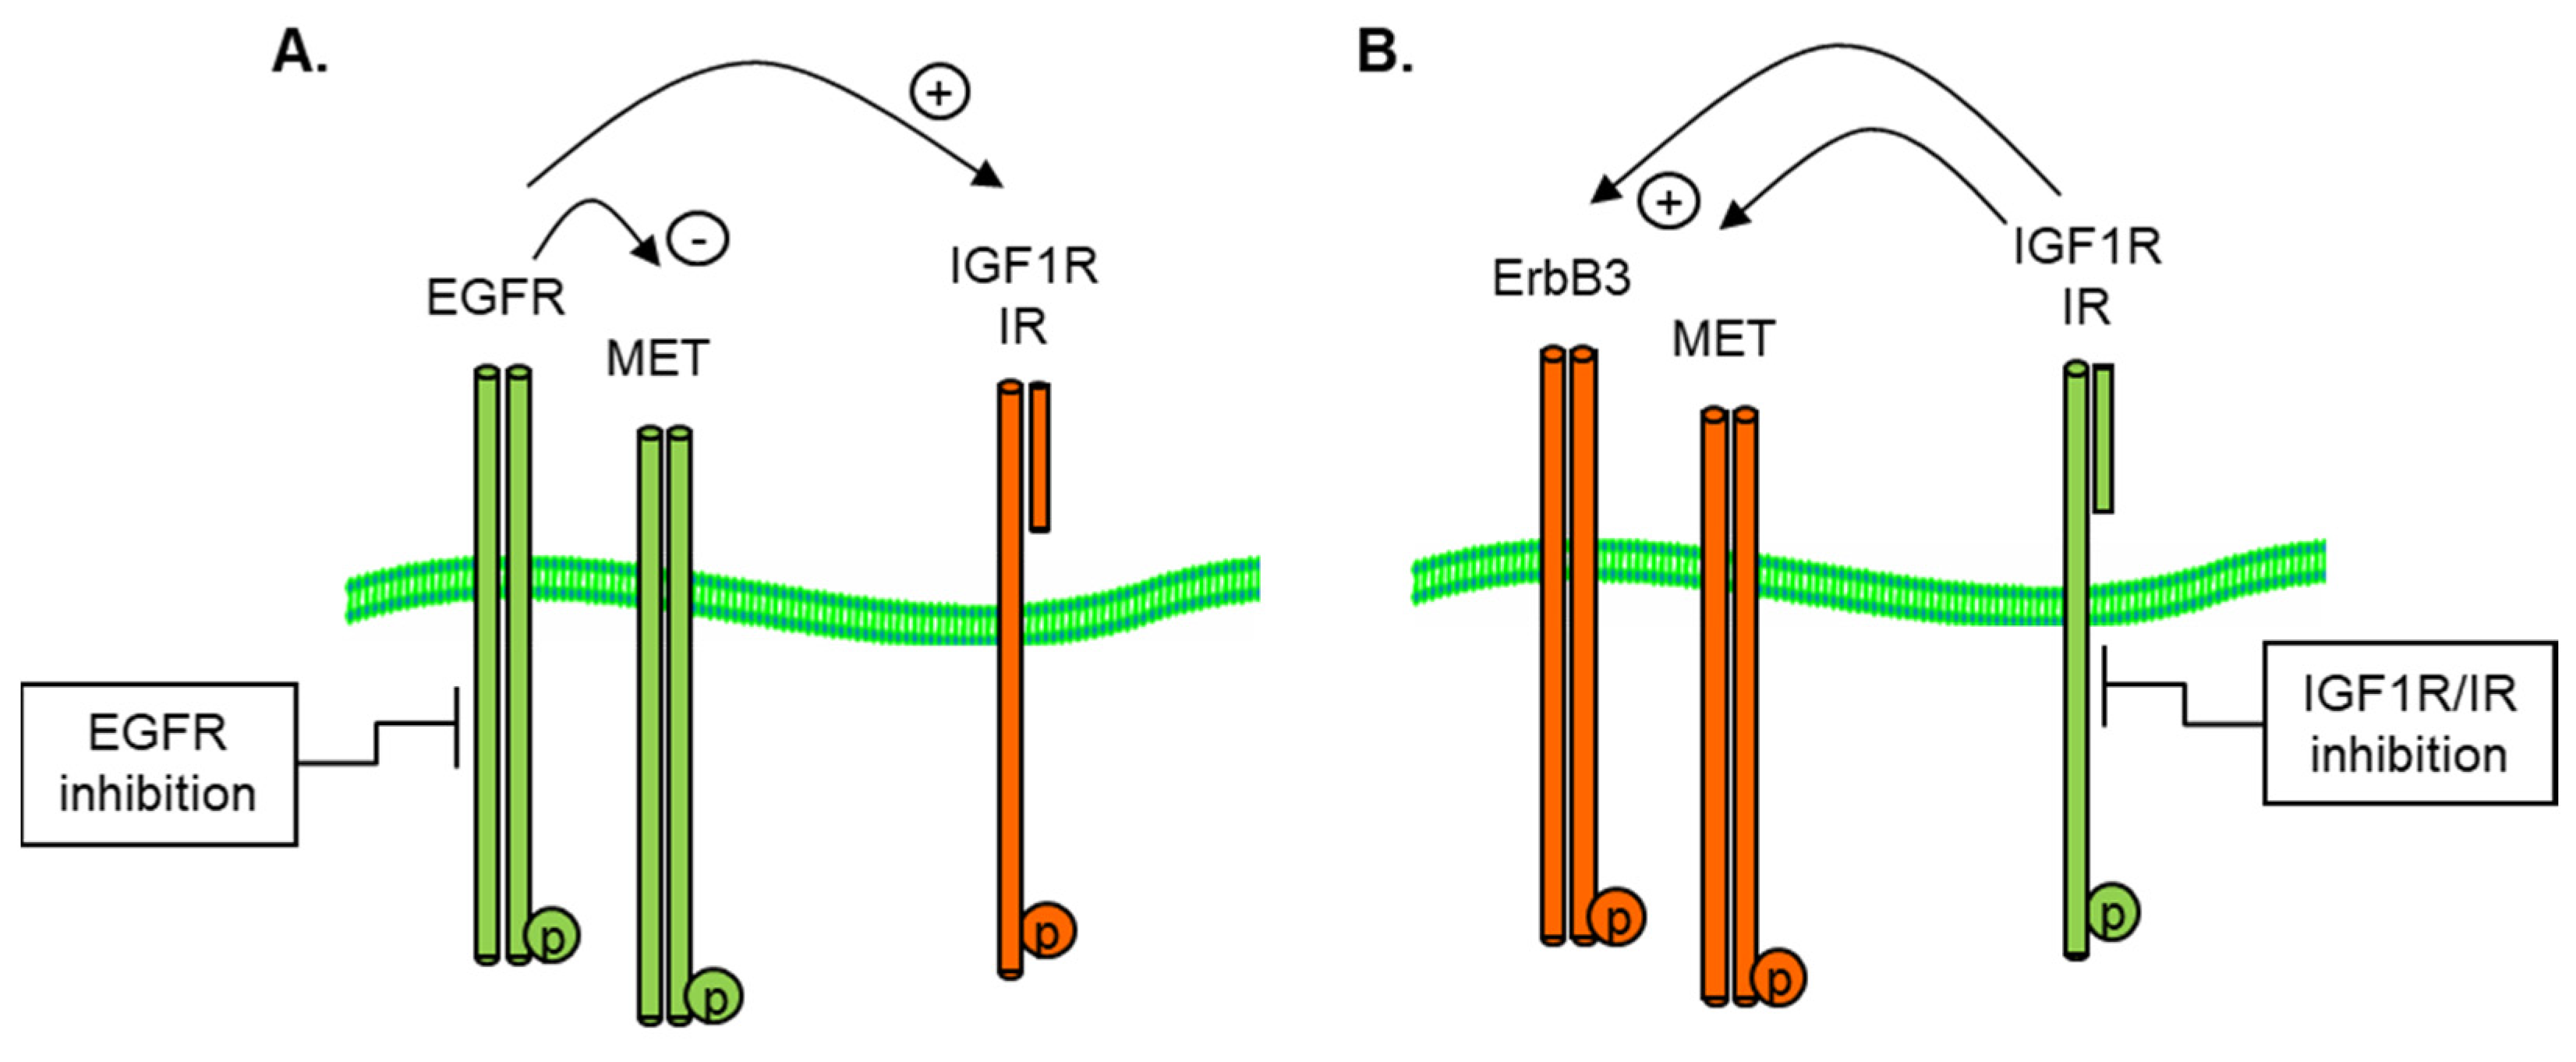
3.3. Reciprocal Activation or Inhibition of IGF1R and IR
3.4. EGFR Co-Option of Tyrosine Kinase Pathways
3.5. Reciprocal PDGFR—EGFR Activation in EMT-Derived Cells
4. Conclusions
Author Contributions
Funding
Institutional Review Board Statement
Informed Consent Statement
Data Availability Statement
Acknowledgments
Conflicts of Interest
References
- Lemmon, M.A.; Schlessinger, J. Cell signaling by receptor tyrosine kinases. Cell 2010, 141, 1117–1134. [Google Scholar] [CrossRef] [PubMed] [Green Version]
- Ullrich, A.; Schlessinger, J. Signal transduction by receptors with tyrosine kinase activity. Cell 1990, 61, 203–212. [Google Scholar] [CrossRef] [PubMed]
- Cohen, P.; Cross, D.; Janne, P.A. Kinase drug discovery 20 years after imatinib: Progress and future directions. Nat. Rev. Drug. Discov. 2021, 20, 551–569. [Google Scholar] [CrossRef] [PubMed]
- Du, Z.; Lovly, C.M. Mechanisms of receptor tyrosine kinase activation in cancer. Mol. Cancer 2018, 17, 58. [Google Scholar] [CrossRef]
- Barr, S.; Thomson, S.; Buck, E.; Russo, S.; Petti, F.; Sujka-Kwok, I.; Eyzaguirre, A.; Rosenfeld-Franklin, M.; Gibson, N.W.; Miglarese, M.; et al. Bypassing cellular EGF receptor dependence through epithelial-to-mesenchymal-like transitions. Clin. Exp. Metastasis 2008, 25, 685–693. [Google Scholar] [CrossRef] [Green Version]
- Petti, F.; Thelemann, A.; Kahler, J.; McCormack, S.; Castaldo, L.; Hunt, T.; Nuwaysir, L.; Zeiske, L.; Haack, H.; Sullivan, L.; et al. Temporal quantitation of mutant Kit tyrosine kinase signaling attenuated by a novel thiophene kinase inhibitor OSI-930. Mol. Cancer Ther. 2005, 4, 1186–1197. [Google Scholar] [CrossRef] [Green Version]
- Ross, P.L.; Huang, Y.N.; Marchese, J.N.; Williamson, B.; Parker, K.; Hattan, S.; Khainovski, N.; Pillai, S.; Dey, S.; Daniels, S.; et al. Multiplexed protein quantitation in Saccharomyces cerevisiae using amine-reactive isobaric tagging reagents. Mol. Cell. Proteom. 2004, 3, 1154–1169. [Google Scholar] [CrossRef] [Green Version]
- Thelemann, A.; Petti, F.; Griffin, G.; Iwata, K.; Hunt, T.; Settinari, T.; Fenyo, D.; Gibson, N.; Haley, J.D. Phosphotyrosine signaling networks in epidermal growth factor receptor overexpressing squamous carcinoma cells. Mol. Cell. Proteom. 2005, 4, 356–376. [Google Scholar] [CrossRef] [Green Version]
- Bradshaw, R.A.; Burlingame, A.L.; Carr, S.; Aebersold, R. Reporting protein identification data: The next generation of guidelines. Mol. Cell. Proteom. 2006, 5, 787–788. [Google Scholar] [CrossRef] [Green Version]
- Budayeva, H.G.; Sengupta-Ghosh, A.; Phu, L.; Moffat, J.G.; Ayalon, G.; Kirkpatrick, D.S. Phosphoproteome Profiling of the Receptor Tyrosine Kinase MuSK Identifies Tyrosine Phosphorylation of Rab GTPases. Mol. Cell. Proteom. 2022, 21, 100221. [Google Scholar] [CrossRef]
- Frackelton, A.R., Jr.; Ross, A.H.; Eisen, H.N. Characterization and use of monoclonal antibodies for isolation of phosphotyrosyl proteins from retrovirus-transformed cells and growth factor-stimulated cells. Mol. Cell. Biol. 1983, 3, 1343–1352. [Google Scholar] [CrossRef] [PubMed]
- Ross, A.H.; Baltimore, D.; Eisen, H.N. Phosphotyrosine-containing proteins isolated by affinity chromatography with antibodies to a synthetic hapten. Nature 1981, 294, 654–656. [Google Scholar] [CrossRef] [PubMed]
- Zhang, Y.; Wolf-Yadlin, A.; Ross, P.L.; Pappin, D.J.; Rush, J.; Lauffenburger, D.A.; White, F.M. Time-resolved mass spectrometry of tyrosine phosphorylation sites in the epidermal growth factor receptor signaling network reveals dynamic modules. Mol. Cell. Proteom. 2005, 4, 1240–1250. [Google Scholar] [CrossRef] [PubMed] [Green Version]
- Zhou, X.X.; Bracken, C.J.; Zhang, K.; Zhou, J.; Mou, Y.; Wang, L.; Cheng, Y.; Leung, K.K.; Wells, J.A. Targeting Phosphotyrosine in Native Proteins with Conditional, Bispecific Antibody Traps. J. Am. Chem. Soc. 2020, 142, 17703–17713. [Google Scholar] [CrossRef]
- Kettenbach, A.N.; Gerber, S.A. Rapid and reproducible single-stage phosphopeptide enrichment of complex peptide mixtures: Application to general and phosphotyrosine-specific phosphoproteomics experiments. Anal. Chem. 2011, 83, 7635–7644. [Google Scholar] [CrossRef] [Green Version]
- Pinkse, M.W.; Uitto, P.M.; Hilhorst, M.J.; Ooms, B.; Heck, A.J. Selective isolation at the femtomole level of phosphopeptides from proteolytic digests using 2D-NanoLC-ESI-MS/MS and titanium oxide precolumns. Anal. Chem. 2004, 76, 3935–3943. [Google Scholar] [CrossRef]
- Posewitz, M.C.; Tempst, P. Immobilized gallium(III) affinity chromatography of phosphopeptides. Anal. Chem. 1999, 71, 2883–2892. [Google Scholar] [CrossRef]
- Rejeeth, C.; Sharma, A. Label-free designed nanomaterials enrichment and separation techniques for phosphoproteomics based on mass spectrometry. Front. Nanotechnol. 2022, 4, 1047055. [Google Scholar] [CrossRef]
- Stensballe, A.; Andersen, S.; Jensen, O.N. Characterization of phosphoproteins from electrophoretic gels by nanoscale Fe(III) affinity chromatography with off-line mass spectrometry analysis. Proteomics 2001, 1, 207–222. [Google Scholar] [CrossRef]
- Paul, M.D.; Hristova, K. The RTK Interactome: Overview and Perspective on RTK Heterointeractions. Chem. Rev. 2019, 119, 5881–5921. [Google Scholar] [CrossRef]
- Bean, J.; Brennan, C.; Shih, J.Y.; Riely, G.; Viale, A.; Wang, L.; Chitale, D.; Motoi, N.; Szoke, J.; Broderick, S.; et al. MET amplification occurs with or without T790M mutations in EGFR mutant lung tumors with acquired resistance to gefitinib or erlotinib. Proc. Natl. Acad. Sci. USA 2007, 104, 20932–20937. [Google Scholar] [CrossRef] [PubMed] [Green Version]
- Engelman, J.A.; Zejnullahu, K.; Mitsudomi, T.; Song, Y.; Hyland, C.; Park, J.O.; Lindeman, N.; Gale, C.M.; Zhao, X.; Christensen, J.; et al. MET amplification leads to gefitinib resistance in lung cancer by activating ERBB3 signaling. Science 2007, 316, 1039–1043. [Google Scholar] [CrossRef] [PubMed]
- McDermott, U.; Pusapati, R.V.; Christensen, J.G.; Gray, N.S.; Settleman, J. Acquired resistance of non-small cell lung cancer cells to MET kinase inhibition is mediated by a switch to epidermal growth factor receptor dependency. Cancer Res. 2010, 70, 1625–1634. [Google Scholar] [CrossRef] [PubMed] [Green Version]
- Zhang, Y.W.; Staal, B.; Essenburg, C.; Lewis, S.; Kaufman, D.; Vande Woude, G.F. Strengthening context-dependent anticancer effects on non-small cell lung carcinoma by inhibition of both MET and EGFR. Mol. Cancer Ther. 2013, 12, 1429–1441. [Google Scholar] [CrossRef] [Green Version]
- Harwardt, M.I.E.; Schroder, M.S.; Li, Y.; Malkusch, S.; Freund, P.; Gupta, S.; Janjic, N.; Strauss, S.; Jungmann, R.; Dietz, M.S.; et al. Single-Molecule Super-Resolution Microscopy Reveals Heteromeric Complexes of MET and EGFR upon Ligand Activation. Int. J. Mol. Sci. 2020, 21, 2803. [Google Scholar] [CrossRef] [PubMed] [Green Version]
- Ortiz-Zapater, E.; Lee, R.W.; Owen, W.; Weitsman, G.; Fruhwirth, G.; Dunn, R.G.; Neat, M.J.; McCaughan, F.; Parker, P.; Ng, T.; et al. MET-EGFR dimerization in lung adenocarcinoma is dependent on EGFR mtations and altered by MET kinase inhibition. PLoS ONE 2017, 12, e0170798. [Google Scholar] [CrossRef] [Green Version]
- Rieger, L.; O’Connor, R. Controlled Signaling—Insulin-Like Growth Factor Receptor Endocytosis and Presence at Intracellular Compartments. Front. Endocrinol. 2021, 11, 620013. [Google Scholar] [CrossRef]
- Turvey, S.J.; McPhillie, M.J.; Kearney, M.T.; Muench, S.P.; Simmons, K.J.; Fishwick, C.W.G. Recent developments in the structural characterisation of the IR and IGF1R: Implications for the design of IR-IGF1R hybrid receptor modulators. RSC Med. Chem. 2022, 13, 360–374. [Google Scholar] [CrossRef]
- Denley, A.; Cosgrove, L.J.; Booker, G.W.; Wallace, J.C.; Forbes, B.E. Molecular interactions of the IGF system. Cytokine Growth Factor. Rev. 2005, 16, 421–439. [Google Scholar] [CrossRef]
- Lero, M.W.; Shaw, L.M. Diversity of insulin and IGF signaling in breast cancer: Implications for therapy. Mol. Cell. Endocrinol. 2021, 527, 111213. [Google Scholar] [CrossRef]
- Buck, E.; Gokhale, P.C.; Koujak, S.; Brown, E.; Eyzaguirre, A.; Tao, N.; Rosenfeld-Franklin, M.; Lerner, L.; Chiu, M.I.; Wild, R.; et al. Compensatory insulin receptor (IR) activation on inhibition of insulin-like growth factor-1 receptor (IGF-1R): Rationale for cotargeting IGF-1R and IR in cancer. Mol. Cancer Ther. 2010, 9, 2652–2664. [Google Scholar] [CrossRef] [PubMed] [Green Version]
- Buck, E.; Eyzaguirre, A.; Rosenfeld-Franklin, M.; Thomson, S.; Mulvihill, M.; Barr, S.; Brown, E.; O’Connor, M.; Yao, Y.; Pachter, J.; et al. Feedback mechanisms promote cooperativity for small molecule inhibitors of epidermal and insulin-like growth factor receptors. Cancer Res. 2008, 68, 8322–8332. [Google Scholar] [CrossRef] [PubMed] [Green Version]
- Lemmon, M.A.; Schlessinger, J.; Ferguson, K.M. The EGFR family: Not so prototypical receptor tyrosine kinases. Cold Spring Harb. Perspect. Biol. 2014, 6, a020768. [Google Scholar] [CrossRef] [PubMed] [Green Version]
- Uribe, M.L.; Marrocco, I.; Yarden, Y. EGFR in Cancer: Signaling Mechanisms, Drugs, and Acquired Resistance. Cancers 2021, 13, 2748. [Google Scholar] [CrossRef]
- Lynch, T.J.; Bell, D.W.; Sordella, R.; Gurubhagavatula, S.; Okimoto, R.A.; Brannigan, B.W.; Harris, P.L.; Haserlat, S.M.; Supko, J.G.; Haluska, F.G.; et al. Activating mutations in the epidermal growth factor receptor underlying responsiveness of non-small-cell lung cancer to gefitinib. N. Engl. J. Med. 2004, 350, 2129–2139. [Google Scholar] [CrossRef]
- Paez, J.G.; Janne, P.A.; Lee, J.C.; Tracy, S.; Greulich, H.; Gabriel, S.; Herman, P.; Kaye, F.J.; Lindeman, N.; Boggon, T.J.; et al. EGFR mutations in lung cancer: Correlation with clinical response to gefitinib therapy. Science 2004, 304, 1497–1500. [Google Scholar] [CrossRef] [Green Version]
- Pao, W.; Miller, V.; Zakowski, M.; Doherty, J.; Politi, K.; Sarkaria, I.; Singh, B.; Heelan, R.; Rusch, V.; Fulton, L.; et al. EGF receptor gene mutations are common in lung cancers from “never smokers” and are associated with sensitivity of tumors to gefitinib and erlotinib. Proc. Natl. Acad. Sci. USA 2004, 101, 13306–13311. [Google Scholar] [CrossRef] [Green Version]
- Carey, K.D.; Garton, A.J.; Romero, M.S.; Kahler, J.; Thomson, S.; Ross, S.; Park, F.; Haley, J.D.; Gibson, N.; Sliwkowski, M.X. Kinetic analysis of epidermal growth factor receptor somatic mutant proteins shows increased sensitivity to the epidermal growth factor receptor tyrosine kinase inhibitor, erlotinib. Cancer Res. 2006, 66, 8163–8171. [Google Scholar] [CrossRef] [Green Version]
- Montgomery, R.B.; Moscatello, D.K.; Wong, A.J.; Cooper, J.A.; Stahl, W.L. Differential modulation of mitogen-activated protein (MAP) kinase/extracellular signal-related kinase kinase and MAP kinase activities by a mutant epidermal growth factor receptor. J. Biol. Chem. 1995, 270, 30562–30566. [Google Scholar] [CrossRef] [Green Version]
- Bell, D.W.; Gore, I.; Okimoto, R.A.; Godin-Heymann, N.; Sordella, R.; Mulloy, R.; Sharma, S.V.; Brannigan, B.W.; Mohapatra, G.; Settleman, J.; et al. Inherited susceptibility to lung cancer may be associated with the T790M drug resistance mutation in EGFR. Nat. Genet. 2005, 37, 1315–1316. [Google Scholar] [CrossRef]
- Pao, W.; Miller, V.A.; Politi, K.A.; Riely, G.J.; Somwar, R.; Zakowski, M.F.; Kris, M.G.; Varmus, H. Acquired resistance of lung adenocarcinomas to gefitinib or erlotinib is associated with a second mutation in the EGFR kinase domain. PLoS Med. 2005, 2, e73. [Google Scholar] [CrossRef] [PubMed] [Green Version]
- Thomson, S.; Petti, F.; Sujka-Kwok, I.; Epstein, D.; Haley, J.D. Kinase switching in mesenchymal-like non-small cell lung cancer lines contributes to EGFR inhibitor resistance through pathway redundancy. Clin. Exp. Metastasis 2008, 25, 843–854. [Google Scholar] [CrossRef] [PubMed] [Green Version]
- Thomson, S.; Buck, E.; Petti, F.; Griffin, G.; Brown, E.; Ramnarine, N.; Iwata, K.K.; Gibson, N.; Haley, J.D. Epithelial to mesenchymal transition is a determinant of sensitivity of non-small-cell lung carcinoma cell lines and xenografts to epidermal growth factor receptor inhibition. Cancer Res. 2005, 65, 9455–9462. [Google Scholar] [CrossRef] [Green Version]
- Yauch, R.L.; Januario, T.; Eberhard, D.A.; Cavet, G.; Zhu, W.; Fu, L.; Pham, T.Q.; Soriano, R.; Stinson, J.; Seshagiri, S.; et al. Epithelial versus mesenchymal phenotype determines in vitro sensitivity and predicts clinical activity of erlotinib in lung cancer patients. Clin. Cancer Res. 2005, 11, 8686–8698. [Google Scholar] [CrossRef] [PubMed] [Green Version]
- Wang, S.; Rong, R.; Yang, D.M.; Fujimoto, J.; Bishop, J.A.; Yan, S.; Cai, L.; Behrens, C.; Berry, L.D.; Wilhelm, C.; et al. Features of tumor-microenvironment images predict targeted therapy survival benefit in patients with EGFR-mutant lung cancer. J. Clin. Investig. 2023, 133, e160330. [Google Scholar] [CrossRef]


| Acc | Gene | Protein | METi 2 h | p METi | EGFRi 2 h | p EGFRi |
|---|---|---|---|---|---|---|
| P08581 | MET | Hepatocyte growth factor receptor | −4.22 | 0.000 | 0.38 | 0.000 |
| Y1234,Y1235 | DMYDKEpYpYSVHNK (n = 86 spectra, 99% confidence) | −3.13 | 0.000 | 0.10 | ns | |
| P00533 | EGFR | Epidermal growth factor receptor | −3.11 | 0.000 | 0.48 | 0.000 |
| Y1197 | GSTAENAEpYLR (n = 45 spectra, 99% confidence) | −4.16 | 0.000 | 0.05 | ns | |
| P04626 | ERBB2 | Receptor tyrosine–protein kinase erbB-2 | −2.23 | 0.013 | 0.41 | 0.020 |
| Q08345 | DDR1 | Epithelial discoidin domain-containing receptor 1 | −3.55 | 0.000 | 0.49 | 0.001 |
| P29317 | EPHA2 | Ephrin type-A receptor 2 | −2.54 | 0.000 | 0.28 | 0.031 |
| P54760 | EPHB4 | Ephrin type-B receptor 4 | −1.62 | 0.048 | 0.42 | ns |
| Q96RT1 | ERBIN | Protein LAP2 | −3.27 | 0.000 | 0.16 | 0.019 |
| P62993 | GRB2 | Growth factor receptor-bound protein 2 | −2.95 | 0.000 | 0.26 | 0.004 |
| Y209 | NpYVTPVNR (n = 29 spectra, 99% confidence) | <−3.32 | 0.000 | 0.13 | ns | |
| P29353 | SHC1 | SHC-transforming protein 1 | −2.42 | 0.012 | 0.37 | 0.044 |
| Y349,Y350 | MAGFDGSAWDEEEEEPPDHQpYpYNDFPGKEPPLGGVVDMR | −3.29 | 0.010 | 0.39 | ns | |
| Q06124 | PTN11 | Tyrosine–protein phosphatase type 11 | −3.44 | 0.022 | 0.33 | ns |
| Acc | Gene | Protein | Time (h) | EGFRi | IGF1Ri/IRi | p EGFRi | p IGF1Ri/IRi |
|---|---|---|---|---|---|---|---|
| P00533 | EGFR | Epidermal growth factor receptor | 2 | −2.47 | −0.40 | 0.007 | ns |
| 48 | 1.24 | 1.41 | 0.000 | 0.000 | |||
| P29317 | EPHA2 | Ephrin type-A receptor 2 | 2 | −1.38 | −0.05 | ns | ns |
| 48 | −2.52 | −0.57 | 0.000 | 0.004 | |||
| P62993 | GRB2 | Growth factor receptor-bound protein 2 | 2 | −4.01 | −0.86 | 0.010 | ns |
| 48 | 1.08 | 1.18 | 0.002 | 0.000 | |||
| P06213 | INSR | Insulin receptor | 2 | 1.49 | −1.91 | ns | ns |
| 48 | 2.02 | −4.08 | 0.000 | 0.000 | |||
| P28482 | MAPK1 | Mitogen-activated protein kinase 1 | 2 | −1.18 | 0.21 | ns | ns |
| 48 | −2.63 | −1.51 | 0.001 | 0.006 | |||
| P08581 | MET | Hepatocyte growth factor receptor | 2 | −5.01 | −0.27 | 0.000 | 0.131 |
| 48 | 1.18 | 1.87 | 0.000 | 0.000 | |||
| P27986 | PIK3R1 | Phosphatidylinositol 3-kinase regulatory a | 2 | −1.99 | −0.85 | 0.002 | 0.038 |
| 48 | 1.63 | 0.53 | 0.000 | 0.002 |
| Acc | Gene | Protein | EGFRi 1 h | p 1 h | EGFRi 4 h | p 4 h | EGFRi 24 h | p 24 h |
|---|---|---|---|---|---|---|---|---|
| P00533 | EGFR | Epidermal growth factor receptor | −0.61 | 0.000 | −0.62 | 0.000 | −0.90 | 0.000 |
| P08581 | MET | Hepatocyte growth factor receptor | −0.96 | 0.001 | −0.63 | 0.126 | −0.89 | 0.000 |
| Q04912 | MST1R | Macrophage-stimulating protein receptor | −1.28 | 0.000 | −1.51 | 0.001 | −1.24 | 0.000 |
| Q06124 | PTN11 | Tyrosine–protein phosphatase 11 | −1.77 | 0.025 | −2.34 | 0.057 | −1.57 | 0.009 |
| P62993 | GRB2 | Growth factor receptor-bound protein 2 | −1.29 | 0.000 | −2.66 | 0.002 | −1.77 | 0.000 |
| P22681 | CBL | E3 ubiquitin–protein ligase CBL | −2.17 | 0.000 | −3.38 | 0.000 | −2.84 | 0.000 |
| P29353 | SHC1 | SHC-transforming protein 1 | −1.99 | 0.000 | −2.22 | 0.000 | −1.69 | 0.000 |
| O75886 | STAM2 | Signal-transducing adapter molecule 2 | −1.49 | 0.038 | −5.83 | 0.032 | −2.83 | 0.021 |
| O14964 | HGS | HGF-regulated substrate | −1.42 | 0.000 | −4.46 | 0.000 | −1.55 | 0.000 |
| P28482 | MAPK1 | Mitogen-activated protein kinase 1 | −1.70 | 0.000 | −2.42 | 0.000 | −1.41 | 0.000 |
| Q16539 | MAPK14 | Mitogen-activated protein kinase 14 | −0.82 | 0.001 | −0.79 | 0.013 | −0.73 | 0.000 |
| Acc | Gene | Protein | EGF + EGFRi 1 h | p 1 h | EGF + EGFRi 4 h | p 4 h |
|---|---|---|---|---|---|---|
| P16234 | PDGFRA | Platelet-derived growth factor receptor a | 0.27 | 0.000 | 0.08 | 0.016 |
| P27986 | PIK3R2 | PI3-kinase p85-subunit a | 0.25 | 0.007 | 0.32 | 0.001 |
| O00459 | PIK3R1 | PI3-kinase p85-subunit b | 0.49 | 0.036 | 0.24 | 0.189 |
| P42336 | PIK3CA | PI3-kinase p110 subunit a | 0.65 | 0.003 | 0.53 | 0.008 |
| P42338 | PIK3CB | PI3-kinase p110 subunit b | 0.41 | 0.139 | 0.44 | 0.108 |
| P19174 | PLCG1 | Phospholipase C-g | 0.34 | 0.000 | 0.26 | 0.000 |
| Q06124 | PTPN11 | Tyrosine–protein phosphatase 11 | 0.38 | 0.000 | 0.22 | 0.000 |
| Q07889 | SOS1 | Son of sevenless homolog 1 | 0.34 | 0.102 | 0.60 | 0.037 |
| O43639 | NCK2 | Cytoplasmic protein NCK2 | 0.55 | 0.013 | 0.61 | 0.002 |
| Q13153 | PAK1 | Serine/threonine–protein kinase PAK 1 | 0.64 | 0.69 | ||
| Q15052 | ARHGEF6 | Rho guanine nucleotide exchange factor 6 | 0.74 | 0.000 | 1.05 | 0.000 |
| P22681 | CBL | E3 ubiquitin–protein ligase CBL | −1.34 | 0.000 | −1.23 | 0.000 |
| P29353 | SHC1 | SHC-transforming protein 1 | −1.26 | 0.000 | −1.38 | 0.000 |
Disclaimer/Publisher’s Note: The statements, opinions and data contained in all publications are solely those of the individual author(s) and contributor(s) and not of MDPI and/or the editor(s). MDPI and/or the editor(s) disclaim responsibility for any injury to people or property resulting from any ideas, methods, instructions or products referred to in the content. |
© 2023 by the authors. Licensee MDPI, Basel, Switzerland. This article is an open access article distributed under the terms and conditions of the Creative Commons Attribution (CC BY) license (https://creativecommons.org/licenses/by/4.0/).
Share and Cite
Linzer, J.; Phelps, Z.; Vummidi, S.; Lee, B.Y.E.; Coant, N.; Haley, J.D. Mass Spectrometry and Pharmacological Approaches to Measuring Cooption and Reciprocal Activation of Receptor Tyrosine Kinases. Proteomes 2023, 11, 20. https://doi.org/10.3390/proteomes11020020
Linzer J, Phelps Z, Vummidi S, Lee BYE, Coant N, Haley JD. Mass Spectrometry and Pharmacological Approaches to Measuring Cooption and Reciprocal Activation of Receptor Tyrosine Kinases. Proteomes. 2023; 11(2):20. https://doi.org/10.3390/proteomes11020020
Chicago/Turabian StyleLinzer, Jason, Zachary Phelps, Shivasuryan Vummidi, Bo Young Elizabeth Lee, Nicolas Coant, and John D. Haley. 2023. "Mass Spectrometry and Pharmacological Approaches to Measuring Cooption and Reciprocal Activation of Receptor Tyrosine Kinases" Proteomes 11, no. 2: 20. https://doi.org/10.3390/proteomes11020020