Article

Public Investment in Short-Cycle Tertiary Vocational Education: Historical, Longitudinal, and Fixed-Effects Analyses of Developed and Less-Developed Countries

by
Lijing Yang
1,* and
Edward Patrick St. John
2
1
Department of Counseling and Higher Education, The Patton College of Education, Ohio University, Athens, OH 45701, USA
2
Center for the Study of Higher and Postsecondary Education, School of Education, University of Michigan, Ann Arbor, MI 48109, USA
*
Author to whom correspondence should be addressed.
Educ. Sci. 2023, 13(6), 573; https://doi.org/10.3390/educsci13060573
Submission received: 11 March 2023 / Revised: 22 May 2023 / Accepted: 25 May 2023 / Published: 1 June 2023

Abstract

:
We use three analytic steps to examine public investment in short-cycle tertiary education. First, reviewing the historical development, the literature reveals that national and regional policies on educational development emphasized bachelor’s programs in vocational education in the early twenty-first century, especially in the EU. This historical background informs the longitudinal trend analysis in the second step of the educational and public investment variables (2000–2018) in our econometric analysis. The combined descriptive studies illuminate competitive advantages for EU and ASEAN nations in networks emphasizing open economic and academic exchange. Third, the fixed-effects analysis indicates a higher level of investment in general tertiary education per student, associated with a lower enrollment level in short-cycle vocational and technical tertiary programs. Using insights from this three-step process, we explore the implications of a nation’s capacity to invest in short-cycle tertiary programs as part of economic development and the pursuit of social equity within and across countries. Specifically, we conclude that short-cycle programs are a step toward integrating vocational education into programs in polytechnics and other higher education institutions.

1. Introduction

Patterns of public investment in higher education differ between and within countries. Many countries have prioritized vocational training in their national policies [1]. Many European Union (EU) countries have focused on STEM preparation in secondary schools and STEM fields in universities [2]. Enrollment in short-cycle tertiary education programs has decreased or fluctuated in the past two decades [3]. According to the International Standard Classification of Education (ISCED) developed by the United Nations Educational, Scientific and Cultural Organization (UNESCO), short-cycle tertiary education, or ISCED Level 5, refers to those programs below bachelor’s or equivalent level that are practically based, occupationally-specific, at least two years long, and prepare students to enter the labor market (please refer to Appendix A for a detailed definition) [4]. For example, short-cycle tertiary education in the United States is mainly offered through two-year community and technical colleges as associate bachelor’s degree programs [4]. For analytical purposes, this paper adopts the classification developed by the United Nations [5] and groups the countries of the world into two broad categories: developed countries (or economies) and less-developed countries (those not listed as developed countries, including economies in transition, developing economies, and the least developed economies).
In developed and less-developed countries, short-cycle tertiary vocational education shares multiple important aims related to social and economic growth: a pathway to a bachelor’s degree or equivalent, vocational and technical education, workforce training, and continuing or lifelong learning [6,7]. As the global production of parts—the supply chain—developed in the early twenty-first century, many manufacturing functions moved from developed nations to less-developed countries, incentivizing vocational and higher education expansion in some of these [8]. For example, in Malaysia, the public polytechnics offering two-year certificate and three-year diploma programs in areas of industry and commerce expanded their enrollment by 1.5 times from 2009 to 2012 and become the most extensive public tertiary vocational education providers [9]. In China, to promote economic development and address the shortage of skilled technicians in trades and industries, the number of tertiary vocational colleges offering two- or three-year vocational programs has grown substantially since the late 1990s [10]. Investment in short-cycle technical training enables workers to develop skills needed for employment in newly industrializing economies. In theory, it allows them to achieve economic wellbeing (i.e., the ability to support their families), an essential human capability [11].
This study addresses two research questions: (1) How have education finance, economic development, and educational systems influenced tertiary short-cycle vocational education, after controlling for population characteristics? (2) Do the influences of education finance, economic development, and educational systems on short-cycle tertiary education (primarily vocational and technical programs) differ between developed and less-developed countries?
We use three steps: a review of historical education development, a trend analysis of educational and public investment variables, and an econometric model analyzing factors related to public investment. The first step of this triangulation method is to present a policy review for the countries studied. Next, the longitudinal trend analysis explores differences in short-cycle programs, focusing on the shift toward bachelor’s programs and the economic and educational developments within evolving trade alliances and supply chains [12]. Third, the econometric analysis adapts the fixed-effects model developed by Yang and McCall [13] to explore whether the strategies of education finance and the structure of educational systems help interpret recent changes in tertiary vocational education.

2. Public Policy on Postsecondary Vocational/Technical Education

European higher education systems and policies evolved different on a different trajectory to the USA in the early twenty-first century. The USA had adopted a British model during the colonial period but later pioneered an independent path [14]. European models for organizing education followed colonialism through the empire period before WWII. Educational planning in former colonizing nations continued to influence the Cold War, before economic globalization began influencing nations’ strategies in higher education planning, especially in ASEAN and EU nations. In contrast, the British model substantially influenced the evolution of the educational system in Australia and other Commonwealth countries into the early 1980s [15,16]. Thus, European institutional forms and languages became the basis for educational developments in many colonizing nations [17]. Economic globalization continues to influence changes in educational planning in former colonial countries.
Initially, the “Washington Consensus” [18] argued that privatization through high tuition fees and student loans would expand college access in less-developed countries more rapidly than public spending. Using this logic, the World Bank argued that students should pay for their vocational education and training in less-developed countries, replacing tax subsidies to institutions and students with future debt for graduates (and dropouts). This policy shift recommended that private enterprises provide training with government interventions kept to a minimum. This policy prescription was seriously flawed. Newly industrializing nations sought ways to engage more fully in international production, especially the rapidly advancing and high-performing Asian economies [19]. During the same period, European countries elevated technical programs to bachelor’s status. The US embarked on collegiate prep requirements for most secondary students, emphasizing advanced science and math courses based on comparisons of Catholic and public secondary schools [20]. Some states failed to make exceptions before many students dropped out of K-12 [21,22]. Most community colleges focused on transfer to four-year colleges [23]. Patterns of investment in short-cycle training rapidly changed as nations and regions developed niches in the evolving global economy.
Furthermore, during neoliberal economic globalization after 1980, the adoption of American-style metrics for global rankings and the elite American university model was emulated in many nations [24]. However, the US model of STEM education did not become the basis for reorganizing vocational and technical education. Rather than integrating vocational education into high school programs, the first step in the USA was to replace more expensive vocational courses with advanced science and math courses. Europe followed the reverse path by integrating vocational courses into options for students in both secondary and higher education. Short-cycle training was a transitional step.
Historically, short-cycle postsecondary education (less than bachelor’s) in technical and community colleges was central to economic development in states across the USA, achieving alignment of working-class educational and work opportunities. After WWII, the USA produced and supplied goods for a world recovering from the ravages of war. However, this pattern changed radically: most states raised high graduate standards to the level expected in collegiate programs in engineering and science [23]. As STEM reforms progressed, most US community colleges shifted away from certificates in auto repair, plumbing, and other technical fields to enable students to transfer to four-year programs. For example, Indiana turned its technical college system into the state community college system [25]. There is still strong demand for short-term courses in the USA, but in many states, preparation for transfer has become the priority for many community colleges.
In contrast, as noted above, many EU nations upgraded technical education in their technological institutes and universities. In addition, EU trade agreements purposefully protected manufacturing and working-class jobs [26]. These policies accelerated the decline of the working middle class in the USA compared with Western Europe [2,27]. Since the USA and other North American nations did not provide sufficient data for the empirical analyses in this research, we do not continue this comparison.
Below, we examine recent policy literature that covers trends and practices of tertiary vocational education and education finance policies in developed and less-developed counties. We consider technical and vocational education policy in the context of national and regional postsecondary education systems. We focus on nations within alliances as an additional force influencing developments in education.

2.1. Technical, Vocational and Higher Education Policy in European Countries

We focus on European nations because they provide sufficient data on education and economic developments for inclusion in the statistical analyses. We consider the EU, the UK, and post-Soviet nations separately because they followed different pathways when developing vocational and technical education policies. Our focus on the EU countries results from their high World Bank data reporting rate. We caution in generalizing beyond the EU because few non-EU developed countries provided sufficient data. We aim to build a comparative understanding and, thus, reference the US case when it helps clarify points arising in the review and analysis.

2.1.1. The UK, Brexit, and the Commonwealth

As England was engaging in the first industrialized age, Adam Smith [28] criticized the religion-centric European universities of the period for not developing sciences and subjects that could inform the economic development of nations in the emerging period. During the empire period, lasting until World War II (WWII), changes in education and industrial development were closely linked in nations within empires. The UK’s break from the European Union (EU) in 2015 and the continuing legacy of the British Empire illustrate the UK’s distinctive role in education and the global economy.
The UK began changing international higher education access before the EU emerged. Although it has left the EU, the UK remains part of the European Higher Education Area (EHEA). Its national approach to developing and transforming vocational education remains distinctive. In 1856 the University of London originated distance education to educate children of government officials across the empire [28]. This history led to the British Open University further transforming access to higher education globally [29] in the EU and most developed nations. The UK’s Oxford and Cambridge are now among the world’s top five universities, having thrived during economic globalization since the end of the Cold War [30].
After 1980, British higher education came under attack by Margaret Thatcher [31]. While British higher education followed a new path thereafter [32], much of the course of US K-12 and higher education changed after Ronald Reagan’s attacks on public education and college pricing refaced policy on markets and national standards. Britain shifted away from technical, short-cycle education after 1980. The British government emphasized economic globalization within and beyond the Commonwealth as Ronald Reagan withdrew support for international organizations and focused on tearing down the Berlin Wall. Of course, the adoption and troubled development of democratic institutions were part of the first stage of globalization. Still, the influence of Thatcher’s free market ideology was globally transformative at the time, especially in South Asia.
The UK started to transform its technical education system before it joined the EU. Under UK leadership before WWII, the British Commonwealth had a lengthy history of technical and further education. It began to change its technical and further education system in the 1980s, well before the emergence of the EU. The British Commonwealth provides unique examples of the spread of a nation’s model through diaspora networks before 1980, followed by the nation’s neoliberal ideology influencing economic globalization [15]. Further education is no longer part of higher education in the UK and does not enjoy the same status. In contrast, starting in the late 1970s, the UK upgraded technical education into the tertiary system. The UK privatization of higher and technical education started by raising tuition and expanding loans in the late 20th century.
Thus, tertiary education was more privatized than in other EU nations in the early twenty-first century [18]. Marginson [33] argues that demand for higher education is inelastic and does not create an access barrier to education, because of income-contingent loans over the past decade. Continuing education of non-traditional part-time students also departs from the EU open-access approach, because part-time and mature students have access to loans but must repay the borrowed amount. Only about 11 percent of students enroll in further education colleges to pursue this pathway, where students are primarily at sub-degree certificate and diploma levels [33].
Comparing national histories within the Commonwealth presents a challenge. Ireland, for example, is in the EU, but its higher and vocational systems still have strong similarities to the UK. New Zealand and Ireland also have a long history of British influence. Further, the Commonwealth linkages and British investment in education training in Southeast Asia influenced collaborative engagement in education for economic development. Yet, these nations’ educational systems had uncommon origins. The British and Australians supported indigenous development education for national industries in the 1980s, through the Colombo Plan (an alliance to rebuild Asia after WWII). For example, in 1988, the Colombo Plan Staff College organized an international “Planning Strategically” conference for senior officials from 15 Asian nations, in Manila, Philippines. In contrast, the Marshall Plan to rebuild Europe was strongly influenced by US democratic institutionalized values [34,35]. The aims were to cast off post-colonial status and focus on indigenous education for economic development.
We consider the British Commonwealth’s legacy in technical education when comparing the UK nations to the EU or less-developed Commonwealth nations or groups of developing countries around the globe. The UK and many Commonwealth nations upgraded technical education in the late twentieth century. England and other Commonwealth nations transformed technical education institutions into higher education institutions, a transitional process that started in the 1980s [15,16].

2.1.2. EU Countries

Created by the Maastricht Treaty and ratified by all members of the European Community, the EU was formed in 1993 to oversee economic and political integration. Most of the developed countries in our study are in the EU, an international organization that facilitates political integration, collaborates on education development, and fosters economic development through trade among nations within the EU and with other major trading partners. The Bologna Process is a unique internal collaboration coordinated within the European Higher Education Area (EHEA). The organization facilitates student mobility and employability and aligns educational development in the EU. This binding form of regional cooperation establishes a common context for vocational education and training (VET).
In 2010, the European Commission [36] developed plans to expand VET to meet the demand for higher-skilled workers and the need for medium- and high-level qualifications for the economy of 2020, an emphasis that eventually upgraded short-cycle programs into bachelor’s degrees. The Commission’s plans were consistent with the World Bank’s [37] view: to upgrade technical and vocational education and training so students could gain skills and knowledge relevant to labor markets. This new stance departed from the Washington Consensus, which emphasized the privatization of postsecondary education that had dominated a decade earlier [19]. Increasing VET became a public policy priority in the EU, where most nations developed trade agreements protecting the working class, a step the US did not take [12]. EU nations used student grants, loans, or other financial aid to invest in VET and higher education [38], a path not chosen in the US, Latin America, or South Asia. The US also provided grants, loans, and other financial aid to many VET students in community colleges, but the unmet financial needs for attending four-year colleges widened [39]. In contrast to the US, states increased high math and science requirements for graduation in public and private high schools, and the proprietary sector in the US expanded to meet the demand for technical tertiary courses by using loans to aid students [23].
In contrast, European countries prioritized VET and higher education, aiming to increase the percentage of 30–34-year-olds holding degrees [38]. Within the EU, Ireland is small but unique [23,40]. Even after independence, it maintained the academic norm evolving from British rule, especially at the university level. However, unlike England, Ireland maintained technical programs of less than four years in tertiary institutions. Their programs helped build a new technical workforce for the booming high-tech economy. In addition, with support from Google Foundation and later from the national government, universities developed partnerships to support access and community development in schools serving low-income neighborhoods, resulting in a rise to the top of the EU college enrollment rates [40]. Cambridge and Oxford have developed their version of the access model that was started at Trinity College Dublin, an approach that influenced recent gains in national college access in Ireland.
In contrast, Germany is a leading nation in the EU, and the German university system, widely adapted in other countries, continues to influence models of academic organization [41]. Germany led the world in sciences and social sciences before WWII, but many leading scholars left before the war, and Germany’s universities have not regained their status. Technische Universität München, the most highly ranked German University, is placed 50 in the global rankings [42]. The USA and Britain now dominate the top spots in international university rankings. The narrow approach to ranking does not value the legacy of connectivity between science, technology, and education. As WWII approached, the US, Britain, and Russia competed for German scientists. This history influenced Germany’s trade protectionism after WWII [26]. The global university ranking schemes overlook these and other societal aspects of university development [43]. The German K-20 model deserves greater attention in the US and other nations outside the EU.
VET is integral to secondary and higher education in Germany, which embrace apprenticeship-based vocational education, meaning that education happens in both the classroom and on-the-job training settings. In 2012, about 60 percent of most age cohorts pursued VET within the upper secondary system, but only 13 percent of that 60 percent completed a postsecondary vocational degree [44]. Germany had no unified system of institutions or agencies that regulated tertiary vocational education, creating a complicated regulatory environment. Land governments (e.g., the state/province) regulate VET. Federal and land governments share responsibility for higher education funding, with the former constituting about 18 percent of the total funding [45]. Chambers (i.e., labor market associations) of commerce and craft can also regulate specific areas of vocational programs connecting education with the labor market. Although training in vocational skills takes place at the learning sites, the chamber of commerce or crafts administers a centralized examination to assess trainees’ skills, adhering to the principle that the teacher and the examiner should not be one and the same [46].
There is a history of postsecondary technical on-the-job training in Germany. “Berufsakademien (professional academies) form part of the tertiary sector and combine academic training at a Studienakademie (study institution) with practical professional training in a training establishment, thus constituting a duales System (dual system)” [47]. Companies that hire students subsidize education by paying wages and bearing partial costs for degrees [47]. Thus, Germany has a comprehensive open-access vocational education system with multiple pathways and relatively low barriers within pre- and postsecondary systems. After completing either of the education tracks, students may complete a bachelor’s degree or a “Diplom”.
While Italy was a leader in math and sciences during the Age of Enlightenment, the University of Bologna, ranked 161, is the most highly rated Italian university [48]. The legacies of the Catholic tradition and fascism have hampered the development of Italian universities [49,50]. Even though Italy did not sustain its role in global leadership, its postsecondary education adapted to support the working middle class. In Italy, vocational and technical training are part of upper-secondary education. Parallel to the vocational track in public schools, students can complete two to four years of vocational training programs organized regionally and closely aligned with local job markets [51]. Italian students with a five-year upper-secondary education diploma have open access to higher education. Academic performance does not restrict students’ educational choices.
Most students in Italy (56 percent) choose VET, while a relatively low number of students enroll in academic programs in tertiary education (30 percent of native-born students) [36]. Interestingly, Contini and Triventi [51] regard open access to education and low cost as reasons for downward mobility (i.e., students first enter the academic track and then move to the vocational/technical track during upper-secondary education). The vocational sector provides options that prepare students for tertiary advancement and opportunities in the labor market.
Italy’s integration of VET within the secondary and higher education systems is a typical pattern in many EU countries, as is the emphasis on this form of education. Across the diverse educational systems, integration of VET is a priority, consistent with the European Commission’s stated aims.

2.1.3. Post-Soviet Nations

Technical and professional education has a long history in Russia and other post-Soviet nations. The Russian model includes vocational lyceums or secondary vocational education available at technical institutions [52]. No barriers exist for students who wish to complete undergraduate education after VET. However, the majority (62 percent) of students choose to pursue general secondary education (10th and 11th grades); about 20 percent of students pursue vocational training as part of secondary education [52]. In 2011, 53 percent of students in Russia completed tertiary education compared with 32 percent on average among OECD countries and 26 percent among G20 countries [53]. Such high achievement is primarily due to the country’s historically substantial educational investment [53]. Additionally, Russia’s entry rate into tertiary vocational education programs was 31 percent, remarkably higher than the average (19 percent) of OECD countries [53]. Russia had a history of factory-like higher education that has a substantial legacy in former Soviet, less-developed nations [54], including a few of the countries that provided sufficient data for this study.
The contrast between the EU and post-Soviet nations in education and economic development is stark. The end of the Cold War and the rise of fragile democracies in post-Soviet countries did not substantially alter the legacy of centralized planning and control in education. With the lingering Ukraine–Russia war, post-Soviet nations face severe challenges that could distract policymakers from engaging in cooperative educational and economic exchange to support the development of high-quality postsecondary programs aligned with economic growth.

2.2. Postsecondary Education and VET Education in Less-Developed Countries

Nations not classified as developed and not included in World Bank data are making efforts to develop economically. There are significant variations in their economies and histories. Africa has a long history of European colonization and has been slow to emerge from poverty. Latin American nations are also in varying stages of development. Many South Asian countries are still not highly developed but are well integrated into the global high-tech supply chain.
In the 2000s, most developing nations viewed investment in vocational and technical education as integral to the pathway toward economic development. Pavlova and Mclean [55] argued that there are increasing trends in the vocationalization of tertiary education in less-developed countries, since vocational training remains a pathway to national economic uplift. Developing a skilled workforce increases a country’s competitiveness, expanding opportunities to engage in producing goods and parts in an increasingly complex and fluid global economy. By the turn of the century, nations’ decisions about whether to engage in the global economy would have a long-term impact on their economies, educational systems, and prospects of civil society, including the moral consequences of economic growth within supply chains. Most developing countries offer vocational education through secondary education, and further training through vocational colleges and institutes or private contractors. Pavlova and Mclean [55] advocated for providing technical and vocational education and training (TVET) in secondary education with a curriculum tailored towards specific jobs, or narrowing the breadth of tertiary education and focusing on employability.
Each nation’s pathway to economic development is distinct and involves aligning learning and work opportunities, but there are regional patterns. We compare a few cases within Africa, Latin America, and Southeast Asia to illustrate some regional educational and economic barriers and challenges.

2.2.1. African Nations

Vocational education and training vary substantially across African countries. The K-12 and university systems are also less developed than in other regions. The indigenous capacity for building VET programs is limited. Climate change, wars, and disease challenge many countries. In Africa, a country’s colonial past usually determines the present structure of VET [56]. We provide one example to illustrate the challenges of aligning education with national economic development, before examining the recent critical literature.
Before the 2010s, VET education had been a low priority in Africa for a quarter century [57]. For example, a former British colony, Ghana, underwent rapid economic uplift during the early 20th century: the average annual GDP increased by 8.1 percentage points in 2017 compared to 9.1 percentage points in 2008 and 14 percent in 2011 [58]. Fast economic growth, mainly driven by oil and gas production output expansion, creates favorable labor market conditions for highly skilled populations. However, as in other emerging economies, vocational education and training in Ghana face challenges including rural–urban migration and demand for skilled human capital from more developed countries [59,60,61,62]. However, despite the endorsement of TVET at the national level, enrollment and completion rates remained lower than planned. Analysts point to the lack of prestige associated with TVET, lack of resources, and poor alignment of TVET with the market [59]. Gender parity is also weak for TVET, with the female student population comprising only 37.1 percent of enrollment [63].
Africa as a region continues to face severe challenges in delivering short-cycle VET programs. UNESCO now argues that developing a clear account of how to improve VET must be part of a transformative approach to development [64]. There is a growing understanding that conventional theories of development do not fit the challenges faced by African nations [64]. Sustainability is also emerging as a core issue; the African Union recently identified agriculture and rural development as priorities for technical and vocational training and skills development in Nigeria [65] and possibly in other African nations.

2.2.2. Southeast Asia

In contrast to Africa, several Southeast Asian countries are engaged in the global supply chain, especially in high-tech industries. In 1959, Japan, England, Australia, and other nations supported the founding of the Asian Institute of Technology (AIT), an international university north of Bangkok, Thailand [66]. AIT ranks highly in sustainability and technology management [66].
The Association of Southeast Asian Nations (ASEAN) was formed in 1967 to promote technical education and economic development in Indonesia, Malaysia, the Philippines, Singapore, and Thailand; it now includes ten member states. The Southeast Asian nations were engaged in global industrialization in the 1980s, creating alliances with international corporations to manufacture products for export. The ASEAN nations are involved in rethinking technical education through a series of strategic planning workshops offered by the Colombo Plan Staff College (CPSC) [34]. The CPSC supports national and regional meetings on economic and educational planning using an indigenous concept of development, a perspective advanced by the Australian leadership of the organization. They began rethinking technical education in relation to trends in technology and the high-tech supply chain and followed Western models of institutional development [35]. The Reagan administration had stopped funding the Colombo Plan, leaving room for a new Australian theory of change, with additional financial support from British and Japanese aid agencies [34,35].
By 2015, the ASEAN economic community had become a single market with a competitive superior production base. Many ASEAN countries’ student loan programs are consonant with the World Bank advocacy guided by the Washington Consensus. Some are now adapting the Australian repayment model to deal with the stress created by student debt in less-developed nations [12]. The curriculum used in vocational schools was a priority for the ASEAN Economic Community or AEC [67]. Regional planning also informed research directions, including the alignment of programs with students’ interests and their prior program content and teacher preparation [68].

2.2.3. Latin America

Thirteen universities were founded in Latin America before Harvard was in the USA (1636) [69]. Yet other than the USA and Canada, the nations in that hemisphere are still not economically developed. Latin American countries significantly expanded their vocational educational training before 2010. For instance, enrollment in technological tertiary education in Brazil, a rapidly growing economy, increased by 140 percent between 2007 and 2013 [70]. Chile has also expanded access to higher education, including tertiary vocational training, by improving secondary education outcomes and creating a bigger pool of students [71]. Despite the progress in secondary and higher education, transitions between the educational system and labor market are still problematic in most nations.
Colombia, Mexico, and some other Central and South American countries have seen increased investment in tertiary vocational training to provide broader access to higher education, in order to further workers’ social and technical development [72]. However, some common problems are impeding the progress and expansion of vocational education, such as misalignment between the market skill requirements and curriculum, lack of proper quality assurance of training and evaluation processes, and lack of a monitoring system to evaluate the educational outcomes of graduates [72,73].

2.3. Investment in Short-Cycle VET for Economic Development and Sustainability

Tertiary vocational education programs, designed as pathways for educational equity across developed and less-developed countries, are challenged to address and fulfill different missions created by rapidly changing global circumstances. From the African and Latin American VET literature, it also appears that these less-developed nations are questioning the notion that the best path forward involves adopting models foisted on them by more developed countries. Developing education for the sustainability of populations in a world with rapidly changing climates is emerging as a priority.
This paper takes a step toward developing a broader comparative perspective on international higher education development than has traditionally been used. Developments in international trade, especially involving regional associations of nations in Europe and South Asia, alter vocational training and provide a way of viewing the movement of reform from short-cycle programs into baccalaureate programs at senior universities, if not the transformation of technical tertiary schools into polytechnics and technical institutes.

2.4. Comparative Frameworks for Educational Globalization

Heinz Deiter Meyer [41] has provided a compelling analysis of the global influence of the German, British, and American university models. Globalization of elite higher education provides an organizational structure within the less-developed nations that borrowed these organizational forms. Our analysis extends this comparative approach by considering short-cycle VET programs as a step in developing educational systems in industrializing, less-developed countries.
Since most of the developed nations reporting data were in the EU, we have some empirical evidence about the role of this network. However, it was not possible to distinguish South Asia nations from other less developed countries. Therefore, we could not confirm propositions about this region. Our interpretive stance is mainly based on the historical review (above) instead of discerning trends for this group of nations.
The discussion of policies above is exploratory rather than confirmatory, except for the EU. The empirical analyses in Section 3 and Section 4 make comparisons of developed and less-developed nations. Since most developed countries with adequate WB data were in the EU, we can generalize about this regional network but cannot draw implications for most other developed nations.
Section 3 compares trends in key indicators in both types of countries. Section 4 uses fixed-effects analysis to discern national variables associated with investment in technical education and also explores whether the differences in development status explain differences in public investment in short-cycle VET.
Burton Clark [17,74,75] pioneered comparison of higher education systems, using history and organizational theory. Clark [76] originally studied records of US liberal arts colleges before evolving his method to compare national systems. We use Clark’s ideas about the international migration of systems in the review above. The first step in this study revealed that histories and regional trade alliances had influenced strategies for vocational education. We also found a two-step process in the development of VET, from short-cycle courses to integration into tertiary systems.
Then, we consider trends in factors that influence planning for and developing short-cycle programs, along with the statistical association between these variables and national public spending. We examine trends in these variables to inform our interpretations of the econometric analysis in Section 5 (the conclusion).
The fixed-effects approach considers the influences of public spending and other factors on short-cycle tertiary education at the national level. By considering interaction terms between developed and less-developed statuses, we gain insights into the influence on nations’ economic development. Since European countries comprise the majority of developed nations providing adequate data to the World Bank, we can speculate about this association. However, we do not control for regional associations in Europe or Asia per se in the analysis.
This historical analysis of higher and vocational education provides the basis for an additional proposition: the history of alliances during the empire, Cold War, and global periods also influenced public spending. This proposition remains speculative, as we do not include data on regional associations in the regressions. However, we use this two-step proposition as an alternative frame within the study, a topic we reconsider in Section 5.

2.5. Adding Regional Alliances to Comparative Frameworks

The associations of EU and ASEAN nations illustrate the benefits of regional cooperation in educational development. The social aspects of uplift are critical but realized differently across contexts. With the guiding hand of the Marshall Plan, Western Europe rebuilt after WWII, emphasizing socially progressive democratic institutions. The plan guided the redevelopment of institutions with a democratic vision. The former Soviet Union had no guidance promoting the democratization of institutions. Instead, they suffered difficult transitions from totalitarian governments to quasi-democratic ones. Much less visible in the educational and economic development literature, the Colombo Plan Staff College focused on moving nations from post-colonial status in the shadow of colonizing countries to indigenous planning for economic, educational, and social development among ASEAN partners. Democratic institutions are developing, possibly faster than in the post-Soviet Eastern European nations. Education for all, including vocational education for the working class, is part of the new stability realized in both regions.

3. Trends in Economic and Educational Development Affecting Short-Cycle VET Courses

This section draws panel (cross-country time-series) data from the World Development Indicators (WDI) published by the World Bank. Our dataset is composed of 67 countries with sufficient data over 19 years from 2000 to 2018 for selected variables. The country cases include 25 developed and 42 less-developed (including developing and least developed countries) countries in Africa, the Americas, Asia, and Europe (see country list in Table 1).
Most of the developed countries that consistently reported were in the EU. The US and Canada did not provide sufficient data, eliminating the North American Trade Alliance from this analysis. Only one administrative area in China, Hong Kong, was included, limiting our ability to draw implications for the Asian high-tech supply chain. We limit generalization in recognition of these critical data gaps.
The less-developed nations from all regions across the world provided information. Several Eastern European countries formerly in the Soviet sphere of influence joined the EU in the early 2000s, including East Germany, which merged with West Germany, Poland, the Czech Republic, and the Slovak Republic. Engagement in the EU uplifted these economies as these nations met the economic standards of development by 2018. Former Eastern European nations, including Albania, Hungary, the Republic of Moldova, and Ukraine, once part of the Soviet sphere in Europe, did not develop rapidly. Per capita GDP is the primary indicator of development, and this indicator has a substantial differential (Figure 1). China and Russia did not supply sufficient data, so their influence is also beyond the scope of this study.
Developed nations have more than three times the economic production per capita of less-developed countries. However, it would be a mistake to assume that the average citizen benefited from the economic growth of Western European nations [27]. Indeed, Western Europeans born after 1950 have experienced downward economic mobility on average compared to their parents [77].
Using World Bank data, we analyze the longitudinal trends in economic development in developed and less-developed nations, followed by enrollment in short-cycle programs. The trends analyzed below examine the variables included in the fixed-effects regression analysis in Section 4.

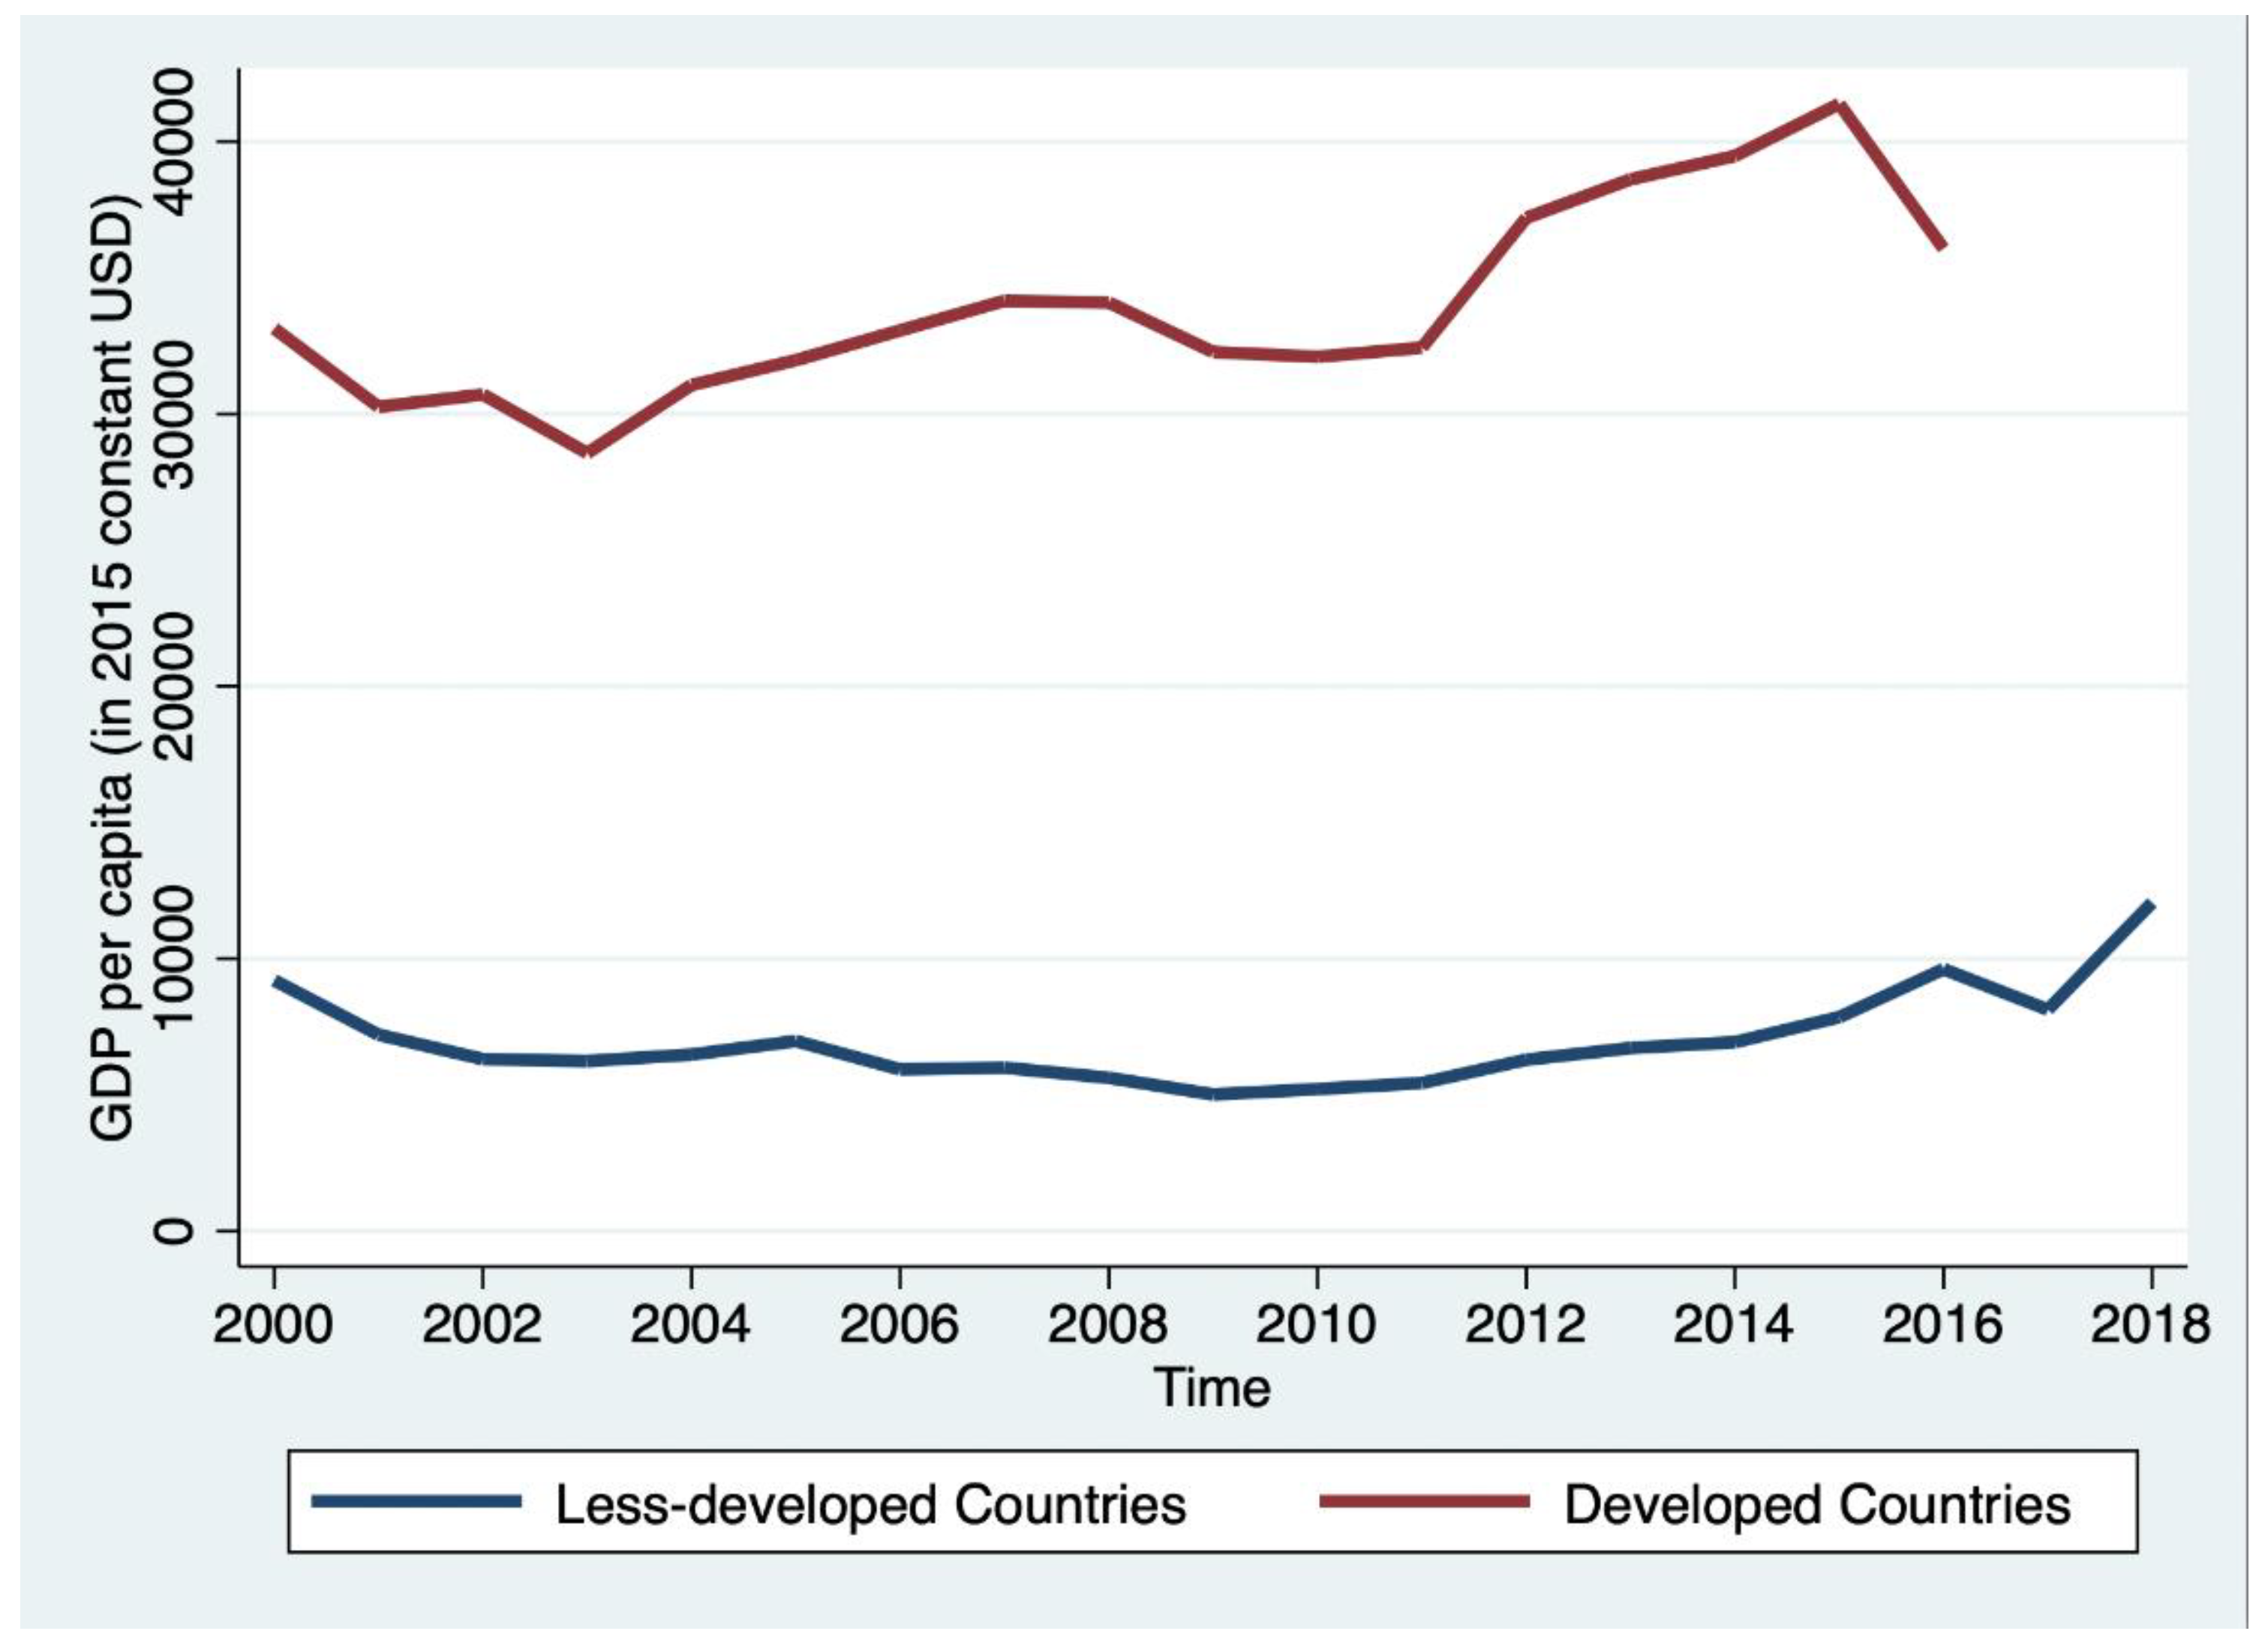
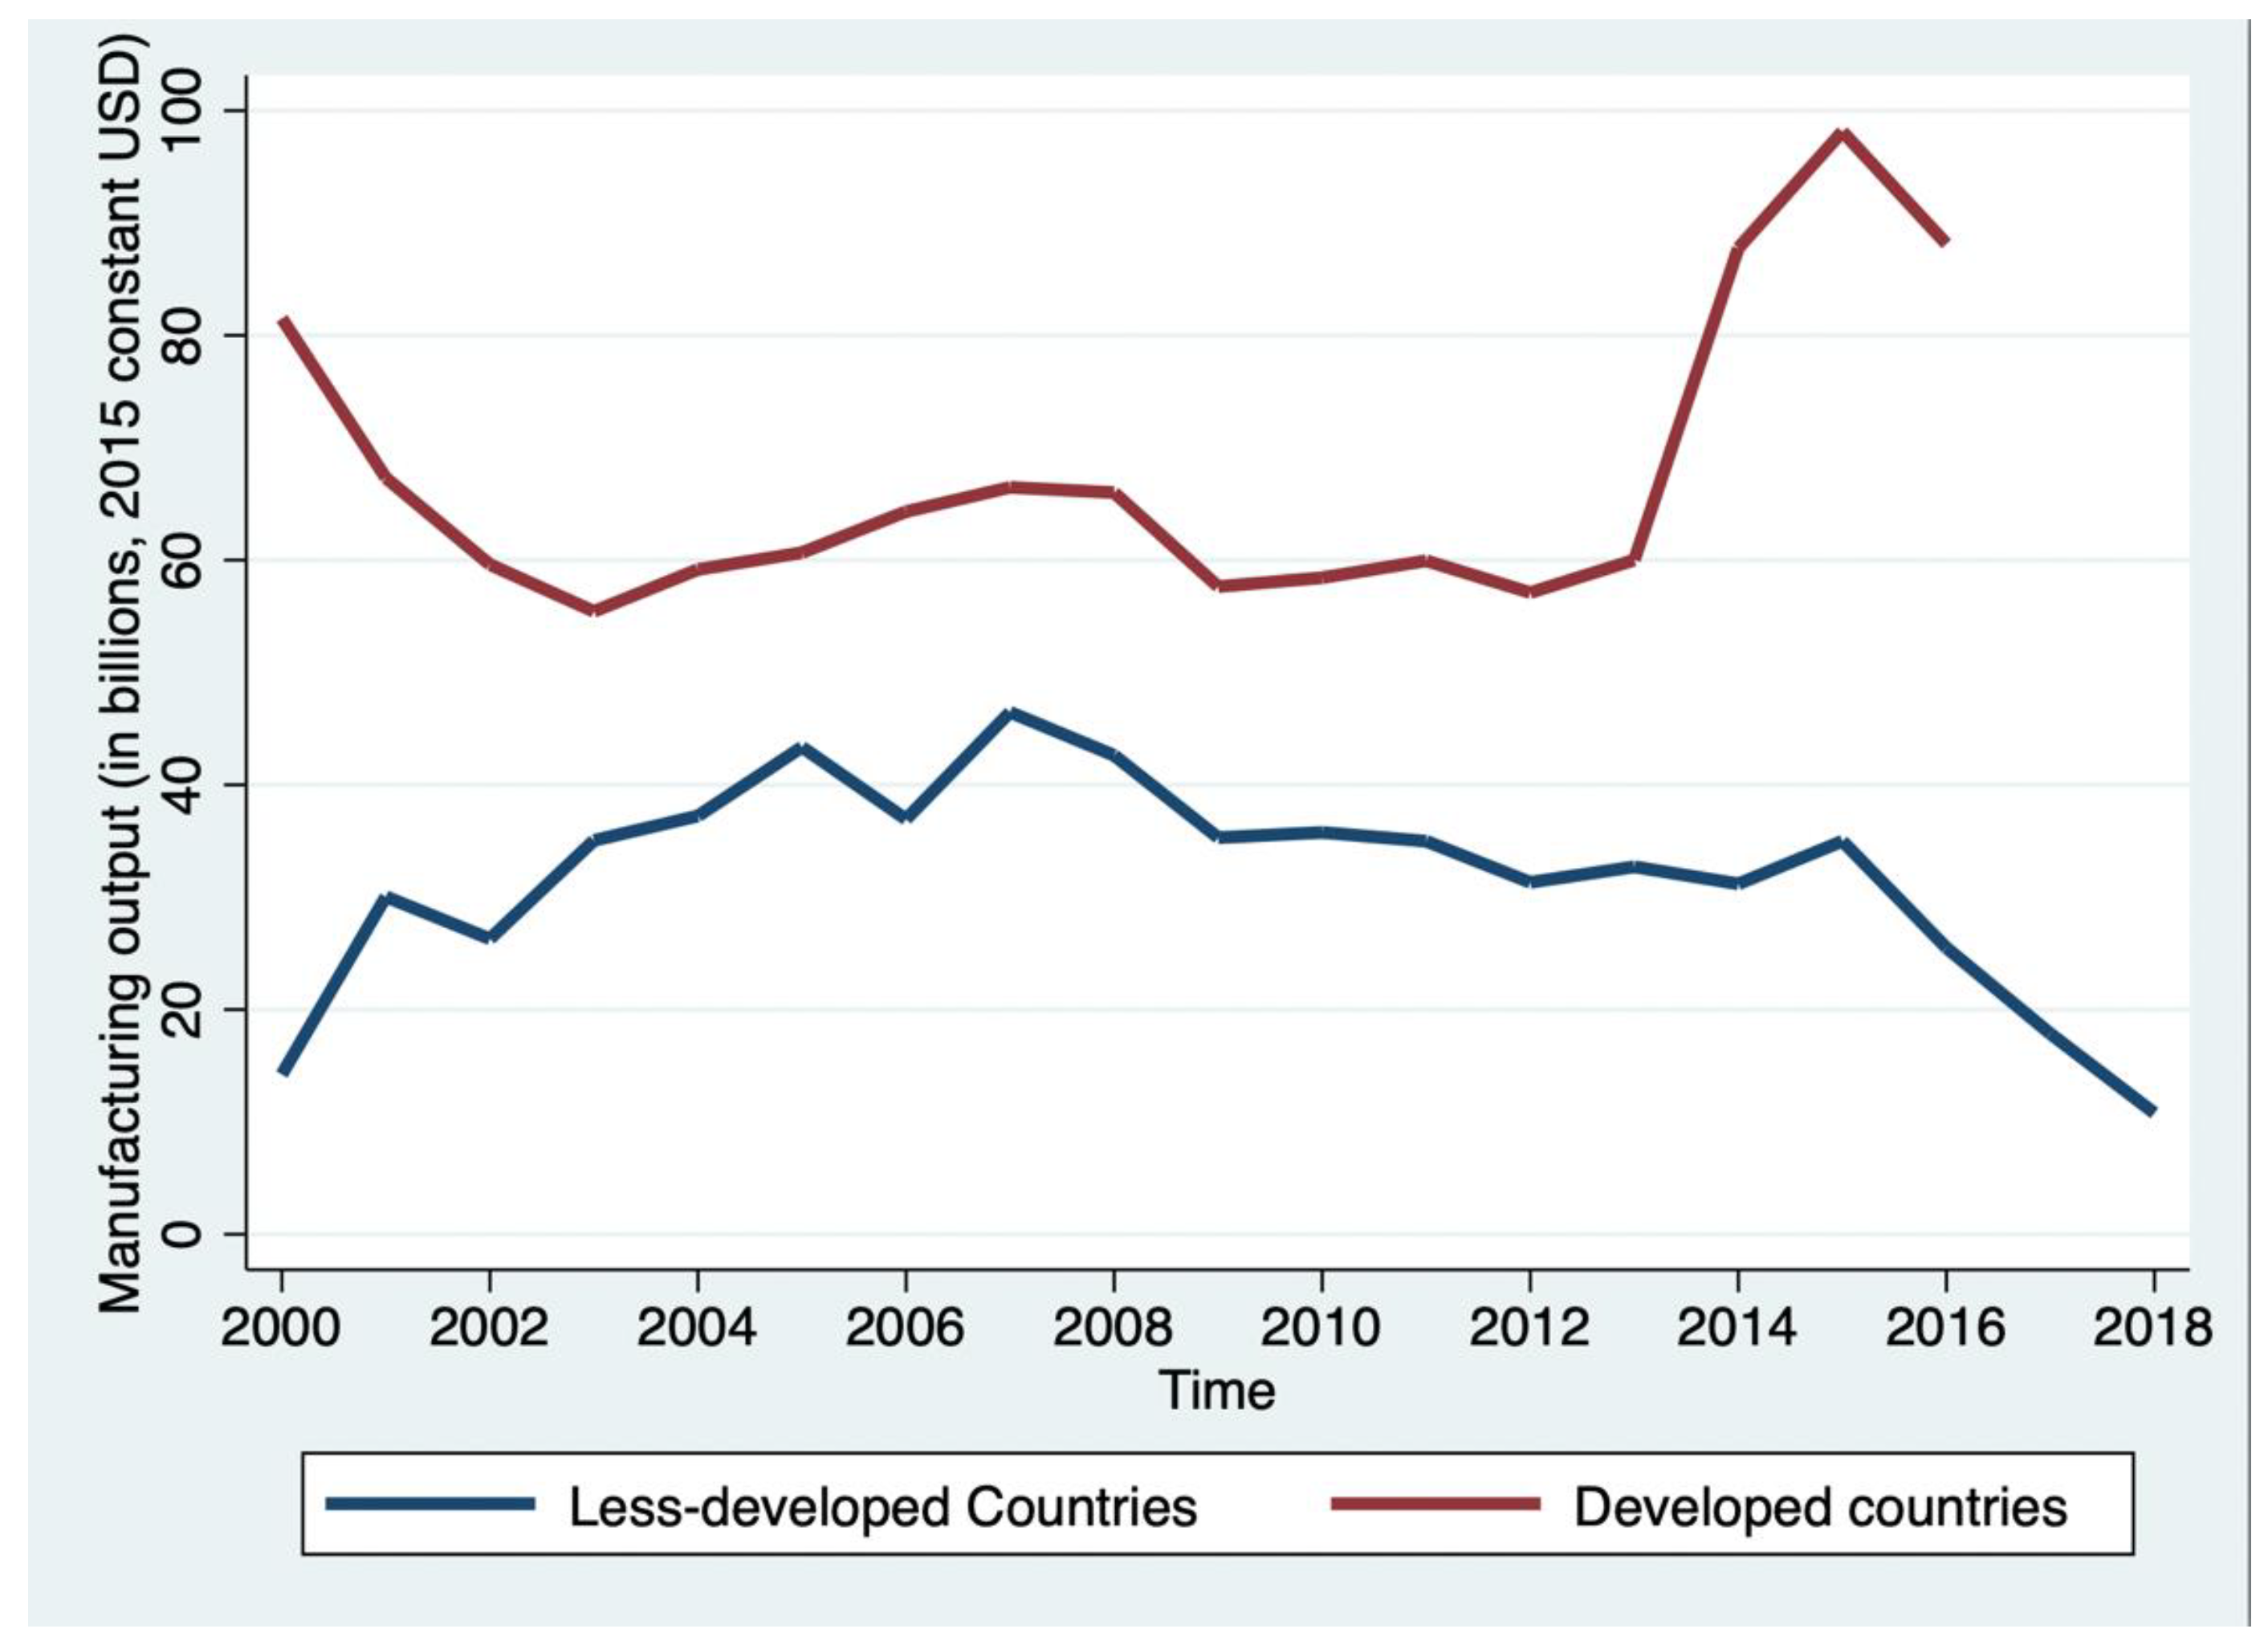
3.1. Economic Development within Globalizing Nations

Engagement in the global economy boosts the economies of less-developed nations. The GDP per capita remained below USD 10,000 (in constant US dollars) from 2000 until 2014 and only began to break this barrier after 2016 (Figure 1) with changes in trade alliances after 2015. The post-recession global economic recovery during this period seems a more likely influential factor. There was also a slight economic uplift in the economies of the less-developed nations after 2016. From this data, it is not possible to conclude that changes in trade alliances were a cause of these temporal changes; this is an issue that merits further study.
Between 2000 and 2010, manufacturing output in developed nations declined while it rose in less-developed countries (Figure 2). Manufacturing output grew from 2000 to 2007 in less-developed countries, then gradually declined until 2015, then fell sharply. Uncertainty about US–China trade is an issue not represented in this data. As recession waned in 2013, manufacturing increased in Easter Europe [78]. However, China realigned trade with the EU, and these nations seemed to benefit from the UK’s withdrawal [79]. These are recent developments and, therefore, probably would not impact these data reports.

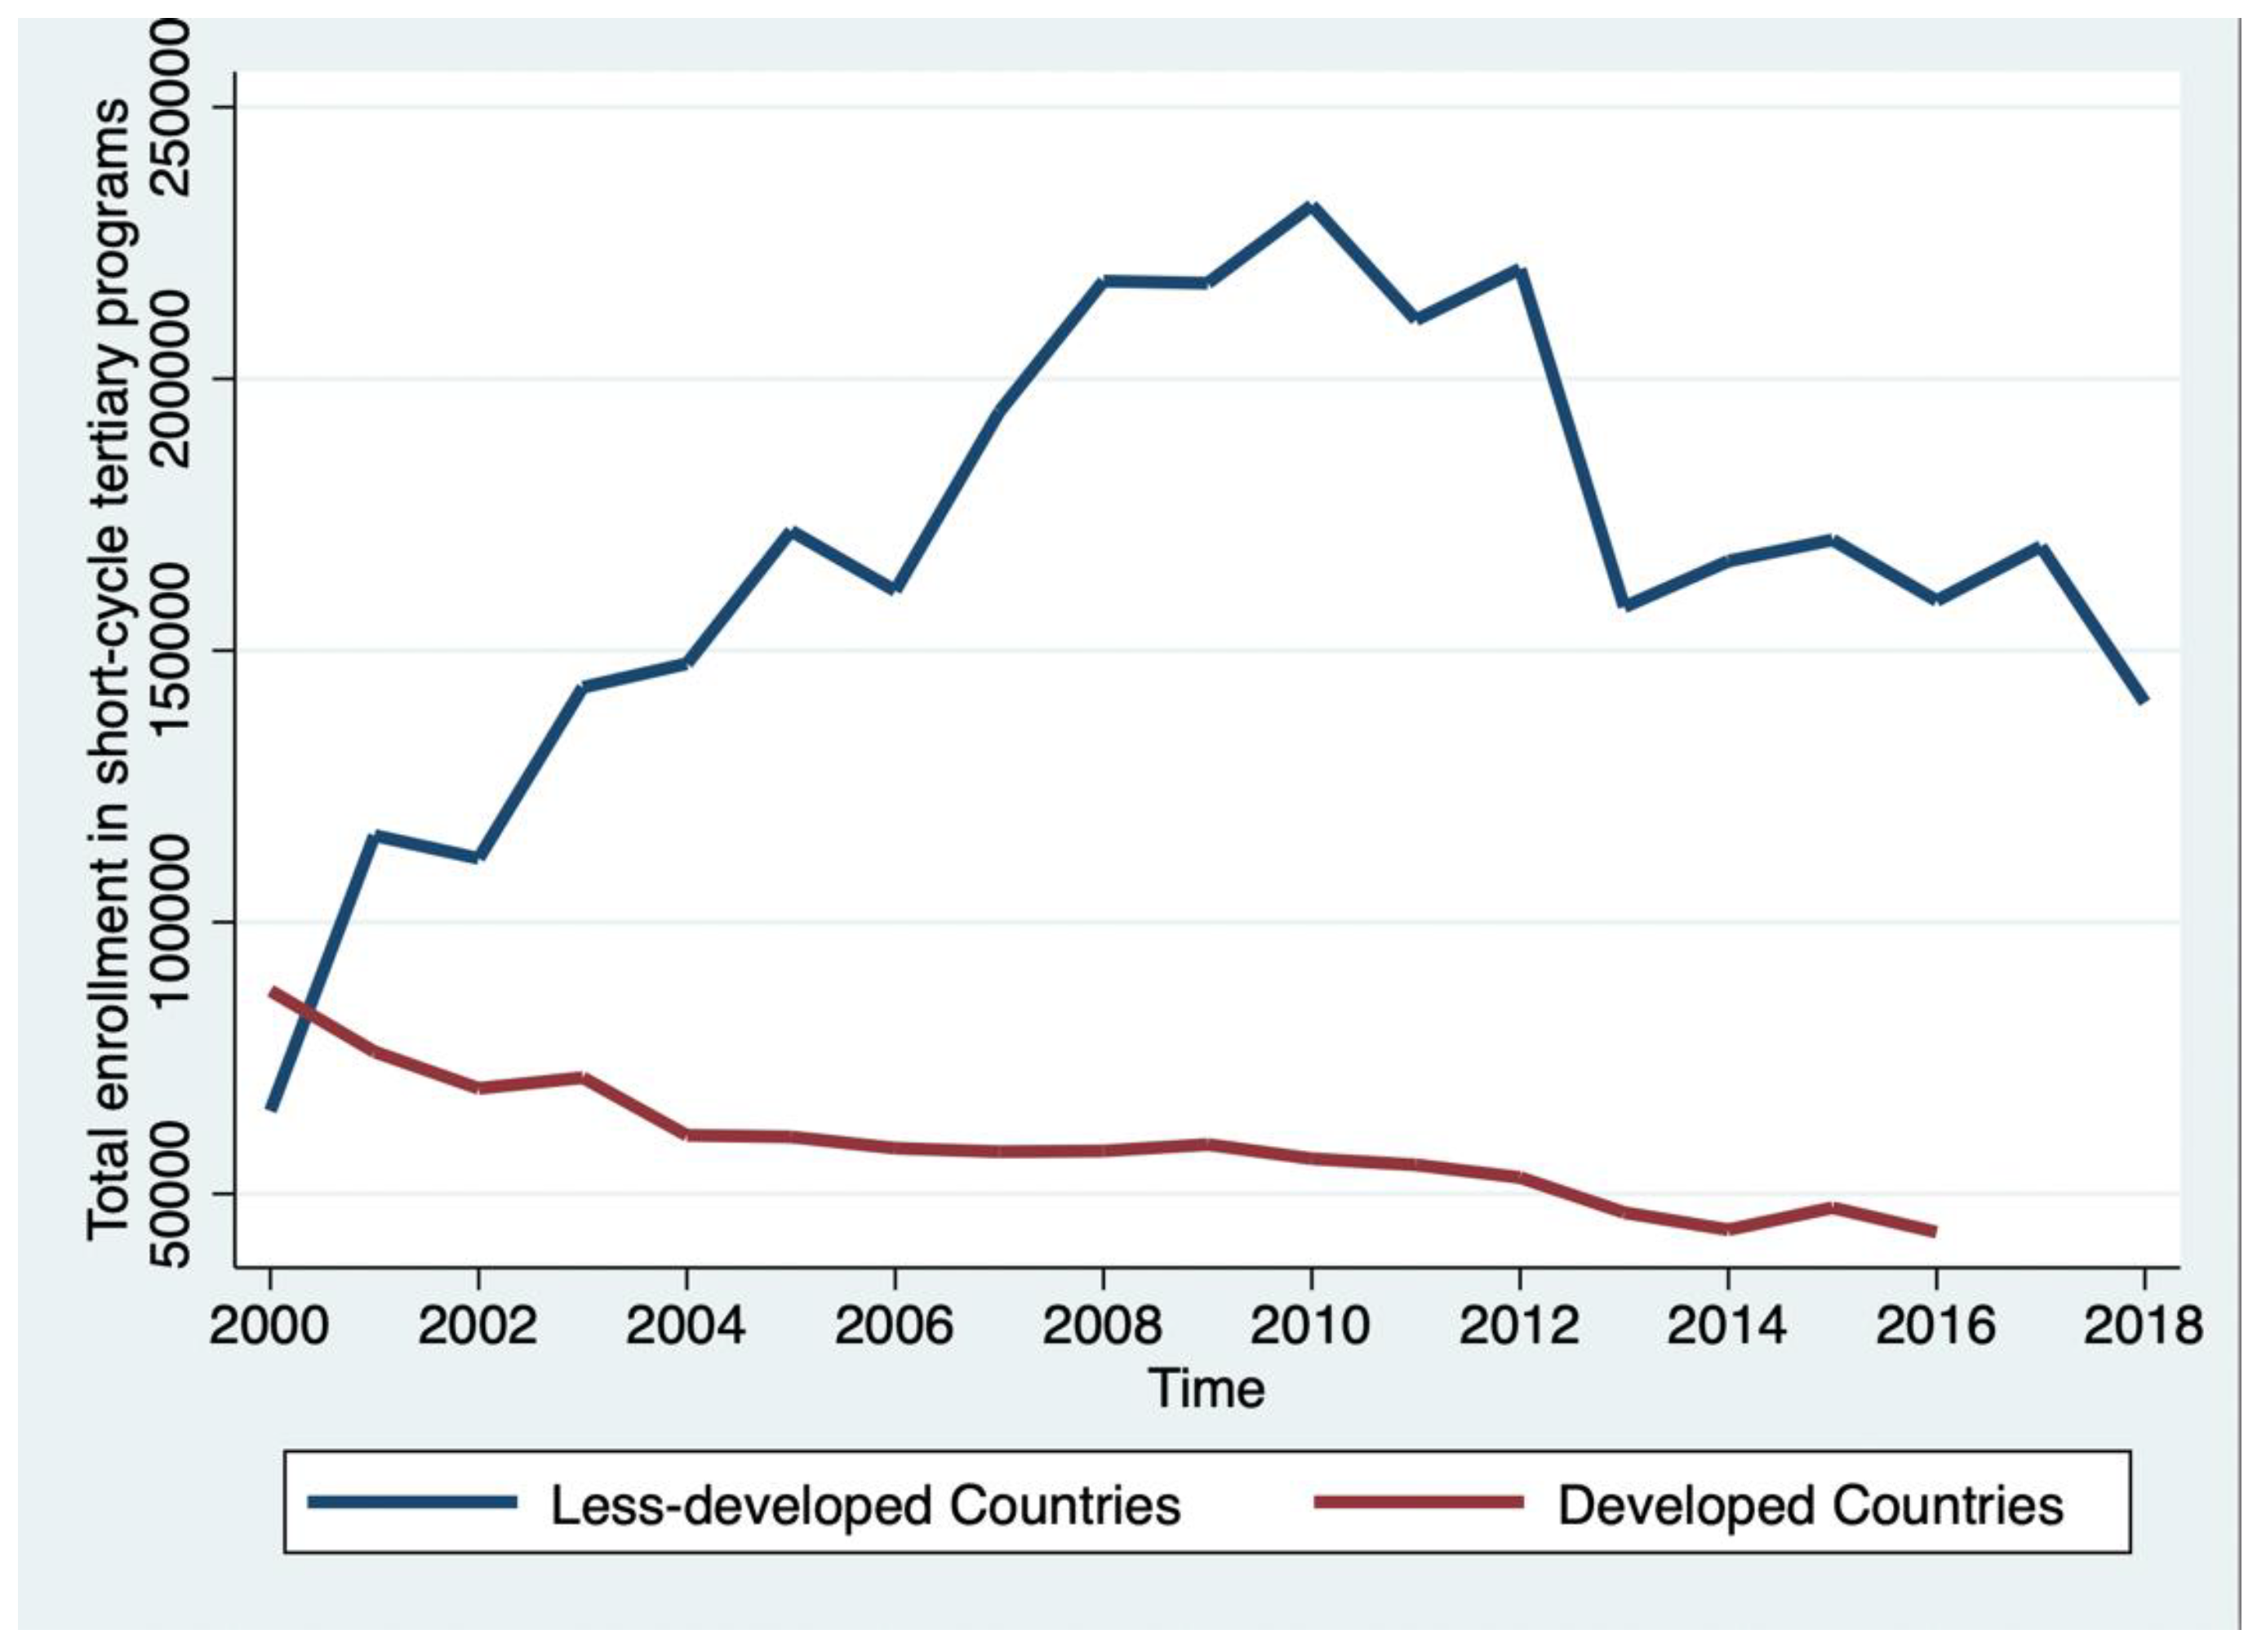
3.2. Enrollment in Tertiary Short-Cycle (Mostly Vocational) Programs

At the turn of the century, funding organizations learned that vocational/technical education was more costly than academic programs and pre-employment vocational training was more expensive than in-service training [80], leading to public–private partnerships in many instances [81]. Since private corporations are often involved in training, public–private partnerships may benefit colleges and universities financially and speed up the innovation process [82]. Literacy, a necessity for industrial work, was still a challenge in less-developed nations lacking primary education for all citizens [83]. Total enrollment (headcount and percentage) in short-cycle tertiary programs or ISCED level 5 education decreased from 2000 to 2018 for the selected developed countries (most EU countries, plus the UK and New Zealand) (Figure 3 and Figure 4).
The increased manufacturing activities beginning in 2013 in Eastern Europe corresponded with the drop in short-term training. Increased manufacturing activities created jobs for people who completed training programs for work. Growth in employment in Central and Eastern Europe seems to have been a force for change in manufacturing activities and short-cycle training, with a decline in training as the workforce expanded [84,85]. Economists have long noted that increases in employment decrease college enrollment of students meeting minimal qualifications [86,87]. In less-developed countries, although the percentage of short-cycle programs in total tertiary enrollment declined generally, the enrollment headcount in short-cycle training programs grew substantially between 2000 and 2013 but declined after 2013. As shown in Figure 3, enrollments fell sharply over a year or two, which could have been an effect of global recession, then stabilized at a lower level. Several factors contributed to the increased public investment in these programs in the pre-2013 period. Corresponding to the drop in enrollment in short-cycle courses in less-developed countries after 2013, the World Bank began to advocate for evaluations of the systematic impact of this investment. They argued that research could help inform nations about these shifts and related nuances [88].

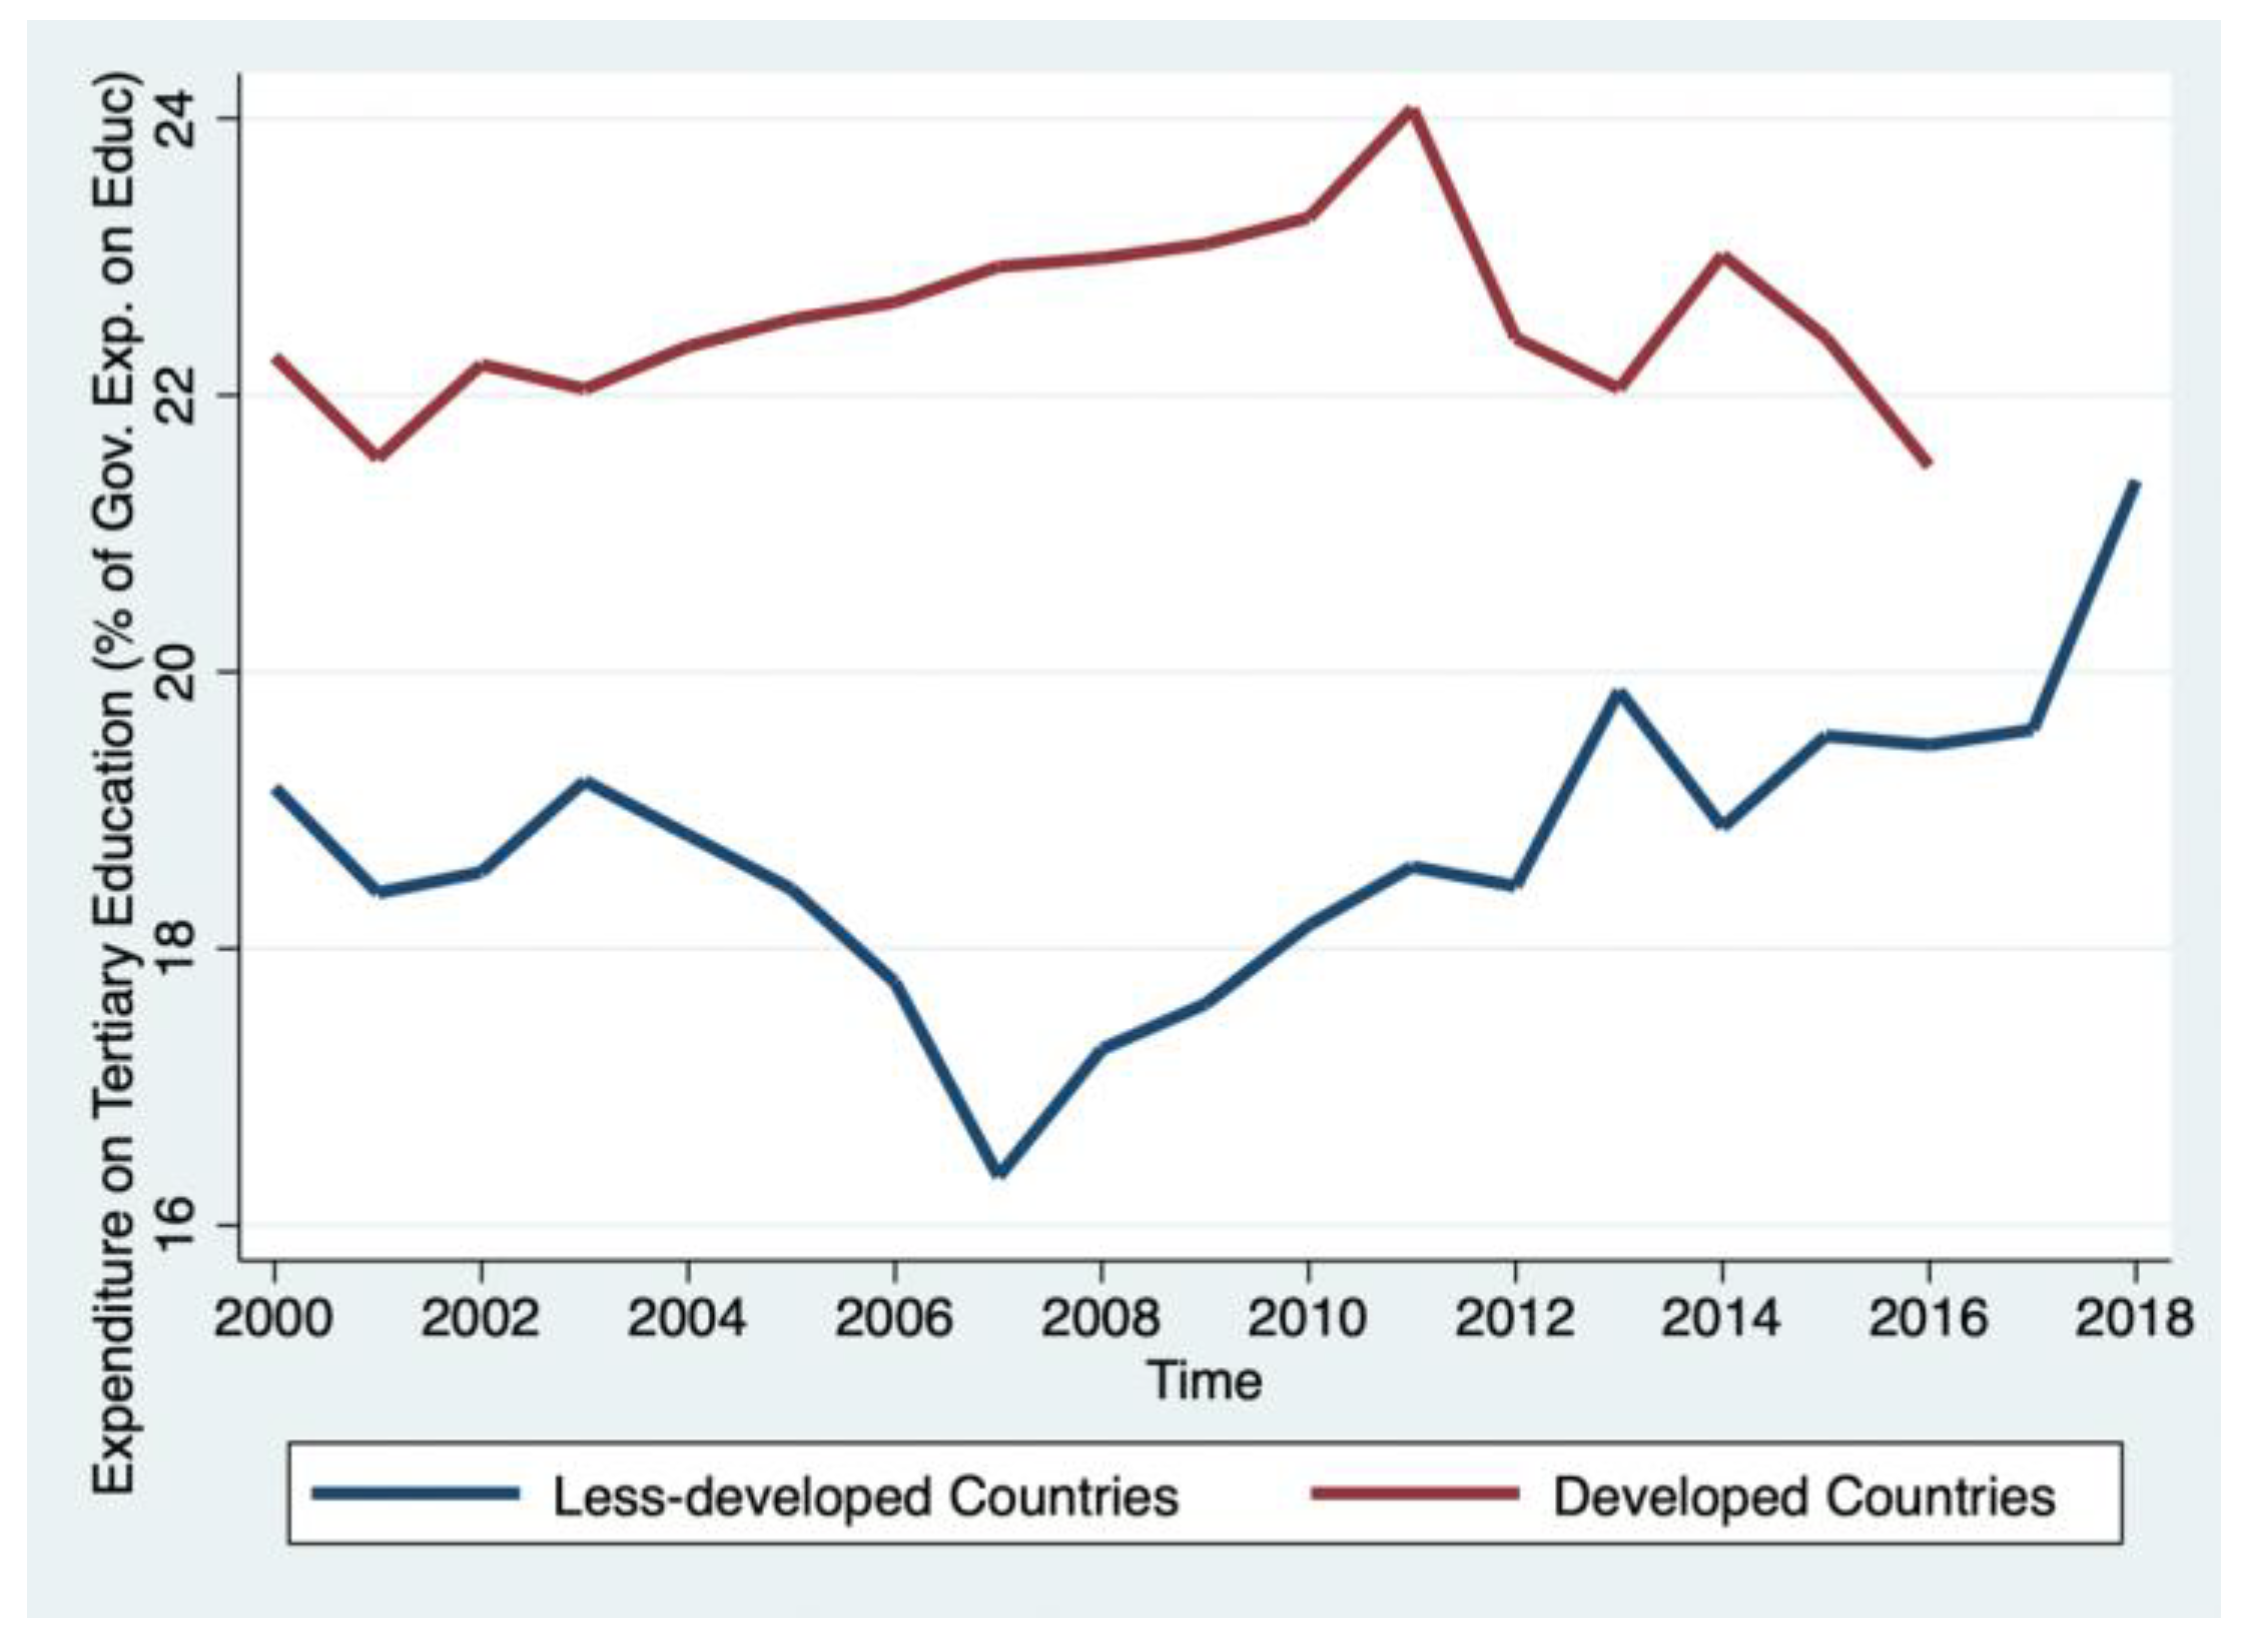
3.3. Changing Structures and Financing of Short-Cycle and Institutionalized Vocational and Tertiary Education

After a brief decline, public investment in tertiary education as a percent of government expenditure on education increased as a priority in less-developed countries. At the same time, it was unstable in developed countries (Figure 5). Before 2016, developed countries spent a substantially higher percentage of total government expenditure on tertiary education than less-developed countries. The less-developed nations made a substantial new investment in tertiary education after 2007, especially after 2018, when it appeared nearly equal to the investment by developed nations (Figure 5). This increased spending on tertiary education in less-developed countries could be an artifact of four-year tertiary institutions taking on a more substantial role in technical and vocational education, similar to the changes in European higher education discussed in Section 2 above.
Except for 2000, a year outside the trend, the less-developed nations invested a substantially lower share of expenditure on secondary education per student than developed nations. After constrained expenditure on secondary education during 2000–2005, developed countries increased the percentage of government expenditure on secondary education per student between 2006 and 2011; spending declined to the level of the early 2000s (Figure 6) in terms of public spending on secondary education across these less-developed nations over this period. In 2000, less-developed nations spent a higher percentage than the developed nations in this study. After a drop in 2002, this percentage rose again in less-developed nations after 2008.
Enrollment in vocational secondary school dropped substantially in the less-developed nations after 2000. the developed EU nations continued the VET approach, and the share of VET secondary enrollment was stable at around 25% (Figure 7). The longitudinal trend in the developed nations, primarily European, illustrates a link with regional cooperation on production, trade, and workforce migration. The VET high school courses in EU countries and New Zealand aligned with collegiate opportunities at the bachelor’s level, since all of these nations had upgraded collegiate technical education and aligned it with employment. The open-market approach enabled governments to continue production as part of within-EU trade.
Between 2000 and 2018, VET enrollment in less-developed nations declined from approximately 19% of high school students to 1% in 2006 and did not change substantially after that. This decline may be partially due to secondary school students preferring academic secondary school curricula. Such a substantial decrease must be due to policy changes in less-developed countries over the past two decades [13].
The shift away from vocational education enrollment in high schools has been cross-national. It is evident in developed and less-developed nations [89]—a structural change only partially influenced by the US STEM narrative. The rise in international testing and other changes promoted by OECD created new patterns of educational development and funding [90]. High-poverty countries have faced challenges, including AIDS and COVID-19, that shut down large portions of secondary enrollment [91]. They too often lack the resources to adapt quickly—home computers are essential for distance schooling, and accessible health care is necessary to prevent the spread of diseases. The education structure has been changing in the twenty-first century, and many of the highest-need nations cannot adapt when necessary.
Vocational programs are more expensive than general education, which adds nuance to interpreting these trends. Governments may be unable or unwilling to fund more costly VET secondary programs. However, moving VET into four-year degree programs provides an alternative. The EU maintained social responsibility in education and public finance policies, a value implicit in this shift in the locus of technical education. In contrast, the US STEM strategy seemed to be a cost-cutting move for federal government [22]. Social responsibility for the uplift of working-class families is especially critical in the US, where benign neglect of funding for vocational programs has influenced the decline of the middle class at a higher rate than in the EU [27]. While important, these issues remain speculative because they are beyond the scope of these analyses.

3.4. Comparing VET in Developed and Less-Developed Nations

As the final step in the longitudinal trend analysis, we reflect on patterns of policy development (Section 2). The EU approach to secondary and postsecondary development, the Washington Consensus, and the early British Commonwealth approach to institutional development have influenced developmental patterns.
Understanding the history of policy and planning within national and regional systems helps build an understanding of the evolution of institutional forms. The EU and ASEAN nations evolved regional strategies that helped resist some troubling effects, such as privatization and inequity in education, observed in early critiques of globalization [92] and marketization [93]. Recent developments suggest a change in the global trajectory.
Within regional supply chains, Europe and Southeast Asia avoided economic problems evident in the US economy associated with the decline in China’s manufacturing activity during shutdowns in the COVID-19 crisis [85]. The EU and ASEAN countries have more extensive regional trade, which probably eased challenges created by COVID-19. These regional supply chains are closer than the US and China. Furthermore, China went through more severe shutdowns in industrial production than ASEAN and EU nations. The Washington Consensus influenced the patterns of institutional development on privatization in the 1990s; however, many Asian and Latin American countries are pondering the legacy of college debt in still-developing nations [12,94,95]. The British Commonwealth’s development converged with strategic planning for technical development in ASEAN countries, contributing to the high-tech supply chain.
As noted above, changes in development in the past decade further inform the argument that the global trajectory has changed. The trends suggest that European trade benefited from tensions between the US and China. The tension about trade between China and the US began before Trump ran for President [96]. Changes in trade started before the election—Trump voiced the festering problem. There were also changes in the relationships among less-developed countries, Europe, and China as the EU nations took on more production. At the same time, less-developed nations in Africa and Latin America began questioning the rapidly changing northern hemisphere theories of development promoted by UN organizations and the World Bank.
In the late 20th century, the World Bank and other international organizations aligned their guidance and financial support with the Washington Consensus that argued for privatization, using tuition fees and loans to pay for postsecondary education. As economic globalization progressed, however, these same organizations promoted VET to engage rapidly in many developing nations as they played increasingly substantial roles in the global economy. The shift was often motivated by assessments in less-developed countries that refocused on sustainability for their populations. Increasingly, it may be appropriate to view public spending on short-cycle VET as a step toward new industrial development that four-year technical programs may replace if economic development is successful. This idea fits patterns in the EU and may apply in some less-developed nations as they move forward in an increasingly politicized global economy.
It is evident from the longitudinal trend analysis and review of policy development that there is no longer a single narrative guiding international economic development. The EU, the UK, and ASEAN nations developed vocational bachelor’s programs. Students and graduates in Latin America and Southeast Asia have educational debt that could constrain domestic economic development for another generation. The EU and ASEAN models show that national and regional interests support cooperative action in education and trade. These nations have been better prepared to adapt to the recent and rapid shifts in global patterns of economic development.
There is a relatively long history that includes European technical institutes, polytechnics in England, and engineering and specialized undergraduate colleges in the USA and other nations. Some US land-grant universities, such as Ohio State and Purdue, have two-year campuses with transferrable technical programs. In addition, graduate schools routinely offer short-cycle courses through continuing education to update professionals as technologies change. Private corporations also develop short-cycle programs to update practicing professionals and technicians with new technologies, especially in software and web-based applications. Integrating new content into academic programs for undergraduate and graduate students is the second step in adaptive change supporting local economic development. This two-step process makes sense and fits with the findings of the trend analysis, informed by the historical analysis in Section 2.

4. Fixed-Effects Study of Public Investment in Short-Cycle Postsecondary Education

Most of the literature examined above provides qualitative country/regional analysis and uses descriptive quantitative methods (e.g., using trends and mean) to study access to tertiary vocational education. None of these studies have provided empirical evidence on whether education finance policies have influenced the development of tertiary vocational education across different countries. The fixed-effects regression analysis of public investment reported here adds to the literature on public investment in short-cycle tertiary education. We discuss the methods and findings below.

4.1. Methods

This fixed-effects regression uses 19 years of data from nations reporting to the World Bank. The analyses provide insights into how the global economy and public investment have influenced tertiary vocational education. After accounting for missing data, the sample size of the final dataset is 681 (an unbalanced panel dataset with varying numbers of years for each country). We discuss the variables, statistical models, and data limitations below.

4.1.1. Variables

The two dependent variables are (a) enrollment (headcount) in ISCED-Level 5, or short-cycle tertiary education [4] and (b) the percentage of ISCED-Level 5 students within tertiary education. The sector incorporating ISCED-Level 5 is often designed to provide students with professional knowledge, skills, and competencies and offer a tertiary level of education below the status of a bachelor’s degree or equivalent (See Appendix A, Definitions of the Variables).
Guided by the conceptual framework, this study selected 18 independent variables from WDI to address the research questions. We use three blocks of independent variables. First, education finance policy variables include government expenditure on tertiary education as a percentage of governments’ education expenditures, public expenditure per student at primary, secondary, and tertiary levels (as a percent of GDP per capita), and public spending on education (as a percent of GDP). Government expenditure on tertiary education as a percentage of government expenditure on education provides an indicator of government priority in financing the tertiary sector relative to elementary and secondary education. Public spending on education as a percentage of GDP indicates a country’s prioritization of education compared with resource allocation to other public sectors (e.g., health, military). Public expenditure per student at each level as a percent of GDP per capita represents the government’s role in sharing the cost of education.
Second, economic indicators include GDP per capita and total manufacturing output (in constant 2015 USD). GDP per capita can capture global economic changes and represent income level and education affordability. Since tertiary vocational education mainly supplies the labor force to the manufacturing industry in many countries [55], including manufacturing output may provide insights into how a country’s manufacturing size and global competitiveness affect its growth in tertiary vocational education.
Third, the set of educational system variables includes the percentage of students enrolled in vocational and technical secondary education programs, gross enrollment ratios, and gender parity indices (GPI) at the three education levels (See Appendix A, Definitions of the Variables). The gross tertiary enrollment ratio is the total enrollment in tertiary education (ISCED 5 to 8), regardless of age, expressed as a percentage of the total college-aged population of the five-year age group after leaving secondary school. GPI is the female gross enrollment ratio at each educational level compared with males; a value less than 1 indicates a disparity in favor of males, and a value greater than 1 indicates a disparity in favor of females. Lagging variables for gross tertiary enrollment ratios and GPI at the tertiary education level by one year allowed countries time to respond to previous years’ changes in higher tertiary vocational education systems.
Like Yang and McCall’s [13] study, the analytical framework also includes a set of control variables on population characteristics, including the percentage of the population 65 years and older, the percentage of females in the population, and the total population size. These control variables partial out the impact of socio-demographic factors, such as aging trends and the gender gap in the school-aged population, on the dependent variables [13].
In addition, the literature review suggests that the purpose, access, and design of tertiary vocational education systems differ between developed and less-developed countries [36,55]. Thus, in the preliminary stage, this study included a dummy variable to classify the development level of the 67 countries (1 = developed countries; 0 = less-developed countries) based on the classification developed by the United Nations [5]. We created a series of interaction terms from the dummy variable and the first three blocks of indicators. Five interaction items between the dummy variable (countries’ development level) and critical economic, education finance, and systems variables appeared statistically significant in the preliminary statistical analyses. Thus, this study retained only five interaction terms in the final models—manufacturing output, GDP per capita, tertiary expenditure, secondary expenditure, and secondary vocational education. The interaction terms can provide insights into whether the effects of a country’s economy, education finance, and secondary vocational education on short-cycle tertiary vocational education depend on its development level.
We took steps to address multicollinearity, a potential limitation in regression analyses. We reviewed pair-wise correlations between all independent variables to check for severe collinearity. Additionally, our panel dataset includes a long time series with a maximum of 19 years of entries (2000–2018, with no missing data) clustered for each country, causing high intra-class correlation and serial correlation [97]. In this case, the traditional correlation matrix does not sufficiently capture the panel dataset’s variance structure; thus, the correlation table is not provided (but available on request). Finally, all variables in dollar units or population headcounts were transformed using a natural logarithm to model a linear relationship.

4.1.2. Statistical Models

This study uses a fixed-effects regression approach to determine the influences of education finance, economic indicators, and educational systems on short-cycle tertiary vocational education enrollment. Using fixed-effects models to analyze cross-country time-series (panel) data can capture country-specific, unobservable, and time-invariant effects that may exist for each country (e.g., national history and culture, socio-political structure, education values, and finance pattern for higher education). Additionally, our fixed-effect models include time dummy variables for each year to detrend variables that tended to increase or decrease over time (e.g., enrollment ratios, total population). Detrending or controlling the time trend may help the study avoid a “spurious regression problem” in results [70]. The following fixed-effects model was applied to estimate country and time effects of education finance variables and other predictors of tertiary vocational education:
y i t = α + β 1 x 1 i t + + β k x k i t + μ i + γ t + ε i t  
where εit~IID (0, σε2), μ i ~IID (0, σμ2)
In this model, i(=1, 2, …, N ) represents the i th country; t (=2000, 2004, …, 2018) denotes the year, where the year of 2000 is treated as the reference category; α is the intercept of the model; βk is the coefficient associated with the independent variables x k i t ; the term γt denotes the time effect; μ i represents country-varying, time-invariant variables (country fixed-effects); and εit denotes the country-varying and time-varying error term. In a fixed-effects model, the country dummies μ i are considered part of the intercept. By assumption, E(εit) = 0 and Var(εit) = σε2, while εit~IID (0, σε2) denotes that errors are independent and identically distributed (IID).
This study uses the above equation to estimate four fixed-effects models on two dependent variables by excluding (Models 1 and 3) and including the interaction items between the country’s development level and predictor variables (Models 2 and 4). We report the results from all models and highlight consistent results across two or more models. At least one of the interaction terms in Models 2 and 4 appears statistically significant, so we present the regression coefficients and the interaction effects.

4.1.3. Data Limitations

This study has some limitations. First, some potentially influential factors on vocational education are unavailable from the WDI dataset (e.g., tuition fees and financial aid programs are missing) or lack necessary classification into components. For example, government expenditure on tertiary education did not distinguish between vocational and academic programs.
Second, except for the two economic indicators and three population variables, the rest of the variables contain considerable missing values. Assuming that the mechanism of missing data is random and that variables change slowly over time, the study imputed a small part of the missing data, only 5 percent of all data points in total for the 18 variables, with values adjusted to an average growth rate of the individual variable that contains missing data.
Third, the countries in the statistical analysis are primarily middle- or upper-income countries that are more likely to report data to the World Bank. Moreover, the developed countries in the dataset are mostly members of the European Union plus New Zealand. In addition to the United States, referred to in many places in the paper, China, Russia, India, Turkey, Argentina, Venezuela, France, Australia, and other nations are also missing due to a lack of data. Thus, it is inappropriate to generalize beyond the countries included in the study.
Fourth, since more recent data after 2018 are unavailable for most countries in the World Development Indicators dataset, caution is suggested when generalizing the results to the coronavirus pandemic and post-pandemic periods.
Finally, as noted above (Section 4.1.1), we took steps to reduce the risk of multicollinearity. We first reviewed pair-wise correlations between all independent variables and made sure no severe collinearity affected the estimation. Furthermore, our panel dataset has a long time series with a maximum of 19 years of homogeneous entries (2000–2018, when there was no missing data) clustered for each country, causing higher correlation than a single cross-country dataset [97]. Thus, the correlation table is not provided (but is available on request).

4.2. Findings

Table 2 provides the results from the fixed-effects regression models examining the impacts of education finance, the economy, and the educational system on tertiary vocational education. Models 1 and 3 (without interaction effects) and 2 and 4 (with interaction effects) yielded consistent results for the main effects of the variables.
All models (Models 1–4) demonstrate that two types of tertiary expenditure have statistically significant relationships with the headcounts or percentages of tertiary vocational education. First, government expenditure on tertiary education as a percentage of government expenditure on education (compared to expenditure on elementary and secondary education) was positively related to tertiary vocational enrollment (headcount or percentage). Second, public expenditure per tertiary student as a percentage of GDP per capita was negatively associated with tertiary vocational enrollment (headcount or percentage).
In Models 2 and 4, public expenditure per secondary school student as a percentage of GDP per capita had a statistically significant and positive association with tertiary vocational enrollment. Models 2 and 3 show that the percent of vocational education within secondary enrollment has a positive, statistically significant relationship with tertiary vocational education (β1 = 6.479, p < 0.01; β2 = 35.01, p < 0.01) and the interaction term with country development level in Model 2 is also statistically significant (β2interaction = −6.089, p < 0.05), such that a single percentage increase in secondary vocational enrollment is associated with a nearly one (6.479) percent increase in tertiary vocational enrollment in less-developed countries, but with only a much smaller (0.39 (6.479–6.089)) percentage increase across developed countries.

4.3. Discussion

The fixed-effect models examining the influences of education finance policies, economy, and educational systems on tertiary vocational education reveal that public spending on tertiary and secondary education and secondary vocational enrollment have a statistically significant influence on short-cycle tertiary vocational education. The positive relationship between government expenditure on tertiary education (academic and vocational) as a percentage of government expenditure on education and short-cycle tertiary vocational enrollment suggests that short-cycle tertiary vocational education relies on public spending. In contrast, US community colleges rely more on government (local and state) appropriations than four-year institutions [98]. This pattern seems also to be true for the nations studied here. On the one hand, the open-access, low-tuition nature of admission into short-cycle tertiary education requires heavy public subsidies. On the other hand, unlike costly four-year bachelor’s degree programs, financing short-cycle tertiary training, often of lower quality and cost, involves a lower level of financial commitment from the government. Thus, it is logical that increased public investment in tertiary education benefited short-cycle education rather than bachelor’s education.
The negative relationship between public cost per tertiary student as a percentage of GDP per capita and tertiary vocational enrollment is consistent with the findings of Yang and McCall [13]. When countries have adopted a fixed total budget for tertiary education, the more students enrolled in tertiary vocational education, the less government investment per student. Competition for higher education resources under a fixed total budget may lead to an inverse relationship between public expenditure per student and tertiary vocational enrollment. Therefore, the negative relationship yielded in this study provides some evidence that budget allocation levels for tertiary vocational education are relatively fixed or do not increase proportionately with enrollment levels [99,100]. Similar to the findings for gross tertiary enrollment (both academic and vocational) in Yang and McCall’s [13] research, this study finds that the negative relation remains the same for short-cycle tertiary education.
The regression results reveal a different story about public investment in short-cycle tertiary education compared with for higher education access in general (both vocational and academic tracks). According to Yang and McCall [11], higher education access to all sectors (vocational and academic) in general has borne statistically significant relationships with public spending on education as a percentage of GDP, GDP per capita, secondary enrollment ratio, and gender parity indices at secondary and tertiary levels. In this study, these relationships are not statistically significant, but the results are highly intuitive and well-aligned with existing literature. Primarily due to its openness in admission criteria and low-tuition nature, access to short-cycle tertiary vocational education is not very sensitive to public spending on education as a percentage of GDP, citizens’ average income (represented by GDP per capita), secondary education preparation, or the gender pattern prevailing in secondary and tertiary education.
The positive, significant relationship between secondary vocational enrollment and tertiary vocational education and the significant interaction effect observed in this study are particularly illuminating. It is logical that in less-developed countries, tertiary vocational education mainly provides college access for students who have completed secondary vocational education. In other words, these less-developed countries have established pipelines through which secondary vocational students directly enter tertiary vocational education. It is also likely that secondary and tertiary vocational education in less-developed countries are encouraged by national policies. This parallel development strategy has enabled many developed and less-developed countries, such as Malaysia, Japan, and the Republic of Korea [56], to expand students’ options and meet the increasing demand for technical, managerial, and professional occupations. However, this study finds that a parallel vocational education development strategy has been more applicable for less-developed countries and much weaker across developed countries.

5. Building Understanding of Public Investment

We used a three-step method of reviewing the literature on VET policy, analyzing trends in related variables, and performing fixed-effects regression to address the research questions. We return to the two research questions using insights from each part of the analysis before considering the implications of using multiple methods to triangulate complex policy questions.

5.1. Findings

Our first research question was: How have education finance, economic development, and educational systems influenced tertiary short-cycle vocational education after controlling for population characteristics? The review of policy literature demonstrates the commitment of national governments to invest in VET education, a pattern evident in both the EU and ASEAN nations. The EU guides economic, educational, and social policies that promote national development.
All except one of the developed nations providing World Bank data were European. New Zealand, the additional case, had followed a British developmental pattern and was thus influenced by the UK system and traditions, as was Ireland (included as a case). In the early 1980s, nations in the British Commonwealth began transforming technical programs into more advanced collegiate programs. The ASEAN countries in Southeast Asia, including some Islamic countries, engaged in this process with the support of the Colombo Plan Staff College. These initiatives supported autonomous development, moving through the post-colonial stage, and collective inter-governmental efforts promoting the indigenous social and economic development of member countries in Asia and the Pacific region.
Some less-developed European nations providing data had been in the Soviet bloc. Post-Soviet countries were slower to create competitive postsecondary systems because of central control, the factory-like approach, and corrupt admissions, with wealthy families buying access [101,102]. In contrast, the former Soviet countries in the EU passed through the development barrier and have obtained higher GDP per capita. Of course, selection into the EU is vital because the EU’s economy, workforce, education, and social openness provide more avenues for development.
The longitudinal trend analysis revealed changing patterns of trade and manufacturing after 2012 in less-developed countries, with an upward trajectory for enrollment in short-cycle courses before 2007. There were also changes in manufacturing patterns, with less-developed countries producing less manufacturing output and the developed nations increasing their manufacturing after 2012. However, changes in the supply chain were not the only factor.
The less-developed nations started spending more on tertiary education after 2014, as the European countries had throughout the period studied. The regression analysis demonstrates that tertiary spending as a share of all government spending on education bears a statistically significant and positive relationship with short-cycle tertiary enrollment. The impact of population size on enrollment in short-cycle programs ceased to be statistically significant in the second step of the fixed-effects analysis. We expect these findings would be different had China and India provided data. However, the question is beyond the parameters of our study. Thus, the European and less-developed nations in this study shifted VET programs from short-cycle to bachelor’s level programs, a pattern of educational development that differs substantially from the US. The Biden administration’s investment in building infrastructure, computer chips, and the environment could influence demand for technical and vocational programs. The movement toward bachelor’s programs in US community colleges [103] could also result in a meaningful and substantial change.
The second research question was: Do the influences of education finance, economic development, and educational systems on short-cycle tertiary education (primarily vocational and technical programs) differ between developed and less-developed countries? The best indicator of putting policy into practice is public investment. Among the nations providing World Bank data, we found that public spending on tertiary education was a key indicator of participation in VET education.
Collaboration within regional trade and education also appears to be a crucial factor in this period of global trade. Commonwealth nations engaged in innovation during economic globalization in the 1980s, especially in Southeast Asia. The evolution of the EU as an organizing entity fostering within-region trade and educational exchange seems to have accelerated economic development and supported economic equity better than in the USA. The UK becomes an exceptional case within this pattern. It pioneered upgrading technical education, influencing educational growth in Southeast Asia, Australia, and New Zealand. Still, Brexit symbolizes a go-it-alone strategy that differs substantially from the productive pattern of regional cooperation in education and trade evident in EU and ASEAN nations. It remains to be seen whether the UK’s recent development of a trade agreement with the EU will change Brexit’s apparent negative economic consequences.

5.2. Implications

These analyses have implications for economic and educational development across nations, particularly those countries included in the dataset. While neoliberal policy dominated the international trajectory in education and economic development early in the twenty-first century, national economies have entered a period of uncertainty and deep conflict about future directions. Underlying the new uncertainty lurk tensions between the development of democratic institutions promoting equity and support for uplift across generations, including short-cycle technical and vocational education preparing workers for new industries in a global economy.
The challenges created by the decline of democratic institutions are now evident in many nations. Many less-developed countries have not overcome totalitarian governments. Some Latin American nations suffer from elected leaders using demagogic tactics to maintain power [104]. Further, the development of universities in post-Soviet countries is hampered by the legacy of central control in government and universities [102]. The EU strategy supports the capacity of rising generations to learn, work, and engage in economic development. The current period of uncertainty affects citizens, students, administrators, and policymakers seeking a better financial future with stable social structures.

Author Contributions

Conceptualization, L.Y.; methodology, L.Y. and E.P.S.J.; software, L.Y.; validation, L.Y.; formal analysis, L.Y. and E.P.S.J.; investigation, L.Y. and E.P.S.J.; resources, L.Y. and E.P.S.J.; data curation, L.Y.; writing—original draft preparation, L.Y. and E.P.S.J.; writing—review and editing, L.Y. and E.P.S.J.; visualization, L.Y.; supervision, L.Y. and E.P.S.J.; project administration, L.Y. and E.P.S.J.; funding acquisition, E.P.S.J. All authors have read and agreed to the published version of the manuscript.

Funding

This Special Issue Was Funded by the International Joint Research Project “Education Development and Social Justice”, Faculty of Education, Beijing Normal University.

Institutional Review Board Statement

Not applicable.

Informed Consent Statement

Not applicable.

Data Availability Statement

This study draws data from the World Development Indicators (WDI) published by the World Bank. The data are publicly available online: https://databank.worldbank.org/source/world-development-indicators (accessed on 24 May 2023).

Conflicts of Interest

The authors declare no conflict of interest.

Appendix A

Table A1. Glossary of Variables Used in Trend and Regression Analyses.
VariableDefinition
Enrollment in tertiary vocational education (ISCED 5)Total enrollment in short-cycle tertiary programs (ISCED 5).
Programs at ISCED level 5, or short-cycle tertiary education, typically are practically based, occupationally-specific, at least 2 years, and prepare students to enter the labor market. However, these programs may also provide a pathway to other tertiary education programs. Academic tertiary education programs below the level of a Bachelor’s or equivalent is also classified as ISCED level 5 (UNESCO, 2012).
Tertiary education comprises ISCED levels 5, 6, 7 and 8, which are labelled as short-cycle tertiary education, Bachelor’s or equivalent level (3–4 years or more than 4 year), Master’s or equivalent level (at least 5 years), and doctoral or equivalent level, respectively.
Percentages (%) of all students in tertiary education enrolled in ISCED 5, and both sexes Total enrollment in short-cycle tertiary programs (ISCED 5) as a percentage of total enrollments in tertiary education (ISCED 5 to 8).
Education finance
Expenditure on Tertiary Education (% of Gov. Expenditure on Education)Current expenditure is expressed as a percentage of direct expenditure in public educational institutions (instructional and non-instructional) of the tertiary level of education. Financial aid to students and other transfers are excluded from direct expenditure. Current expenditure is consumed within the current year and would have to be renewed if needed in the following year. It includes staff compensation and current expenditure other than for staff compensation (ex. on teaching materials, ancillary services and administration).
  Public spending on education (as % of GDP)Total general (local, regional and central) government expenditure on education (current, capital, and transfers), expressed as a percentage of GDP. It includes expenditure funded by transfers from international sources to government. Divide total government expenditure for a given level of education (ex. primary, secondary, or all levels combined) by the GDP, and multiply by 100. A higher percentage of GDP spent on education shows a higher government priority for education, but also a higher capacity of the government to raise revenues for public spending, in relation to the size of the country. However, one should keep in mind in some countries, the private sector and/or households may fund a higher proportion of total funding for education, thus making government expenditure appear lower than in other countries
  Public expenditure per primary student (as % of GDP per capita)Average total (current, capital and transfers) general government expenditure per student in public or private institutions at the primary school level of education, expressed in the percentage of GDP per capita. The expenditure includes what the government spends, and not total spending per student (including household contributions).
  Public expenditure per secondary student (as % of GDP per capita)Average total (current, capital and transfers) general government expenditure per student in public or private institutions at the secondary school level of education, expressed in the percentage of GDP per capita. The expenditure includes what the government spends, and not total spending per student (including household contributions).
  Public expenditure per tertiary student (as % of GDP per capita)Average total (current, capital and transfers) general government expenditure per student in public or private institutions at the primary school level of education, expressed in the percentage of GDP per capita. The expenditure includes what the government spends, and not total spending per student (including household contributions).
Economy
  GDP per capita (in constant 2010 US$)GDP per capita is gross domestic product divided by midyear population. GDP is the sum of gross value added by all resident producers in the economy plus any product taxes and minus any subsidies not included in the value of the products. It is calculated without making deductions for depreciation of fabricated assets or for depletion and degradation of natural resources. Data are in constant 2010 US dollars.
  Manufacturing, value added (constant 2010 US$)Manufacturing value added is the net output of a sector after adding up all outputs and subtracting intermediate inputs. It is calculated without making deductions for depreciation of fabricated assets or depletion and degradation of natural resources. The origin of value added is determined by the International Standard Industrial Classification (ISIC), revision 3. Data are expressed constant 2010 US dollars.
Basic education
  Gross primary enrollment ratioTotal enrollment in primary education, regardless of age, expressed as a percentage of the population of official primary education age. GER can exceed 100% due to the inclusion of over-aged and under-aged students because of early or late school entrance and grade repetition.
  Gross secondary enrollment ratioTotal enrollment in secondary education, regardless of age, expressed as a percentage of the population of official secondary education age. GER can exceed 100% due to the inclusion of over-aged and under-aged students because of early or late school entrance and grade repetition.
  Gross tertiary enrollment ratioTotal enrollment in tertiary education (ISCED 5 to 8), regardless of age, expressed as a percentage of the total population of the five-year age group following on from secondary school leaving.
  Gross secondary enrollment ratio % of tech/vocational enrollment in total secondary enrollmentTotal number of students enrolled in vocational programs at the secondary education level, expressed as a percentage of the total number of students enrolled in all programs (vocational and general) at the secondary level. Vocational education is designed for learners to acquire the knowledge, skills and competencies specific to a particular occupation or trade or class of occupations or trades. Vocational education may have work-based components (e.g., apprenticeships). Successful completion of such programs leads to labor-market relevant vocational qualifications acknowledged as occupationally-oriented by the relevant national authorities and/or the labor market.
  Gender parity index for gross primary enrollmentRatio of female gross enrollment ratio for primary to male gross enrollment ratio for primary. It is calculated by dividing the female value for the indicator by the male value for the indicator. A GPI equal to 1 indicates parity between females and males. In general, a value less than 1 indicates disparity in favor of males and a value greater than 1 indicates disparity in favor of females.
  Gender parity index for gross secondary enrollmentRatio of female gross enrollment ratio for secondary to male gross enrollment ratio for secondary. It is calculated by dividing the female value for the indicator by the male value for the indicator. A GPI equal to 1 indicates parity between females and males. In general, a value less than 1 indicates disparity in favor of males and a value greater than 1 indicates disparity in favor of females.
  Gender parity index for gross tertiary enrollmentRatio of female gross enrollment ratio for tertiary to male gross enrollment ratio for tertiary. It is calculated by dividing the female value for the indicator by the male value for the indicator. A GPI equal to 1 indicates parity between females and males. In general, a value less than 1 indicates disparity in favor of males and a value greater than 1 indicates disparity in favor of females.
  ISCED 6The duration of Bachelor’ level from 3 to 4 or more years when directly following ISCED level 3, or 1 to 2 years when following another ISCED level 6 program
  ISCED 7The duration of Master’s level when following ISCED level 6, or from 5 to 7 years when directly following ISCED level 3
  ISCED 8Doctoral or equivalent level programs, are designed primarily to lead to an advanced research qualification. Programs at this ISCED level are devoted to advanced study and original research and are typically offered only by research-oriented tertiary educational institutions such as universities. Doctoral programs exist in both academic and professional fields.
Population
  % of 65-years and older Total population 65 years of age or older. Population is based on the de facto definition of population, which counts all residents regardless of legal status or citizenship.
  % of female populationFemale population is the percentage of the population that is female. Population is based on the de facto definition of population, which counts all residents regardless of legal status or citizenship.
  Total population (in millions)Total population is based on the de facto definition of population, which counts all residents regardless of legal status or citizenship. The values shown are midyear estimates.

References

  1. Maclean, R.; Pavlova, M. Vocationalization of Secondary and Higher Education: Pathways to the World of Work. In Revisiting Global Trends in TVET: Reflections on Theory and Practice; UNESCO-UNEVOC International Centre for Technical and Vocational Education and Training: Bonn, Germany, 2013. [Google Scholar]
  2. St. John, E.P. (Ed.) Co-Learning in Higher Education: Community Wellbeing, Engaged Scholarship, and Creating Futures; Taylor & Francis: London, UK, 2022. [Google Scholar]
  3. World Bank Databank. World Development Indicators [Data File]. 2018. Available online: http://databank.worldbank.org/data/reports.aspx?source=world-development-indicators (accessed on 9 March 2023).
  4. OECD. ISCED 2011 Level 5: Short-Cycle Tertiary Education. In ISCED 2011 Operational Manual; OECD: Paris, France, 2015; pp. 73–79. [Google Scholar]
  5. United Nations. World Economic Situation and Prospects. 2019. Available online: https://www.un.org/development/desa/dpad/wp-content/uploads/sites/45/WESP2019_BOOK-ANNEX-en.pdf (accessed on 30 March 2023).
  6. CEDEFOP. The Changing Nature and Role of Vocational Education and Training in Europe. 2017, Volume 1. Available online: http://www.cedefop.europa.eu/en/publications-and-resources/publications/5563 (accessed on 9 March 2023).
  7. CEDEFOP. The Changing Nature and Role of Vocational Education and Training in Europe. 2017, Volume 2. Available online: http://www.cedefop.europa.eu/en/publications-and-resources/publications/5564 (accessed on 9 March 2023).
  8. Marginson, S.; Kaur, S.; Sawir, E. Global, Local, National in the Asia-Pacific. In Higher Education in the Asia-Pacific: Strategic Responses to Globalization; Springer: Dordrecht, The Netherlands, 2011; pp. 3–34. [Google Scholar]
  9. Mustapha, R.B. Skills Training and Vocational Education in Malaysia. In Education in the Asia-Pacific Region: Issues, Concerns and Prospects; Springer: Singapore, 2017; pp. 137–153. [Google Scholar]
  10. Zhang, J.; Chen, Z.; Wu, Z.; Hora, M. An Introduction to Technical and Vocational Education in China: Implications for Comparative Research and Practice on Internships. 2020. Available online: http://ccwt.wceruw.org/documents/ccwt_report_An%20Introduction%20to%20Technical%20and%20Vocational%20Education%20in%20China.pdf (accessed on 17 April 2023).
  11. Nussbaum, M.C. Women and Human Development: The Capabilities Approach; Cambridge University Press: Cambridge, UK, 2008. [Google Scholar]
  12. St. John, E.P. Higher Education in Post-Neoliberal Times: Building Human Capabilities in the Emergent Period of Uncertainty. Educ. Sci. 2023, 13, 500. [Google Scholar] [CrossRef]
  13. Yang, L.; McCall, B. World Education Finance Policies and Higher Education Access: A Statistical Analysis of World Development Indicators for 86 Countries. Int. J. Educ. Dev. 2014, 35, 25–36. [Google Scholar] [CrossRef]
  14. Thelin, J.R. A History of American Higher Education A History of American Higher Education, 3rd ed.; Johns Hopkins University Press: Baltimore, MD, USA, 2019. [Google Scholar]
  15. St. John, E.P. The Policy Process in Higher Education: A Strategic Approach; IHE Monograph 2-1981: Armidale, Australia, 1981. [Google Scholar]
  16. St. John, E.P. Case Studies in Higher Education Policy and Management (pp. Vii–Xix); IHE Monograph 2-1981: Armidale, Australia, 1984. [Google Scholar]
  17. Clark, B.R. Concepts, models, and perspectives. In Academic Power: Patterns of Authority in Seven National Systems of Higher Education; Van de Graff, J.H., Ed.; Praeger: New York, NY, USA, 1978; pp. 164–190. [Google Scholar]
  18. St. John, E.P.; Kim, J.; Yang, L. (Eds.) Privatization and Inequality: Comparative Studies of College Access, Education Policy, and Public Finance; AMS Press, Inc.: New York, NY, USA, 2013. [Google Scholar]
  19. Gore, C. The Rise and Fall of the Washington Consensus as a Paradigm for Developing Countries. World Dev. 2000, 28, 789–804. [Google Scholar] [CrossRef]
  20. Bennell, P.; Segerstrom, J. Vocational Education and Training in Developing Countries: Has the World Bank Got It Right? Int. J. Educ. Dev. 1998, 18, 271–287. [Google Scholar] [CrossRef]
  21. Bryk, A.S.; Lee, V.E.; Holland, P.B. Catholic Schools and the Common Good; Harvard University Press: Cambridge, MA, USA, 1993. [Google Scholar]
  22. St. John, E.P.; Asker, E.H. Refinancing the College Dream: Access, Equal Opportunity, and Justice for Taxpayers; Johns Hopkins University Press: Baltimore, MD, USA, 2003. [Google Scholar]
  23. St. John, E.P.; Girmay, F. Detroit School Reform in Comparative Contexts: Community Action Overcoming Policy Barriers; Palgrave Macmillan: New York, NY, USA, 2019. [Google Scholar]
  24. St. John, E.P.; Daun-Barnett, N.; Moronski-Chapman, K.M. Public Policy and Higher Education: Reframing Strategies for Preparation, Access, and Success; Routledge: Abingdon-on-Thames, UK, 2012. [Google Scholar]
  25. St. John, E.P.; Musoba, G.D. Pathways to Academic Success: Expanding Opportunity for Underrepresented Students; Routledge: New York, NY, USA, 2012. [Google Scholar]
  26. Huysmans, M. Exporting Protection: EU Trade Agreements, Geographical Indications, and Gastronationalism. Rev. Int. Polit. Econ. 2022, 29, 979–1005. [Google Scholar] [CrossRef]
  27. Piketty, T. Capital in the Twenty-First Century; The Belknap Press of Harvard University Press: London, UK, 2014. [Google Scholar]
  28. Smith, A. The Wealth of Nations; Collier: New York, NY, USA, 1902. [Google Scholar]
  29. Holmberg, B. The Evolution of the Character and Practice of Distance Education. Open Learn. 1995, 10, 47–53. [Google Scholar] [CrossRef]
  30. The Ultimate Guide to Studying in United Kingdom in 2023—World University Rankings—MastersPortal.com. Available online: https://www.mastersportal.com/countries/30/united-kingdom.html (accessed on 10 March 2023).
  31. Ryan, D. The Thatcher Government’s Attack on Higher Education in Historical Perspective. New Left Rev. 1998, 227, 3–32. [Google Scholar]
  32. Shattock, M. The Change from Private to Public Governance of British Higher Education: Its Consequences for Higher Education Policy Making 1980-2006. High. Educ. Q. 2008, 62, 181–203. [Google Scholar] [CrossRef]
  33. Marginson, S. Global Trends in Higher Education Financing: The United Kingdom. Int. J. Educ. Dev. 2018, 58, 26–36. [Google Scholar] [CrossRef]
  34. St. John, E.P. Strategic Planning and Management: Workshop Workbook; Prepared for the Colombo Plan Staff College for Technician Education; University of Life Publishing House: Manila, Philippines, 1987. [Google Scholar]
  35. St. John, E.P. Postsecondary Policy and Management in the Far East: A Comparative Study. High. Educ. 1986, 15, 523–545. [Google Scholar] [CrossRef]
  36. European Commission. Study on Higher Vocational Education and Training in the EU; European Commission: Brussels, Belgium, 2010. [Google Scholar]
  37. World Bank. Understanding Poverty: Skills Development. 2017. Available online: https://www.worldbank.org/en/topic/skillsdevelopment (accessed on 9 March 2023).
  38. European Parliamentary Research Service. Higher Education in the EU. 2015. Available online: https://www.europarl.europa.eu/EPRS/EPRS-IDA-554169-Higher-education-in-the-EU-FINAL.pdf (accessed on 9 March 2023).
  39. Baum, S.; Ma, J.; Pender, M.; Libassi, C.J. Trends in Student Aid 2018; College Board: New York, NY, USA, 2018. [Google Scholar]
  40. Hannon, C. A Human Capability Perspective on the Progression of Low-SES Students to Higher Education in Ireland and the UK. Educ. Sci. 2023, 13, 409. [Google Scholar] [CrossRef]
  41. Meyer, H.-D. The Design of the University: German, American, and World Class; Routledge: New York, NY, USA, 2016. [Google Scholar]
  42. Lane, C. Top Universities in Germany 2021. Top Universities. Available online: https://www.topuniversities.com/university-rankings-articles/world-university-rankings/top-universities-germany-2021 (accessed on 10 March 2023).
  43. Shaffer, G. Retooling Trade Agreements for Social Inclusion. 2019. Available online: https://www.illinoislawreview.org/wp-content/uploads/2019/03/Shaffer.pdf (accessed on 5 May 2023).
  44. Fazekas, M.; Field, S. A Skills beyond School Review of Germany. In OECD Reviews of Vocational Education and Training; OECD: Paris, France, 2013. [Google Scholar]
  45. Teichler, U. Recent Changes of Financing Higher Education in Germany and Their Intended and Unintended Consequences. Int. J. Educ. Dev. 2018, 58, 37–46. [Google Scholar] [CrossRef]
  46. Euler, D. Germany’s Dual Vocational Training System: A Model for Other Countries? 2013. Available online: https://eunec.eu/sites/www.eunec.eu/files/attachment/files/2013_study_german_vet_system.pdf (accessed on 9 March 2023).
  47. Kirsch, M.; Beernaert, Y. Short Cycle Higher Education in Europe: Level 5: The Missing Link. 2011. Available online: https://vana.kutsekoda.ee/fwk/contenthelper/10378615/10402217 (accessed on 9 March 2023).
  48. 53 Top-Ranked Universities in Italy—World University Rankings—MastersPortal.com. Available online: https://www.mastersportal.com/ranking-country/15/italy.html (accessed on 10 March 2023).
  49. Bernardini, G. The Origins and Development of Racial Anti-Semitism in Fascist Italy. J. Mod. Hist. 1977, 49, 431–453. [Google Scholar] [CrossRef]
  50. Roberts, D.D. Syndicalist Tradition and Italian Fascism; Manchester University Press: Manchester, UK, 1986. [Google Scholar]
  51. Contini, D.; Triventi, M. Between Formal Openness and Stratification in Secondary Education: Implications for Social Inequalities in Italy. In Models of Secondary Education and Social Inequality; Edward Elgar Publishing: Cheltenham, UK, 2016; pp. 305–322. [Google Scholar]
  52. Kosyakova, Y.; Yastrebov, G.; Yanbarisova, D.; Kurakin, D. The Reproduction of Social Inequality within the Russian Educational System. In Models of Secondary Education and Social Inequality; Edward Elgar Publishing: Cheltenham, UK, 2016; pp. 323–342. [Google Scholar]
  53. OECD. Education at a Glance 2013--Russian Federation; OECD: Paris, France, 2013; Available online: https://www.oecd.org/education/Russian%20Federation_EAG2013%20Country%20Note.pdf (accessed on 9 March 2023).
  54. Lovakov, A.; Chankseliani, M.; Panova, A. Universities vs. Research Institutes? Overcoming the Soviet Legacy of Higher Education and Research. Scientometrics 2022, 127, 6293–6313. [Google Scholar] [CrossRef]
  55. Pavlova, M.; Maclean, R. Vocationalisation of secondary and tertiary education: Challenges and possible future directions. In Skills Development for Inclusive and Sustainable Growth in Developing Asia-Pacific; Springer: Dordrecht, The Netherlands, 2013; pp. 43–66. [Google Scholar]
  56. Akoojee, A.; Gewer, A.; McGrath, S.A. Vocational Education and Training in Southern Africa; HSRC Press: Cape Town, South Africa, 2005. [Google Scholar]
  57. McGrath, S. Where to Now for Vocational Education and Training in Africa? Int. J. Train. Res. 2011, 9, 35–48. [Google Scholar] [CrossRef]
  58. World Bank. GDP Growth (Annual Percentage). 2023. Available online: https://data.worldbank.org/indicator/NY.GDP.MKTP.KD.ZG?end=2018&locations=GH&start=2000&view=chart (accessed on 5 April 2023).
  59. Alagaraja, M.; Arthur-Mensah, N. Exploring Technical Vocational Education and Training Systems in Emerging Markets: A case study on Ghana. Eur. J. Train. Dev. 2013, 37, 835–850. [Google Scholar] [CrossRef]
  60. King, K. Technical and Vocational Education and Training in an International Context. Vocat. Asp. Educ. 1993, 45, 201–216. [Google Scholar] [CrossRef]
  61. Oketch, M.O. To Vocationalise or Not to Vocationalise? Perspectives on Current Trends and Issues in Technical and Vocational Education and Training (TVET) in Africa. Int. J. Educ. Dev. 2007, 27, 220–234. [Google Scholar] [CrossRef]
  62. Stuart, J.D. Investigating Policy Transfer from Both Sides: Case Study of a Technical and Vocational Education and Training Model in South Africa. Ph.D. Dissertation, University of Minnesota, Minneapolis, MN, USA, 2013. [Google Scholar]
  63. Republic of Ghana Ministry of Education Sector Performance Report 2012. Amazonaws.com. Available online: https://new-ndpc-static1.s3.amazonaws.com/pubication/2012+Education+Sector+Performance+Report.pdf (accessed on 9 March 2023).
  64. McGrath, S.; Powell, L.; Alla-Mensah, J.; Hilal, R.; Suart, R. New VET Theories for New Times: The Critical Capabilities Approach to Vocational Education and Training and Its Potential for Theorising a Transformed and Transformational VET. J. Vocat. Educ. Train. 2022, 74, 575–596. [Google Scholar] [CrossRef]
  65. Olufayo, O.; Akinlade, O. Enhancing Sustainable Food Security in Nigeria through Technical and Vocational Education and Training. Edu.ng. Available online: https://fpi3rdinterconf.federalpolyilaro.edu.ng/uploads/new_uploads/4091755.pdf (accessed on 9 March 2023).
  66. Asian Institute of Technology. The Grants Register 2019; Palgrave Macmillan: London, UK, 2019; p. 122. [Google Scholar]
  67. Zulaikha, Z.F.; Hariri, H.; Rini, R.; Sowiyah, S. Analysis of Vocational Education Curriculum in ASEAN Economic Community: A Literature Review. J. Soc. Humanit. Educ. 2021, 1, 157–170. [Google Scholar] [CrossRef]
  68. Iqbal, N.; Khan, M.M.; Mohmand, Y.T.; Mujtaba, B.G. The Impact of In-Service Training and Motivation on Job Performance of Technical & Vocational Education Teachers: Role of Person-Job Fit. Public Organ. Rev. 2020, 20, 529–548. [Google Scholar] [CrossRef]
  69. Wikipedia Contributors. List of Colonial Universities in Hispanic America. Wikipedia, The Free Encyclopedia. Available online: https://en.wikipedia.org/w/index.php?title=List_of_colonial_universities_in_Hispanic_America&oldid=1140377791 (accessed on 9 March 2023).
  70. Arabage, A.; Souza, A.P.; Lima, L.; Camargo, J.; Lucena, T.; Soares, S. Vocational Education and Training in Brazil Knowledge Sharing Forum on Development Experiences: Comparative Experiences of Korea and Latin America and the Caribbean. 2015. Available online: https://publications.iadb.org/bitstream/handle/11319/6996/Vocational_Education_Training_Brazil.pdf (accessed on 9 March 2023).
  71. OECD. Vocational Education and Training in Chile Strengths, Challenges and Policy Options; OECD: Paris, France, 2009; Available online: http://www.oecd.org/education/skills-beyond-school/45164564.pdf (accessed on 9 March 2023).
  72. UNESCO-UNEVOC. Technical and Vocational Education and Training (TVET) Country Profiles. Colombia. 2023. Available online: https://unevoc.unesco.org/wtdb/worldtvetdatabase_col_en.pdf (accessed on 9 March 2023).
  73. UNESCO-UNEVOC. World TVET Database. Mexico. 2015. Available online: https://unevoc.unesco.org/wtdb/worldtvetdatabase_mex_en.pdf (accessed on 9 March 2023).
  74. Clark, B.R. Creating Entrepreneurial Universities: Organizational Pathways to Transformation; Pergamon Press: Oxford, UK, 1998. [Google Scholar]
  75. Clark, B. University Transformation: Primary Pathways to University Autonomy and Achievement. In The Future of the City of Intellect: The Changing American University; Brint, S., Ed.; Stanford University Press: Palo Alto, CA, USA, 2002; pp. 322–342. [Google Scholar]
  76. Clark, B.R. The Organizational Saga in Higher Education. Adm. Sci. Q. 1972, 17, 178–184. [Google Scholar] [CrossRef]
  77. Breen, R.; Müller, W. Education and Intergenerational Social Mobility in Europe and the United States; Stanford University Press: Redwood City, CA, USA, 2020. [Google Scholar]
  78. Jolly, D. Rising Output in Factories Hints at Growth in Europe. The New York Times, 13 August 2013. Available online: https://www.nytimes.com/2013/08/14/business/global/industrial-production-lifts-european-economy.html (accessed on 17 April 2023).
  79. Sumption, M.; Forde, C.; Alberti, G.; Walsh, P.W. How Is the End of Free Movement Affecting the Low-Wage Labour Force in the UK? In The Economics of Brexit: What Have We Learned; CEPR Press: London, UK, 2022. [Google Scholar]
  80. Tsang, M.C. The Cost of Vocational Training. Int. J. Manpow. 1997, 18, 63–89. [Google Scholar] [CrossRef]
  81. Okoye, K.R.E. Private-Public Partnership and Technical Vocational Education and Training (TVET) in a Developing Economy. Arab. J. Bus. Manag. Rev. 2013, 2, 51. [Google Scholar] [CrossRef]
  82. Powers, J.; St. John, E.P. (Eds.) Higher Education, Commercialization, and University-Business Relationships in Comparative Context. Vol. 2, Issues in Globalization and Social Justice; AMS Press: New York, NY, USA, 2017. [Google Scholar]
  83. Fielden, J.; Larocque, N. The Evolving Regulatory Context for Private Education in Emerging Economies; World Bank: Washington, DC, USA, 2008. [Google Scholar]
  84. EIB (European Investment Bank). Central, Eastern and South-Eastern Europe: Building Future Prosperity and Setting the Ground for Sustainable Upward Convergence. 2018. Available online: https://www.eib.org/attachments/efs/innovation_investment_in_cesee_en.pdf (accessed on 17 April 2023).
  85. Sultan, T. How the COVID-19 Pandemic has Changed Supply Chain Practices; World Economic Forum: Cologny, Switzerland, 2022; Available online: https://www.weforum.org/agenda/2022/01/5-ways-the-covid-19-pandemic-has-changed-the-supply-chain/ (accessed on 17 April 2023).
  86. Goldin, C. The u-Shaped Female Labor Force Funcl1on in Economic Development and Economic History; NBER Working Paper Series; NBER: Cambridge, MA, USA, 1994; Available online: https://www.nber.org/system/files/working_papers/w4707/w4707.pdf (accessed on 22 April 2023).
  87. Becker, G.S. Human Capital: A Theoretical and Empirical Analysis with Special Reference to Education, 3rd ed.; University of Chicago Press: Chicago, IL, USA, 1994. [Google Scholar]
  88. McKenzie, D.; Woodruff, C. What Are We Learning from Business Training and Entrepreneurship Evaluations around the Developing World? World Bank Res. Obs. 2014, 29, 48–82. [Google Scholar] [CrossRef]
  89. Benavot, A. The Rise and Decline of Vocational Education. Sociol. Educ. 1983, 56, 63–76. [Google Scholar] [CrossRef]
  90. Meyer, H.-D.; Benavot, A. PISA, Power, and Policy: The Emergence of Global Educational Governance; Symposium Books: Oxford, UK, 2013. [Google Scholar]
  91. Ainsworth, M.; Teokul, W. Breaking the Silence: Setting Realistic Priorities for AIDS Control in Less-Developed Countries. Lancet 2000, 356, 55–60. [Google Scholar] [CrossRef]
  92. Henry, M.; Lingard, B.; Rizvi, F.; Taylor, S. The OECD, Globalization and Education Policy; Pergamon Press: Amsterdam, 2001. [Google Scholar]
  93. Slaughter, S.E.; Rhoades, G. Academic Capitalism and the New Economy: Markets, State, and Higher Education; Johns Hopkins University Press: Baltimore, ML, USA, 2004. [Google Scholar]
  94. Meyer, H.D.; St. John, E.P.; Chankseliani, M.; Uribe, L. The crisis in access to higher education—A crisis of justice. In Fairness in Access to Higher Education in a Global Perspective: Reconciling Excellence, Efficiency, and Justice; Meyer, H.D., St. John, E.P., Chankseliani, M., Uribe, L., Eds.; Sense Publications: Rotterdam, The Netherlands, 2013. [Google Scholar]
  95. Meyer, H.D.; St. John, E.P.; Javala, M.; Kroth, A.J.; Somers, P. Fairness in Access to Higher Education: Towards a Global Public Debate. In Fairness in Access to Higher Education in a Global Perspective: Reconciling Excellence, Efficiency, and Justice; Meyer, H.D., St. John, E.P., Chankseliani, M., Uribe, L., Eds.; Sense Publications: Rotterdam, The Netherlands, 2013. [Google Scholar]
  96. Ba, Y.; Schwaeble, K.; Birkland, T. The United States in Chinese Environmental Policy Narratives: Is There a Trump Effect? Rev. Policy Res. 2022, 39, 708–729. [Google Scholar] [CrossRef]
  97. Baltagi, B.H.; Kao, C.; Peng, B. Testing Cross-Sectional Correlation in Large Panel Data Models with Serial Correlation. Econometrics 2016, 4, 44. [Google Scholar] [CrossRef]
  98. Hendrick, R.Z.; Hightower, W.H.; Gregory, D.E. State Funding Limitations and Community College Open Door Policy: Conflicting Priorities? Community Coll. J. Res. Pract. 2006, 30, 627–640. [Google Scholar] [CrossRef]
  99. OECD. How Much is Spent per Student on Educational Institutions? In Education at a Glance 2019: OECD Indicator C1; OECD iLibrary: Paris, France, 2019; Available online: https://www.oecd-ilibrary.org/docserver/0fdcbb3b-en.pdf?expires=1683724747&id=id&accname=guest&checksum=A50670882C740035D222BD87759AC0C9 (accessed on 8 May 2023).
  100. Barr, A.; Turner, S.E. Expanding Enrollments and Contracting State Budgets: The Effect of the Great Recession on Higher Education. ANNALS Am. Acad. Political Soc. Sci. 2013, 650, 168–193. [Google Scholar] [CrossRef]
  101. Chankseliani, M. Charting the Development of Knowledge on Soviet and Post-Soviet Education through the Pages of Comparative and International Education Journals. Comp. Educ. 2017, 53, 265–283. [Google Scholar] [CrossRef]
  102. Round, J.; Rodgers, P. The Problems of Corruption in Post-Soviet Ukraine’s Higher Education Sector. Int. J. Sociol. 2009, 39, 80–95. [Google Scholar] [CrossRef]
  103. Vidal-Rodriguea, A. The Impact of Adopting a Community College Baccalaureate Policy on States’ Graduation Rate and Enrollment; Consideration for All and Latino Students. Ph.D. Dissertation, University of Michigan, Ann Arbor, MI, USA, 2019. [Google Scholar]
  104. Rodríguez, J.P. The Politics of Neoliberalism in Latin America: Dynamics of Resilience and Contestation. Sociol. Compass 2021, 15, e12854. [Google Scholar] [CrossRef]
Figure 1. GDP Per Capita (in Constant 2015 US$) by countries’ development status.
Education 13 00573 g001
Figure 2. Manufacturing output (in billions, Constant 2015 USD) by countries’ development status.
Education 13 00573 g002
Figure 3. Total enrollment (headcount) in short-cycle tertiary programs (ISCED 5) by countries’ development status.
Education 13 00573 g003
Figure 4. Total enrollment in short-cycle tertiary programs (ISCED 5) as a percentage of total enrollment in tertiary education by countries’ development status.
Education 13 00573 g004
Figure 5. Government Expenditure on Tertiary Education as Percent of Government Expenditure on Education by countries’ development status.
Education 13 00573 g005
Figure 6. Public Expenditure per Secondary School Student as Percent of GDP Per Capita by countries’ development status.
Education 13 00573 g006
Figure 7. Tertiary Technical/Vocational Enrollment as Percent of Total Secondary Enrollment by countries’ development status.
Education 13 00573 g007
Table 1. Developing and Less-developed Countries By Region in 2018 (n = 67): Nations and A Chinese Administrative Regions Providing Sufficient Data on Education Finance, Economic Development, Education System Development, and Population.
Developed (25)Less-Developed (42)
Africa (17)--Burkina Faso, Burundi, Cabo Verde, Cameroon, Cote d’Ivoire, Ghana, Guinea, Kenya, Lesotho, Mali, Mauritania, Mauritius, Niger, Rwanda, Senegal, Seychelles, South Africa
Asia (9)--Bangladesh, Hong Kong Special Admin Region of China, Indonesia, Islamic Republic of Iran, Israel, Lao People’s Democratic Republic, Malaysia, Pakistan, Sri Lanka.
Europe (28)Austria *, Bulgaria *, Cyprus *, Czech Republic *, Denmark *, Finland *, Germany *, Hungary *, Iceland, Ireland *, Italy *, Latvia *, Lithuania *, Luxembourg *, Malta *, Norway, Poland *, Romania *, Slovak Republic *, Slovenia *, Spain *, Sweden *, Switzerland, United KingdomAlbania, Malta, Republic of Moldova, Ukraine
Latin America (12)--Belize, El Salvador, Mexico, Panama, Brazil, Chile, Colombia, Costa Rica, Guyana, Paraguay, Peru, Uruguay
Oceania (1)New Zealand
Breakdown of developed and less-developed countries was prepared by the United Nations (UN/DESA). Retrieved from https://www.un.org/development/desa/dpad/wp-content/uploads/sites/45/WESP2019_BOOK-ANNEX-en.pdf (accessed on 10 March 2023). (*) European Union Nation. Retrieved from: https://www.google.com/search?client=safari&rls=en&q=is+finland+in+thr+Ru%3F&ie=UTF-8&oe=UTF- (accessed on 10 March 2023).
Table 2. Fixed-effects Models of Regressions on Lower-Level Tertiary Vocational Enrollment (n = 681, 67 Countries).
Enrollment (Headcount) in Tertiary Vocational Education (Log)Enrollment in Tertiary Vocational Education as % of Total Tertiary Enrollment
Model 1
(Without Interaction Effects)
Model 2
(With Interaction Effects)
Model 3
(Without Interaction Effects)
Model 4
(With Interaction Effects)
Education Finance
Expenditure on Tertiary Education (% of Gov. Expenditure on Education)
0.0477 *
(0.020)
0.0742 **
(0.024)
0.534 *
(0.221)
0.973 ***
(0.279)
Public Expenditure per Primary School Student as % of GDP Per Capita−0.005
(0.024)
0.009
(0.025)
−0.721
(0.488)
−0.608
(0.394)
Public Expenditure per Secondary School Student as % of GDP Per Capita0.015
(0.011)
0.0298 **
(0.010)
0.178
(0.244)
0.504 *
(0.233)
Public expenditure per Tertiary Student as % of GDP Per Capita−0.00455 **
(0.002)
−0.00555 **
(0.002)
−0.0567 *
(0.025)
−0.0711 **
(0.025)
Public spending on education (% of GDP)−0.027
(0.117)
−0.043
(0.105)
2.388
(1.479)
2.156
(1.412)
Economy
Manufacturing output (in Constant 2015 USD, Log)
−0.180
(0.536)
0.577
(0.608)
12.630
(9.428)
17.830
(11.710)
GDP Per Capita (in Constant 2015 USD, Log)1.813
(1.099)
2.057
(1.240)
8.226
(13.530)
−0.245
(25.360)
Educational System
Gross Primary Enrollment Ratio
0.026
(0.015)
0.0295 *
(0.014)
−0.211
(0.236)
−0.210
(0.211)
Gross Secondary Enrollment Ratio−0.015
(0.014)
−0.017
(0.014)
−0.013
(0.140)
−0.033
(0.122)
% Tech/Vocational in Secondary Enrollment2.945
(2.021)
6.479 **
(2.276)
35.01 *
(15.240)
42.220
(26.610)
% Female in Secondary Vocational Education0.018
(0.016)
0.017
(0.015)
0.035
(0.226)
0.031
(0.208)
Gross Tertiary Enrollment Ratio (Lag)−0.013
(0.014)
−0.014
(0.014)
−0.243
(0.154)
−0.309 *
(0.154)
Gender Parity Index for Primary Enrollment−0.0920 *
(0.044)
−0.101 **
(0.036)
−0.867
(0.639)
−0.964
(0.618)
Gender Parity Index for Secondary Enrollment0.010
(0.021)
0.011
(0.019)
−0.113
(0.251)
−0.080
(0.238)
Gender Parity Index for Tertiary Enrollment (Lag)−0.012
(0.007)
−0.010
(0.007)
−0.196
(0.105)
−0.172
(0.093)
Population
% 65 years and older
0.328
(2.172)
−0.939
(2.106)
−15.440
(25.990)
−10.810
(24.640)
% Female 16.460
(18.480)
9.851
(16.940)
−205.900
(445.400)
−196.800
(462.100)
Total Population (Log)3.948 *
(1.945)
1.634
(1.681)
−13.670
(23.390)
−1.014
(35.170)
Interaction Effects
Development * Manufacturing
−1.603
(0.982)
−14.400
(15.890)
Development * GDP Per Capita 0.154
(1.667)
32.410
(32.470)
Development * Tertiary Expenditure as % of Gov. Exp. −0.060
(0.053)
−0.994 **
(0.347)
Development * Secondary Expenditure −0.0430 *
(0.021)
−0.778 *
(0.330)
Development * % of Secondary Vocational −6.089 *
(2.764)
−18.820
(29.020)
Note: All standard errors are adjusted for institutional clusters for panel data and reported in parentheses. *** p < 0.001, ** p < 0.01, * p < 0.05.
Disclaimer/Publisher’s Note: The statements, opinions and data contained in all publications are solely those of the individual author(s) and contributor(s) and not of MDPI and/or the editor(s). MDPI and/or the editor(s) disclaim responsibility for any injury to people or property resulting from any ideas, methods, instructions or products referred to in the content.

