Article

Teaching and Learning during a Global Pandemic: Perspectives from Elementary School Teachers and Parents

1
Department of Psychology, University of Maryland, Baltimore County, Baltimore, MD 21250, USA
2
Sherman Center for Early Learning in Urban Communities, University of Maryland, Baltimore County, Baltimore, MD 21250, USA
*
Author to whom correspondence should be addressed.
Educ. Sci. 2023, 13(4), 426; https://doi.org/10.3390/educsci13040426
Submission received: 27 January 2023 / Revised: 7 April 2023 / Accepted: 12 April 2023 / Published: 21 April 2023
(This article belongs to the Special Issue The Psychological and Educational Effects of COVID-19: Now and Then)

Abstract

:
COVID-19 has had a major impact on education, with many children attending school online for more than a year. To understand the implications of online learning for U.S. teachers (Study 1; N = 49) and families (Study 2; N = 189) of elementary school students, we administered a survey in spring 2021, about one year into the pandemic. Participants answered questions about the instructional modality and format, challenges managing instruction, and children’s attention and learning. Comparing virtual to in-person instruction (pre-COVID-19) showed: (1) teachers reported the quantity of virtual instruction was less than in-person instruction and children were more off-task; (2) parents reported greater stress managing virtual instruction with fewer than half the children completing online lessons independently; and (3) parents reported that children exhibited mild-frustration during both virtual and in-person instruction, but children enjoyed learning in-person more. Understanding teachers’ and families’ experiences with virtual instruction will help elucidate potential factors contributing to pandemic-related learning losses, enabling more targeted support.

1. Introduction

COVID-19 is a respiratory illness that has resulted in a global pandemic with a death toll of over six million [1]. Here, we focus on the educational effects due to the unprecedented disruption to children’s education. During spring 2020, an estimated 55.1 million U.S. children experienced suspension of in-person classes [2] and 93% of households reported engaging in distance learning [3]. Researchers expressed concern that children would lose cognitive and social learning opportunities due to school closures [4,5,6]. Studies are now confirming significant learning losses. For example, during distance learning, primary students in the Netherlands made little to no learning gains in math, reading, and spelling, and effects were heightened for children from homes with lower education levels [7]. In a study of 5.4 million U.S. children, Kuhfeld and colleagues [8] found that both reading and math scores were lower in fall 2021 than they were pre-pandemic for same grade-level peers and reductions were larger than those attributed to other large-scale disruptions (e.g., Hurricane Katrina). Disparities were exacerbated, as achievement gaps between low- and high-poverty schools widened. The National Association of Educational Progress [9] also documented drops in reading and math achievement for U.S. nine-year-olds [10].
These findings raise important questions as to what challenges teachers and families faced when engaging in distance learning. Here, we consider the nature of children’s virtual instruction from teachers’ and parents’ viewpoints.

1.1. Theoretical Framework

Our work is influenced by Bronfenbrenner’s bioecological model [11] which discusses different contexts or microsystems people inhabit, (e.g., home, school), and the relations between them (i.e., mesosystem). Harmonious relations between the home and school microsystems are posited to foster better developmental outcomes [11]. Societal influences, known as macrosytems, also play a role. Macro-level crises can have long-lasting effects on children’s academic development and trajectories [5,12,13]. For example, the pandemic effects the schooling children receive, as well as stressors families experience, which, in turn, impacts interactions between parents, teachers, and children. Teachers and families are likely facing numerous pandemic-related stressors (e.g., job loss, illness, financial difficulties, lack of childcare) that may interfere with their availability to successfully support children’s distance learning [14,15,16,17].

1.2. Distance Learning

We know little about the virtual instructional context including the processes involved, the content of instruction, how well children paid attention, or what teachers and parents did to facilitate children’s attention regulation [18]. Additionally, we have limited information about the challenges teachers and families experienced while navigating virtual instruction. To better understand the impact, we need to hear from all stakeholders. Below, we summarize key findings from this limited literature.

1.2.1. Teachers

Findings from two recent studies surveying early childhood educators suggest that teachers generally felt ill-prepared to provide developmentally appropriate remote instruction [17,18]. Teachers noted low levels of child and parent participation [18], a concern particularly for younger children who may need a greater amount of support to successfully engage in distance learning [17]. On the other hand, Panaoura [19] found that parents in Cyprus were willing, based on their responses to a questionnaire given before and after school closures due to COVID-19, to adapt how they assisted their children in what were changing environments. Parent literacy-levels and English language skills were also noted by teachers as obstacles for some parents to successfully assist their children with distance learning [17]. Finally, teachers reported facing personal stressors such as salary loss and childcare issues [17]. Similar challenges were noted by Reich and colleagues [20] who reported that teachers expressed difficulty motivating their students. Teachers also reported feeling ineffectual to perform their job and believed the negative impact of distance learning was greater for children from marginalized backgrounds.

1.2.2. Parents

Much of the prior research investigating parental involvement is based on parents of preschoolers [21] (cf., 6). Less is known about how parents of older children are coping and managing their children’s education during the pandemic. Nevertheless, the existing literature highlights important parental concerns. For example, although preschool parents recognized the difficulties that teachers faced switching to distance learning, they were unsatisfied with the instruction children received [21]. Parents felt children received insufficient instruction to foster their social development and they noted their children received more instruction in language arts than mathematics. The extent to which these findings generalize to different grade-levels is an open question.
Importantly, much of the published research comes from the beginning of the pandemic when teachers, parents, and children were adapting to distance learning. It is possible that behaviors and attitudes changed with increasing familiarity. Alternatively, as the pandemic waged on and parents experienced burnout [22], parents may have found it increasingly difficult to maintain instructional support during distance learning while concurrently managing work demands and/or family responsibilities. More research is needed to explicate the evolution of parent and child attitudes and behaviors over the course of the pandemic.

1.2.3. Children

Although parents reported dissatisfaction with what and how much their children were learning [17,21], there is limited information about how children themselves view distance learning. One exception is a study by Kirsch and colleagues [23]. They interviewed 1751 primary and secondary students from more affluent families in Europe. There was significant variability within and between countries in how much time students spent on distance learning and overall satisfaction. Students were generally motivated to learn but felt teachers did not spend enough time with them. Students were generally less satisfied with virtual instruction compared to in-person instruction, and they believed they learned less.

1.3. Current Study

This exploratory study addresses four important questions: (1) What does the virtual learning context look like? (2) What are the challenges experienced by teachers and families? (3) How much do children reportedly enjoy virtual learning? (4) How much are children reportedly learning? Questions 1 and 2 are based on teacher and parent responses. Questions 3 and 4 are based on parent responses.

2. General Method

Due to similarities across studies, we describe the general method here. Elementary teachers (Study 1) and parents (Study 2) were invited to complete an online survey. The survey was administered in spring 2021, about one year after the pandemic began in the U.S., and when most schools were continuing to suspend in-person instruction. The survey asked about different aspects of virtual learning such as the modality and format employed, instructional design choices, and participants’ perspective on the challenges faced. The survey also asked about children’s attention allocation patterns during instruction, perceived frustration and enjoyment levels, academic growth, as well as teacher and parent self-reported stress-levels. Questions based on these themes were asked about in-person learning pre-pandemic for comparison. The survey consisted of multiple-choice items, rankings, Likert scales, and open-ended questions. Participants could skip individual items; consequently, sample size per item is variable.
Elementary (K-5) teachers and parents residing in the U.S., 18 years of age or older, were eligible to participate. Participants who did not meet the inclusion criteria or who failed to meet the minimum survey progression (25%) were excluded (details below). The survey link was posted on teacher/parent groups and sites and distributed via snowball sampling. Participants first read the online consent form and then indicated their agreement to participate electronically. Participants could choose to enter a raffle for a $25 gift card. This work was approved by the University of Maryland, Baltimore County Institutional Review Board (IRB #528).

3. Study 1 Method

3.1. Participants

Seventy-three teachers participated, although 24 teachers were excluded from the analysis (2 did not meet inclusion criteria; 22 did not meet minimum survey progression). The final sample included 49 teachers who primarily self-identified as female (71%); see Appendix A for demographic details.
Teachers taught in seven different states and Washington, D.C. Most (86%) taught in public schools. Teachers from six grade-levels (K-5), related arts (Art/Music/Physical Education), ESL, and special education participated. Most teachers (76%) had taught for five years or more and 55% had an advanced degree. Teachers generally reported that their class was diverse; on average, 59% (SD = 39%) of their students were students of color. Forty-three percent of teachers reported that their school was classified as Title 1, a federal program serving high-poverty schools.

3.2. Measure

The 45-item survey asked about teachers’ instructional design choices during the pandemic and during in-person instruction pre-pandemic. Questions focused on the instructional modality (e.g., synchronous, asynchronous, hybrid, in-person) and format employed (e.g., whole class, small-group, individual), rationale for their instructional design choices, and lesson duration. Teachers also provided information about students’ access to technology and students’ learning location(s). Additionally, teachers reported on challenges they faced managing virtual instruction, including estimates of student off-task behavior, frequency of various types of off-task behavior, and attention management strategies deployed. Teachers reported their stress-level and were invited to identify changes to improve virtual instruction. Teachers also provided information about their student population, school context, and demographic information.

4. Study 1 Results

4.1. What Does the Virtual Learning Context Look like and How Does It Compare to Pre-COVID-19?

This question was largely exploratory and as such, we did not have a priori hypotheses beyond that we anticipated teachers would report using both synchronous and asynchronous instructional modalities and that the duration of online instruction would be shorter than the duration of in-person instruction pre-pandemic. Additionally, we predicted that whole-class instruction would be the most common instructional format regardless of instructional modality.

4.1.1. Instructional Modality

Approximately half (49%) the teachers reported delivering virtual instruction during fall 2020, when COVID-19 had been at pandemic levels for about six months. Of those delivering virtual instruction, the majority (67%) reported utilizing both synchronous and asynchronous instruction. By spring 2021, the percentage of teachers delivering only virtual instruction dropped to 33% with the majority (63%) continuing to deliver instruction via both synchronous and asynchronous lessons. Although teachers utilized both modalities, teachers spent the majority of their time each week engaged in synchronous instruction. During a typical school week, teachers estimated spending on average 75% (SD = 28%) of their time engaged in synchronous instruction. Most teachers reported synchronous instruction was the primary instructional mode for Math (85%), English (93%), and Science (76%).
Several factors informed teachers’ decisions as to which content areas were administered synchronously. Teachers frequently indicated that this decision was determined by school leadership/district (56%), but other factors were noted including: consideration of content areas where students were anticipated to require additional assistance (35%), content emphasized by the district (31%) or that was part of the school’s mission (17%), difficult content for parents to assist with asynchronously (17%), content covered on standardized tests (15%), among other reasons (13%). Note, the sum exceeds 100% as teachers could select multiple responses.

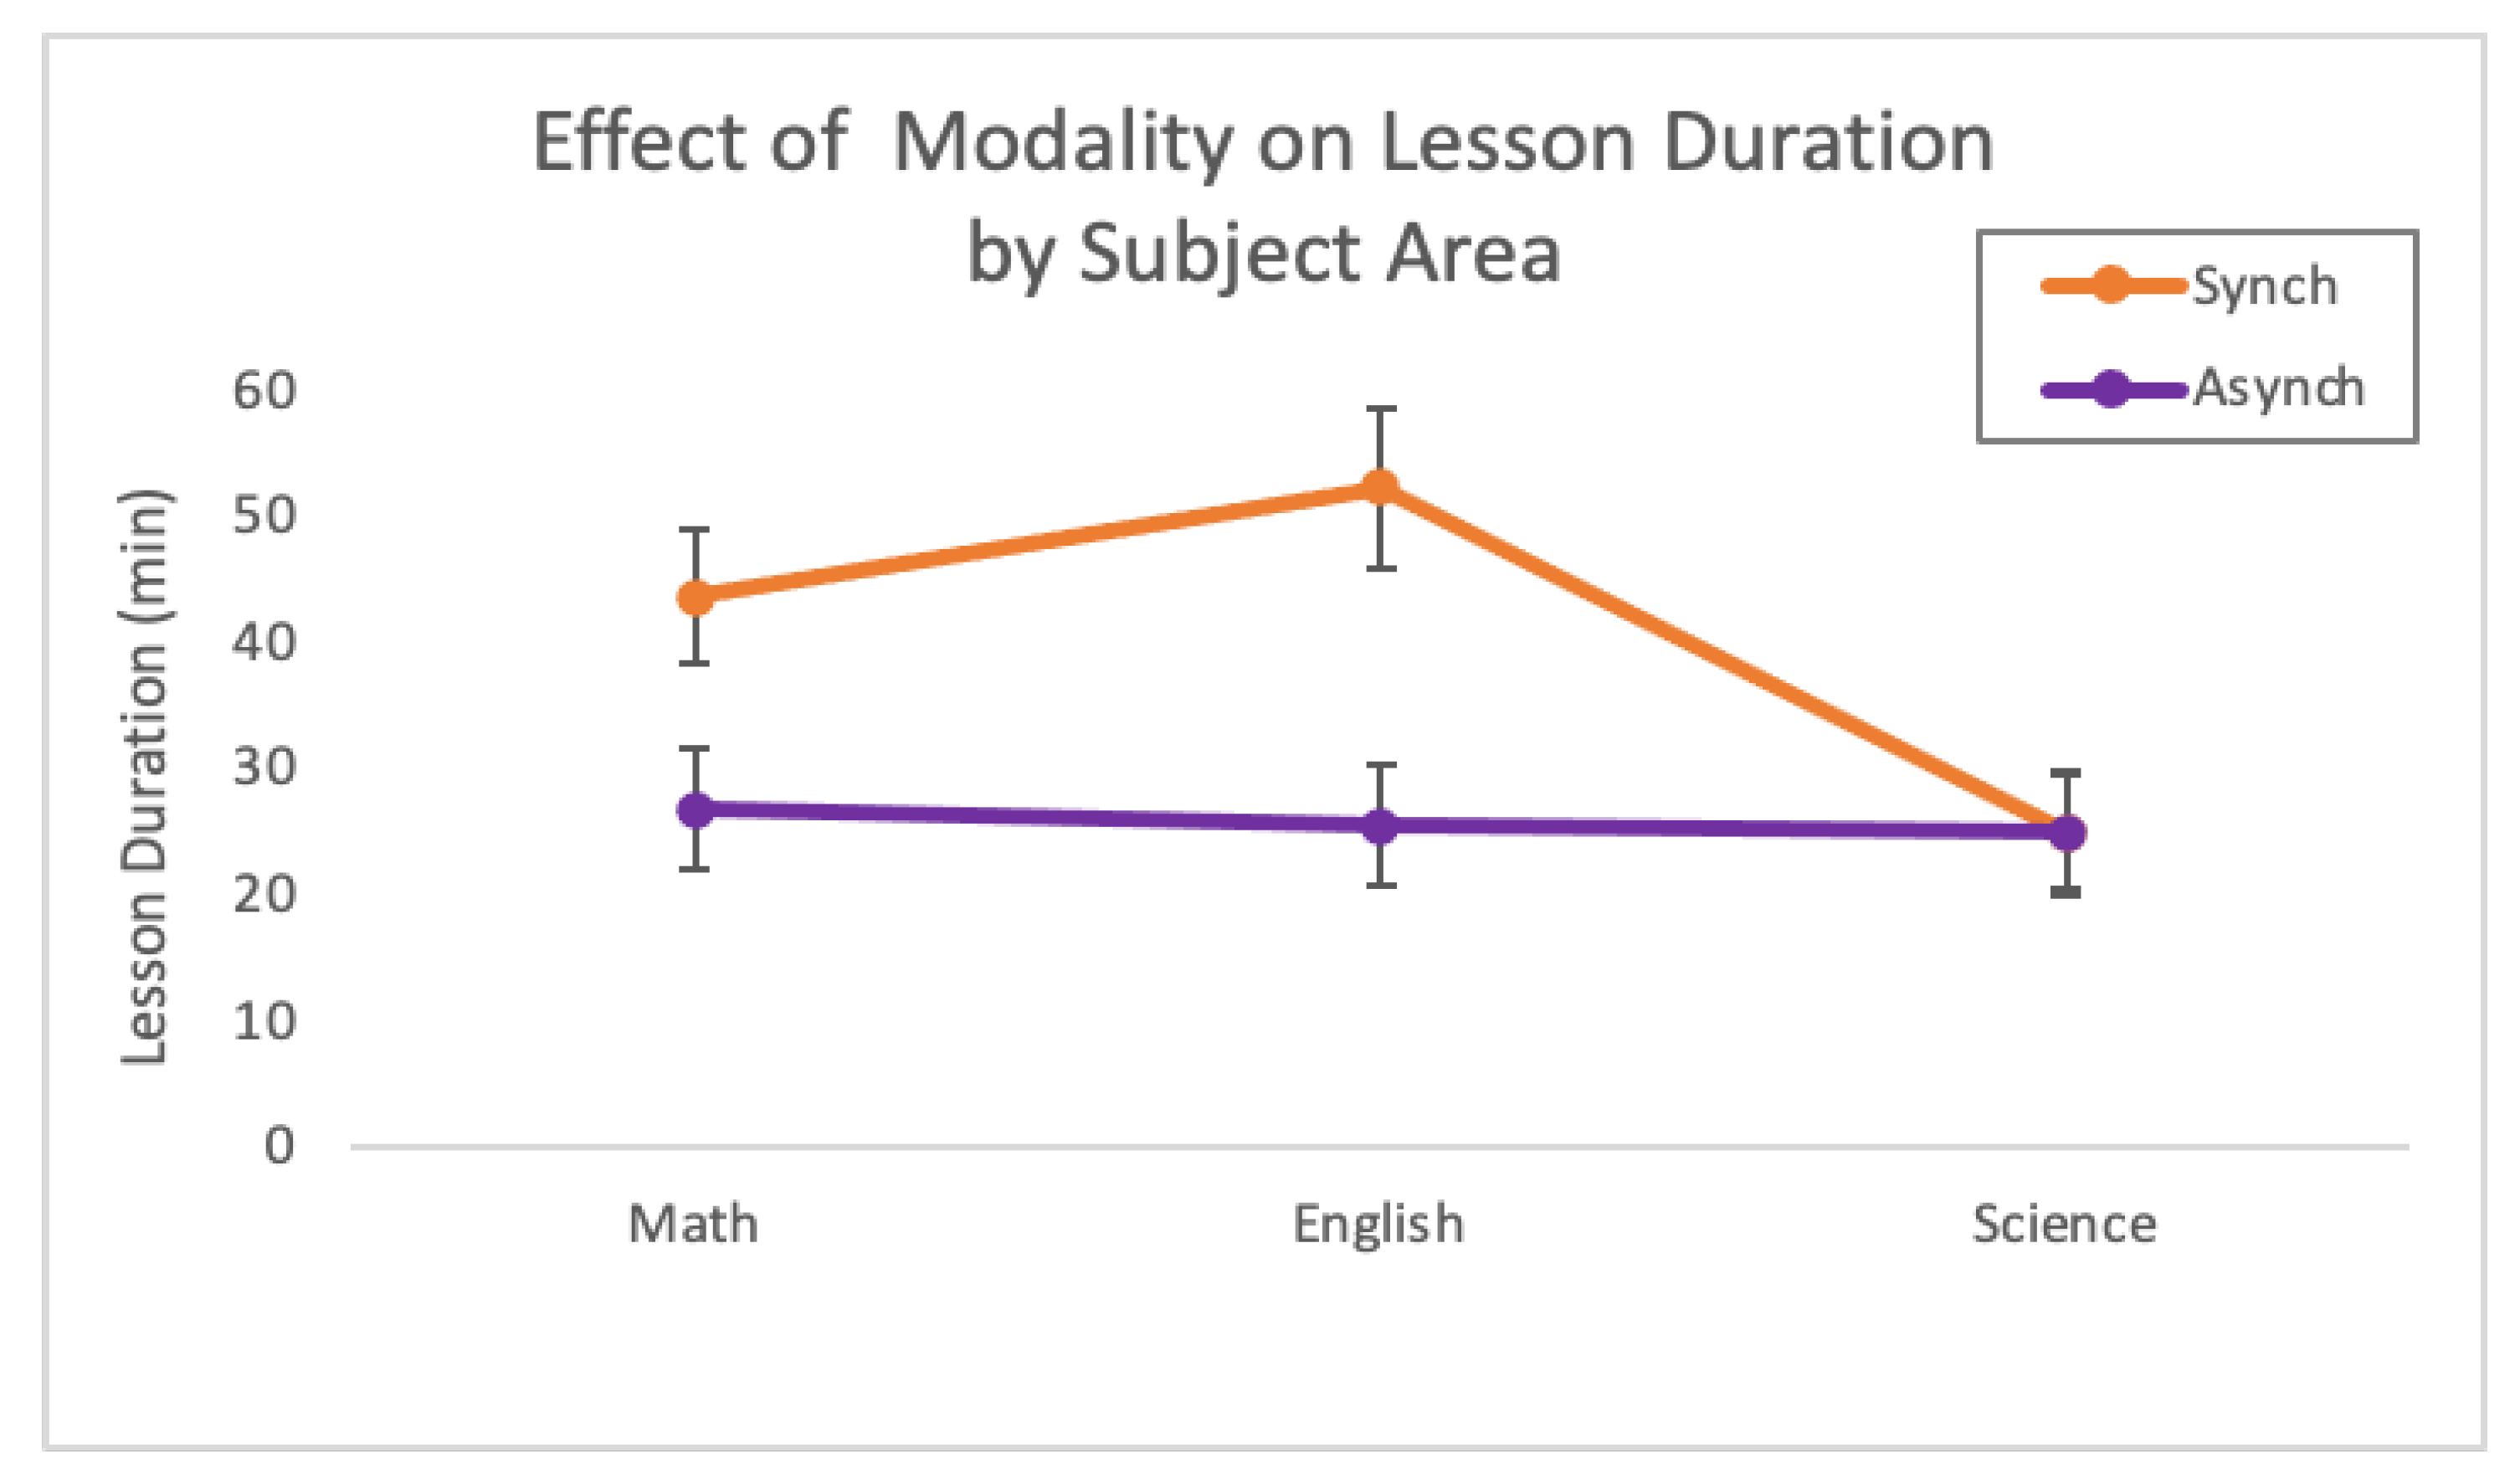
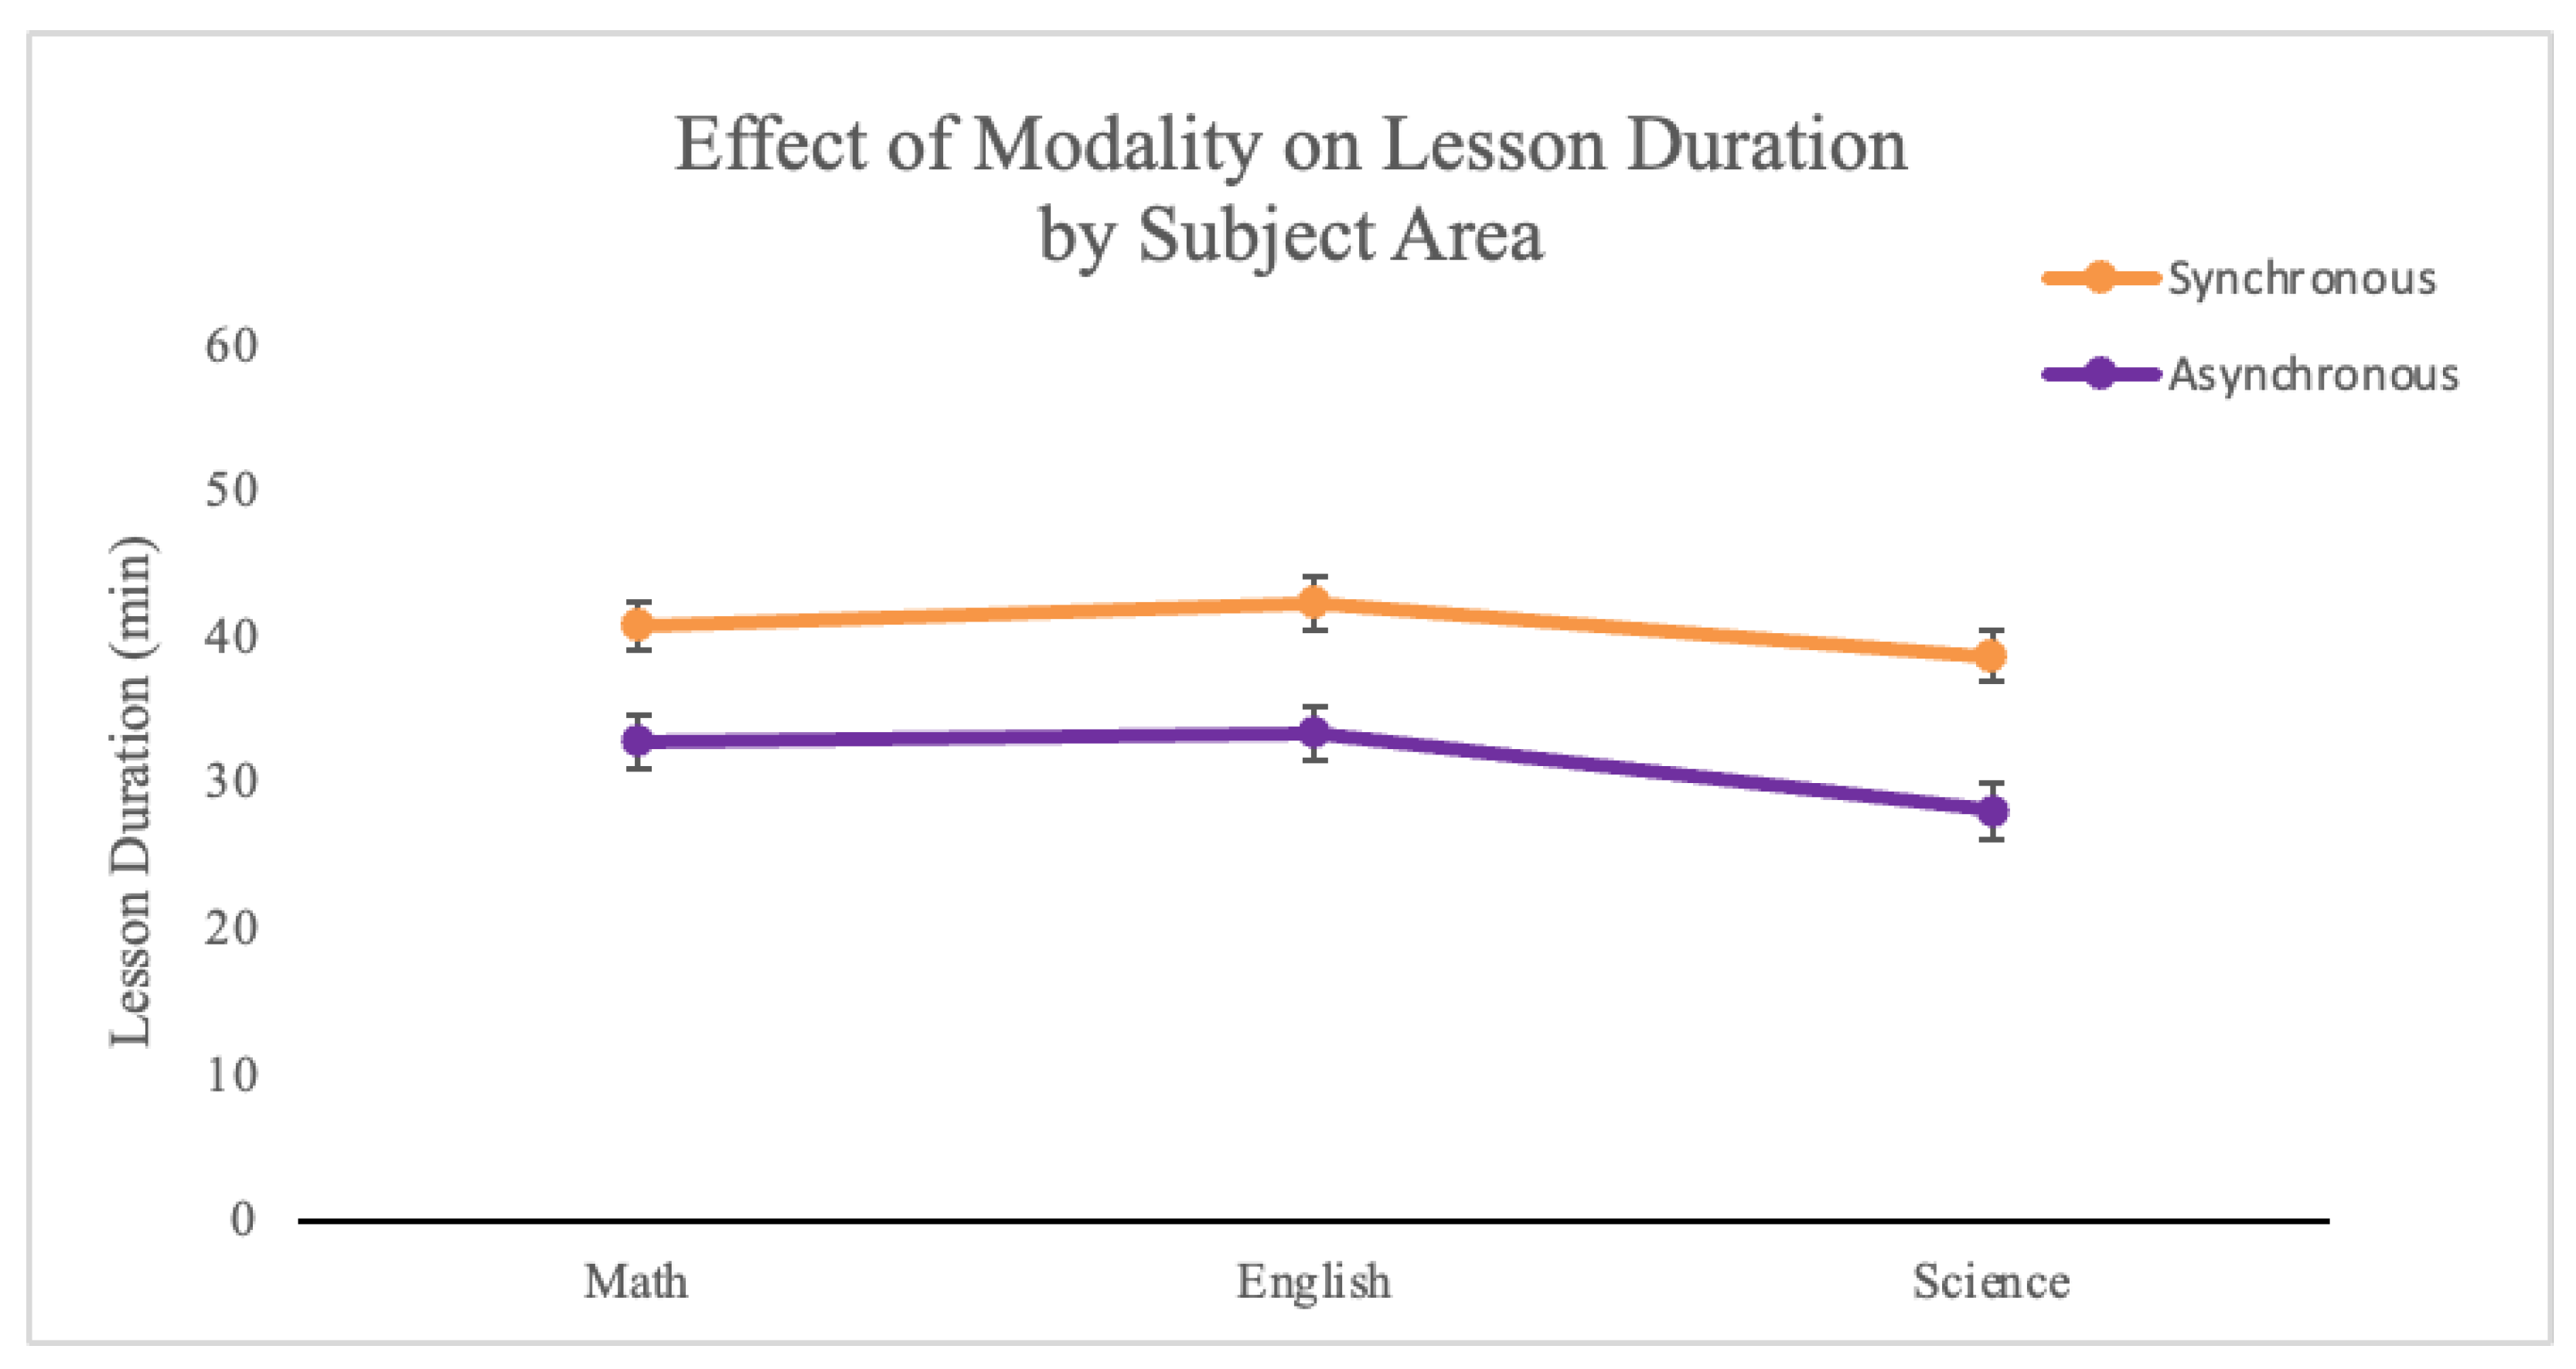
4.1.2. Lesson Duration

Teachers estimated the average duration of a typical synchronous and asynchronous lesson for each core subject. We examined the effect of modality and subject area on lesson duration using a 2 × 3 repeated measure ANOVA with modality (synchronous vs. asynchronous) and subject area (Math, English, Science) as within-subject factors. The assumption of sphericity was violated for the main effect of subject area and the interaction; a Greenhouse-Geisser correction was applied for these effects. There was a significant effect of modality (F(1, 15) = 8.71, p = 0.01, partial η2 = 0.37) and subject area (F(1.27, 19.07) = 7.79, p = 0.01, partial η2 = 0.34), as well as a significant interaction (F(1.42, 21.32) = 5.60, p = 0.02, partial η2 = 0.27); see Figure 1.
Pairwise comparisons indicate that the duration of a synchronous lesson (M = 40.27 min, SE = 4.43) was generally longer than an asynchronous lesson (M = 25.71 min, SE = 3.78); p = 0.01. This effect was driven by the longer duration of both synchronous math (M = 43.63, SE = 5.42) and English (M = 52.25, SE = 6.34) instruction compared to asynchronous math (M = 26.75, SE = 4.82) and English instruction (M = 25.44, SE = 4.80; both ps ≤ 0.016). In contrast, there was no significant difference in the duration of science lessons across virtual modalities (M = 24.94, SE = 4.60 vs. M = 24.94, SE = 4.93; p = 1.00). Within the synchronous modality, both math and English lessons were significantly longer than science lessons (both ps ≤ 0.007) and there was no significant difference in the duration of math and English lessons (p = 0.06). In contrast, for asynchronous instruction, there was no significant difference in lesson duration by subject area (ps ≥ 0.19).
Lesson Duration: Comparison to In-person Instruction Pre-Pandemic. Next, we compared teachers’ estimates of lesson duration for virtual instruction to in-person instruction pre-pandemic. A 2 × 3 Repeated Measure ANOVA with modality (In-person pre-pandemic vs. Synchronous pandemic) and subject area (Math, English, Science) as within-subject factors revealed a main effect of modality (F(1, 16) = 8.29, p = 0.01 partial η2 = 0.34) and subject area (F(2, 32) = 33.01 p < 0.001, partial η2 = 0.674), but no significant interaction (F(2, 32) = 25.60, p = 0.17).
In line with our hypothesis, pairwise comparisons indicated that lesson duration was significantly longer during in-person instruction (M = 57.37, SE = 3.63) compared to synchronous instruction (M = 45.53, SE = 5.13; p = 0.01). Across modalities, math (M = 55.85, SE = 5.10) and English (M = 67.62, SE = 5.38) lessons were longer than a typical science lesson (M = 30.88, SE = 3.58; both ps < 0.001) and English lessons were estimated to be longer than math lessons (p = 0.002).

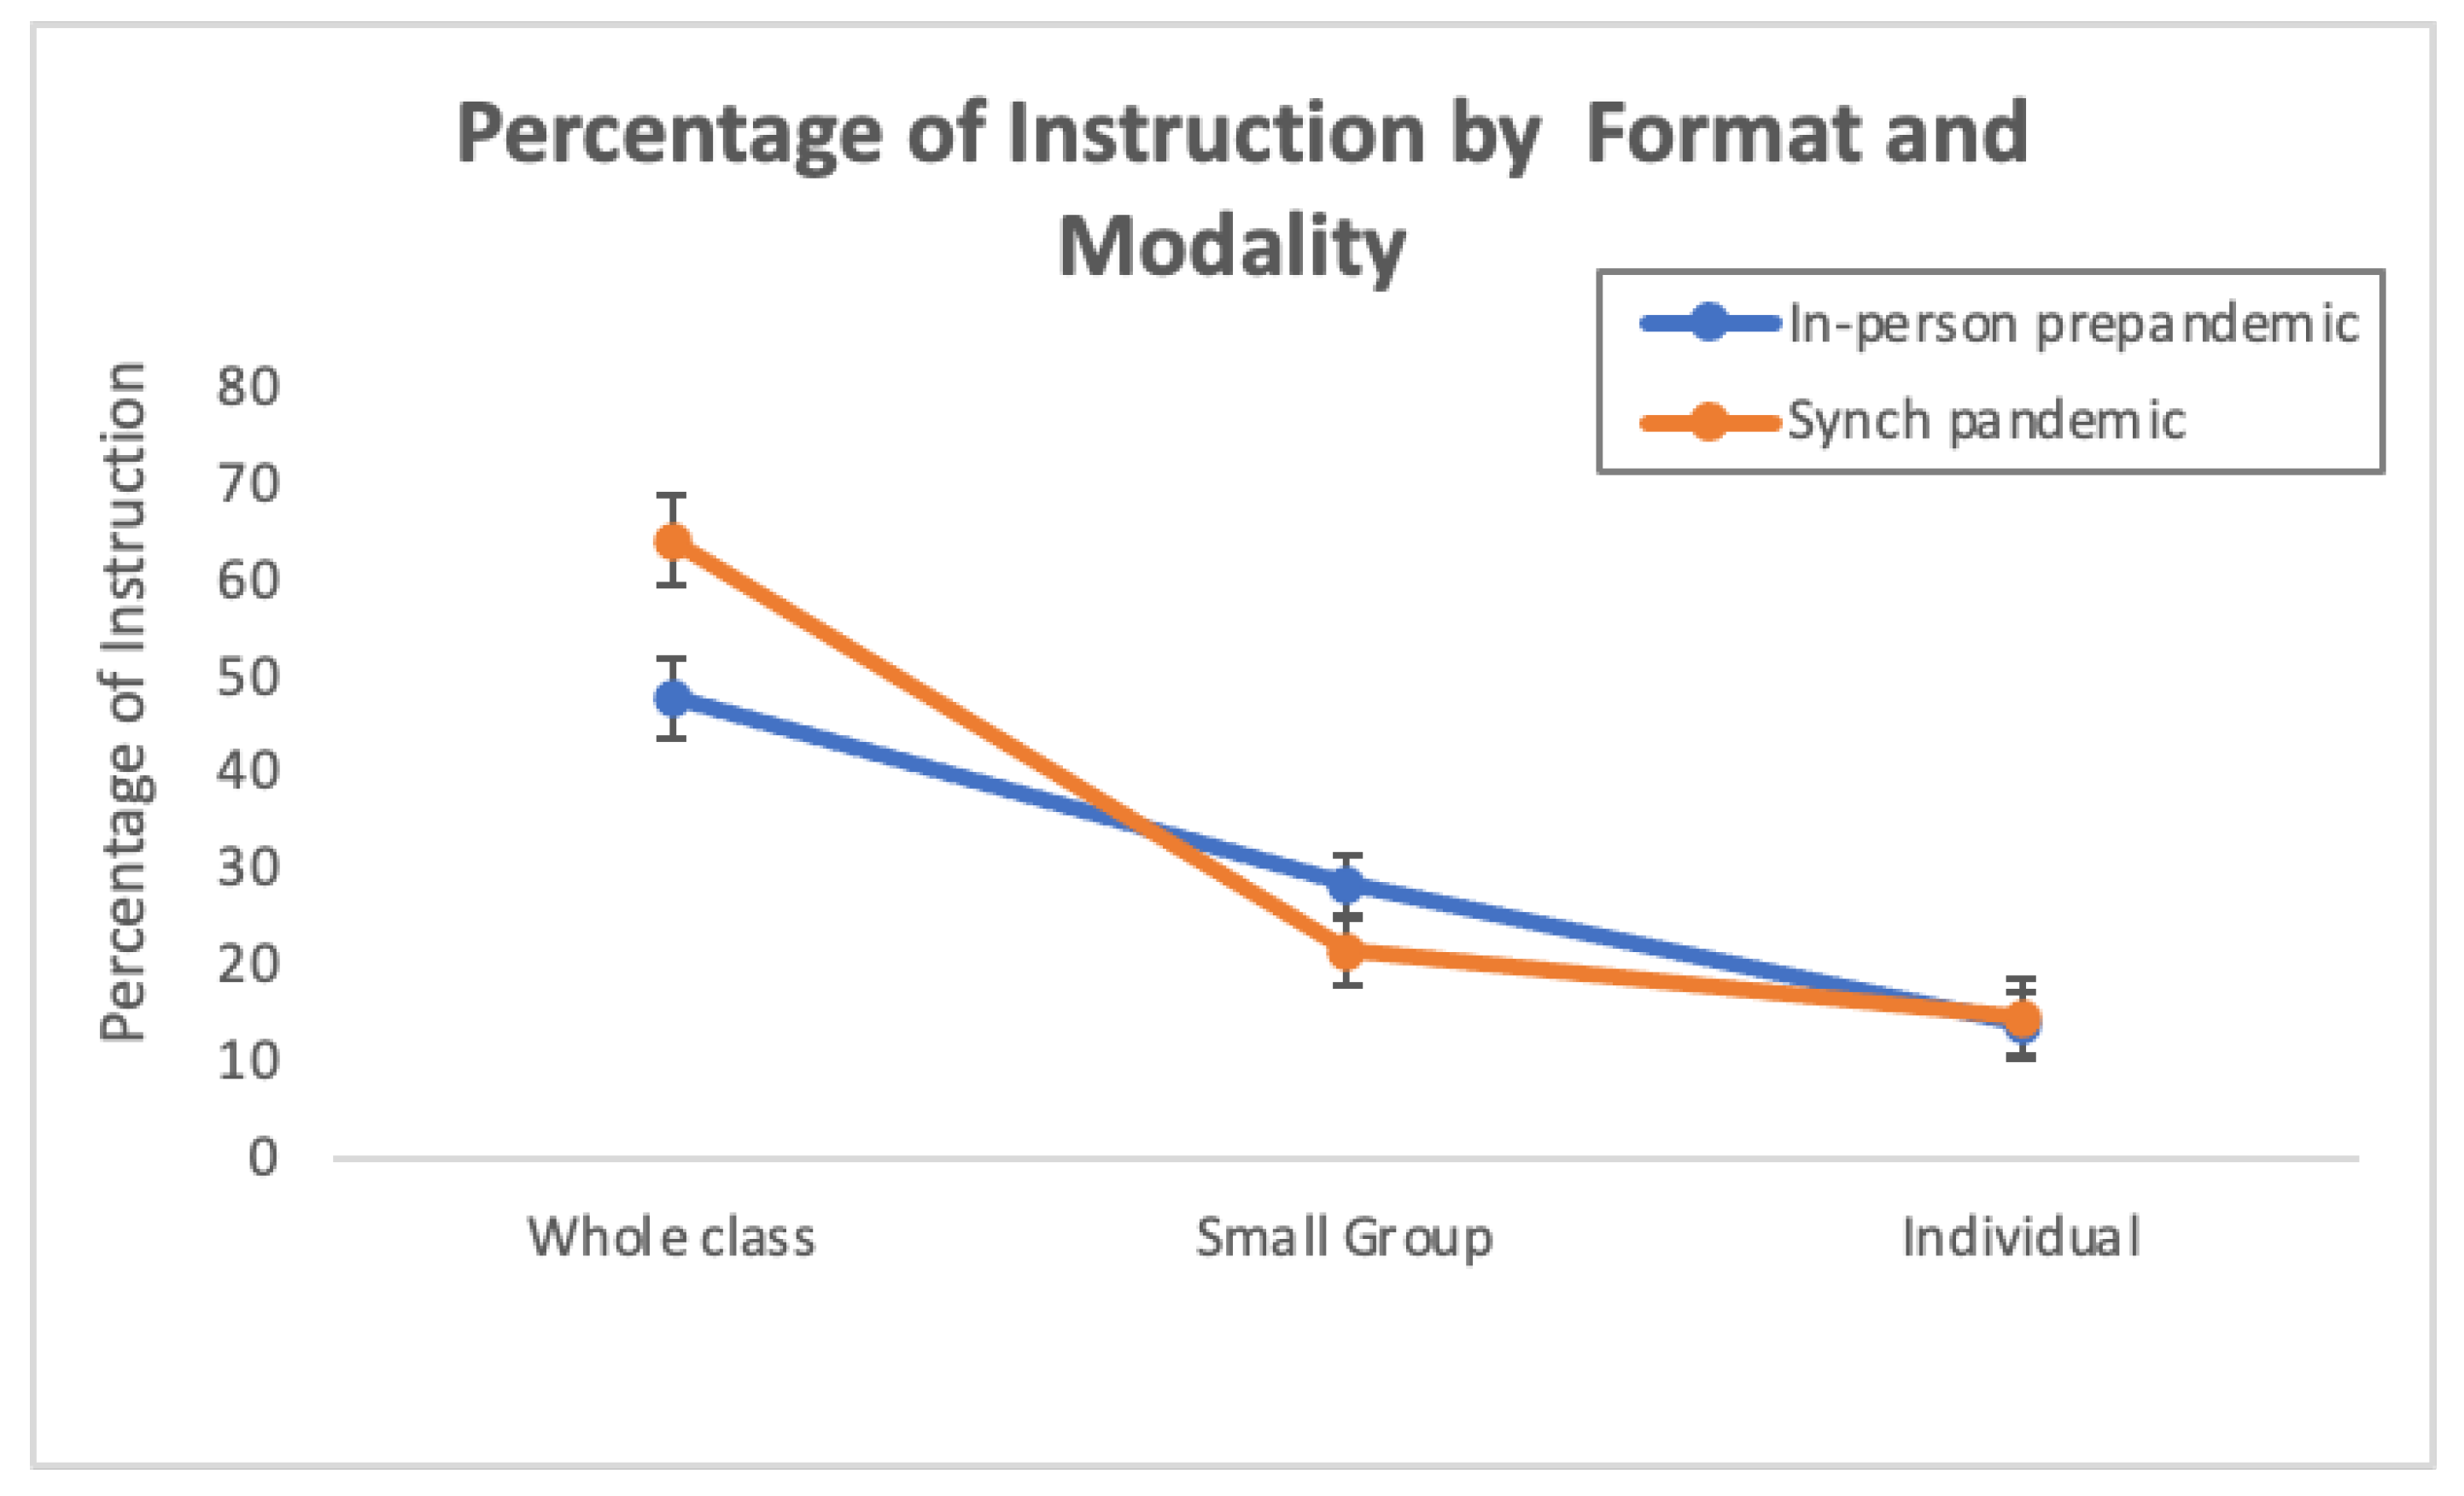
4.1.3. Percentage of Instruction by Format

Teachers estimated the percentage of instruction occurring in each format during both in-person and synchronous instruction. To investigate the effect of modality and format on the allocation of instruction, we conducted a 2 × 3 repeated measure ANOVA with modality (in-person pre-pandemic vs. synchronous pandemic) and format (Whole-class, Small-group, Individual) as within-subject factors. The assumption of sphericity was violated for the interaction; thus, a Huyn–Feldt correction was applied to the interaction. The analysis revealed significant effects of modality (F(1, 43) = 5.09, p = 0.03, partial η2 = 0.11) and format (F(2, 86) = 26.76, p < 0.001, partial η2 = 0.38) as well as a significant interaction between modality and format (F(1.79, 76.76) = 11.37, p < 0.001, partial η2 = 0.21); see Figure 2.
Pairwise comparisons largely supported our hypothesis and indicated that during synchronous instruction, a greater percentage of instruction was spent in the whole-class format (M = 64.02%, SE = 4.66%) than in small-groups (M = 21.50%, SE = 3.47%) or individual formats (M = 14.48%, SE = 4.12%; both ps < 0.001). There was no difference in the percentage of instruction occurring in small-groups or individual formats (p = 0.25). During in-person instruction pre-pandemic, teachers also favored whole-class instruction, again reporting a greater percentage of time spent in the whole-class format (M = 47.66%, SE = 4.30%) compared to small-groups (M = 28.41%, SE = 3.14%) or individual formats (M = 13.93%, SE = 3.13%; both ps ≤ 0.002). Additionally, a greater percentage of instruction occurred in small-groups compared to individual formats (p = 0.004).
Despite the relative similarity in the general pattern of instructional formats deployed (i.e., favoring whole-class instruction), pairwise comparisons indicated the percentage of instruction by format varied across modalities (synchronous vs. in-person). Teachers reported a greater percentage of their instruction occurred in the whole-class format during synchronous instruction compared to in-person instruction (p < 0.001). Conversely, a greater percentage of small-group instruction reportedly occurred in-person compared to synchronous instruction (p = 0.02). Surprisingly, there was no significant difference in estimates of the percentage of individual instruction occurring across modalities (p = 0.82).
Teachers were asked how they decided which instructional format to utilize. For virtual instruction, approximately half the teachers (51%) reported that the instructional format was influenced by the instructional activity; however, teachers identified several other influential factors including: directives from school leadership/district (40%), student composition/prior knowledge (38%), and subject area (33%). For in-person instruction pre-pandemic, teachers reported that the format was often determined by student composition/prior knowledge (63%), followed by considerations for the subject area (58%) and specific instructional activity (48%). Some teachers also noted that the format was determined by school leadership/district (38%). Note, the sum exceeds 100% as teachers could select multiple response options.

4.1.4. Technology and Learning Location

Teachers reported that the majority of their students had reliable access to computers (M = 94%, SD = 12%) and internet (M = 82%, SD = 22%). The high access rates may be due to school/district initiatives: 95% of teachers reported that their school/district provided students with computers, while 69% provided internet to support virtual instruction. Teachers estimated that the majority of their students (M = 78%, SD = 30%) engaged in virtual instruction from home; participation from daycares, learning pods, or other arrangements was less common (Ms ≤ 6%).

4.2. What Classroom Management Challenges Did Teachers Experience and How Does It Compare to Pre-COVID-19?

This question was largely exploratory. However, we anticipated teachers would find it more difficult to manage children’s attention virtually than during in-person instruction and that teachers would estimate children were more off-task during virtual instruction. Additionally, we anticipated that teachers would report high levels of stress teaching virtually.

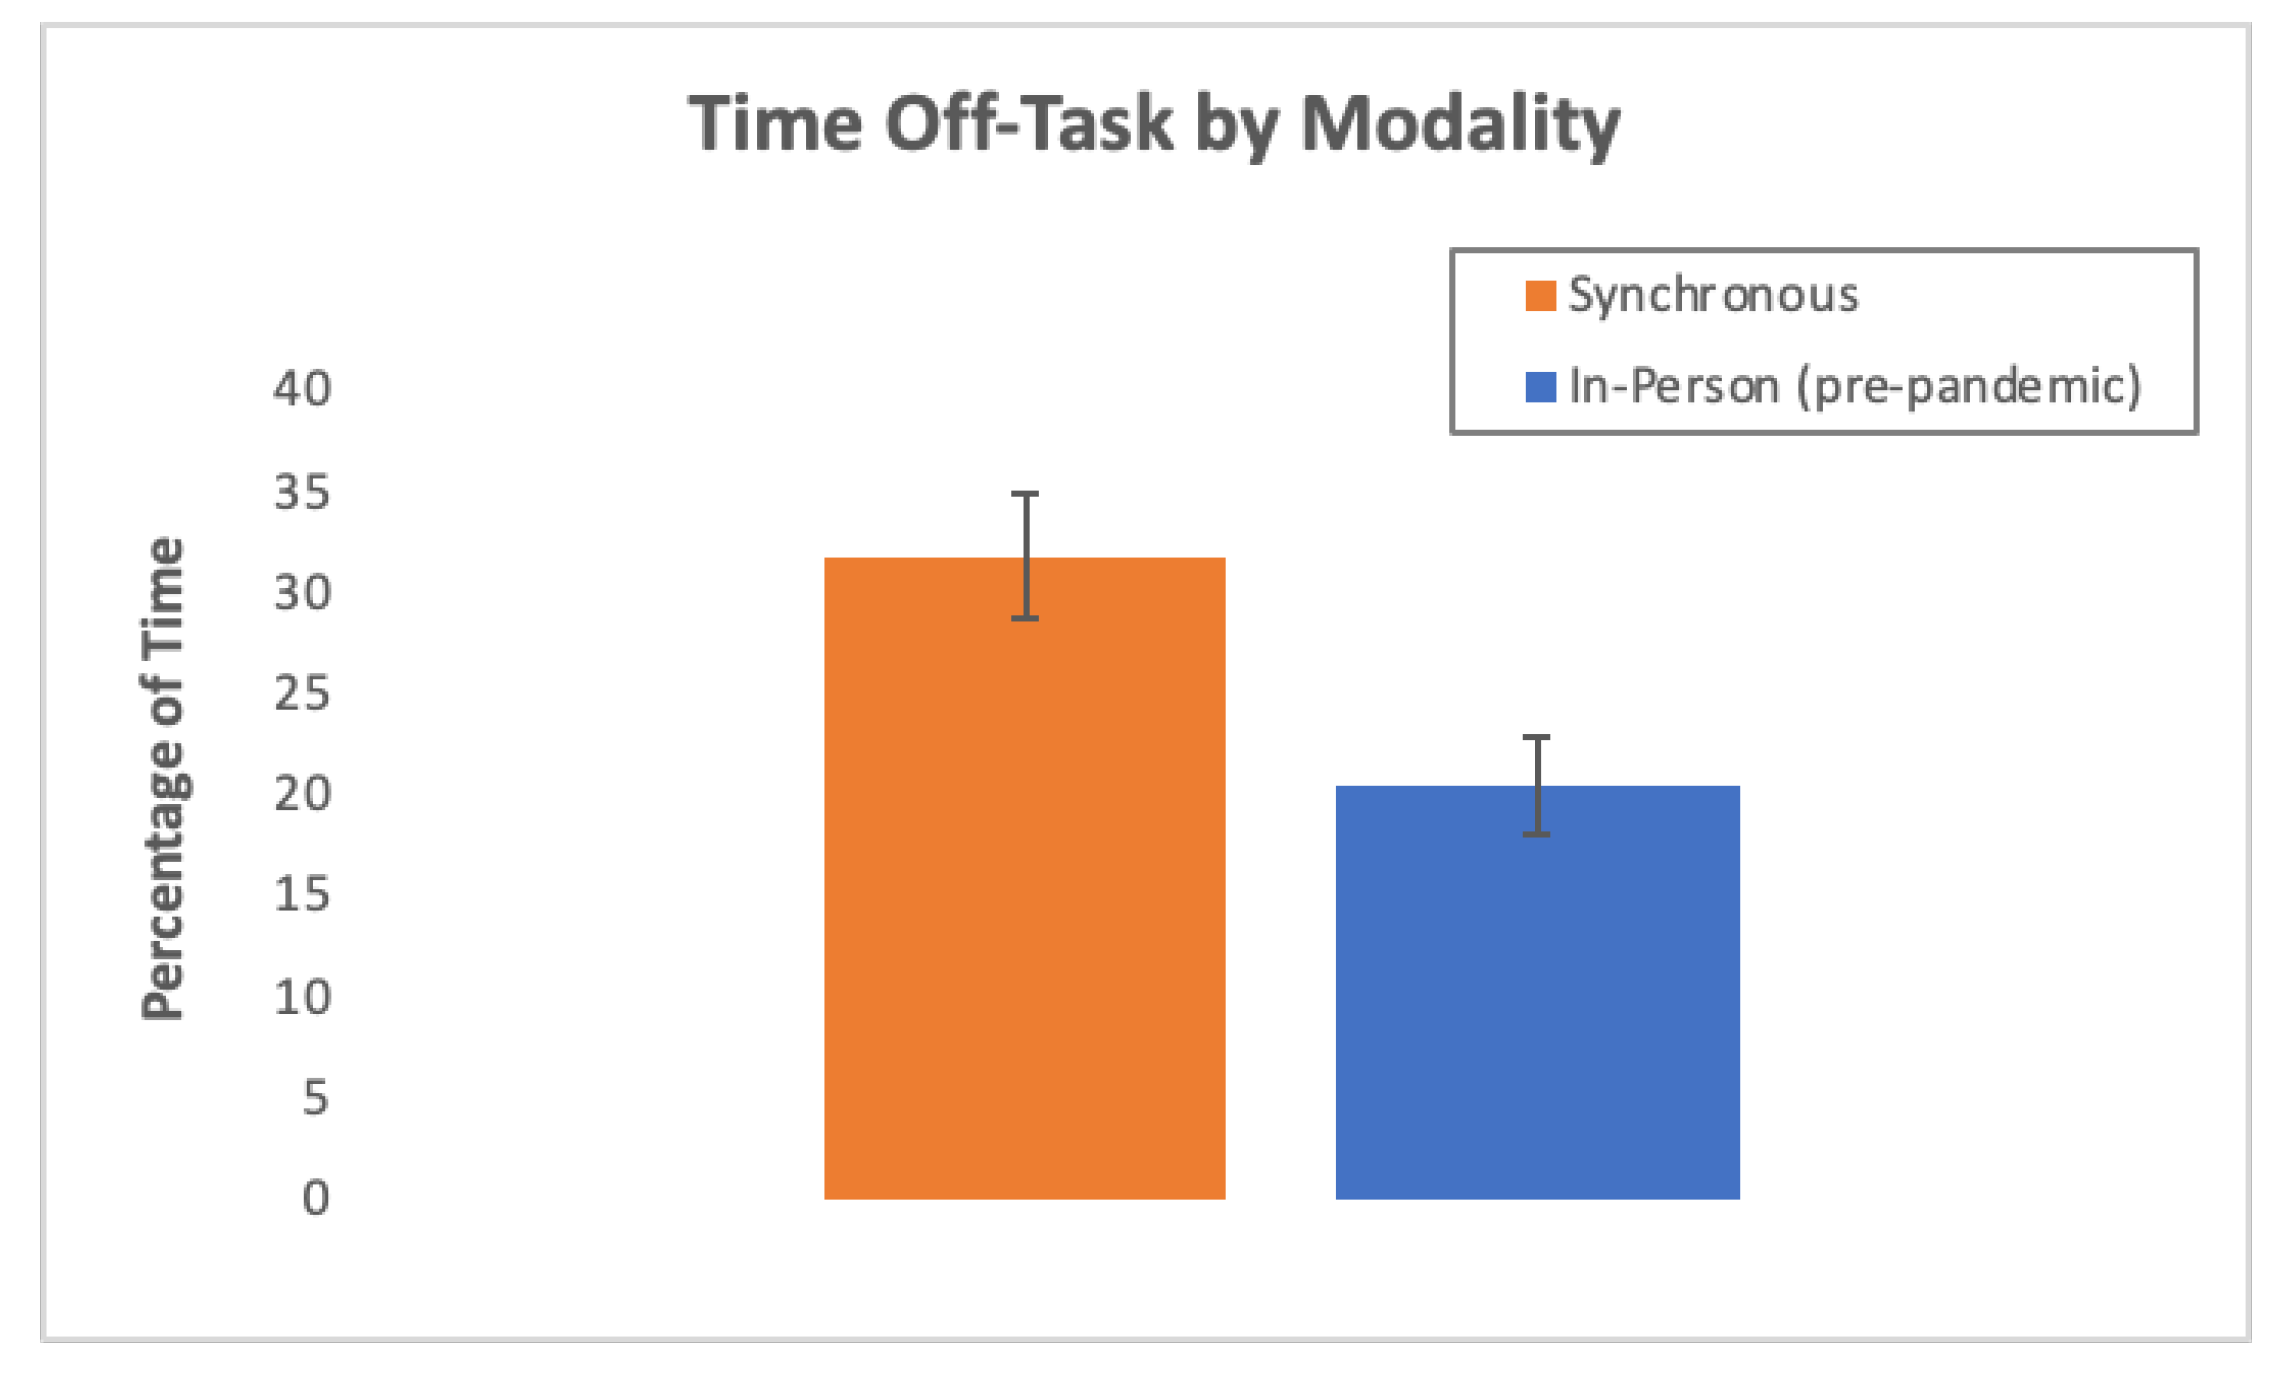
4.2.1. Difficulty Managing Attention and Time Off-Task

In line with our hypothesis, most teachers (77%) reported that it was somewhat or very difficult to manage children’s attention during synchronous instruction. In contrast, 20% of teachers reported that it was somewhat or very difficult to manage children’s attention in-person (pre-pandemic). In line with this assessment, teachers estimated that students spent significantly less time off-task during in-person instruction (M = 20%, SD = 15%) than during synchronous instruction (M = 32%, SD = 19%; paired t(38) = 4.20, p < 0.001, Cohen’s d = 0.67); see Figure 3.

4.2.2. Off-Task Behaviors

Teachers were queried about the frequency of students’ off-task behaviors during virtual instruction. Sources of off-task behavior included behaviors observed in physical classrooms (e.g., peer-distractions, supplies, self-distractions; [24,25] and off-task behaviors unique to virtual classrooms (e.g., chat box, virtual backgrounds, family members). Using a 5-point scale, teachers rated the frequency of each off-task behavior, with higher scores reflecting more frequent behaviors.
Nine sources of off-task behavior were included in the analysis. The category “other” was excluded due to the low response rate for this category. The repeated measure ANOVA revealed a significant effect of the source of off-task behavior on frequency ratings (F(8, 296) = 13.11, p < 0.001, partial η2 = 0.26). Family members were one relatively frequent source of off-task behavior. Based on pairwise comparisons, using a corrected alpha of 0.006 (0.05/8), distractions from family members (M = 3.63, SE = 0.14) occurred more frequently than off-task behavior related to emojis (M = 2.26, SE = 0.17), virtual backgrounds (M = 2.26, SE = 0.21), technology (M = 3.03, SE = 0.19), peers (M = 2.68, SE = 0.17), toys (M = 3.13, SE = 0.15), and supplies (M = 2.82, SE = 0.16); ps ≤ 0.004. There was no significant difference in the frequency of off-task behaviors related to family members vs. self-distractions (M = 3.55, SE = 0.13) or the chat box (M = 3.21, SE = 0.17); both ps ≥ 0.05.

4.2.3. Attention Management Strategies

Teachers used several different strategies to support children’s attention regulation during virtual instruction. Most teachers reported using short breaks (76%) and modifying the instructional activity (70%) or its duration (70%). More than a third of teachers reported using signals (e.g., hand clapping, ringing a bell; 37%). Deploying a token economy (24%) and other strategies (20%) were reported, although not as widely endorsed. Note, the sum exceeds 100% as teachers could select multiple response options.
Attention Management Strategies: Comparison to In-Person Instruction Pre-COVID-19. As with virtual instruction, during in-person instruction, most teachers endorsed using short breaks (83%) and modifying the instructional activity (78%) or duration (61%) to manage students’ attention. A marked increase was seen in teachers’ endorsement of both token economies (81%) and signals (83%).

4.2.4. Teacher Stress and Needed Supports

Eighty percent of teachers reported that their stress-level coping with teaching online was moderate to high. This finding largely supported our hypothesis. A subset of teachers (n = 32) recommended changes to make teaching online easier. More common suggestions included professional development/training (28%) and better access to materials and technology for both students and teachers (28%). Lowering workload (13%), increasing parental involvement (13%), and requests for flexibility in curriculum design (13%) were noted by a subset of teachers; see Appendix B.

5. Study 1 Discussion

Study 1 provides several insights into teachers’ perspectives and approaches to distance learning during the pandemic. First, compared to in-person instruction, the duration of virtual instruction was reportedly shorter. While additional time does not necessarily translate into meaningful learning gains [26,27], this finding suggests that learning opportunities may have been reduced during online instruction, and points to one potential factor contributing to pandemic learning losses [7,8,9].
Second, the utilization of various instructional formats during online instruction was largely parallel to what teachers reported using in-person, with teachers generally favoring whole-class instruction. Further, teachers reported using less small-group instruction during online instruction and there was no significant difference across modalities for individual instruction. These findings may point to a missed opportunity to leverage technology to incorporate more small-group and individual learning opportunities during online instruction. This is surprising, given the potential attentional benefits of small-group and individual instruction [24] and the unique affordances of technology to help support interactive and individualized instruction [28]. Instructional format decisions may have been limited by platform functionality (e.g., ability to send students to breakout rooms); however, this issue was not voiced by teachers. Rather, teachers reported their format decisions were guided by factors germane to instruction and guided by school leadership/the district. Future research is needed to investigate if instructional format is also related to children’s attention and learning in virtual environments.
Third, managing students’ attention during virtual instruction was viewed as a challenge by most teachers and stood in stark contrast to the minority of teachers who reported managing student attention in-person was also difficult. Although estimates of student off-task behavior were generally aligned with past research on children’s attention allocation patterns [24,25,27,29], teachers reported that children spent more time off-task during virtual instruction than during in-person instruction. In prior research, peers have been identified as a common source of off-task behavior in both the laboratory and in physical classrooms [24,25,29]. Here, peer-distractions were reportedly less frequent than distractions unique to virtual classrooms. It is possible that disruption from peers in online environments may depend in part on the configuration of the learning environment. For example, when teachers require students to mute their microphone, it may also serve to reduce attentional capture from peers.
Fourth, the burden of working to educate children online during a global pandemic was evident in teachers’ reports of stress. Importantly, the majority of teachers reported that their students had reliable access to computers and internet, essential infrastructure for online instruction. The challenges and obstacles experienced pivoting online and delivering effective online instruction would likely be magnified for teachers at schools with fewer resources, a point we return to in the General Discussion.
Given that the majority of teachers reported that their students were engaged in virtual instruction from home, understanding parents’ experiences facilitating their children’s online learning and their perspective on how much children are enjoying and learning online is essential. These questions were explored in Study 2 with a separate sample of elementary school parents.

6. Study 2 Method

6.1. Participants

6.1.1. Parents

Parents (N = 209) of elementary students (grades K-5) were recruited for Study 2. Twenty participants were excluded from the analysis (3 did not meet inclusion criteria, 17 did not meet minimum survey progression); thus, the final sample included 189 parents. The majority of parents identified as female (68%) and were 44 years of age or younger (72%). Almost half (48%) had an advanced degree. Parents resided in 27 states and Washington D.C. Based on participants’ zip code, the median household income for the communities in which families lived ranged from $16,664 to $210,639 (M = $93,223; SD = $40,375; using data from Niche.com).

6.1.2. Children

According to parent reports, 52% of the children were female and the majority were White (70%). Most children attended public schools (78%). The children were from six grade-levels (K-5), with the majority in kindergarten (26%) or first-grade (28%). See Appendix C for additional demographic information.

6.2. Measure

The online survey consisted of 45 questions. Some survey items overlapped with Study 1. For example, parents were asked about different aspects of children’s instruction including the modality and lesson duration. Parents were also asked about the percentage of time children spent off-task, frequency of different types of off-task behaviors, and attention management strategies deployed. Additionally, parents reported their stress-level managing their child’s learning and identified supports needed to improve virtual instruction. Parents also answered unique questions including gauging instruction quality, their child’s frustration and enjoyment levels, and assessments of their child’s academic growth. Parents also provided contextual information (e.g., school type, learning location) and demographic information.

7. Study 2 Results

7.1. What Does the Virtual Learning Context Look like During COVID-19 from Parents’ Perspectives?

This question was largely exploratory and as such, specific predictions about the virtual learning context are limited. However, as in Study 1, we anticipated that parents would report that their children were experiencing both synchronous and asynchronous instruction. Further, we anticipated that children would dislike learning virtually and that their perceived enjoyment while learning would be lower during virtual instruction compared to in-person instruction. We anticipated we would find the inverse pattern for children’s perceived frustration levels in which frustration levels were predicted to be high during virtual instruction and higher than during in-person instruction.

7.1.1. Instructional Modality

During fall 2020, six months into the pandemic, parents reported that their children’s schools were primarily using virtual instruction (68%). Of these parents (n = 128), 52% reported that their child’s school was using synchronous instruction, 3% were asynchronous, and 45% were using a combination of synchronous and asynchronous instruction. By spring 2021, virtual instruction dropped from 68% to 40%.
Consistent with Study 1, parents reported children spent the bulk of their time engaged in synchronous instruction. During a typical week, children spent on average 61% (SD = 31%) of their time engaged in synchronous instruction, with synchronous instruction identified by most parents as the primary modality for math (86%), English (79%), and science (70%).

7.1.2. Instructional Duration

Parents estimated the average duration of their child’s synchronous and asynchronous lessons in math, English, and science. To investigate the effect of modality and subject area on lesson duration, we conducted a repeated measure ANOVA with modality (Synchronous vs. Asynchronous) and subject area (Math, English, Science) as within-subject factors. The assumption of sphericity was violated for the effect of subject area and the interaction between subject area and modality; thus, we applied a Huynh–Feldt correction to both effects. Results revealed a significant effect of modality (F(1, 102) = 31.22, p < 0.001, partial η2 = 0.23) and subject area (F(1.83, 186.88) = 8.60, p < 0.001, partial η2 = 0.08), but no significant interaction (F(1.87, 191.20) = 1.56, p = 0.21).
Pairwise comparisons indicated the estimated duration of a typical asynchronous activity was significantly shorter than a typical synchronous lesson (M = 31.57 min, SE = 1.70 vs. M = 40.72 min, SE = 1.56; p < 0.001). Irrespective of modality, parents estimated that the typical duration of English (M = 38.02 min, SE = 1.55) and math (M = 36.93 min, SE = 1.53) lessons were significantly longer than science lessons (M = 33.48 min, SE = 1.63; ps ≤ 0.005). There was no significant difference in the mean duration of English and math lessons (p = 0.25); see Figure 4.

7.2. How Much Do Children Enjoy Virtual Learning?

Parents rated how much their children enjoyed learning virtually and in-person (pre-pandemic) on a 5-point scale with higher scores indicating greater enjoyment. The results partially supported our hypothesis. On average, children did not like nor dislike learning virtually (M = 2.89, SD = 1.40); however, children reportedly enjoyed learning in-person (M = 4.13, SD = 1.06) significantly more (paired t(149) = 8.13, p < 0.001, Cohen’s d = 0.66); see Table 1.
Parents rated their child’s level of frustration while learning virtually and in-person on a 4-point scale with higher scores indicating greater frustration. Contrary to our hypothesis, we found that across modalities, children on average exhibited only mild frustration. However, children reportedly demonstrated higher levels of frustration during virtual instruction (M = 2.30, SD = 0.90) compared to in-person (M = 1.73, SD = 0.72; paired t(146) = 6.58, p < 0.001, Cohen’s d = 0.54); see Table 1. This is a finding consistent with our hypothesis.

7.3. What Are the Challenges Families Experienced?

This question was largely exploratory and thus a priori hypotheses were limited with the exception that we anticipated parents would report it was difficult to manage children’s attention during virtual instruction and that parents would report higher levels of stress managing children’s learning online compared to in-person.

7.3.1. Difficulty Managing Attention and Time Off-Task

Children struggled to maintain attention during virtual instruction. Parents estimated their children spent more than a third of instructional time off-task (M = 38%, SD = 25%). Almost a third (32%) of parents reported it was somewhat or very difficult to manage children’s attention during virtual learning, a finding consistent with our hypothesis.

7.3.2. Off-Task Behaviors

Parents rated the frequency of children’s off-task behaviors on a scale from 1 to 5, with higher scores indicating more frequent behaviors. As in Study 1, nine behaviors were analyzed: self-distractions, peers, supplies, emojis, chat box, virtual backgrounds, technology, toys, and family members. A repeated measure ANOVA with the Greenhouse–Geisser correction revealed a significant effect of the source of off-task behavior on frequency ratings (F(5.55, 826.61) = 29.10, p < 0.001, partial η2 = 0.16). Pairwise comparisons, correcting for multiple comparisons (0.05/8 = 0.006), indicated that children engaged in self-distractions (M = 3.00, SE = 0.08) more frequently than off-task behaviors related to: emojis (M = 1.95, SE = 0.09), chat box (M = 2.3, SE = 0.10), virtual backgrounds (M = 2.01, SE = 0.10), technology (M = 2.26, SE = 0.11), and peers (M = 2.26, SE = 0.09); ps ≤ 0.001. However, there was no significant difference in frequency ratings between self-distractions vs. off-task behavior related to family members (M = 2.77, SE = 0.09), toys (M = 2.78, SE = 0.09), or supplies (M = 2.87, SE = 0.08; ps ≥ 0.02).

7.3.3. Parental Stress and Needed Supports

Parents reported their stress-level managing children’s learning both virtually and in-person (pre-pandemic) on a 4-point scale where higher scores indicate greater stress; see Table 1. Consistent with our hypothesis, mean stress ratings differed significantly (paired t(147) = 10.06, p < 0.001, Cohen’s d = 0.83), with parents reporting greater stress managing virtual instruction (M = 2.69, SD = 0.89) and more mild stress-levels managing in-person instruction (M = 1.79, SD = 0.78).
Parents’ higher stress-levels managing virtual instruction may have been due in part to the fact that virtual instruction often occurred in the home (89%) where parents/guardians typically guided instruction (72%). Children were largely dependent on adult support as less than half (45%) of the children were rated by parents as being capable of completing synchronous lessons independently. Task demands were amplified further for parents who were caring for more than one child in the home (M = 1.83 children, SD = 0.93) and/or navigating virtual instruction for multiple children simultaneously (M = 1.35 children, SD = 0.85).

7.3.4. Strategies to Support Attention Regulation

Parents reported using a variety of strategies to support children’s attention regulation (the total exceeds 100% as parents could select multiple strategies). Short breaks (61%) and rewards (48%) were frequently endorsed by parents. More than a quarter of parents reported modifying the instructional activity (27%), while a subset of parents reported using other strategies (16%).

7.4. How Much Are Children Reportedly Learning?

This question was largely exploratory. However, we hypothesized that parents would rate the quality of virtual instruction as lower than the quality of in-person instruction and we anticipated they would report that their children were exhibiting less academic growth.

Quality of Instruction

Parents rated the quality of instruction their children received on a scale from 1 to 5 in which higher scores indicate better quality. Despite the quick pivot to online in-struction schools faced, parents, on average, reported that the quality of virtual in-struction was okay (M = 3.49, SD = 1.12). Congruent with our hypothesis, parents rated the quality of children’s in-person in-struction (pre-pandemic) as good (M = 4.03, SD = 0.90) and of higher quality than children’s virtual instruction (paired t(149) = 5.50, p < 0.001, Cohen’s d = 0.45).
Despite ongoing pandemic-related challenges, most parents felt their children’s current academic growth was similar to or above the level of their child’s peers (77%). Nevertheless, 35% of parents felt their children exhibited less academic growth in fall 2020 compared to fall 2019 (pre-pandemic), a finding somewhat consistent with our hypothesis.
A subset of parents (n = 50) recommended support to help families better navigate virtual instruction. Common responses included: modifications to the instruction/format/modality (26%), encour-aging more teacher creativity/engagement (18%), more frequent teacher–parent communication (10%), more technology support for children and parents (10%), and establishing a routine/increasing organization (10%); see Appendix D.

8. Study 2 Discussion

Several key findings emerged from Study 2. First, children reportedly enjoyed learning in-person (pre-pandemic) more than learning virtually and they exhibited less frustration. Second, parents’ self-reported stress-levels were higher when managing children’s virtual learning than their retrospective ratings of stress managing in-person instruction. Higher parental stress-levels may reflect that parents were largely responsible for guiding their children’s virtual instruction. This required active involvement from many parents as less than half of the children were reportedly able to complete the instructional activities independently. Parenting demands were exacerbated further for some parents who needed to navigate virtual instruction for more than one child in the household. Third, parents rated the quality of virtual instruction as lower than in-person instruction pre-pandemic. Relatedly, more than a third of parents reported their children exhibited less academic growth than they had prior to the pandemic. Parents’ perceptions regarding their children’s stunted academic growth are aligned with emerging findings documenting profound and pervasive pandemic learning losses (e.g., [9]).

9. General Discussion

This work highlights important similarities and differences in teacher and parent experiences navigating virtual instruction during the second year of the COVID-19 pandemic; see Table 2 for an overview. Both teachers and parents reported that synchronous instruction was the primary modality for math, English, and science lessons. Teachers noted that modality decisions were often influenced by school leadership. Across both studies, the duration of synchronous instruction was generally estimated to be longer than asynchronous activities. Science lessons were also generally estimated to be shorter than the duration of math and English lessons. Teacher reports also indicated a reliance on the whole-class instructional format. This instructional design decision may have important consequences for student engagement, attention regulation, and learning. The present findings may suggest a missed opportunity to capitalize on the unique affordances of virtual platforms to deploy more differentiated instruction and targeted support through individual and small-group instructional activities.
Across both studies, children generally engaged in virtual instruction from their home with teachers and parents noting self-distractions and distractions from family members as relatively common sources of off-task behavior. Both teachers and parents utilized similar attention management strategies and short breaks were a common technique they employed. Both teachers and parents reported that children spent a sizable percentage of their time off-task during virtual instruction (32% and 38%, respectively), findings largely in line with the prior literature examining children’s patterns of attention allocation [24,25,27,29]. However, it is also possible that teachers may have underestimated the prevalence of children’s off-task behavior. Monitoring and assessing lapses in attention, especially during whole-class instruction, may be particularly challenging as teachers may have restricted visibility of students (depending on view settings) as well as limited auditory cues if children are asked to mute their microphones. It is also interesting to note the contrasting percentages of teachers and parents who reported it was difficult to manage children’s attention during virtual instruction. The majority of teachers reported it was somewhat or very difficult to manage children’s attention while only about a third of parents reported the same. This difference may be due to the number of children that teachers are supervising simultaneously or logistical issues of enforcing class rules and behavioral expectations remotely. Stress levels were understandably elevated among teachers and parents. Contributing factors are not explicated here but may include strain from working to minimize children’s learning losses during the unprecedented challenges of a global pandemic, protecting children’s health and wellbeing, while also navigating competing work and caregiving demands [6].
The quality of virtual instruction was estimated by parents to be lower than in-person instruction; however, parents generally reported the quality of virtual instruction was okay. Nevertheless, concerns over stunted academic growth were raised by more than a third of parents. There are a number of factors contributing to the learning losses children are experiencing. One potential contributing factor is the quantity of instruction, as teachers reported the duration of virtual instruction was less than what children received in-person pre-pandemic. The consequences of the disruptions to children’s education are only beginning to be understood. Given the troubling accounts of the disproportionate impact of the pandemic on children of color and children from lower socio-economic backgrounds [7,30], future research should take a purposive approach to increase diversity and recruit samples from more varied income-levels in order to identify and align supports to the unique needs of each community context [21,31].
These data were collected about one year into the pandemic, providing an important window into teachers’ and families’ experiences during a different point in the pandemic. Future research should explore how teacher and family interactions continue to evolve as children return to in-person classes and learning recovery efforts mount.

Limitations

As with any study, there are limitations that qualify the generalizability of the findings. First, participants were not randomly selected and are not necessarily representative of the broader U.S. population. Convenience samples are common in developmental science [32]; nevertheless, the nature of the sample limits generalizability [33].
For example, the findings may not apply to families with fewer economic resources as they may have more limited access to digital tools or broadband internet in the home [34]. Therefore, their virtual educational experiences likely differed. Families also need time to assist their children; this resource may also vary across families. Second, future research should recruit a larger sample of teachers and a wider range of grade-levels to ascertain the generalizability of the findings. Third, the voice of children was heard only indirectly through their parents, a limitation that subsequent research should address. Fourth, we did not collect data on children’s academic performance to corroborate parent reports. Despite these limitations, these findings provide important information about the virtual instructional context as well as teachers’ and families’ experiences in navigating instruction during the pandemic.

10. Conclusions

Many schools have now transitioned to hybrid instruction or returned in-person. However, children are returning to school with significantly lower reading and mathematics skills than in the past [9]. Understanding the nature of children’s instruction during the pandemic may enable more effective remediation. Further, the unprecedented pivot to online learning has caused some schools to reevaluate their offerings and policies. For example, some schools are considering whether the need for snow days is now obsolete [35,36,37]. The COVID-19 pandemic has created a natural experiment in which the landscape of education has been fundamentally altered [38]. We hope future research will build upon these findings to identify how aspects of instructional design, classroom management, and family dynamics interact to create stronger partnerships across microsystems to improve children’s wellbeing and learning regardless of instructional modality.

Author Contributions

Conceptualization, K.E.G. and S.S.; Data curation, K.E.G., F.K. and S.S.; Formal analysis, K.E.G. and F.K., Writing—original draft, K.E.G., F.K. and S.S., Writing—reviewing & editing, K.E.G., F.K. and S.S. All authors have read and agreed to the published version of the manuscript.

Funding

This research received no external funding.

Institutional Review Board Statement

This study was approved by the University of Maryland, Baltimore County Institutional Review Board (IRB #528).

Informed Consent Statement

Participants first read the online consent form and then indicated their agreement to participate electronically.

Data Availability Statement

Data will be made available upon request.

Acknowledgments

We are grateful to the parents and teachers who made this research possible. We also thank the research assistants in the UMBC Child Development Lab for their help: We thank Zoha Faraz and Sarah Winchell for their help programing the survey and assistance processing the data. We thank Yuika Iwai, Huda Qalawee, and Audrey Snyder for their help coding data.

Conflicts of Interest

The authors have no conflict of interest to declare.

Appendix A

Table A1. Teacher Demographic Information.
N%
Gender
Female3571
Male612
Did not report816
Education Level
Associate Degree12
Bachelor’s Degree1327
Master’s Degree2653
Doctorate Degree12
Did not report816
Teaching Certificate
Standard1735
Advanced1429
Provisional510
Special Education12
N/A48
Did not report816
Grade Level Currently Teaching
Kindergarten36
First Grade816
Second Grade510
Third Grade612
Fourth Grade12
Fifth Grade1225
Special Education510
Art, Music, or Physical Education36
ESL12
Other510
Total Teaching Experience
15+ years2041
10–14 years714
5–9 years1020
1–4 years36
Less than a year918
Current Grade Teaching Experience
15+ years1020
10–14 years36
5–9 years1224
1–4 years1224
Less than a year1224
Classroom Role
Teachers3265
Aide or Assistant510
Specialist36
Other12
Did not report816
School Type
Public School4082
Public-Charter School24
Private School714

Appendix B

Table A2. Teacher Suggestions to Improve Online Learning.
Category% Of TeachersFrequency Count
Professional development/training 28% 9
Better access to materials and technology (e.g., school supplies, internet) for students/teachers28%9
Lower teacher workload 13%4
More parental involvement13%4
Greater flexibility in curriculum design13%4
Improving learning management system6%2
Access to childcare6%2
Greater student effort/engagement6%2
Dedicated space for students to study at home 3%1
Note. 32 teachers provided valid written responses to this question. Teachers generated 37 suggestions to improve online learning, as some teachers provided more than one suggested change. Consequently, the total exceeds 100%. Responses were coded by the second author and re-coded by a research assistant naive to the hypothesis to assess interrater reliability; Cohen’s Kappa was 0.854 (p < 0.001).

Appendix C

Table A3. Parent and Child Demographic Details.
n%
Parent Gender
Female12968
Male3116
Non-Binary/Third Gender1>1
Did not report2815
Parent Age Group
18–24 years old1>1
25–34 years old2915
35–44 years old10757
45–54 years old2413
55+ years old21
Did not report2614
Parent Education Level
High School Graduate21
Some College or Trade School2413
Associate Degree2111
Bachelor’s Degree2614
Master’s Degree5328
Doctorate Degree3820
Did not report2513
Number of Children at Home
01>1
16635
26735
32011
4+84
Did not report2714
Child Gender
Female9852
Male8646
Both32
Did not report21
Child Race/Ethnicity
White13370
Black/African American84
Asian84
American Indian/Alaska Native179
Native Hawaiian/Pacific Islander21
Two or more137
Other42
Did not report42
Child Grade
Kindergarten4926
First Grade5228
Second Grade3318
Third Grade2111
Fourth Grade169
Fifth Grade179
Other1>1
School Type
Public School13270
Public-Charter School158
Private School3820
Home School42
Note. Parents with more than one child were asked to answer all questions about their youngest elementary student.

Appendix D

Table A4. Supports Identified by Parents to Help Families Better Navigate Distance Learning.
Category% of ParentsFrequency Count
Modifications to instruction/format/modality26% 13
Increasing teacher engagement & creativity18% 9
Parent-Teacher meetings/Clearer communication10% 5
More technology support for parents/children10% 5
More organization and routine10% 5
Academic support/Additional study time with teacher8% 4
Dedicated space for student to study/work 8% 4
More peer interaction6% 3
Student mental health and socio-emotional support4% 2
Streamlining learning platforms4% 2
More teacher training2% 1
Resources to support student motivation2% 1
Note. 50 parents provided written responses to this question generating 54 total suggestions. Each suggestion was coded separately. Consequently, the total percentage exceeds 100%. Responses were coded by the second author and re-coded by a research assistant naive to the hypothesis to assess inter-rater reliability; Cohen’s kappa was 0.80, p < 0.001.

References

  1. World Health Organization. WHO Coronavirus (COVID-19) Dashboard. Available online: https://covid19.who.int (accessed on 25 September 2022).
  2. Education Week. Map: Coronavirus and School Closures in 2019–2020. Available online: https://www.edweek.org/leadership/map-coronavirus-and-school-closures-in-2019-2020/2020/03 (accessed on 13 October 2021).
  3. U. S. Census Bureau; Nearly 93% of Households with School-Age Children Report Some form of Distance Learning during COVID-19. Census.gov. 2021. Available online: https://www.census.gov/library/stories/2020/08/schooling-during-the-covid-19-pandemic.html (accessed on 13 October 2021).
  4. Fuller, B. Are We Reopening Schools Fairly. Brookings. Available online: https://www.brookings.edu/blog/brown-center-chalkboard/2020/07/22/are-we-reopening-preschools-fairly-prioritizing-children-most-impacted-by-coronavirus/ (accessed on 13 October 2021).
  5. Hirsh-Pasek, K.; Yogman, M.; Golinkoff, R.M. Should Schools Reopen? Balancing COVID-19 and COVID-19 Learning Loss for Young Children. Brookings. Available online: https://www.brookings.edu/blog/education-plus-development/2020/07/21/should-schools-reopen-balancing-covid-19-and-learning-loss-for-young-children/ (accessed on 21 July 2020).
  6. Sonnenschein, S.; Stites, M.; Ross, A. Home Learning Environments for Young Children in the U.S. During COVID-19. Early Educ. Dev. 2021, 32, 794–811. [Google Scholar] [CrossRef]
  7. Engzell, P.; Frey, A.; Verhagen, M.D. Learning loss due to school closures during the COVID-19 pandemic. Proc. Natl. Acad. Sci. USA 2021, 118, e2022376118. [Google Scholar] [CrossRef] [PubMed]
  8. Kuhfeld, M.; Soland, J.; Lewis, K. Test Score Patterns across Three COVID-19-Impacted School Years EdWorkingPaper: 22-521; Annenberg Institute at Brown University: Providence, RI, USA, 2022. [Google Scholar]
  9. NAEP. NAEP Long-Term Trend Assessment Results: Reading and Mathematics. The Nation’s Report Card. 2022. Available online: https://www.nationsreportcard.gov/highlights/ltt/2022/ (accessed on 25 September 2022).
  10. Klosky, J.V.; Gazmararian, J.A.; Casimir, O.; Blake, S.C. Effects of Remote Education During the COVID-19 Pandemic on Young Children’s Learning and Academic Behavior in Georgia: Perceptions of Parents and School Administrators. J. Sch. Health 2022, 92, 656–664. [Google Scholar] [CrossRef] [PubMed]
  11. Bronfenbrenner, U.; Morris, P.A. The Bioecological Model of Human Development. In Handbook of Child Psychology:Theoretical Models of Human Development; Damon, W., Lerner, R.M., Eds.; John Wiley & Sons Inc.: Hoboken, NJ, USA, 2007; pp. 793–828. [Google Scholar] [CrossRef]
  12. Benner, A.D.; Mistry, R.S. Child Development During the COVID-19 Pandemic Through a Life Course Theory Lens. Child Dev. Perspect. 2020, 14, 236–243. [Google Scholar] [CrossRef]
  13. Gennetian, L.A.; Hirsh-Pasek, K. Where’s the Rallying Cry? America’s Children Are Unequally Prepared to Absorb the Impacts of COVID-19. Brookings. Available online: https://www.brookings.edu/blog/education-plus-development/2020/05/13/wheres-the-rallying-cry-americas-children-are-unequally-prepared-to-absorb-the-impacts-of-covid-19/ (accessed on 13 May 2020).
  14. Patrick, S.W.; Henkhaus, L.E.; Zickafoose, J.S.; Lovell, K.; Halvorson, A.; Loch, S.; Letterie, M.; Davis, M.M. Well-being of Parents and Children During the COVID-19 Pandemic: A National Survey. Pediatrics 2020, 146, e2020016824. [Google Scholar] [CrossRef]
  15. Prime, H.; Wade, M.; Browne, D.T. Risk and resilience in family well-being during the COVID-19 pandemic. Am. Psychol. 2020, 75, 631–643. [Google Scholar] [CrossRef]
  16. Russell, B.S.; Hutchison, M.; Tambling, R.; Tomkunas, A.J.; Horton, A.L. Initial Challenges of Caregiving During COVID-19: Caregiver Burden, Mental Health, and the Parent–Child Relationship. Child Psychiatry Hum. Dev. 2020, 51, 671–682. [Google Scholar] [CrossRef]
  17. Sonnenschein, S.; Stites, M.L.; Galczyk, S.H. Teaching preschool during COVID-19: Insights from the field. In Contemporary Perspectives on Research on Coronavirus Disease 2019 (COVID-19) in Early Childhood Education; Saracho, O.N., Ed.; Information Age Publishing: Charlotte, NC, USA, 2022; pp. 35–53. [Google Scholar]
  18. Ford, T.G.; Kwon, K.-A.; Tsotsoros, J.D. Early childhood distance learning in the U.S. during the COVID pandemic: Challenges and opportunities. Child. Youth Serv. Rev. 2021, 131, 106297. [Google Scholar] [CrossRef]
  19. Panaoura, R. Parental Involvement in Children’s Mathematics Learning Before and During the Period of the COVID-19. Soc. Educ. Res. 2021, 2, 65–74. [Google Scholar] [CrossRef]
  20. Reich, J.; Buttimer, C.J.; Coleman, D.; Colwell, R.D.; Faruqi, F.; Larke, L.R. What’s Lost, What’s Left, What’s Next: Lessons learned from the Lived Experiences of Teachers during the 2020 Novel Coronavirus Pandemic. EdArXiv 2020. [Google Scholar] [CrossRef]
  21. Stites, M.L.; Sonneschein, S.; Galczyk, S.H. Preschool Parents’ Views of Distance Learning during COVID-19. Early Educ. Dev. 2021, 32, 923–939. [Google Scholar] [CrossRef]
  22. Gawlik, K.; Melnyk, B.M. Pandemic Parenting Examining the Epidemic of Working Parental Burnout and Strategies to Help. Available online: https://wellness.osu.edu/sites/default/files/documents/2022/05/OCWO_ParentalBurnout_3674200_Report_FINAL.pdf (accessed on 13 May 2021).
  23. Kirsch, C.; de Abreu, P.M.E.; Neumann, S.; Wealer, C. Practices and experiences of distant education during the COVID-19 pandemic: The perspectives of six- to sixteen-year-olds from three high-income countries. Int. J. Educ. Res. Open 2021, 2, 100049. [Google Scholar] [CrossRef] [PubMed]
  24. Godwin, K.E.; Almeda, M.V.; Seltman, H.; Kai, S.; Skerbetz, M.D.; Baker, R.S.; Fisher, A.V. Off-task behavior in elementary school children. Learn. Instr. 2016, 44, 128–143. [Google Scholar] [CrossRef]
  25. Godwin, K.E.; Leroux, A.J.; Seltman, H.; Scupelli, P.; Fisher, A.V. Effect of Repeated Exposure to the Visual Environment on Young Children’s Attention. Cogn. Sci. 2022, 46, e13093. [Google Scholar] [CrossRef] [PubMed]
  26. Godwin, K.E.; Seltman, H.; Almeda, M.; Skerbetz, M.D.; Kai, S.; Baker, R.S.; Fisher, A.V. The elusive relationship between time on-task and learning: Not simply an issue of measurement. Educ. Psychol. 2021, 41, 502–519. [Google Scholar] [CrossRef]
  27. Karweit, N.; Slavin, R. Measurement and Modeling Choices in Studies of Time and Learning. Am. Educ. Res. J. 1981, 18, 157–171. [Google Scholar] [CrossRef]
  28. Koedinger, K.R.; Corbett, A.T. Cognitive Tutors: Technology bringing learning science to the classroom. In The Cambridge Handbook of the Learning Sciences; Sawyer, K., Ed.; Cambridge University Press: Cambridge, UK, 2006; pp. 61–77. [Google Scholar] [CrossRef]
  29. Fisher, A.V.; Godwin, K.E.; Seltman, H. Visual Environment, Attention Allocation, and Learning in Young Children: When too much of a good thing may be bad. Psychol. Sci. 2014, 25, 1362–1370. [Google Scholar] [CrossRef]
  30. Goldhaber, D.; Kane, T.; McEachin, A.; Morton, E.; Patterson, T.; Staiger, D. The Consequences of Remote and Hybrid Instruction during the Pandemic; Research Report; Center for Education Policy Research, Harvard University: Cambridge, MA, USA, 2022; Available online: https://cepr.harvard.edu/files/cepr/files/5-4.pdf?m=1651690491 (accessed on 25 September 2022).
  31. Soltero-González, L.; Gillanders, C. Rethinking Home-School Partnerships: Lessons Learned from Latinx Parents of Young Children During the COVID-19 Era. Early Child. Educ. J. 2021, 49, 965–976. [Google Scholar] [CrossRef]
  32. Jager, J.; Putnick, D.L.; Bornstein, M.H. More than just convenient: The scientific merits of homogeneous convenience samples. Monogr. Soc. Res. Child Dev. 2017, 82, 13–30. [Google Scholar] [CrossRef]
  33. Dearing, E.; Zachrisson, H.D. Taking Selection Seriously in Correlational Studies of Child Development: A Call for Sensitivity Analyses. Child Dev. Perspect. 2019, 13, 267–273. [Google Scholar] [CrossRef]
  34. Vogels, E.A. Digital Divide Persists Even as Americans with Lower Incomes Make Gains in Tech Adoption. Pew Research Center. Available online: https://www.pewresearch.org/fact-tank/2021/06/22/digital-divide-persists-even-as-americans-with-lower-incomes-make-gains-in-tech-adoption/ (accessed on 22 June 2021).
  35. Grumke, K. Snow Days Could Become a Thing of the Past with Virtual Classes. NPR. Available online: https://www.npr.org/2021/12/26/1068063613/snow-days-could-become-a-thing-of-the-past-with-virtual-classes (accessed on 26 December 2021).
  36. Mark, J. No More Snow Days? NYC Schools Say Remote Learning Eliminates the Need. Washington Post, 7 September 2022. Available online: https://www.washingtonpost.com/nation/2022/09/07/new-york-snow-days-canceled/ (accessed on 25 September 2022).
  37. Reed, M. Are Snow Days Still a Thing? Has Zoom Destroyed a Beloved Institution? Inside Higher Ed. Available online: https://www.insidehighered.com/blogs/confessions-community-college-dean/are-snow-days-still-thing (accessed on 3 January 2022).
  38. Colao, A.; Piscitelli, P.; Pulimeno, M.; Colazzo, S.; Miani, A.; Giannini, S. Rethinking the role of the school after COVID-19. Lancet Public Health 2020, 5, e370. [Google Scholar] [CrossRef] [PubMed]
Figure 1. Teacher Estimates of Lesson Duration by Subject (Math, English, Science) and Modality (Synchronous vs. Asynchronous). Note: Mean lesson duration by subject area and instructional modality. Error bars represent standard errors of the means.
Education 13 00426 g001
Figure 2. Teacher Estimates of the Percentage of Instruction Occurring in Each Format by Modality (In-person Pre-pandemic vs. Synchronous Pandemic). Note: Mean percentage of instruction occurring by instructional format (whole class, small-group, individual) and instructional modality. Error bars represent standard errors of the means.
Education 13 00426 g002
Figure 3. Teacher Estimates of the Percentage of Time Students Spent Off-task by Modality (Synchronous vs. In-person Pre-pandemic). Note: Mean percentage of time spent off-task by instructional modality. Error bars represent standard errors of the means.
Education 13 00426 g003
Figure 4. Parent (n = 103) Estimates of Lesson Duration by Subject (Math, English, Science) and Modality (Synchronous vs. Asynchronous). Note: Mean lesson duration by subject area and instructional modality. Error bars represent standard errors of the means.
Education 13 00426 g004
Table 1. Mean Child Enjoyment, Frustration, and Parental Stress During Virtual and In-person (Pre-pandemic) Instruction.
ModalityNM (SD)
Child EnjoymentVirtual1502.89 (1.40)
In-Person4.13 (1.06)
Child FrustrationVirtual1472.30 (0.90)
In-Person1.73 (0.72)
Parent StressVirtual1482.69 (0.89)
In-Person1.79 (0.78)
Note: Parents reported their children’s level of enjoyment (scale: 1 to 5) and frustration (scale: 1 to 4) while learning with higher scores indicating greater enjoyment/frustration. Parents also reported their stress-level (scale: 1 to 4) managing their children’s learning with higher scores indicating greater levels of stress. Reported values reflect pairwise deletion.
Table 2. Summary of consistencies and divergent findings in teachers’ and parents’ experiences for key research questions addressed in both Study 1 and Study 2.
Teachers’ Perspectives Study 1Parents’ Perspectives Study 2
Instructional modalityDuring a typical school week instruction was mostly synchronousSynch. instruction
75% (SD = 28%)
Synch. instruction
61% (SD = 31%)
Synchronous instruction was the primary modality across core subject areasMath (85%)
English (93%)
Science (76%)
Math (86%)
English (79%)
Science (70%)
Lesson
duration
Lesson duration varied by modality and subject areaSig. effect of:
   Modality
   Subject area
   Interaction
Sig effect of:
   Modality
   Subject area
Interaction = NS
Synch. > Asynch.Synch. > Asynch.
Synch.
Math > Science
English > Science
Math & English = NS

Asynch.
NS difference in duration by subject area
Across modalities
Math > Science
English > Science
Math & English = NS
AttentionPerceived difficulty level of managing children’s attention online differed77% somewhat or very difficulty32% somewhat or very difficult
Estimated time children spent off-task during virtual instruction32% 38%
Commonly endorsed attention management strategiesShort breaks (76%)
Modifying Instructional activity (70%)
Modifying duration (70%)
Short breaks (61%)
Rewards (48%)
Sources of off-task behavior during online instructionFamily > emojis, virtual background, technology, peers, toys, supplies

Family vs. Self = NS
Family vs. Chat box = NS
Self-distractions > emojis, chat box, virtual backgrounds, technology, peers

Self vs. Family = NS Self vs. Toys = NS
Self vs. Supplies = NS
Note. Dark blue shaded cells indicate consistent results across both Study 1 and 2, cells shaded in light blue indicate results that were partially consistent across studies, and cells with no shading represent findings that diverged across Study 1 and 2.
Disclaimer/Publisher’s Note: The statements, opinions and data contained in all publications are solely those of the individual author(s) and contributor(s) and not of MDPI and/or the editor(s). MDPI and/or the editor(s) disclaim responsibility for any injury to people or property resulting from any ideas, methods, instructions or products referred to in the content.

