
Development of Spatial Abilities of Preadolescents: What Works?


1
Faculty of Central European Studies, Constantine the Philosopher University in Nitra, 94901 Nitra, Slovakia
2
Ybl Miklós Faculty of Architecture and Civil Engineering, Óbuda University, 1146 Budapest, Hungary
*
Author to whom correspondence should be addressed.
Educ. Sci. 2023, 13(3), 312; https://doi.org/10.3390/educsci13030312
Submission received: 9 February 2023
/
Revised: 11 March 2023
/
Accepted: 14 March 2023
/
Published: 16 March 2023
(This article belongs to the Section STEM Education)
Abstract
:Creation in space and perception of spatial relations are important workplace skills that can be successfully developed in public education through the cooperation of art education, mathematics, and technology, the STEAM model that has been successfully employed in higher education. In a longitudinal school-based experiment, we enhanced the spatial skills of preadolescents through a STEAM-based educational programme. To design our methods of intervention in mathematics, visual arts, and information technology, we used the structure of spatial skills identified in previous studies. Developmental methods involved two- and three-dimensional visualisation tasks in real-life and virtual learning environments. We employed a pre- and post-hoc assessment design using a spatial ability task sequence standardised in Hungary that proved to be valid for assessing Slovak students as well. Authentic assessment tasks included real-life situations when visualisations of spatial relations were used for orientation and creation. Pre-test results showed significant differences between school classes: we identified high achievers and middle-to-low achievers. Our developmental programme was aimed at personalised talent development in the high-achieving classes and the general improvement of the performance of low achievers, raising insufficient pre-test results to an average post-test performance.
1. Introduction
1.1. The Relevance of Spatial Skills in Cognitive Development
Spatial cognition is connected to several areas of the increasing relevance of contemporary education. Most studies dealing with the issues of the enhancement of spatial cognition report on the performance of students of higher technical education. A reason for this could be that deficiencies in the development of visual-spatial abilities in public education become evident during engineering courses. In many cases, the successful completion of studies or professional practice is hindered due to the lack of spatial perception, visualisation, and planning skills [1]. Visual-spatial abilities are usually investigated in correlation with male and female performance. Gender-based differences, typically showing male advantages concerning strategies applied and performances, are widely recognised; however, there are excessive debates about the measures, types, and reasons for these differences [2,3]. Remedial educational interventions may reduce, in some areas, gender differences and counteract insufficient spatial skills development in public education [4]. However, such remedial courses are not readily available, so public education should provide more developmental opportunities for spatial perception and creation in space, which are essential workplace and life skills.
Spatial skills are typically developed through art education only and investigated in a narrow age range, with very few longitudinal developmental studies comparing the performance and characteristics of different age groups. Although many measurement tools are in use, their availability is limited, and only a small number are suitable for educational purposes [5]. The lack of evaluation results in skill deficits that typically emerge only in higher education or the labour market. Most educational research projects that aim at developing spatial skills are conducted in science disciplines and mathematics and rarely involve art education, the discipline that directly engages with the development of visual representation and perception [6]. The research presented here is a discipline-based effort to develop spatial skills through science, mathematics, information technology, and visual art disciplines. Being aware of existing, primarily discipline-based curricula, we did not integrate complete teaching–learning programmes but included spatial skills development modules in each.
For our developmental study, we selected four spatial subskills taught at the primary school level, which are part of the curricula of science disciplines, mathematics, and the visual arts and, as previous research shows, can be significantly developed in the course of two school years. The four subskills are as follows:
- (1)
- Visualisation: representation of spatial relations in two- and three-dimensional forms using traditional and digital tools and media.
- (2)
- Spatial orientation: locating objects and places in space.
- (3)
- Mental rotation: imagining the movement of an object in space.
- (4)
- Spatial (re)construction: creating spatial objects and reconstructing missing parts of objects in space.
These activities are regularly used in everyday life (such as map reading or cycling in traffic) and are important for many vocations and professions.
1.2. Potentials of the STEAM Model for Developing Spatial Skills
Our approach to developing spatial skills employs the STEAM model—teaching science, technology, engineering, mathematics (STEM), and visual arts in synergy. STEM as a curriculum design strategy is one of the most popular integrative models in education that has proven to support content knowledge acquisition and increase learners’ motivation [7]. A new area in research is the detection of the role of spatial skills in enhancing performance in STEM areas. Results by Reynolds, Piburn, Leedy, McAuliffe, Birk, and Johnson [8] suggest that performance in mathematics can be significantly enhanced through STEM education. LaForce, Noble, and Blackwell proved that such an approach significantly increases motivation in science and technology careers [9].
Several studies confirm that spatial skill tests are suitable for identifying giftedness in mathematics, technology, and natural sciences [10,11,12,13,14]. Activities that enhance spatial thinking may be implemented in a physical space with material objects or with the help of digital technologies with equal effect. The developmental effect is primarily affected by the regularity, duration, and quality of practice, not the medium of intervention. Improvements achieved by the intervention are usually persistent [11,12,13,14]. The significance of digital media in learning processes is probably going to increase in the years to come. This increase in research efforts in this area will lead to the development of more effective, scientifically grounded learning materials, increased student motivation, and personalised learning opportunities, thus improving skills required in the 21st century and making their assessment more authentic [15].
“STEAM” includes all the traditional STEM disciplines (science, technology, engineering, and math) and adds arts to expand the creative potential of the cluster. The expansion of the STEM model in the 2010s was reluctantly accepted for fear of “diluting” science disciplines with artistic activities. However, research soon proved otherwise [16]. Success stories of arts and science projects proved that “the STEAM movement is not about spending 20% less time on science, technology, engineering, and math to make room for art. Instead, it is about sparking students’ imagination and helping students innovate through hands-on STEM projects. Furthermore, perhaps most importantly, it is about applying creative thinking and design skills to these STEM projects so that students can imagine various ways to use STEM skills into adulthood” [17], n.p.
The contribution of the arts to science and mathematics has been revealed by network science that uses 3D visualisations to model and interpret complex relations and the rise of infographics from mere illustration to a cognitive tool. Another benefit of STEAM projects is that they seem more attractive and equally instructional for girls than those relying only on STEM disciplines [18]. Therefore, in the project reported here, we also included the arts and encouraged developers of our mathematics, science, and information technology modules for preadolescents to include creative tasks and visualisations in their programmes.
1.3. Research Questions of the Current Study
- Which spatial subskills can best be developed in pre-adolescence through remedial programmes?
- Do gifted students and those with learning challenges equally benefit from the programme? How do low and high performers develop?
- Do girls and boys equally benefit from the same teaching–learning programme, or do they need different interventions?
- Authentic and easy-to-use in classroom testing tools are essential for regular assessment of the quality of instruction. However, are the assessment instruments standardised in Hungary applicable to Slovak students?
1.4. Significance of the Current Study
This is a longitudinal developmental study based on the STEAM model in a new educational design, easier to adapt for public schools: inclusion of interdisciplinary content in disciplinary curricula. As most of the learning programmes reported are project-based, short-term, intensive interventions carried out within a few weeks or months, our methodology has more adaptability potential. Most reported school-based programmes were only evaluated through quantitative measures without qualitative inquiry for deeper insights into classroom processes [19], so we decided to use both quantitative and qualitative assessment methods.
Aiming at a flexible programme for talent development but also accessible for students with learning challenges, we described our learning content and methodology to suit both ends of the educational spectrum. Our modules managed to support the development of talented students and enhance the spatial performance of those with learning difficulties, primarily disadvantaged students for whom spatial skills development may mean entry to a wide range of vocations. Using both traditional and digital technologies for developing spatial abilities, we offer a wide range of developmental options for schools with different facilities.
2. Research Sample and Developmental Methods
2.1. Sample: Three Educational Institutions
Three educational institutions in three different sociocultural settings in the Slovak Republic (School 1 in the medium town of Nové Zámky, School 2 in the small town of Kolárovo, and School 3 in the fifth largest city in Slovakia, Nitra) participated in the study. Two parallel classes were involved in the spatial skills development experiment in each school. A total of 118 students participated in the pre-tests (October 2020), and 103 took the post-tests; some took only one of the two tests in one of the testing periods, and for this reason, their datasets were incomplete. Therefore, for the analysis of results, we considered 100 students (50 boys and 50 girls) who completed the tests in both iterations.
2.2. Methods
The experiment was realised for two school years, 2020/21 and 2021/22, and involved school Grades 5 and 6 and age groups 11 and 12. Both teaching and learning cycles were heavily influenced by school closures because of the COVID-19 pandemic and included activities that students performed on their own or in online groups. However, as the programme developer-researchers and the teachers of all disciplines employed digital learning tools and creative applications also in the face-to-face periods and taught students how to use them on their own, the developmental process was interrupted only for short periods, at the beginning of school closures, when homeschooling had to be organised.
Both treatment types involved the same disciplines: Information Technology, Mathematics, and Art Education (a discipline focusing on the visual arts and design). In accordance with the STEAM model, all disciplines were taught separately, according to the Slovak National Curriculum for Basic Schools, and employed the methodology of inquiry learning, a pedagogical approach that is best suited to the real-world relevancy and career-readiness focus of STEM: “an iterative, student-centred learning process that involves making observations; posing questions; examining books and other sources of information to see what is already known; planning investigations; reviewing what is already known in light of experimental evidence; using tools to gather, analyse, and interpret data; proposing answers, explanations, and predictions; and communicating the results” [7], (p. 23). Discipline-based methods illustrated by examples of content areas and project tasks are summarised below.
The school experiment was realised in the 5th and 6th grades of six primary schools, in the teaching programmes of mathematics, computer science, and art education. A few selected programme units are described below to show the structure and methodology of the development processes (cf. [20,21,22,23,24,25,26] for more details on discipline-based development). Many activities include several tasks based on the same topic but with different difficulty levels. We tried to ensure that each task is as consistent as possible with the Slovak National Curriculum. Thus, our programme can easily be integrated into the educational process. The following summaries of selected activities in three disciplines (Informatics, Mathematics, and Art Education) involved in the developmental process give an insight into the activities designed to develop a wide range of spatial skills.
2.2.1. Informatics
In Grades 5 and 6, themes involve social issues of the information society (such as misconduct in cyberspace or disregard of copyright regulations), proper use of selected hardware and software tools and applications, methods of digital communication and representation, and information and communication technology (ICT) tools [27]. Although we did not find thematic areas focusing on spatial skills only, spatial subskills may be identified even if the thematic unit discusses algorithmic problem solving. Below we present two activities that illustrate how spatial skills development is supported by tasks that target both this area and the use of ICT tools. The first activity is realised in a two-dimensional (2D) environment; the second invites students to work in a three-dimensional (3D) space. The two activities build closely on each other, trying to show the transition between 2D and 3D realities.
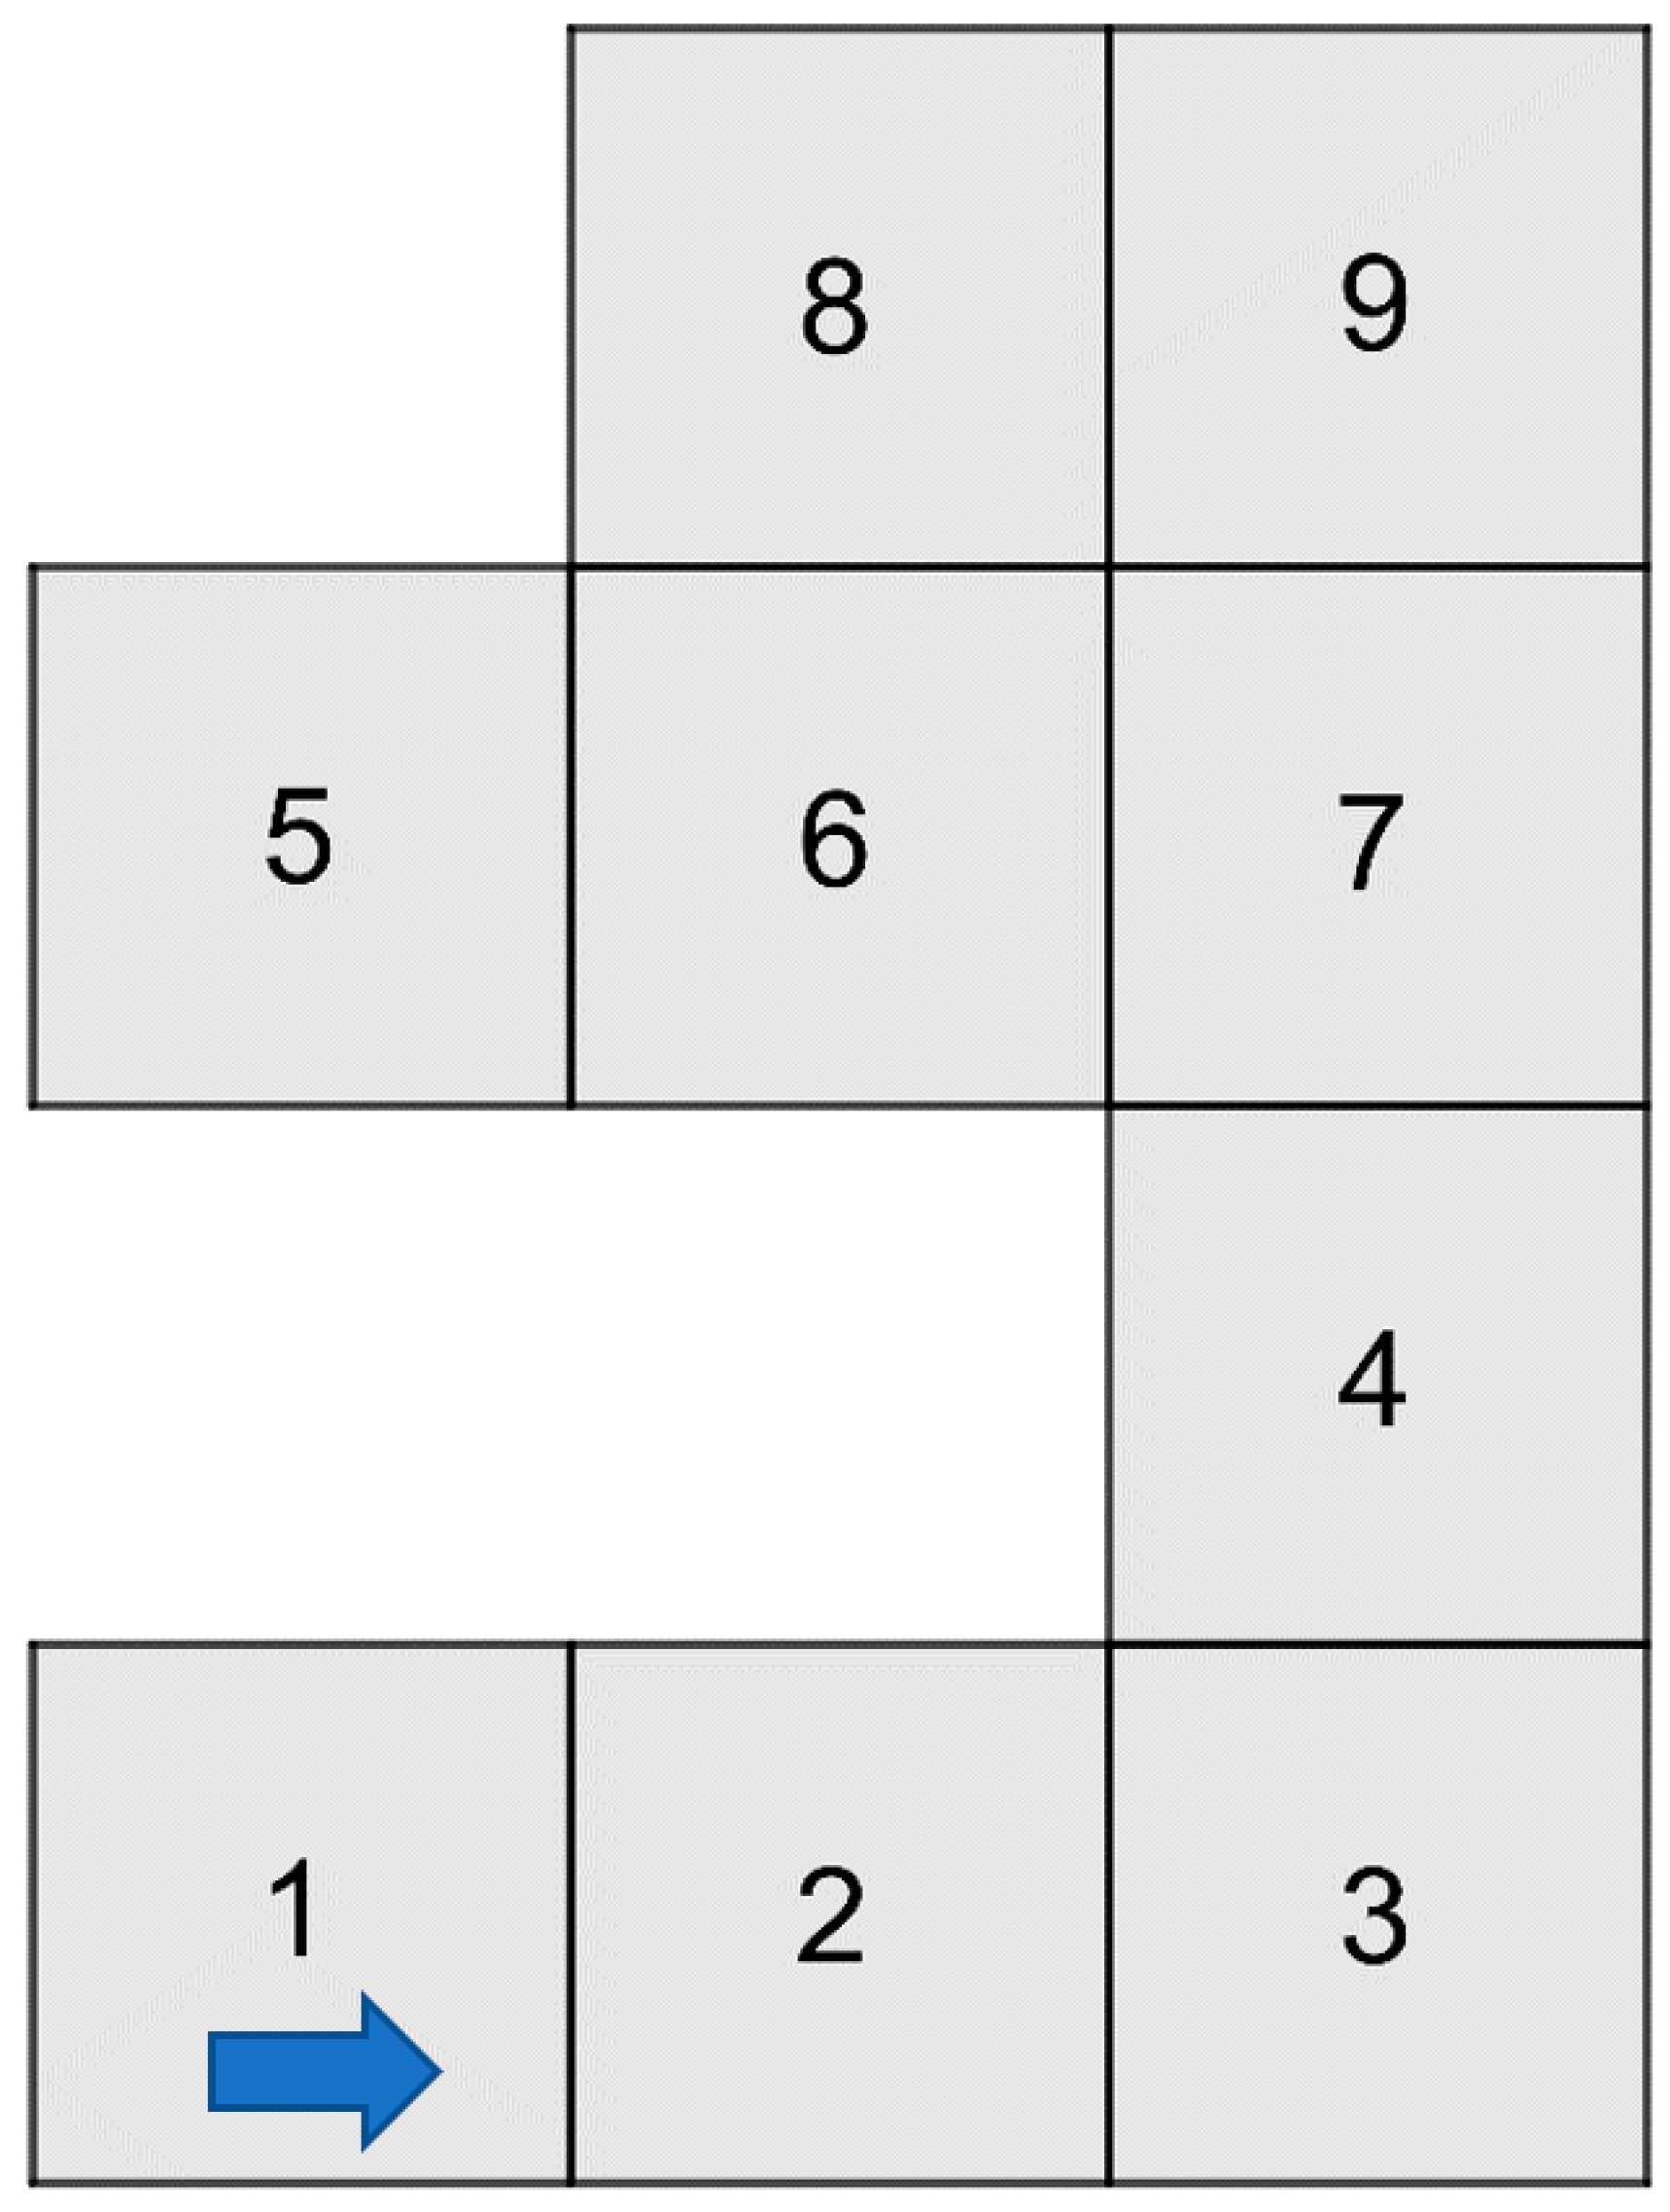
In the “Squares” activity, students play a board game and “walk through” the planar shapes generated from squares, making only one step in each square. The activity includes five tasks of different difficulty levels (see Figure 1). Moving from one square to another is possible only if they have adjacent (common) sides. For each task, the starting position and directions are marked. Three simple commands can be used to step (fw = forward, rt = right, and lt = left). Each square is numbered to record the path algorithm for easy and clear reference. The ideal way to record the algorithm is in table form, with the numbers representing the squares in the first row and the corresponding instructions below. However, the order of moves (the routes) is often recorded as a shape. The teacher’s task is to explain the simple rules to the students, and they solve the first task together to see if they understand the rules. During the discussion of results, attention should be drawn to the repetition of certain command blocks. Depending on that, they can even simplify the algorithm of their routes.
This is the description of the Space Cubes task: “The station of the Space Cubes is undergoing maintenance. One of the astronauts is tasked with checking the condition of the station’s outer surface. The station is shaped like a cube; the astronaut will step onto the station’s surface on one side, where he/she will use magnetic boots during the inspection. These special boots will ensure that he/she can perform the inspection standing up as if walking. Oxygen is of enormous value and should not be wasted in space. Find a path for the astronaut so that he/she does not cross any of the sides twice!” [26].
The spatial skills development activity sequence includes five tasks (see Figure 2) and an additional bonus task that is more difficult than the previous ones. On the test sheet, the shapes of the task described above are created in the GeoGebra software. However, a graphical design more pleasing for the 11–12-year-olds is planned for a second iteration of the project. The five tasks are similar to the planar activity described above. While testing the task environment through a pilot task that the teacher and the students solve together, it is important to note that the pupils can rotate the spatial shapes, which helps them find the right solution.
Students represented operations that require spatial manipulation (e.g., to indicate the proper arrangement of a group of objects in space) with visualisation tools such as Paint 3D, GeoGebra, LEGO Digital Designer software, or the Oculus Quest 2 hardware device, all familiar with the Slovak teachers of Informatics. The Oculus VR headset was used to experiment with the task sequence entitled “Cubism”, an edutainment application such as a 3D version of the well-known computer game called Tetris. While working on a task sequence, students may save their assignments in Paint 3D or another graphic programme as a project and then open and edit it. They may also save their assignment as an image or animation and use the tools for drawing or painting, creating planar and three-dimensional structures utilising the 3D library. From this library, they may choose objects to model spatial problems described by their teacher: design a game and select, copy, insert, cut, or delete items. They may assemble the items correctly, manipulate objects, move them, and create mirror images. By changing the colours of the items, they may create groups of objects representing different spatial relations. Students may even use these graphic options to design the letters of their names, applying block algorithms to manipulate avatars within a scene.
With the spatial orientation tasks, students are invited to devise instructions to pass through a labyrinth or find their way while driving their virtual car through a complex highway system. Other spatial orientation tasks use appropriate instructions to carry a cart through winding roads; mentally rotate simple spatial figures that consist of equal-sized cubes; use VR technology; and navigate in virtual space. Spatial orientation often means interpreting different modalities, so students were introduced to commands that help navigate in space: solve a problem by putting commands into a sequence; apply the rules of language construction to compose a sequence of commands; interpret a sequence of commands; recognise repeating patterns when solving a given problem; determine the number of repetitions using a value; and interpret algorithms with loops.
All these tasks involve spatial operations in real-life settings and thus integrate skill development with modelling authentic situations where they will be needed.
2.2.2. Mathematics
Geometry is an integral part of the mathematics curriculum, so one would think that there would be an appropriate emphasis on developing spatial skills in this thematic area. However, the national curriculum for 5th- and 6th-grade students mainly covers plane geometry topics [28]. Although students learn to distinguish between spatial shapes (such as a cube, cuboid, cylinder, cone, or square pyramid), they learn only about cubes and cuboids in more detail. (All other shapes are briefly mentioned and demonstrated in 2D and 3D formats.) The cube is discussed in Grade 7, the cuboid in Grade 8, and the cylinder, cone, square pyramid, and sphere are in the curriculum content for Grade 9 only. However, all these geometric shapes occur in real life and are often manipulated well before their characteristics are acquired at school. Therefore, we could base our developmental programme, briefly outlined below, on the hands-on experiences of our students.
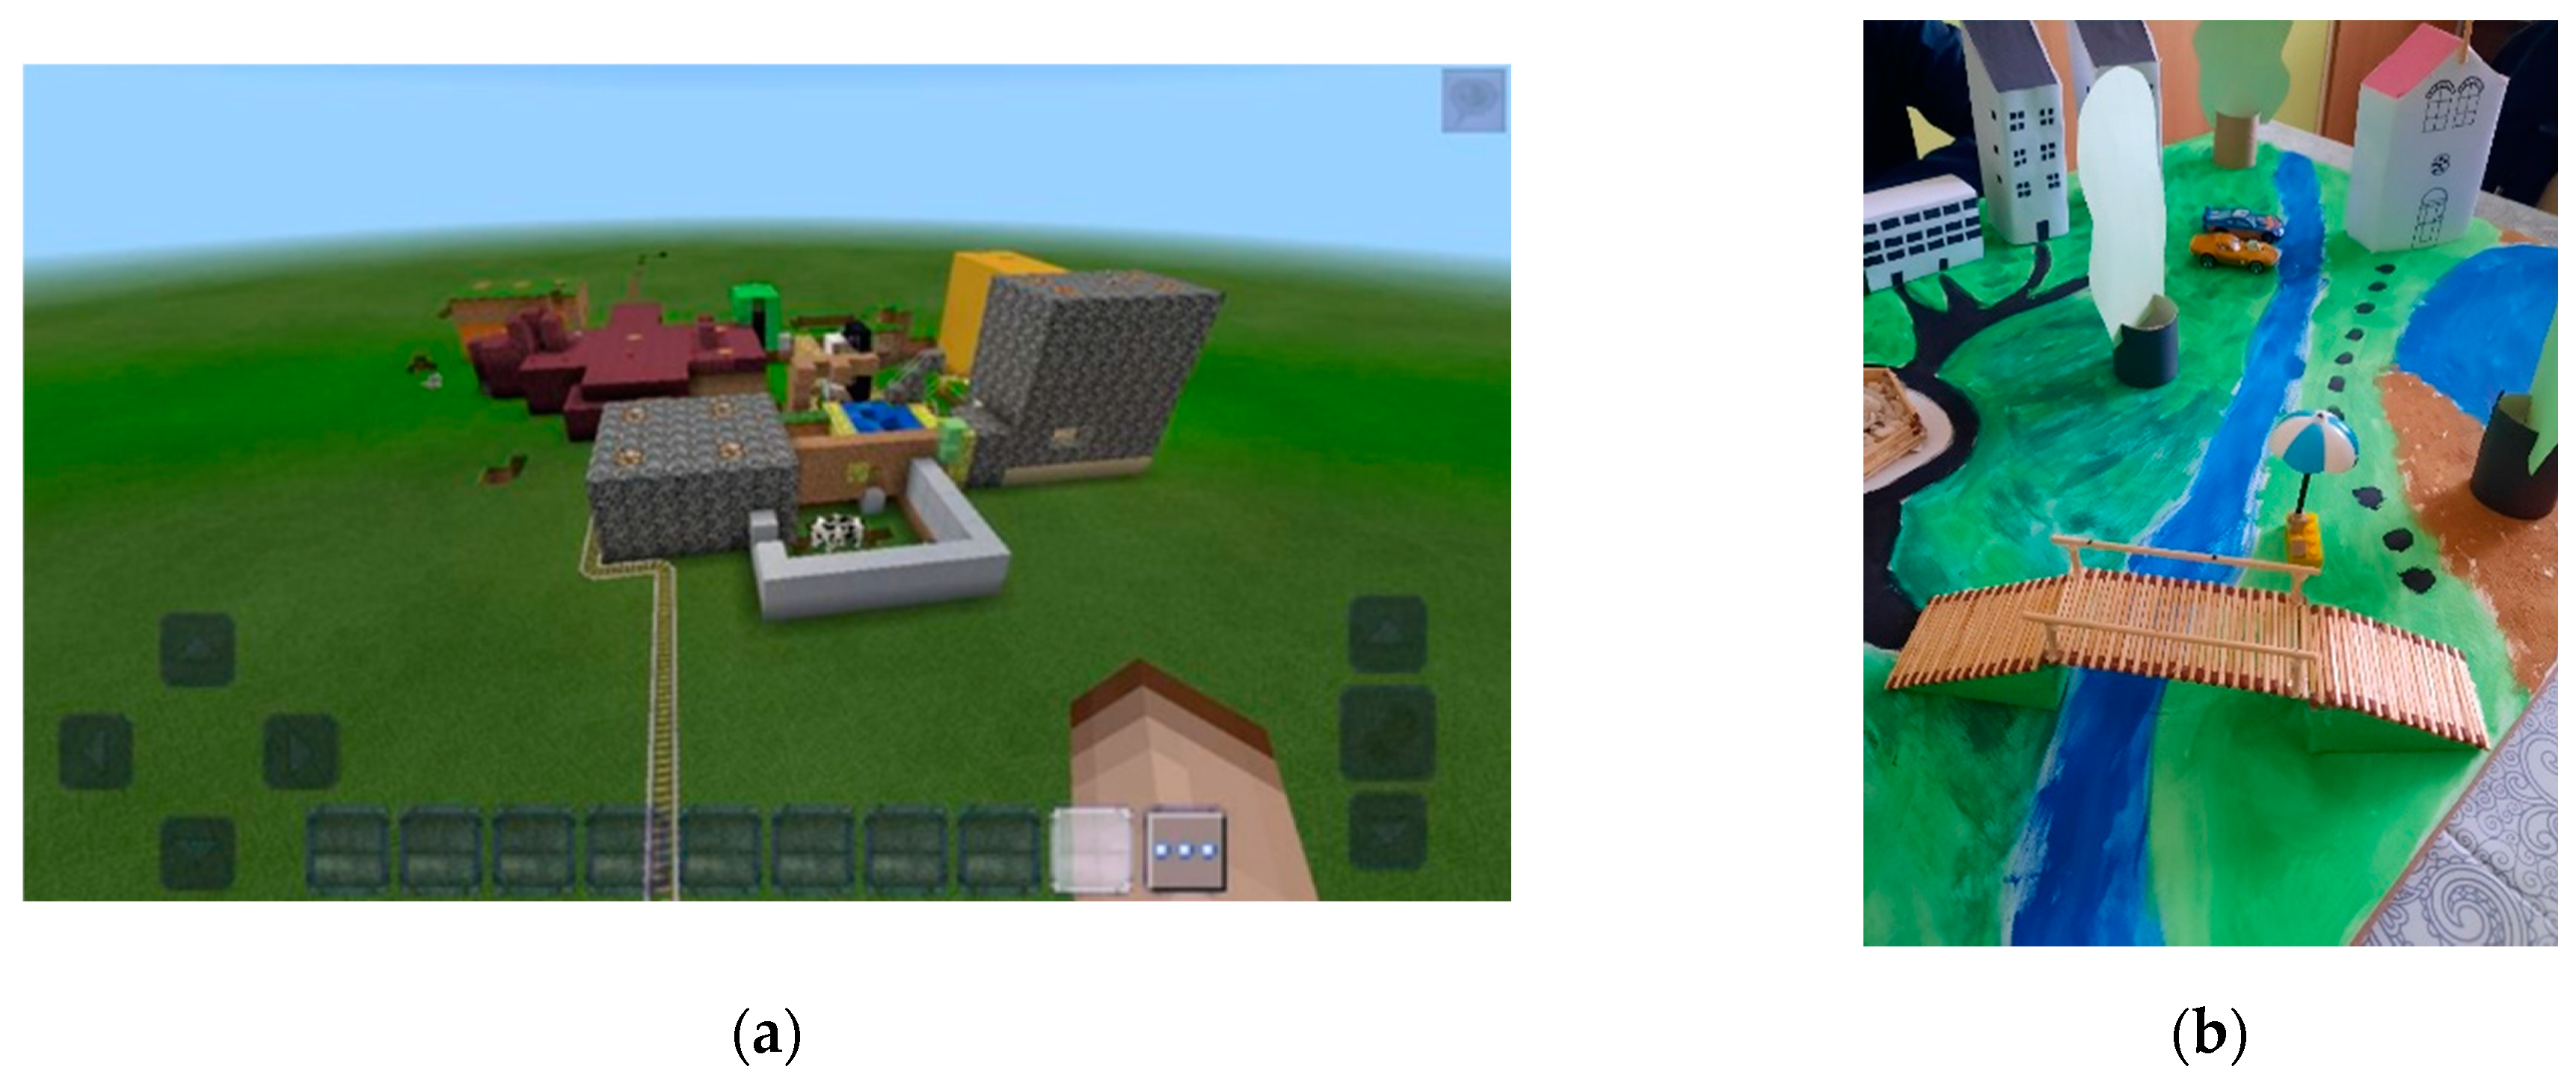
Spatial imagination, representation, and construction skills are developed through the “Plan and Build Your Own Imaginary City!” activity; children are asked to imagine, design, and build a large settlement (see Figure 3). The task defines some environmental features, such as a river that crosses the city, so bridges need to be built. The city should include at least one bridge, a tower, a skyscraper, a suitable road network, enough dwellings to avoid crowded living conditions, and at least one installation that addresses the needs of climate change, such as an air pollution filter shaped as a dome. Additional criteria: buildings in the city must have at least ten vertices and six faces and be pentagonal.
Work on the task begins with a sketch of the city plan, and the construction of a model based on the design using sticks and plasticine (possibly paper) should be prepared. Modality change, a complex and difficult-to-acquire spatial subskill, is involved here. Students should consider a wide range of healthy living and nice townscape criteria, such as the size, shape, colour, and texture of neighbouring buildings. As in the Informatics experiment, new concepts were introduced that helped acquire spatial perception, representation, and creation rules. While students presented their ideas based on their experiments with 2D and 3D urban design basics, the teacher introduced precise mathematical terms to define the shapes and their interrelations.
Using computer-supported tools in Mathematics was not a general practice before 2019. However, due to online learning habits induced by the COVID-19 pandemic resulting in predominantly online education in 2020–2021, students did not face grave learning problems with our tasks that required software use. On the contrary, they sometimes used computers (e.g., the collaborative gaming environment Minecraft to build a city) to solve a task even when they could have solved it without it—mainly. Using digital tools for learning gradually became just as natural and efficient a way of acquiring knowledge as learning from textbooks and teacher presentations. We experienced the growth of digital skills as an asset during the experimental teaching period (2020–2022) and introduced a series of new science visualisation software that was both motivating and instructive.
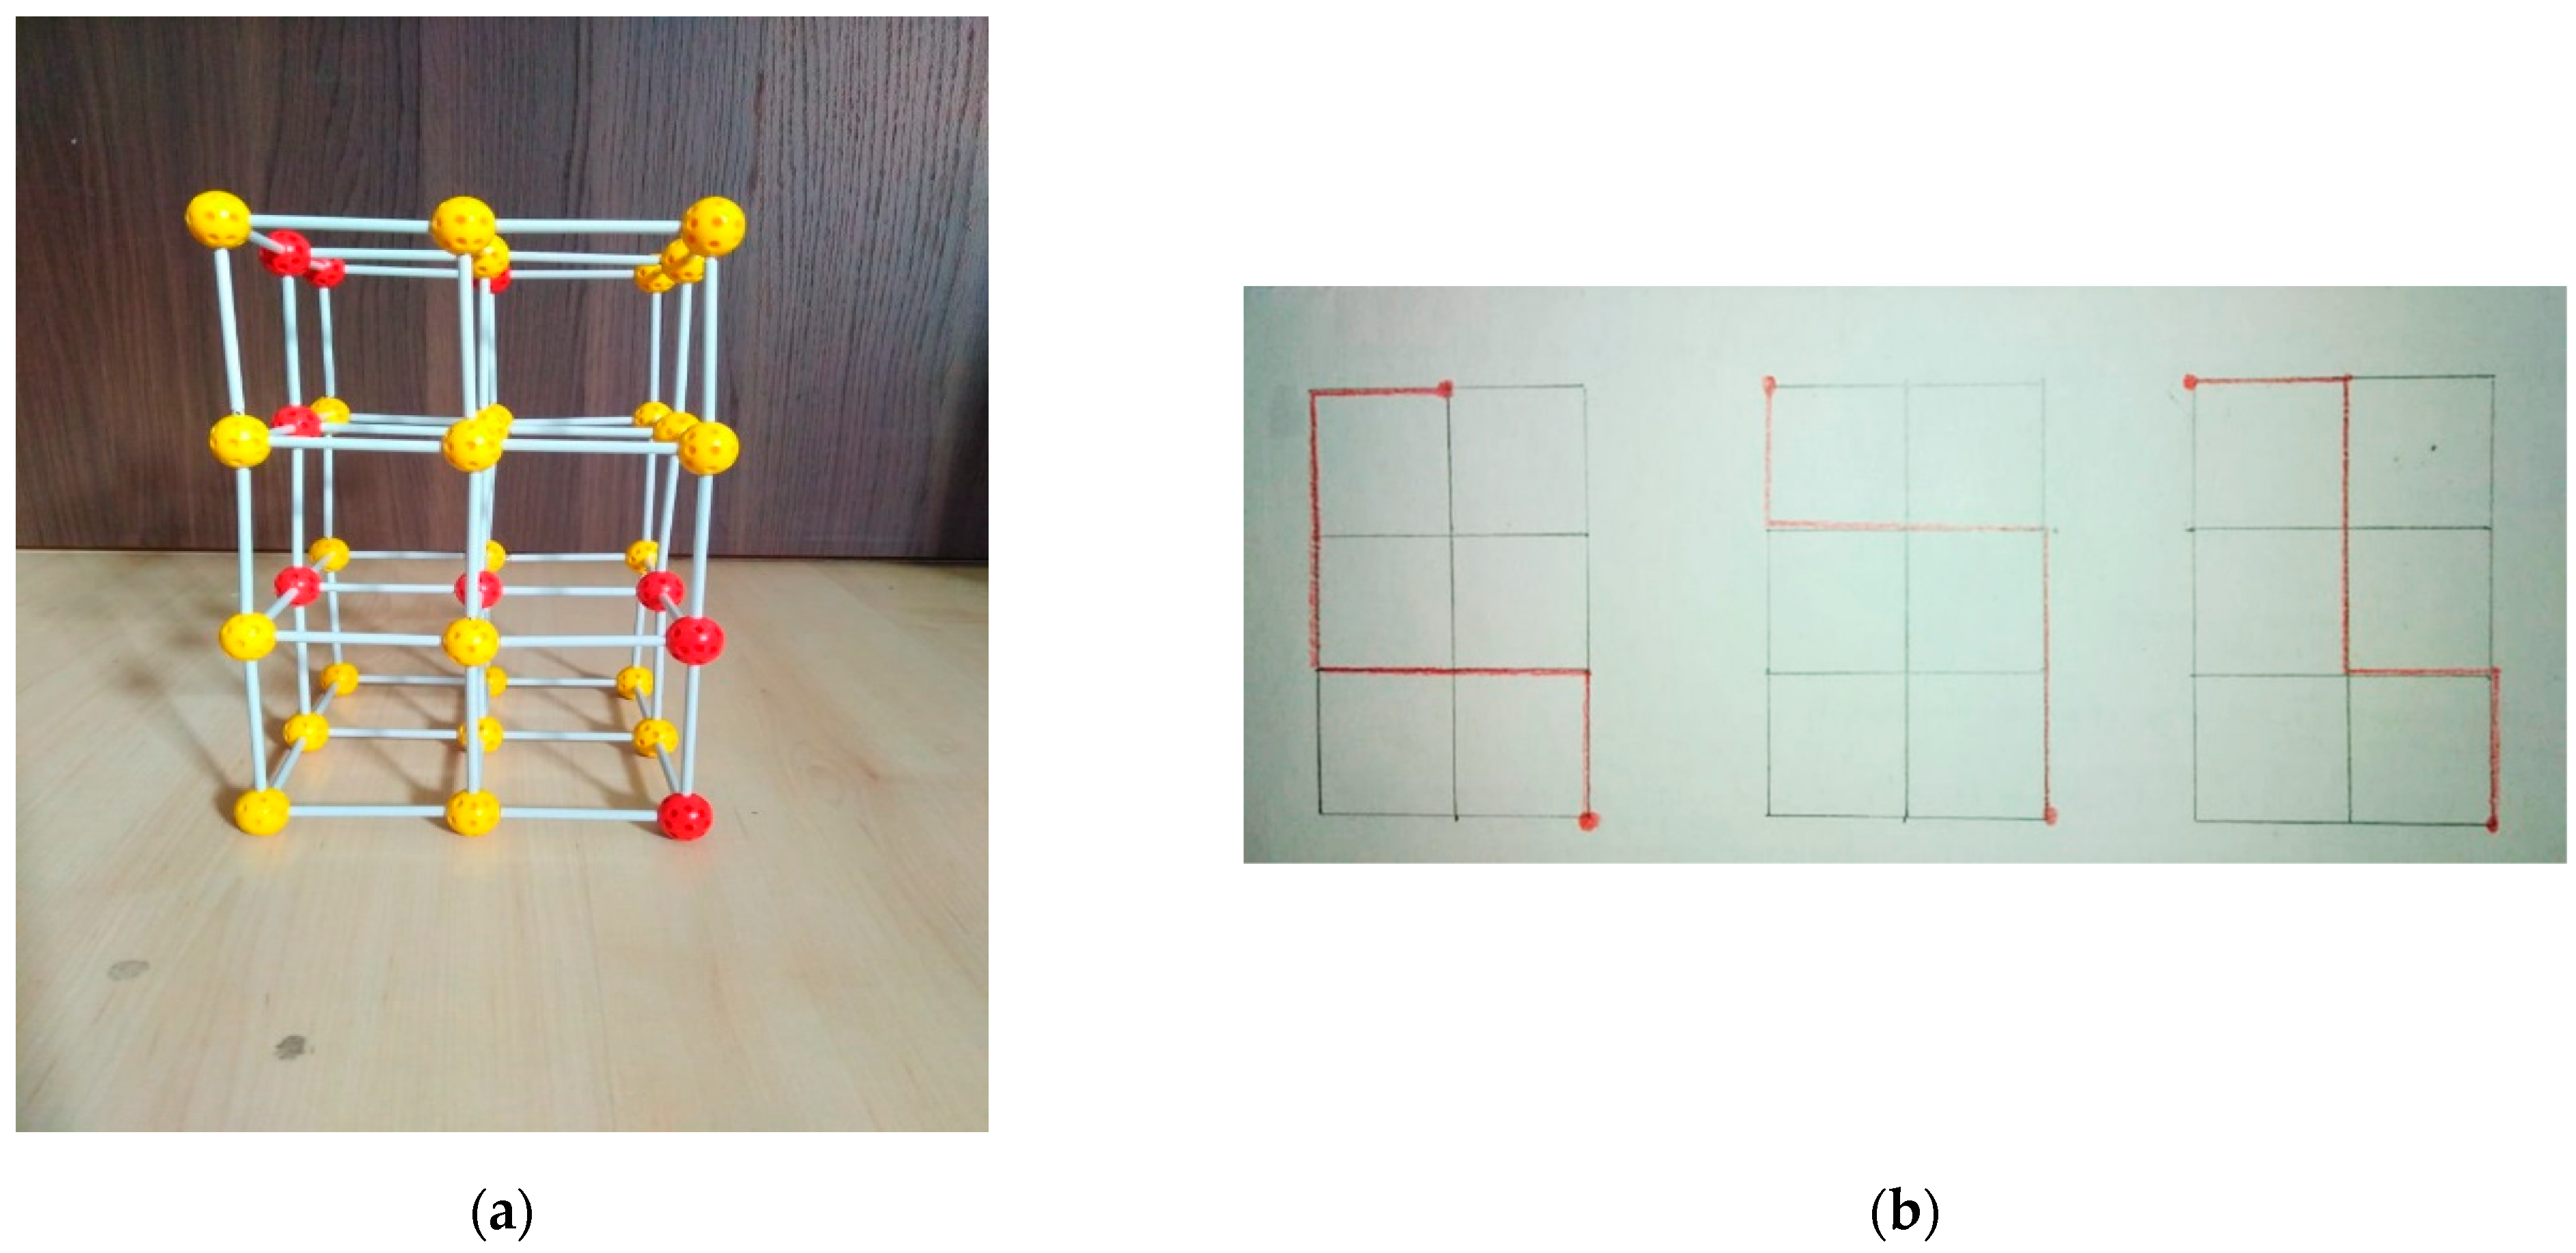
The following sequence of activities to develop spatial skills during Mathematics education was called “Cubes” and was based on a simple building toy that includes cubes of different colours and sizes. There were twelve tasks in this activity. Another building game, Kugeli, included seven tasks with gradually increased difficulty levels. In the first exercise, only plane shapes have to be created, which are then defined through the language of mathematics. In higher-level tasks, written and/or visual instructions must be followed to create constructions in space. Task 6 is quoted here as an example (see Figure 4).
The following educational objectives about the development of spatial skills were set and realised: developing spatial perception through identifying spatial analogies; use of drawing as a cognitive tool: interpreting spatial relations; developing visual imagination; recognising and drawing buildings from a different angle through the rules of linear perspective through the interpretation of 2D layouts and 3D objects; modality change: drawing and modelling two- and three-dimensional geometric shapes; conceptual enhancement: expansion of the mathematical vocabulary of students through observing and describing basic properties of spatial shapes; learning to estimate distances; learning to recognise positions in simple and complex spaces (a room, a flat, a city centre); and developing their logical reasoning skills through solving spatial orientation tasks.
2.2.3. Art Education
The development of spatial abilities is one of the major thematic areas of the national curriculum in Slovakia [29]. The central objective of this discipline is creativity development through the acquisition of a wide range of expressive techniques and media. Digital creation is part of this artistic repertoire, so the developmental programme included traditional and digital creative methods and tools as well. A unique developmental method for spatial perception was the creation of anaglyph images. This visualisation method creates a stereoscopic 3D effect that encodes each eye’s image using filters of chromatically opposite colours (e.g., red and green). The resulting anaglyph 3D image provides two coloured images filtered differently, one for each eye. Special, colour-coded “anaglyph glasses” are needed for an integrated stereoscopic image. With the help of these glasses, the brain’s visual cortex fuses the image seen by both eyes into a three-dimensional scene or composition. Thus, students may experience seeing spatial relations and better understand the relationships between 2D and 3D representations.
Tasks of the developmental programme focused on the four subskills selected for development. Topics embodied authentic problems that students may encounter in everyday life and find motivating to experiment with:
- (1)
- Visualisation: representation of spatial relations in the home, on the student’s desk; designing and modelling a toy; and developing anaglyphic images.
- (2)
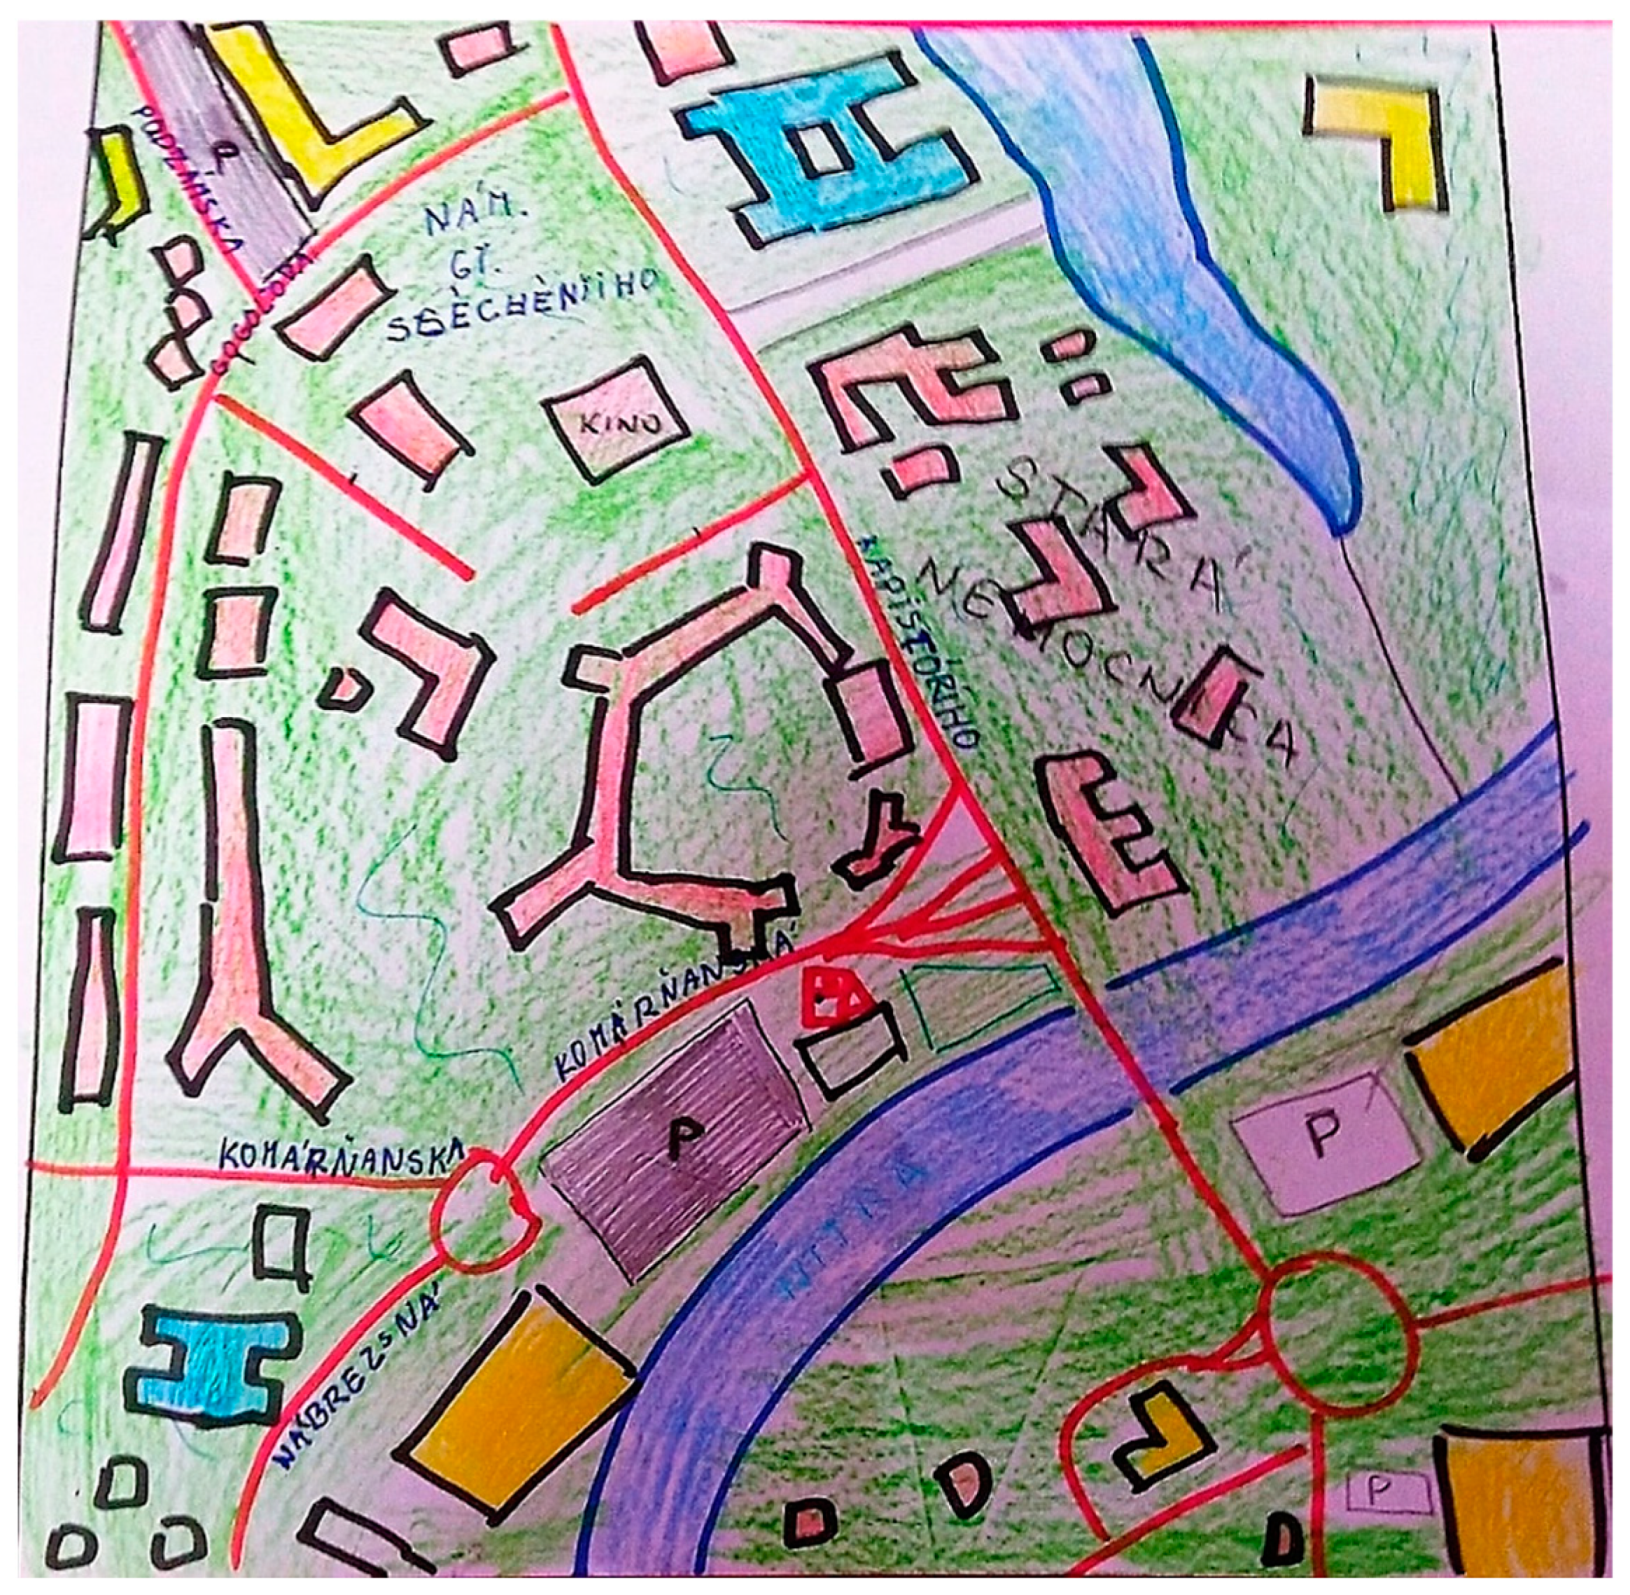
- Spatial orientation: map making and map reading: locating objects in the immediate built environment, creating imaginary spaces, and providing maps for them.
- (3)
- Mental rotation: imagining the movement of an object in space and representing it in two-dimensional form.
- (4)
- Spatial (re)construction: reconstruction of missing parts of a cityscape: adding buildings to a street and matching its historical or contemporary style; adding furniture to a living space and considering the objects and the space they occupy, the space they need to use, and their visual qualities to create a functional and aesthetic effect.
As most of the school years 2019/20 and 2020/21 were taught through e-learning, the studio atmosphere necessary for acquiring representational conventions of space could only be shown but not explained in detail through corrections and observation of peers’ work. Nevertheless, students benefited from closely observing and representing their living environment (see Figure 5 and Figure 6) and were motivated to develop their digital design and photography skills.
3. Assessment Method: Spatial Skills Task Sequence and Creativity Test
To assess the results of skill development programmes, we employed a spatial skills task sequence that was piloted and is regularly used in Hungary [30,31]. In Slovakia, teachers were provided with manuals that explained the administration of the tasks. In the pre-tests, taken in October 2020, and the post-tests, taken in May 2022, we used the same set of tasks (see Figure 7). The teacher projected the tasks, and the students used an answer sheet to draw, colour, or select their responses from several options. All students completed a survey that recorded the frequency of school-based and free-time activities for which previous research revealed connections with the developmental level of spatial activities. Teachers were informed about their students’ performance at the end of both testing cycles and discussed the educational implications of results with the developers of the educational programmes. The solutions of the spatial task sequence and the creativity test were scored and evaluated by the research team, but after the post-tests, teachers received scoring guides and started using the tasks and the test for regular assessment of student performance.
The pre-tests showed significant differences among the performances of the classes. Therefore, two teaching–learning programmes were developed by the research team: one for skill enhancement (the enhancement of spatial skills of students with average and above-average pre-test performance, 51 participants) and one for skill development for those who, according to their pre-test results, had to acquire the basics of spatial perception and creation, before continuing to higher-level tasks (49 participants; see Table 1).
3.1. Spatial Skills Test
The tasks targeted four clusters of spatial skills: (1) visualisation, (2) reconstruction of space (only in Grades 8–12), (3) spatial orientation, and (4) mental rotation. In addition, the tasks contained spatial problems for visualising spatial relations (involving subskills necessary for technical vocations and professions and included in the curricula of Mathematics and Art Education), for example, spatial cognition, interpretation, and manipulation tasks, as well as the knowledge of spatial representation systems and conventions (e.g., Monge projection system, engineering drawing). Sample tasks with solutions preceded each task type to guide students’ thinking processes.
The survey that supplemented the spatial tasks targeted the background variables that previous research revealed as essential for developing spatial perception. It contained ten questions with 32 items. We asked for the students’ demographic data (e.g., age, gender) before they solved the tasks, and the rest of the questions followed the completion of the test. Most background questions were multiple-choice items. Open-ended questions were not provided due to limited testing time. The survey questions revealed the effect of certain activities on developing spatial skills. Data about students’ marks in selected disciplines may have been related to their success in comprehending and solving the tasks (Art Education, Mathematics, and Mother Tongue). We invited them to share their opinion concerning the task sequence and asked about biological characteristics that may affect their performance, such as right- or left-handedness and colour-blindness. (The effects of background variables on performance will be discussed in another paper.)
The inner consistency of the tests was verified with the values of item omission reliability and item–test correlation (Pearson correlation coefficient). According to previous research referenced above, our tests have appropriate inner consistency, and all of our assignments contribute to the determination of spatial skills to a significant extent.
3.2. Creativity Test
In this study, we used the Test for Creative Thinking/Drawing Production (TCT/DP), an instrument developed by Klaus Urban and Hans Jellen, standardised and regularly used in 19 countries [32]. This instrument requires the completion of visual elements arranged to enable (but not necessarily require) various forms of spatial representation. The TCT/DP requires more flexibility of thought and imagination than manual dexterity. The test taker is invited to complete a picture utilising the given fragments within a given time limit. The frame of the test resembles the usual picture frame format and thus evokes the atmosphere of the conventional drawing class and diminishes the inhibiting “testing situation”. The test has two identical parts, A and B, each providing six pictorial fragments (five within a frame, one outside it). The two versions are identical in complexity and have been used for pre- and post-testing developmental interventions such as the project reported in this paper [33].
Visual stimuli to be completed are both culturally and visually neutral: they do not impose stereotypical images or emotionally biased narratives on the test taker. The culture-free nature of the test elements has repeatedly been proven, and we encountered no problems with the Slovak sample. The pictorial elements to be used or completed may be processed in a variety of visual idioms: in a realistic or non-figurative picture or in a caricature, decorative ornament, design, or plan or may opt for a non-cohesive set of images or signs. Assessment criteria include the number of elements completed, the cohesion of the images, and the quality of spatial representation, originality, flexibility, and humour.
3.3. Data Collection and Analysis
Data were collected on paper for the spatial skill test, the related background questionnaire, and the creativity test. When analysing the results, the data obtained in the survey were repeatedly compared with those of a previous Hungarian survey (carried out between 2017 and 2020) using the same tests. For the Hungarian sample, the spatial skill test and the related background questionnaire were collected online using the eDia platform. eDia is an Electronic Diagnostic Assessment System developed by the Research Group for Educational Theory at the University of Szeged in the framework of the project “Developing Diagnostic Assessments” (for more information about the system, see the project website edia.hu (accessed on 10 March 2023) [34]. In the analyses, we use the term “paper-based” for the Slovak sample and “digital” for the Hungarian sample to separate the data.
We used MS Excel and SPSS to organise our data and conduct analyses using classical test theory and statistical methods in our research. In order to verify the reliability of the tests, we used Cronbach’s α index, which is standard in social science research, and filtered out items that did not perform well using the separation index. Descriptive statistics were used to present the main characteristics of the data collected in the survey. Paired and independent samples t-tests and analysis of variance (ANOVA) were used to compare the means of the pre- and post-test performances, and correlation tests were used to analyse the relations. Cohen’s d ratio was used to calculate the average effect size of the development programmes. The relationships between tasks were explored using cluster analysis. The analysis compares the hypothesised structure (spatial subskills, abstract and figurative renderings, complexity of spatial operations) with dendrograms that visually represent the structure of the measurement tool.
4. Results of Testing Spatial Abilities
4.1. Evaluation of Pre- and Post-Test Results in Grades 5 and 6 in the Two Groups
Results of previous school-based experiments indicate that the spatial ability tests we employed to detect the development of this skill cluster through interventions in Information and Communication Technologies, Mathematics, and Visual Arts are reliable instruments. Furthermore, introducing the assessment tool through paper-based test sheets or digital images makes no difference. Students easily adapt to both types of instruments, and the reliability levels of both test formats are adequate (Cronbach’s alpha of the paper-based test is 0.88, and Cronbach’s alpha of the online test version is 0.83, cf. also Table 2).
Table 3 shows pre- and post-test results of the two age groups of the experiment undertaken in Slovak schools compared to a Hungarian sample of the two age groups. As expected, fifth-graders scored about 50% points on the pre-test (paper-based test: M = 53.30%, digital test: M = 53.36%). In both test types, there are students with maximum scores and those who could not solve any of the tasks. By the end of the sixth grade, students’ performance increased significantly (M = 79.00%).
Grade 5 has almost equal proportions of below 50% (51% of students) and above 50% (49% of students) performances in the test results distribution. In this age group, the frequency of averages rises to between 20% and 90%. The 20% result is typical because many students could only solve the two simplest problems, the elementary spatial operations, without errors. (In the Hungarian survey, a similar distribution pattern was found in the fifth grade.) In Grade 6, the averages are higher, with the greatest frequency observed in the 90% results. The distributions of the results for the two grades and the relatively large standard deviations indicate significant differences in individual performance.
4.2. Evaluation of Results by Tasks of the Pre-Test (Grade 5) and Post-Test (Grade 6)
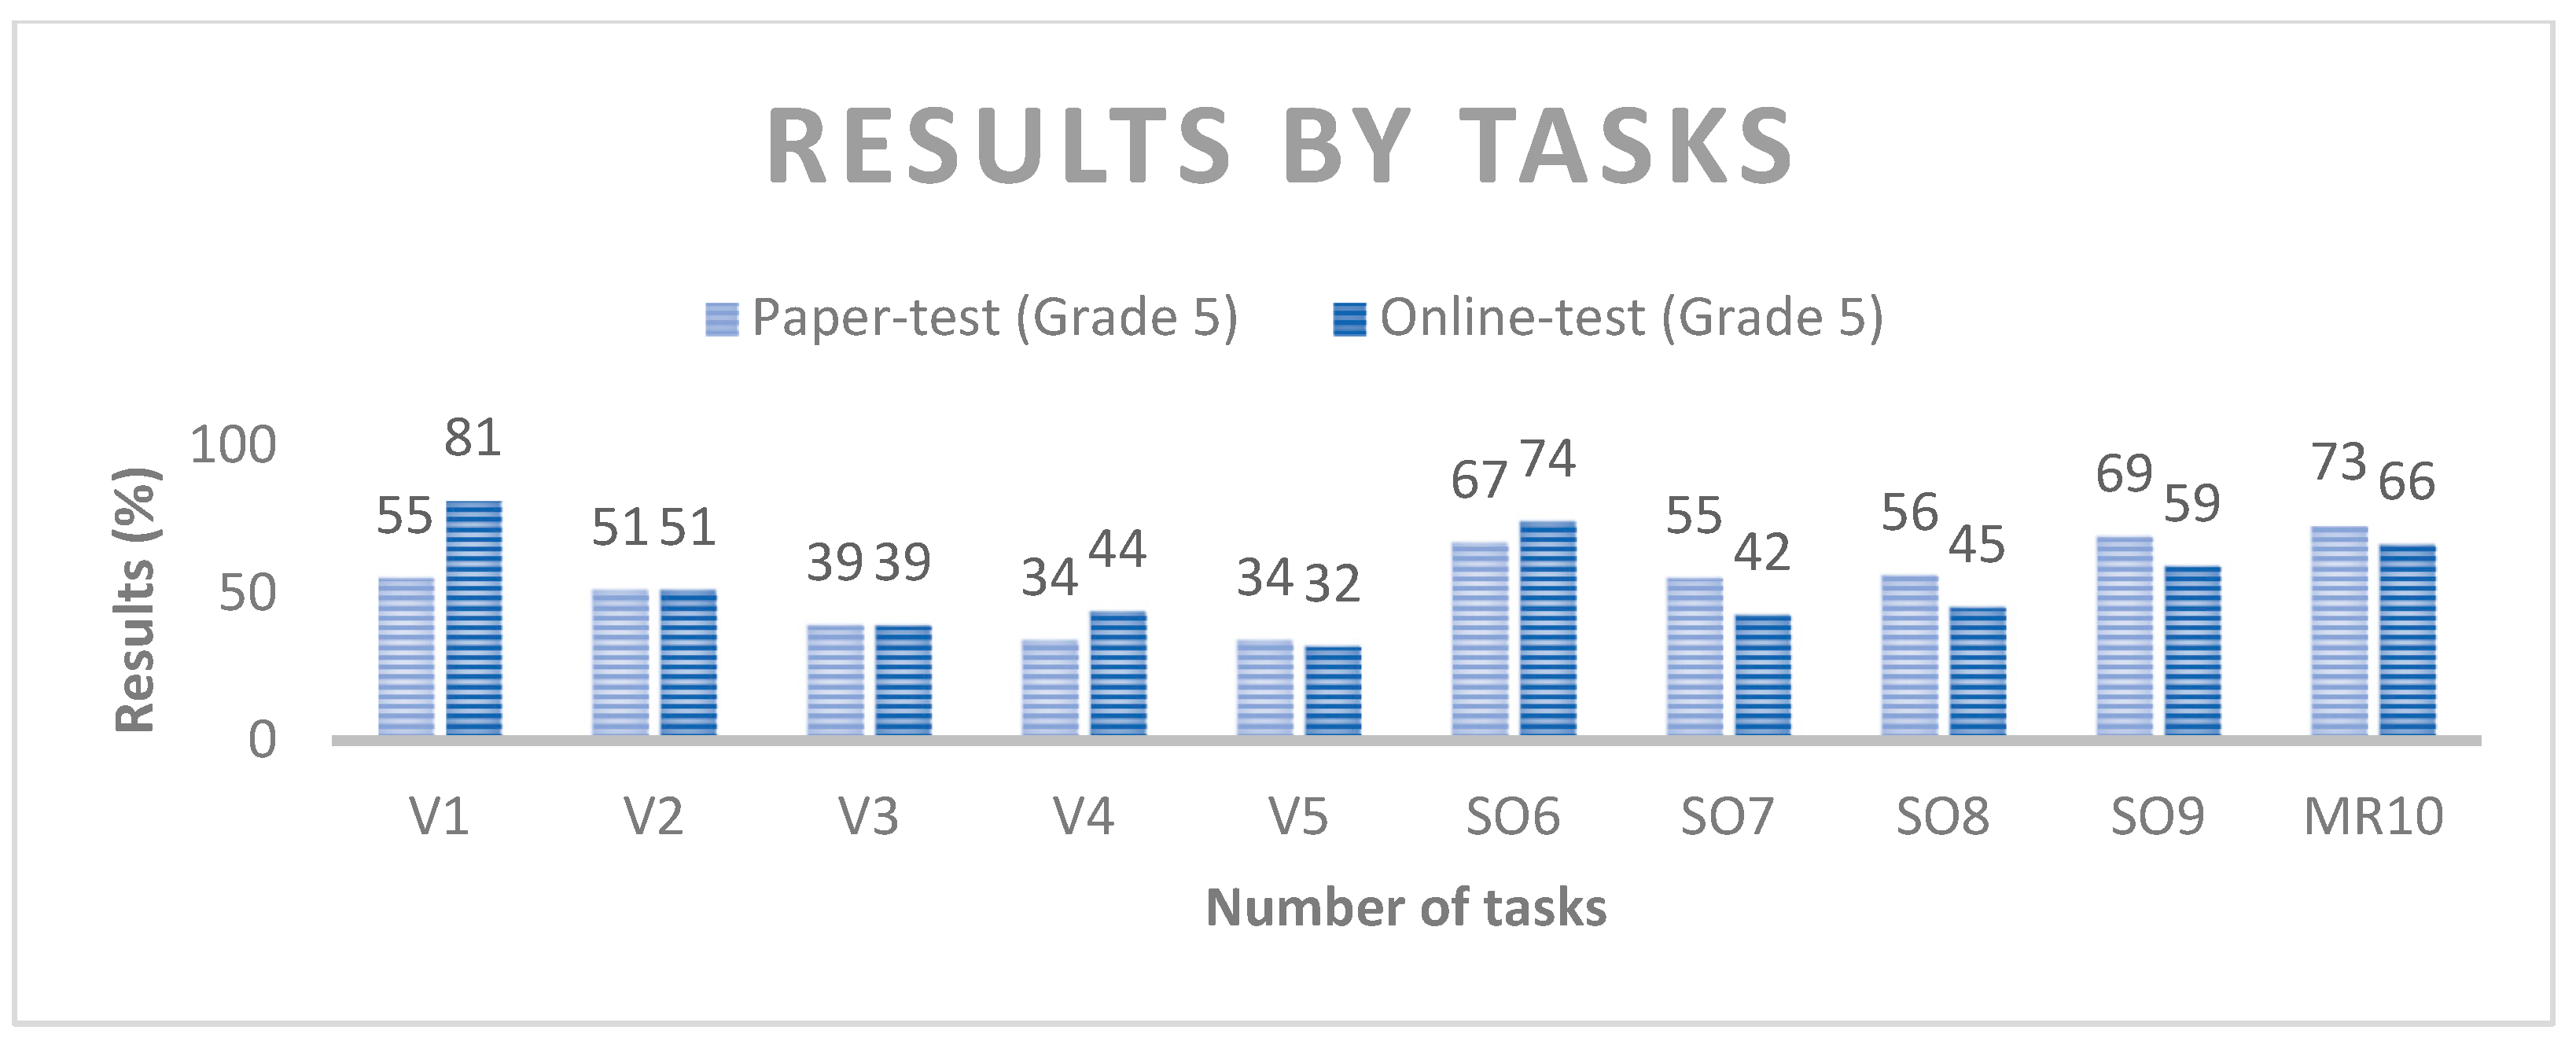
The graph (see Figure 8) below shows the performance of fifth-graders during the pre-test of spatial skills through paper-based and digital assessment tools. Our previous experiments [4,30,31] show that it is the complexity of tasks that influences performance the most. As expected, the tasks that contained elementary spatial operations of the same type were easier for students than those with different types of complex operations.
Previous research quoted above also indicated that preadolescent students of the fifth and sixth grades solve “figurative tasks” that represent spatial relations through recognisable shapes and figures easier than non-figurative ones that demonstrate a similar relationship through a geometric image. This study also solved tasks that represented mental rotation or spatial orientation problems through realistic scenes more successfully than similarly complex ones with abstract visualisations. Success in solving a spatial orientation task depended on the recognizability of the objects in space. Purely geometric tasks that required the solution of a similar orientation problem based solely on the relative distance, structure, and directions of abstract elements were found much more difficult (SO7 = 55%, SO8 = 56%).
Complex spatial orientation tasks were the only task types where we detected significant differences between the results of paper-based and digital test takers. Here, those who were provided with paper-based tests were more successful, probably because the maps on paper could be turned around, as the maps are often used in real life, while the digital test did not provide this option. Thus, students had to do mental rotation—a difficult spatial subskill—to identify the location of the buildings represented as (virtual) three-dimensional images and symbolised on a map from a different angle.
In Figure 9, the results of the pre- and post-test are shown. Students solved all post-test tasks better than the same ones in the pre-test. However, some results indicate further directions for development. Both the pre- and post-test shows how difficult it is for students to abandon the egocentric viewpoint. A relatively large proportion of students cannot select the appropriate representation of objects when an allocentric viewpoint has to be employed (cf. items V3, V4, V5). Results are the worst in these tasks (fifth-grade average for V3 = 39%, for V4 = 34%, and for V5 = 34%, sixth-grade average for V3 = 67%, for V4 = 62%, and for V5 = 67%).
In both surveys, there is a closer correlation between tasks that involve complex sequences of operations, complex spatial arrangements, and hard-to-identify shapes. Of these, the highest correlation values occurred within certain subskills (Pearson’s correlation, visualisation r(V1–V2) = 0.68, r(V3–V4) = 0.64; spatial orientation r(SO7–SO8) = 0.74).
4.3. Development of Performance by Subskills and the Whole Skill Cluster
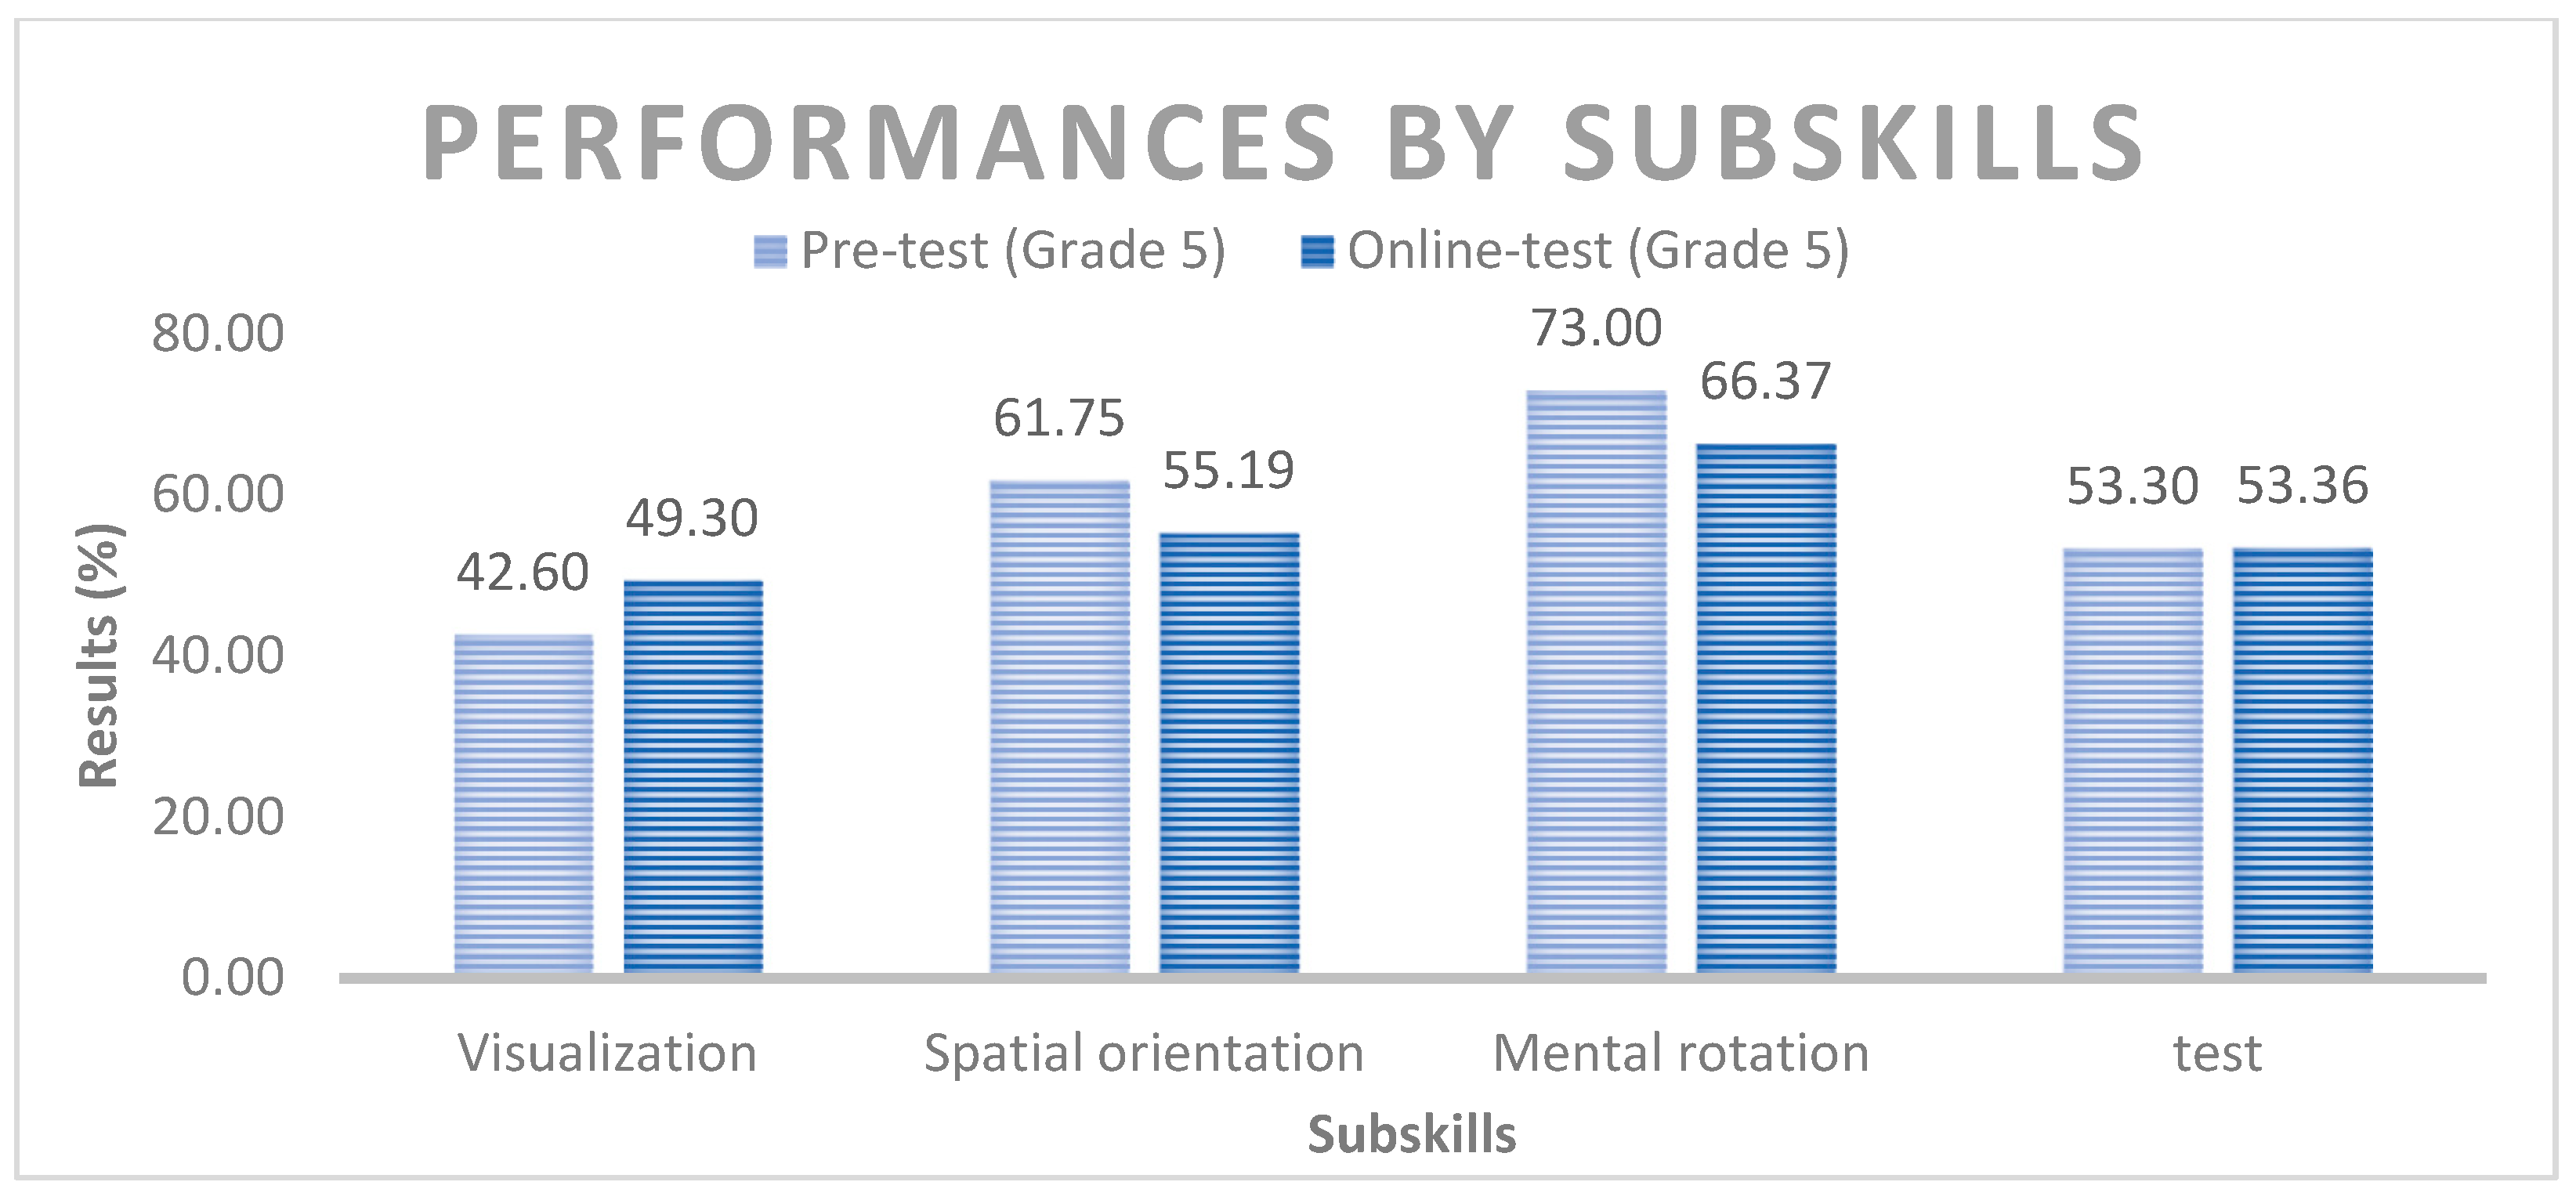
If we compare the average test scores of students in Slovak schools, we find that the spatial visualisation scores are somewhat lower, and the spatial orientation and mental rotation scores are higher than those of the Hungarian sample. This result shows which subskills were developed most successfully by the Slovak experimental programmes reported here (cf. Figure 10).
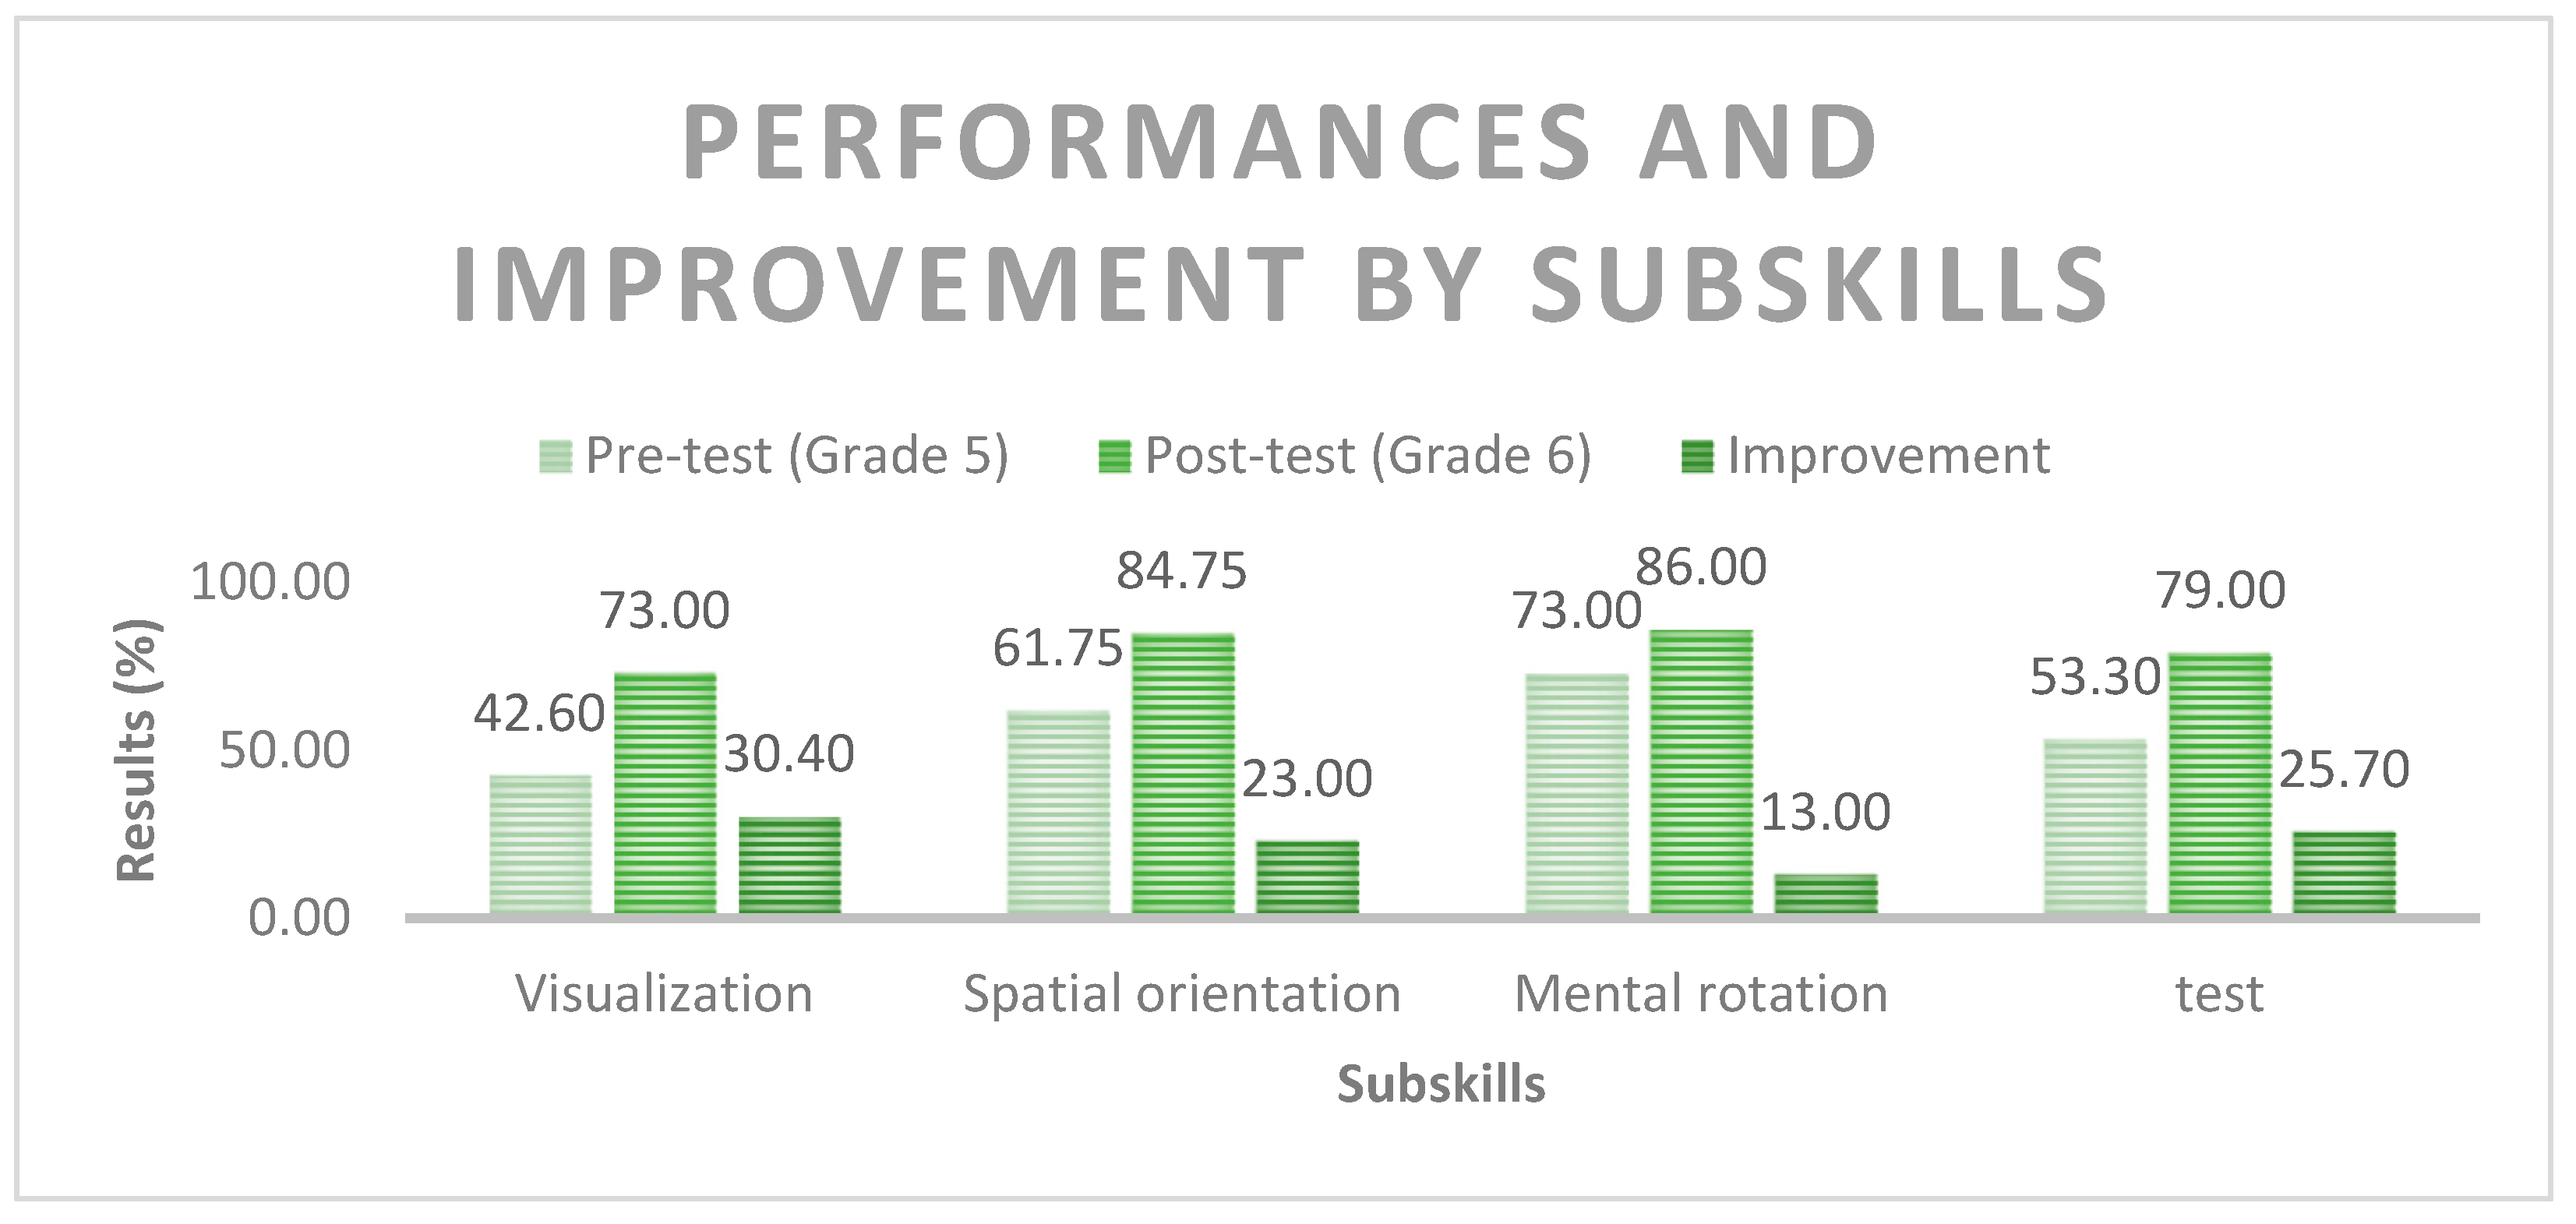
The following figure (see Figure 11) shows how the subskills improved due to the interventions of the developers of teaching–learning programmes in the three disciplines (ICTs, Mathematics, and Visual Arts).
The experimental programmes influenced the development of the visualisation subskill most: all disciplines involved in the development emphasised the construction of images to reveal, interpret, and understand spatial phenomena (t = 8.99, p < 0.01).
The second area where the experimental programme turned out to be successful was spatial orientation (t = 6.42, p < 0.01). Again, the relevance of this subskill for everyday life is evident, and the tasks that developed this area of spatial perception and creation successfully built bridges between real-life experiences and their representations.
Mental rotation is a complex subskill that may only be improved through long practice periods. (One of the areas where this subskill is in action, driving a car, clearly demonstrates this.) Although the development is significant (t = 3.11, p < 0.01), this complex skill set needs further development in higher grades.
The overall growth demonstrated in the post-test, 25.60%, is an achievement that makes the school programmes important innovations in their respective educational fields (t = 10.12, p < 0.01).
4.4. Structure of the Spatial Skills Cluster—Grade 5
The structure of spatial subskills was revealed through cluster analysis. First, we discuss the pre-test results where the interrelations of spatial subskills of fifth-graders were revealed. The dendrogram (see Figure 12) clearly shows how the test tasks constitute two major clusters: spatial orientation (with the subskills of mental rotation adhering to it) and visualisation, including abstract and figurative renderings of spatial relations. The items of our test form clusters based on their complexity and difficulty. The most substantial relations can be observed with pairs of tasks solved with a similar success rate (V1–V2, V3–V4, TT7–TT8).
4.5. Comparison of Performances of Schools and Classes (S10 = Nové Zámky, S11 = Kolárovo, S12 = Nitra)
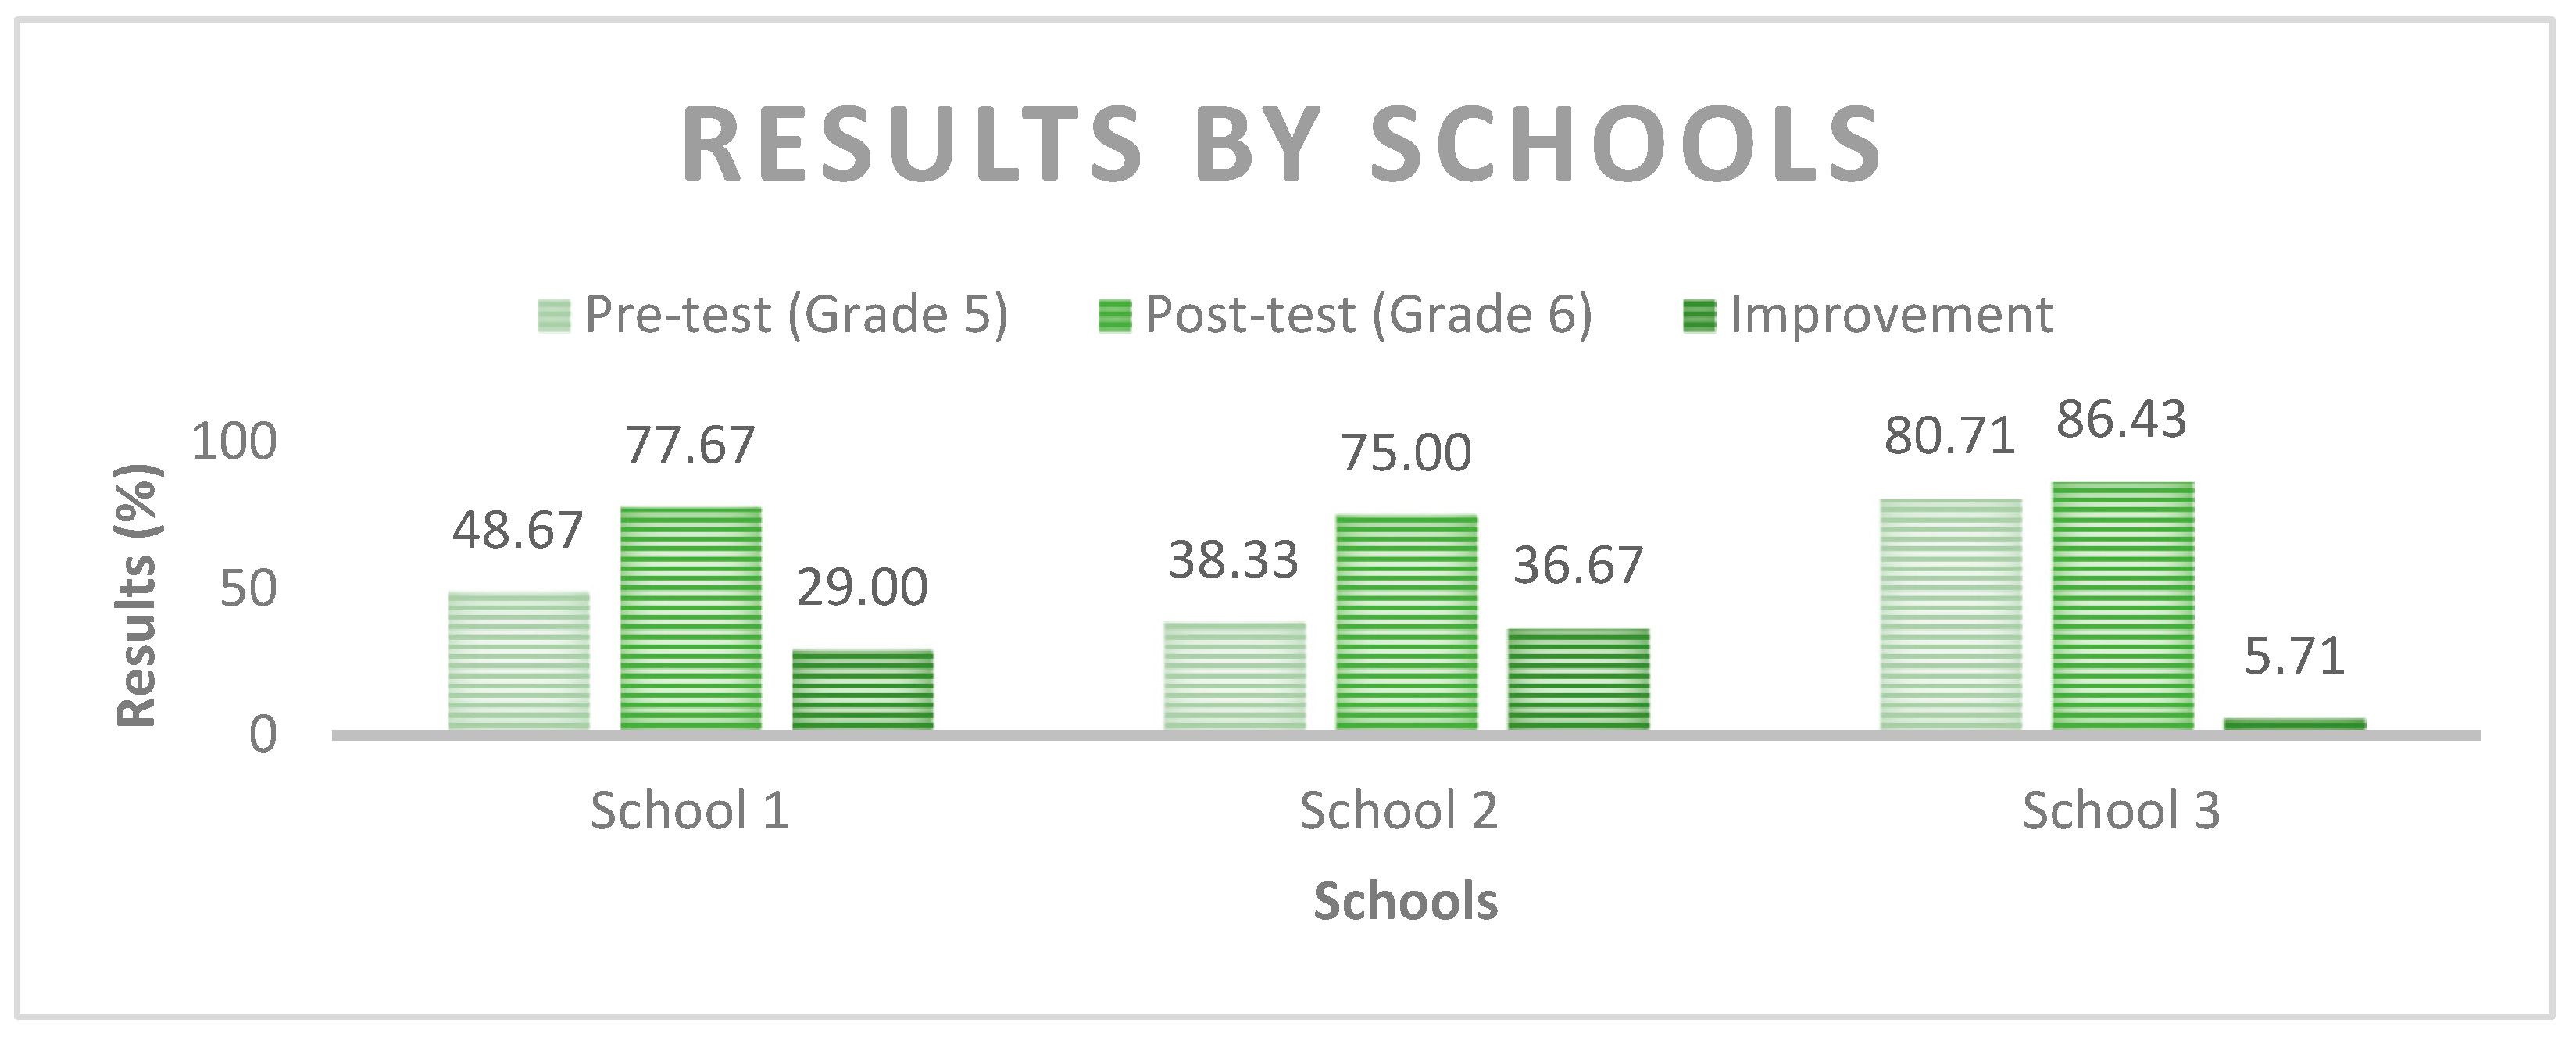
The performance of the three schools was significantly different in the fifth grade (Grade 5: F = 18.50, p < 0.01). Table 4 below shows the schools’ results indicating the test types employed. Students in one of the schools that used the paper-based assessment instrument were exceedingly high, one of the other two performed well below average, while students of the third one achieved average results (average score for the school in Nitra S12 = 80.71%, for the school in Nové Zámky S10 = 48.67%, and Kolárovo S11 = 38.33%).
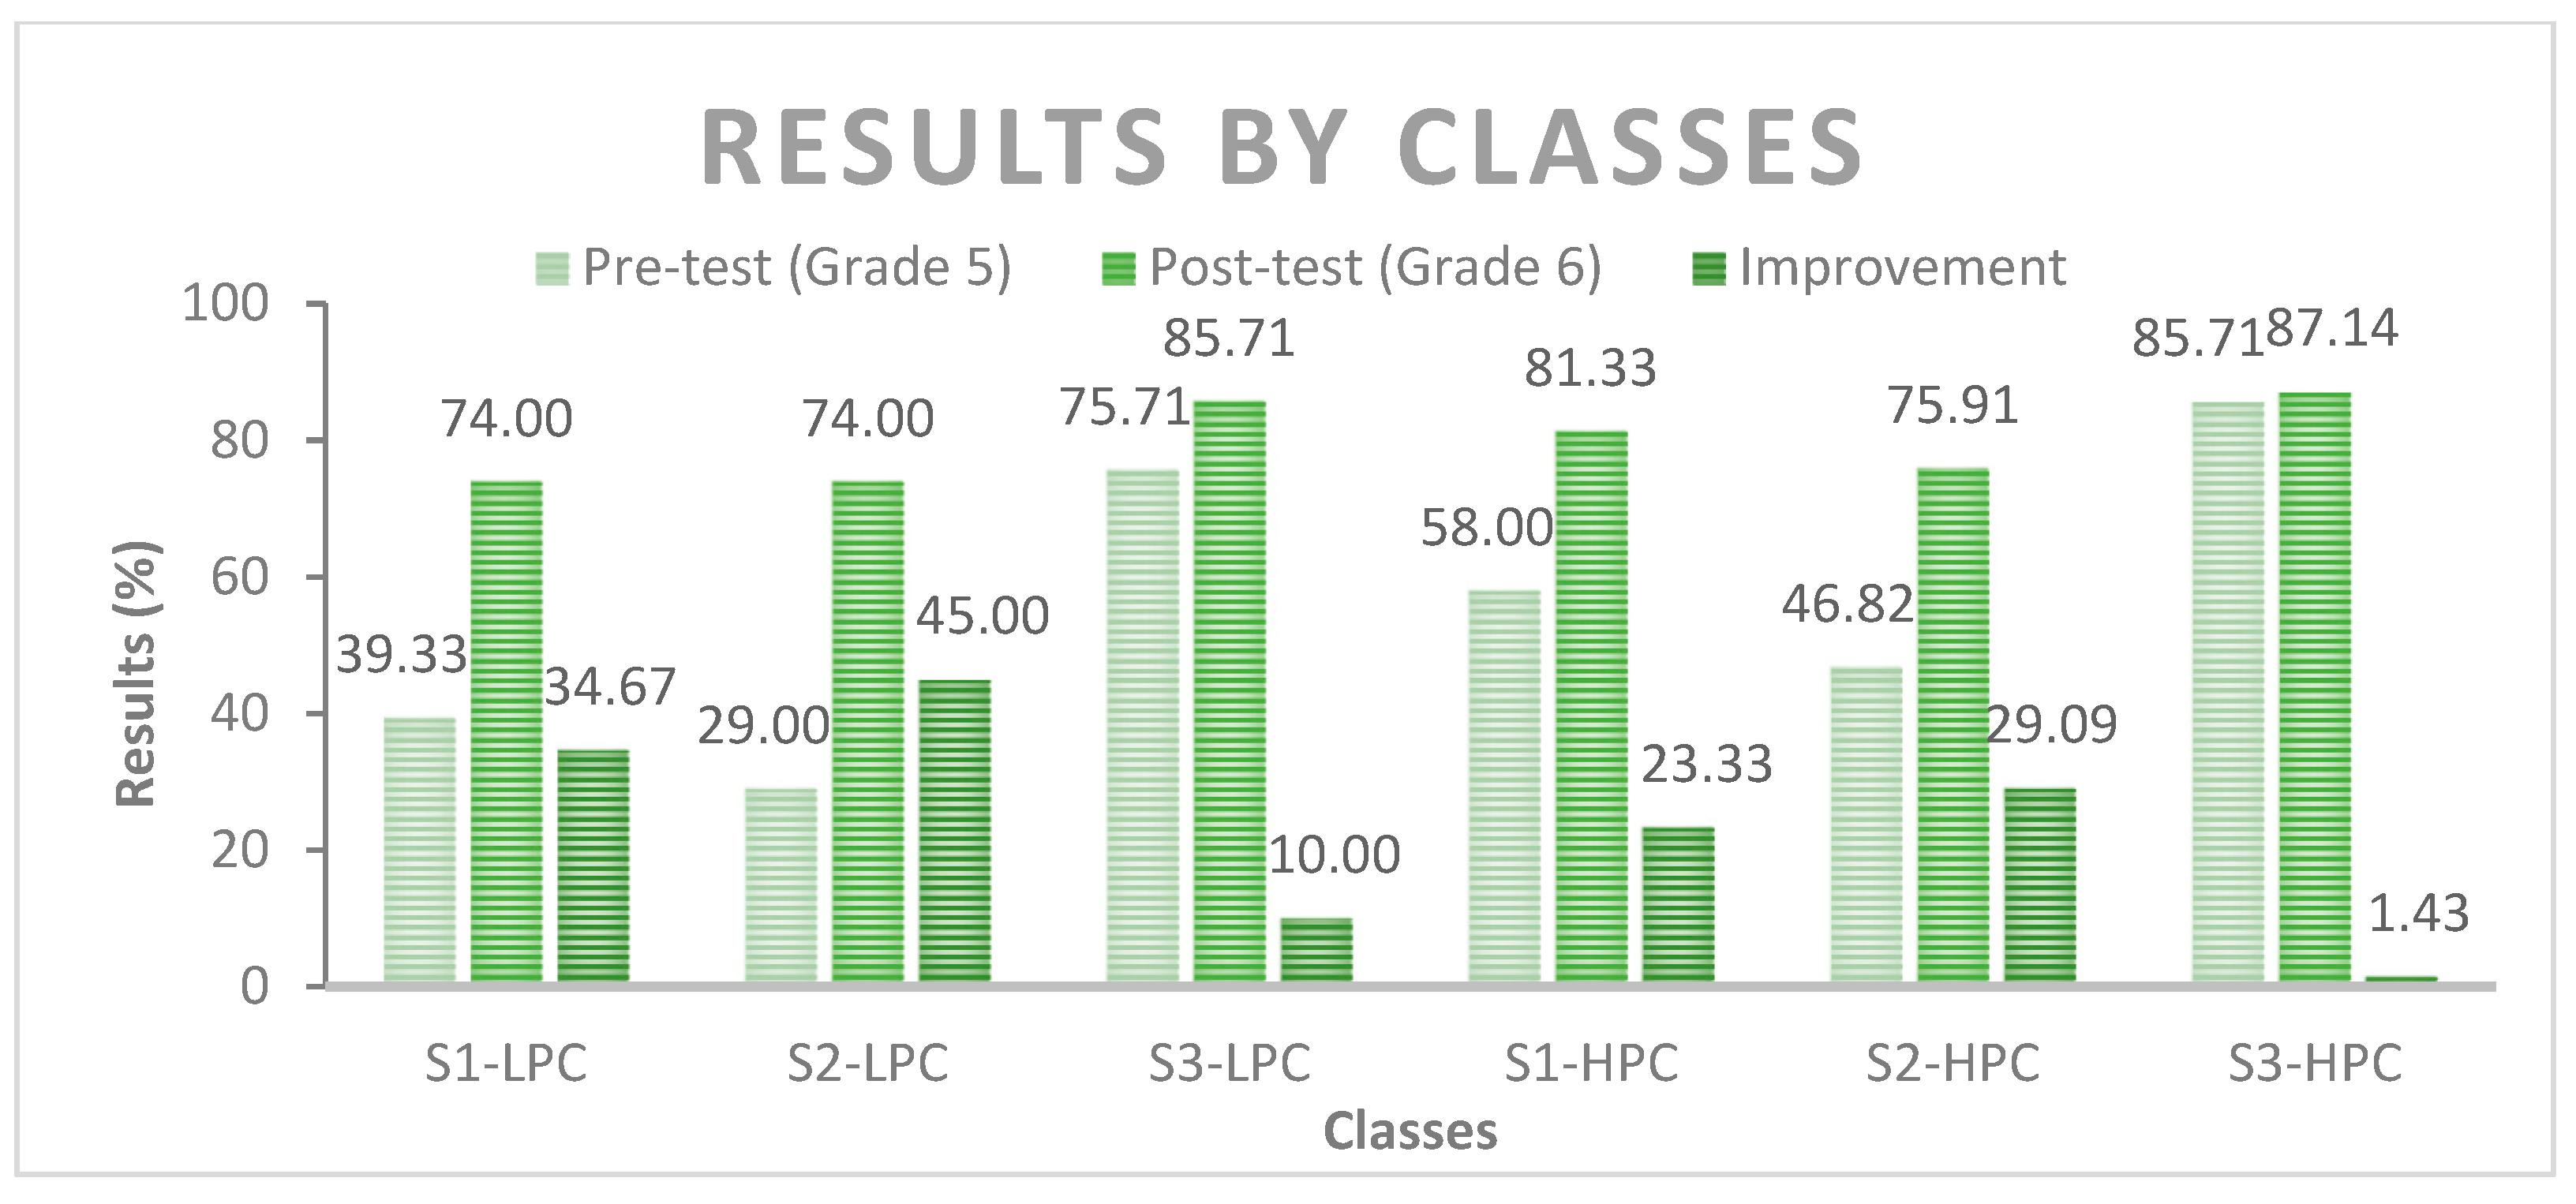
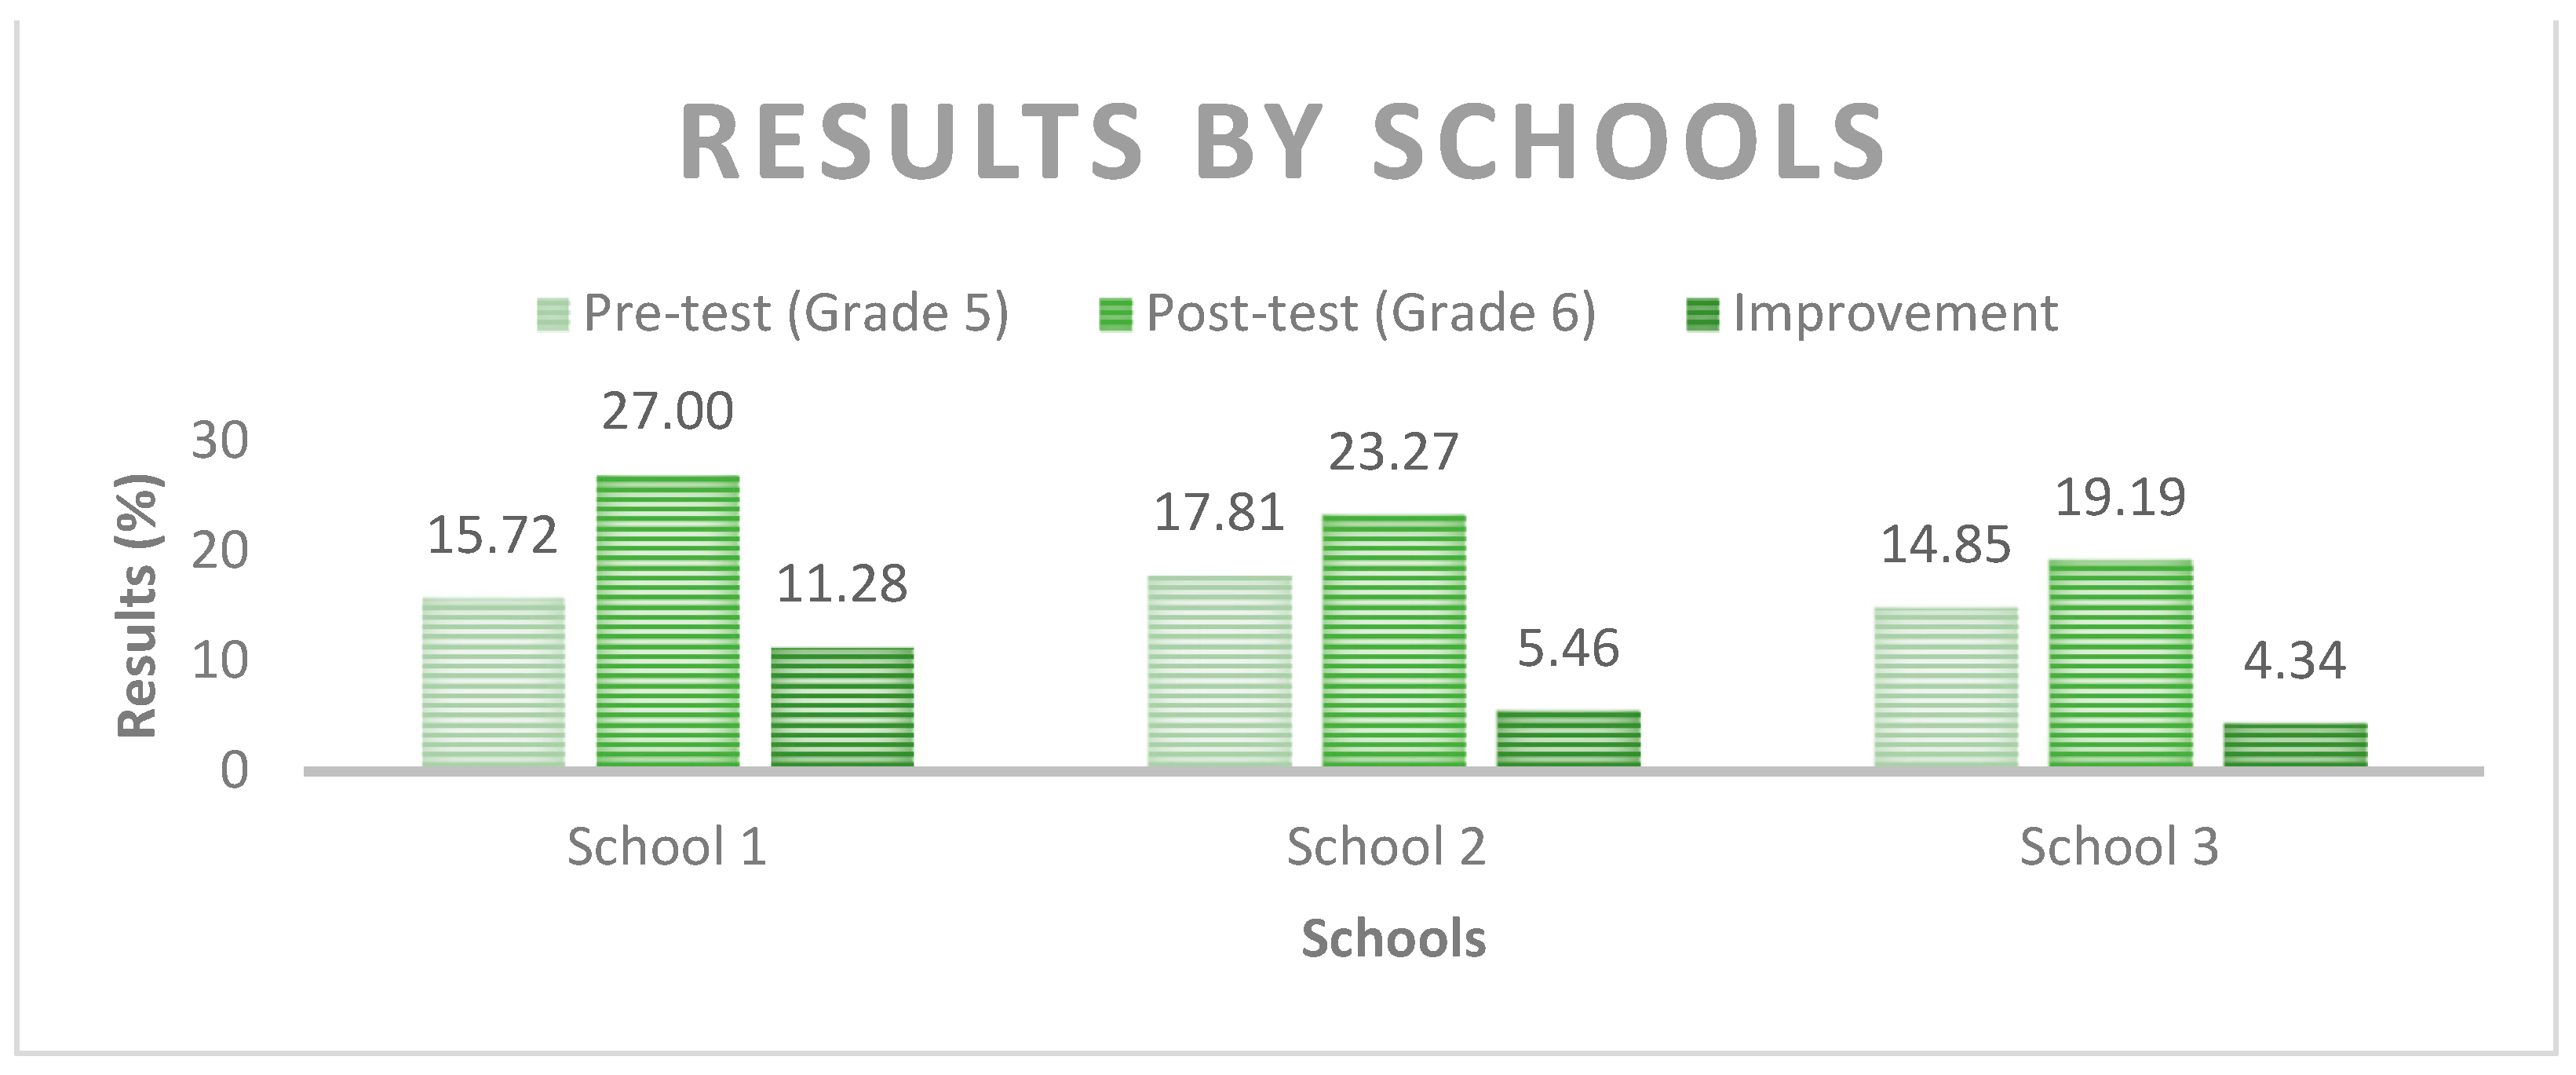
Those schools that produced the worst results in the pre-test improved the most, while the school in Nitra that achieved excellent results already in the pre-test did not improve substantially because of the ceiling effect (Figure 13, S1 t = 6.33, p < 0.01, S2 t = 9.71, p < 0.01, S3 t = 2.35, p < 0.05). Test results improved in all pilot classes in the post-test (Figure 14, S1-LPC t = 4.80, p < 0.01, S2-LPC t = 11.23, p < 0.01, S3-LPC t = 2.46, p < 0.05, S1-HPC t = 4.25, p < 0.01, S2-HPC t = 4.98, p < 0.01, S3-HPC t = 0.62, p = 0.55).
In the pre-test, the three classes that required intensive development (low-performing classes (LPCs)) and those that started at a higher level and required further development (high-performing classes (HPCs)) showed significant differences (t = 2.31 p < 0.05). However, a year later, in Grade 6, the post-tests showed a substantial increase in the performance of LPC groups, and the average performance on the spatial skills test was similar (MLPC = 77.35%, MHPC = 80.59%, t = 0.68, p = 0.50).
The table below (see Table 5) shows that the developmental programmes were efficient in both groups and achieved significantly better post-test results (tLPC = 8.87 p < 0.01, tHPC = 5.78 p < 0.01). The groups that manifested weaker performance at the start developed more rapidly. This accelerated development is the result of innovative educational programmes that employed scientific visualisations, which turned out to be especially helpful for students with basic problems with spatial concepts and rule problems (LPC Cohen’s d = 1.16, HPC Cohen’s d = 0.66).
4.6. The Effects of Gender on Spatial Performance
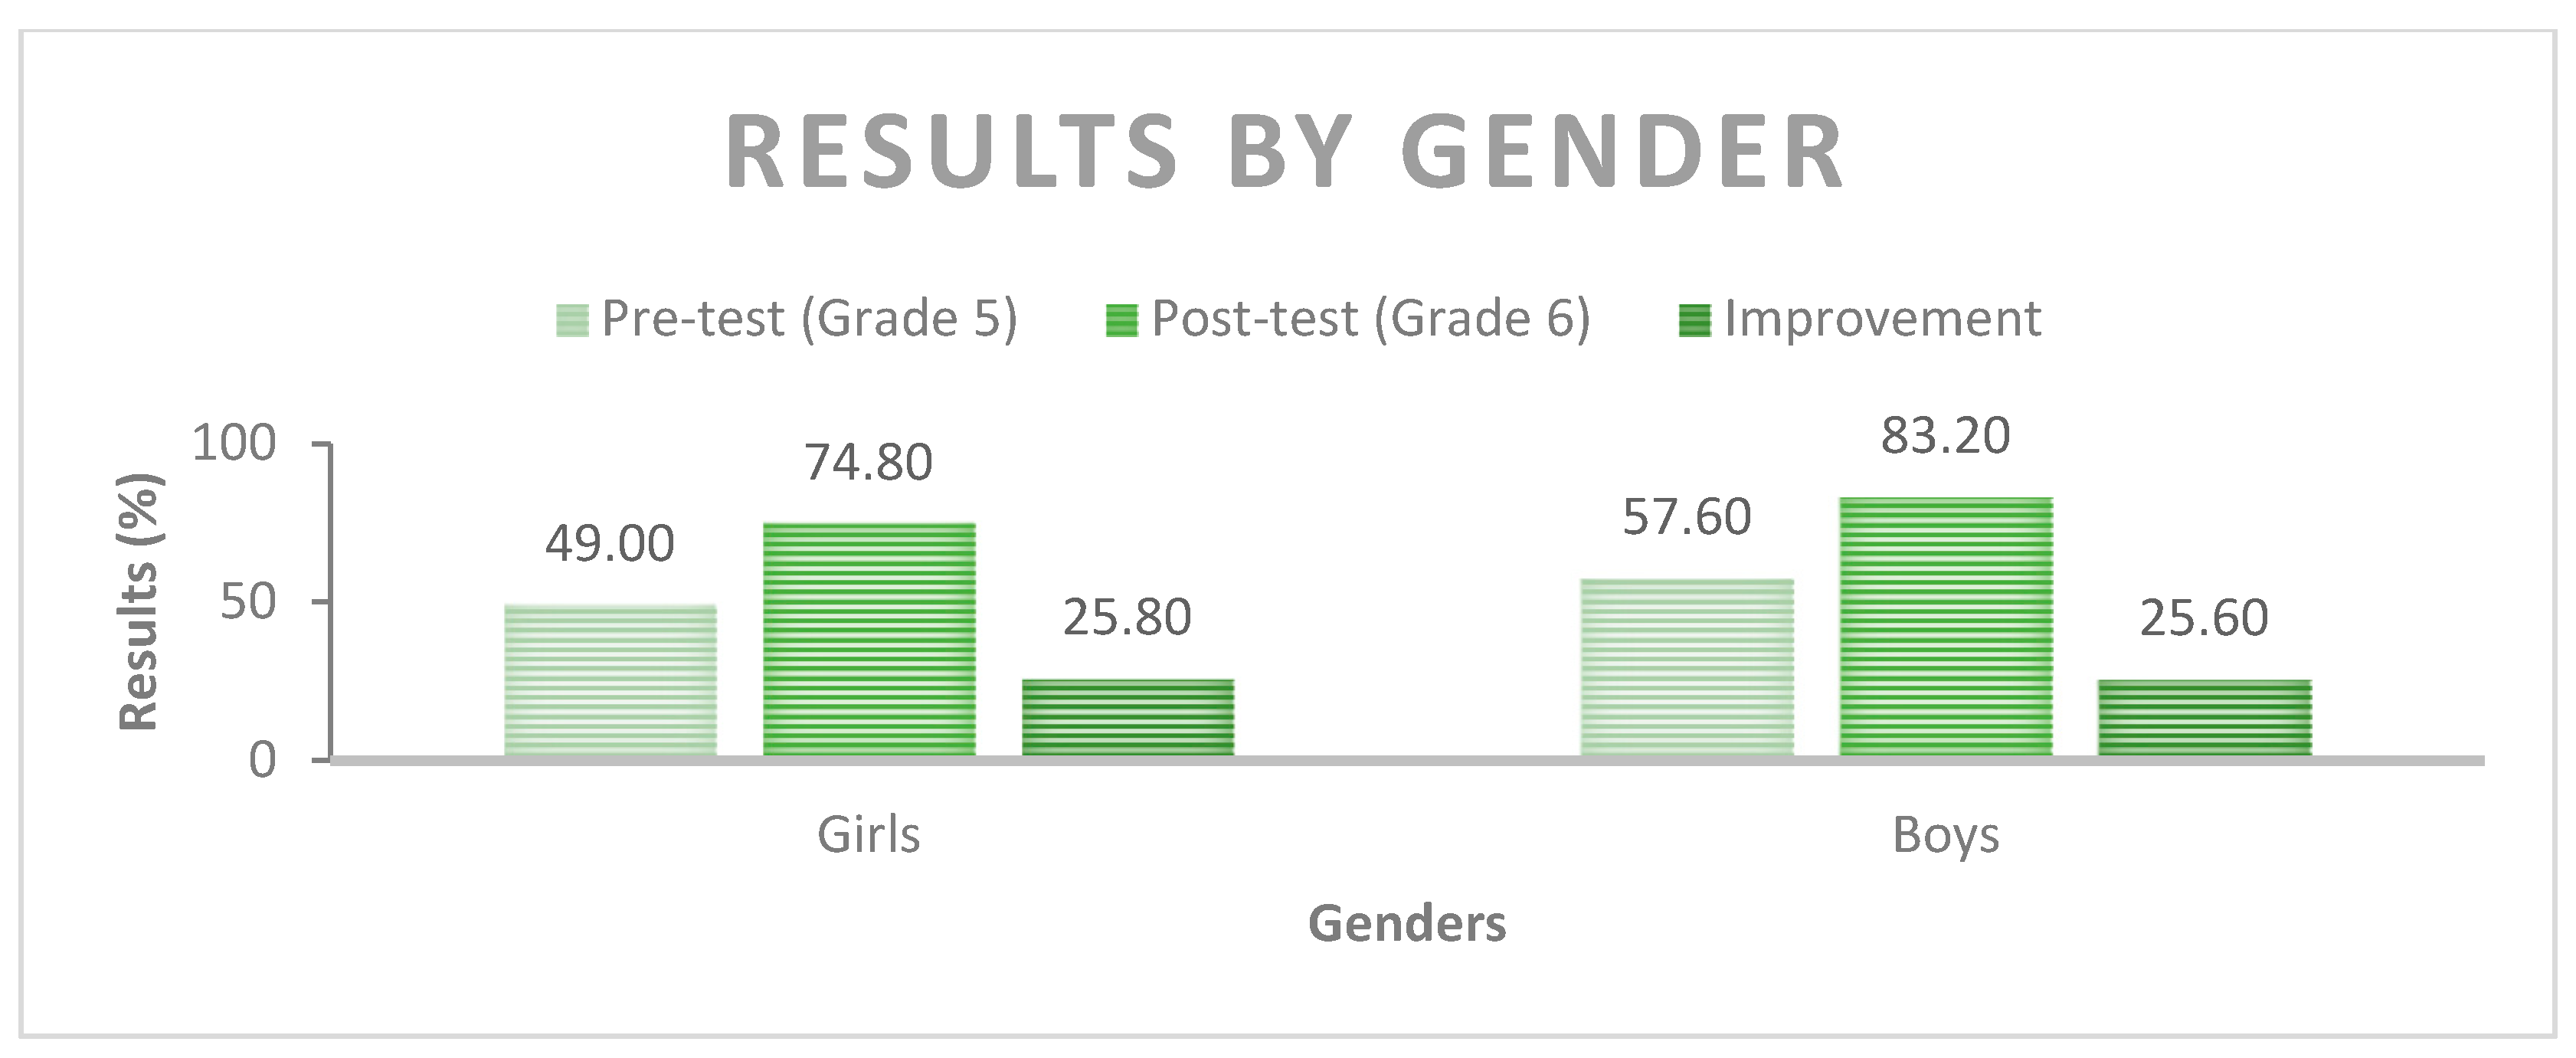
In the spatial test, no significant difference was revealed between boys and girls (Grade 5 t = 1.28 p = 0.20, Grade 6 t = 1.77 p = 0.08). However, the average score of boys was somewhat higher in both the pre- and post-tests.
Among the tasks of the spatial subskills, there was only one group, the tasks for mental rotation, that the girls solved somewhat more successfully. This difference, however, was only observable in Grade 5. Tasks of another subskill, spatial orientation, were solved by boys significantly better in Grade 5 (t = 2.13 p < 0.05). As in most reported studies, boys outperformed girls, but these differences were minor (see Table 6).
We found no significant differences in the development of the two genders in this area (girls t = 7.63 p < 0.01, boys t = 6.69 p < 0.01). (Improvement as a percentage of scores: girls, 25.80%, boys, 25.60%, Figure 15.)
5. Results of the Test for Creative Thinking (TCT)
Ninety-two students took part in both the pre- and post-tests. The most important indicators from the two assessments are summarised in Table 7. On average, students in the test scored higher on the TCT test at the end of Grade 6 than in the pre-tests in Grade 5 (Grade 5 M = 16.32; Grade 6 M = 23.29), with a significant difference between the test results (t = 8.22 p < 0.01).
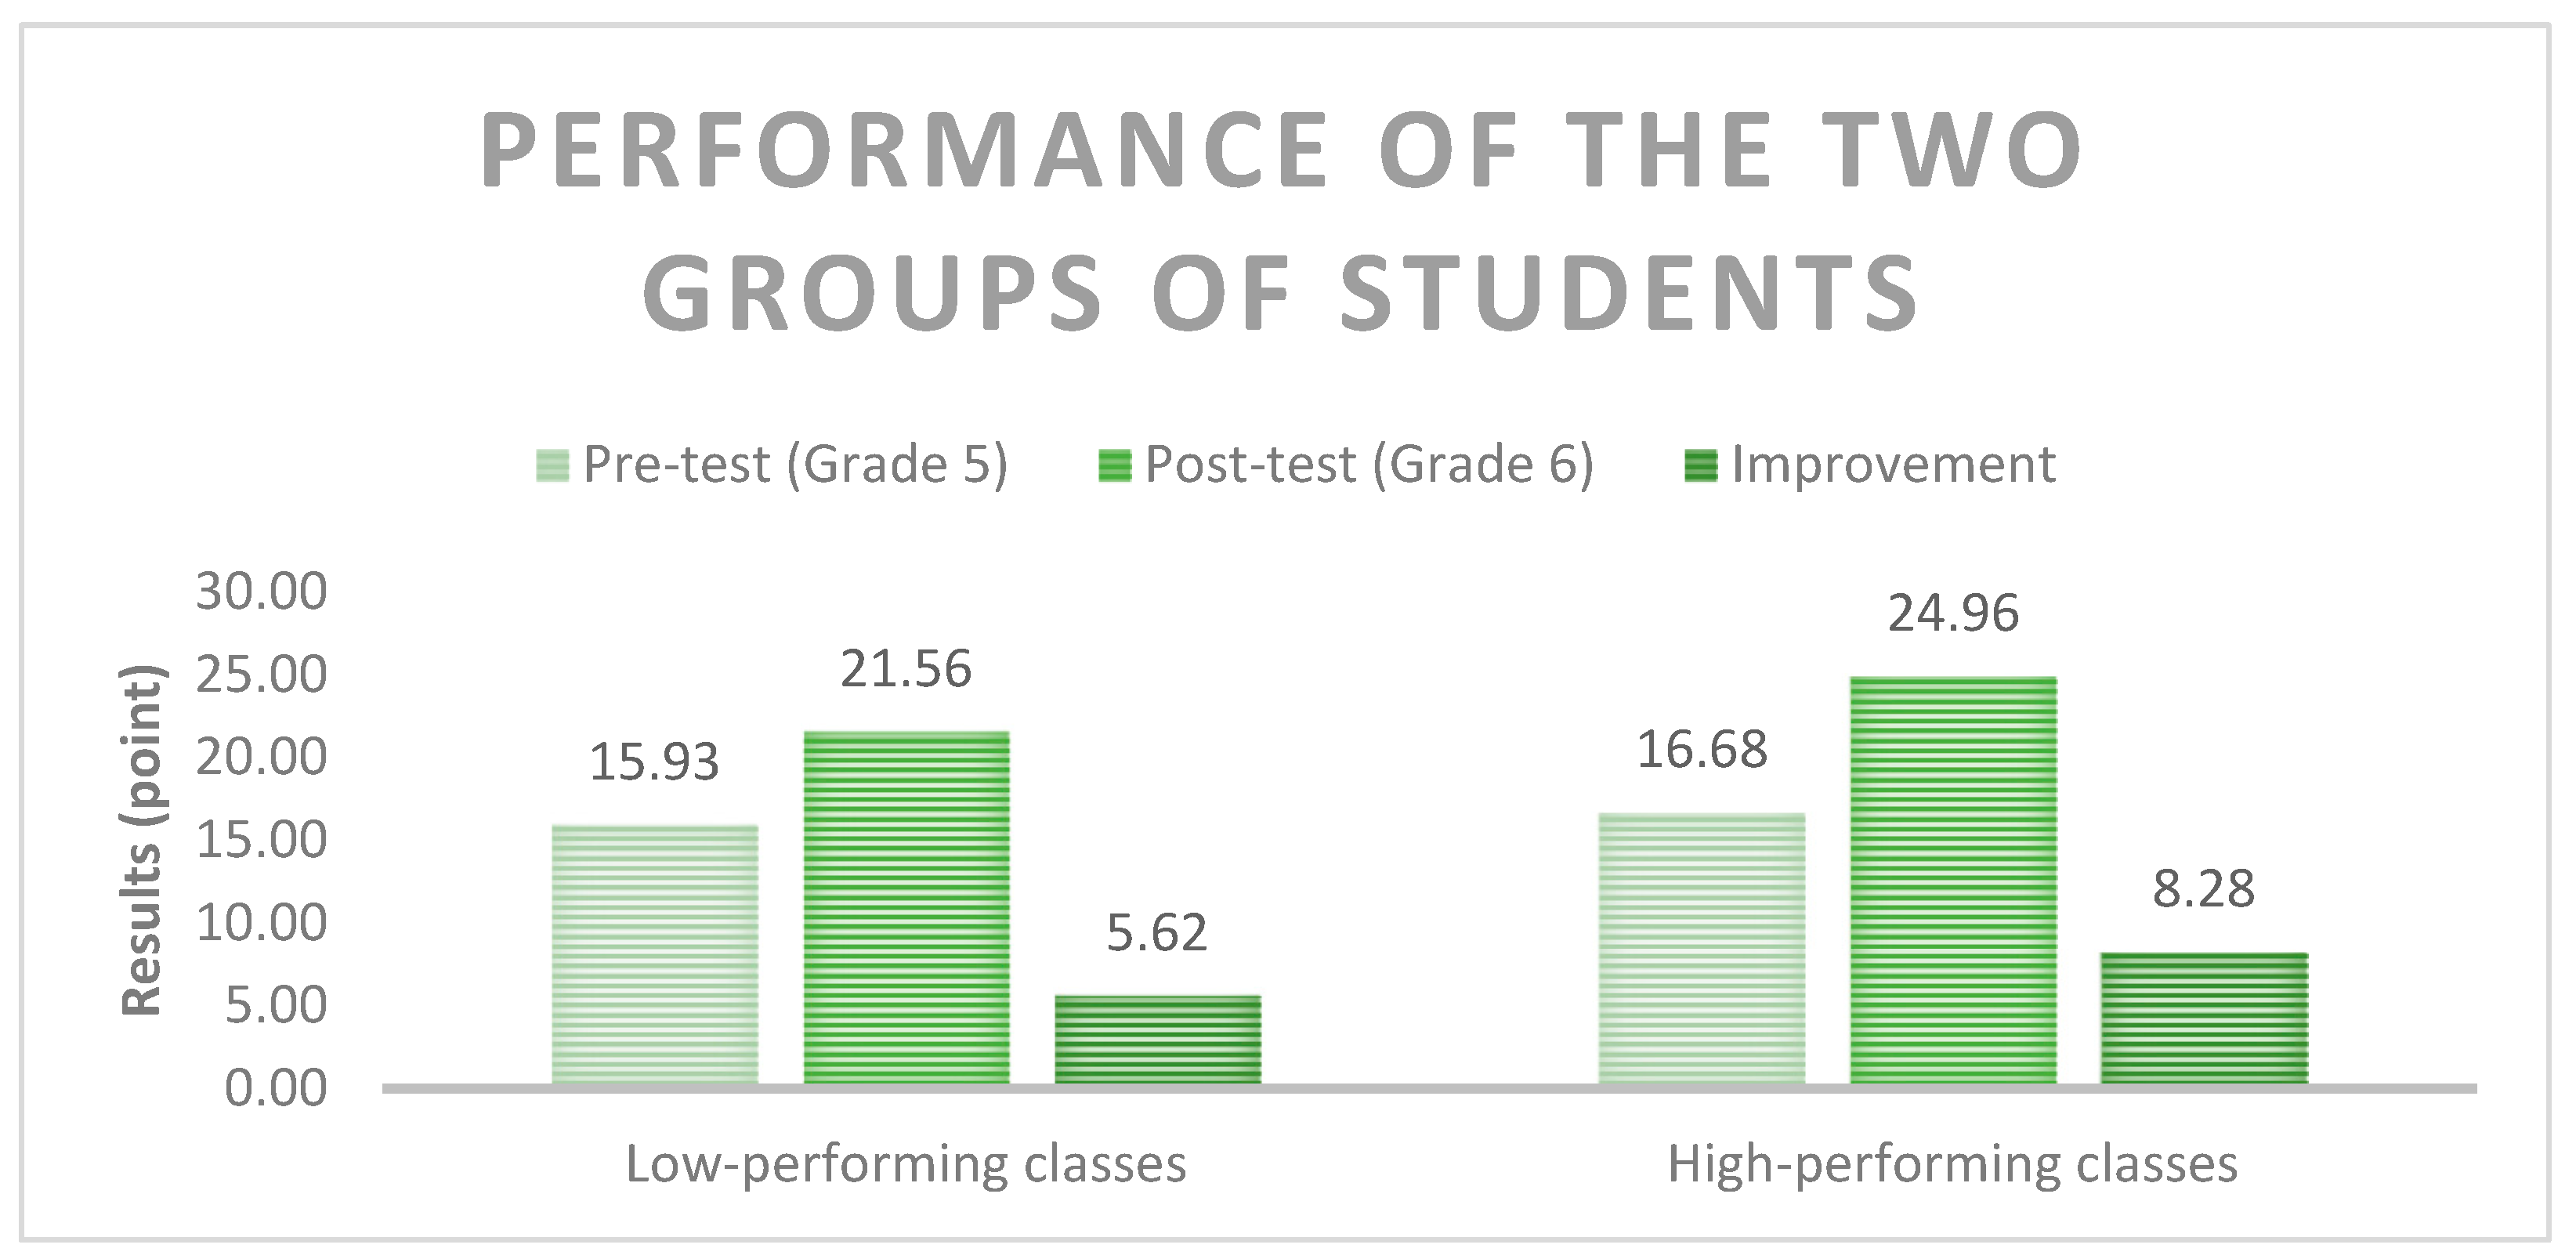
At the beginning of the experiment, differences between the two groups were minimal (t = 0.70 p = 0.49), but their developmental curve was different. The talent development classes benefited more from the open-ended tasks focusing on creativity development (t = 2.06 p < 0.05; see Figure 16 and Table 8). (Improvement of test scores: LPC 5.62; HPC 8.28, Figure 16.)
The experimental programmes beneficially affected the creative performance of both groups (LPC Cohen’s d = 1.20, HPC Cohen’s d = 1.01). Their performance increased significantly (tLPC = 5.77, p < 0.01, tHPC = 6.09, p < 0.01; see Table 8).
Girls performed better on the creativity measurements both in the pre- and post-test (see Table 9). This difference is significant in the pre-test, in Grade 5 (t = 2.55 p < 0.02), but the creativity level of the two genders is balanced in the post-test. The girls and the boys developed significantly during the experimental teaching process (tGIRLS = 5.28, p < 0.01, tBOYS = 6.39, p < 0.01). The developmental curve is similar to the spatial skills test.
The difference in performance between schools and classes in the TCT tests was smaller than that observed in the spatial tests (Figure 17 and Figure 18). However, the difference in the performance of the students of the three schools was significant in the post-test (Grade 6 F = 7.19, p < 0.01), which is caused by the different levels of improvement in the average of the institutions. The two lower performing schools in the spatial tests (S1, S2) scored higher on the TCT tests, both pre- and post-tests, and their students made more remarkable progress (S1 t = 6.56, p < 0.01, S2 t = 5.33, p < 0.01, S3 t = 2.93, p < 0.01). The institution that performed well in the spatial tests (S3) performed worse in the TCT tests, but the students’ improvement is also significant here.
6. Discussion
In the final part of our paper, we answer our research questions based on the results of the current study.
- Can we develop the spatial skills of preadolescents through a non-intensive, modular teaching–learning programme integrated with the regular curriculum of the disciplines during two school years?
The results of the spatial skills and creativity tests show that the spatial performance of preadolescents can be successfully enhanced by introducing new methods and authentic, lifelike tasks in the regular school curriculum. One of the reasons why our spatial development interventions were successful is that we built most of our learning units on real-life situations where spatial skills are regularly used. Thus, students acquired the rules of perception, orientation, and creation in space through authentic tasks. Two of the three disciplines belong to the area of natural science and mathematics, so scientific visualisation is an evident area for skills development. For example, depicting spatial relations in the process of solving a geometric task in Mathematics and visualising a programming problem in ICTs is efficiently supported by drawing an image and/or interpreting the drawings of others. In art education, visualisation has often taken expressive, aesthetic form and was found equally enhancing.
Introducing the integrative STEAM educational model and utilising scientific visualisations, creative modelling, and design tasks to understand scientific concepts and principles were especially helpful for students with low spatial perception and construction levels. As spatial skills are required for hundreds of vocations and professions, their development may significantly improve the chances for a successful career.
- 2.
- Do gifted students and those with learning challenges equally benefit from the programme?
Our assessment data show that high- and low-performing students benefitted from the integrative STEAM approach, the creative project tasks, and the pair or group work. One of the most important findings of our research is that fifth-graders, aged between 10 and 11 years, with a drawing development that turns toward an interest in realistic representation and rules to achieve spatial effects, acquire methods of scientific visualisation easily and use them in their studies of Informatics and Mathematics as well as Art Education.
- 3.
- Do girls and boys equally benefit from the same teaching–learning programme, or do they need different interventions?
In the spatial skills test, the average score of boys was somewhat higher in both the pre- and post-tests. In mental rotation, tasks were somewhat more successfully solved by girls, but only in Grade 5. On the other hand, mental rotation tasks were solved by boys significantly better in Grade 5 (t = 2.13 p < 0.05). As in most reported studies, boys outperformed girls, but the observed differences were minor.
On the pre-tests of creativity, girls were somewhat better; this difference diminished in the post-test. In the post-tests, measuring the effects of our interventions, we did not find significant, gender-related differences in the spatial skills or the creativity test.
Authentic and easy-to-use in classroom testing tools are important for regular assessment of the quality of instruction. We found that boys and girls benefit equally from lifelike, authentic tasks. However, teachers’ notes indicate that visualisation of spatial relations seems more important for girls to understand.
- 4.
- Are assessment instruments standardised in Hungary applicable to Slovak students?
We compared the performance of the two experimental groups to the performance of Hungarian students of the same age who took part in a national assessment of spatial skills. We found that the test used in Hungary and employed in the current experiment without alteration was culture-free and did not include any special knowledge that Slovak students did not learn at school.
The Test for Creative Thinking by Klaus Urban and Hans Jellen has been standardised in 19 countries on three continents and found to be culture-free. This test, too, was employed in Hungary in several experiments and yielded valid and reliable creativity assessment data.
The area where the experimental programme turned out to be exceptionally successful was spatial orientation. The relevance of this subskill for everyday life is evident, and the tasks that developed this area of spatial perception and creation successfully built bridges between real-life experiences and their representations. On the other hand, the subskill we could only develop moderately was mental rotation. This complex subskill may only be successfully improved through long periods of practice and needs further development in higher grades.
The overall growth demonstrated in the post-test, 25.60%, is an achievement that makes the discipline-based learning programmes important innovations in their respective educational fields and also shows how the effects of instruction may be enhanced through an interdisciplinary approach to arts and science.
7. Limitations
The study was conducted with two school grades only—our assumptions about the development of spatial abilities must be verified for the other grades. This will be the theme of our next research project.
The comparison of Slovak and Hungarian results may raise the question of validity. The two Eastern European countries share similar educational traditions. We studied curricula in art, mathematics, and information technology in the two countries and realised they cover similar themes. The reported reliability of the two datasets shows that the tests we used provided reliable results in both countries.
Author Contributions
Conceptualisation, T.S. and A.K.; methodology, T.S., A.K., B.B. and H.P.; software, B.B.; validation, T.S. and B.B.; formal analysis, B.B.; investigation, T.S., A.K., B.B. and H.P.; resources, T.S.; data curation, H.P.; writing—original draft preparation, T.S. and B.B.; writing—review and editing: A.K.; visualisation, T.S., B.B. and A.K.; supervision, A.K.; project administration, H.P.; funding acquisition, T.S. All authors have read and agreed to the published version of the manuscript.
Funding
This work was funded by the Ministry of Education, Science, Research and Sport of the Slovak Republic under Grant number KEGA: 015UKF-4/2020 entitled “Development of spatial abilities of 10–12-year-old students”.
Institutional Review Board Statement
The study was conducted in accordance with the Declaration of Helsinki, and approved by the Ethics Committee of Constantine the Philosopher University in Nitra (protocol code UKF-2023/807-2:191013, date of approval 20 February 2023).
Informed Consent Statement
Informed consent was obtained from the parents of all underage subjects involved in the study.
Data Availability Statement
Not applicable.
Conflicts of Interest
The authors declare no conflict of interest. The funders had no role in the study design; in data collection, analyses, or interpretation; in the writing of the manuscript; or in the decision to publish the results.
References
- Leopold, C.; Gorska, R.A.; Sorby, S.A. International experiences in developing the spatial visualisation abilities of engineering students. J. Geom. Graph. 2001, 5, 81–91. [Google Scholar]
- Chai, X.J.; Jacobs, L.F. Sex differences in directional cue use in a virtual landscape. Behav. Neurosci. 2009, 123, 276–283. [Google Scholar] [CrossRef] [PubMed] [Green Version]
- Voyer, D.; Voyer, S.D.; Saint-Aubin, J. Sex differences in visual-spatial working memory: A meta-analysis. Psychon. Bull. Rev. 2017, 24, 307–334. [Google Scholar] [CrossRef] [PubMed] [Green Version]
- Babály, B.; Kárpáti, A. The impact of creative construction tasks on visuospatial information processing and problem-solving. Acta Politech. Hung. 2016, 13, 159–180. [Google Scholar] [CrossRef]
- Lerner, F. Visual-Spatial Art and Design Literacy as a Prelude to Aesthetic Growth. Int. J. Art Des. Educ. 2016, 37, 65–73. [Google Scholar] [CrossRef]
- Newcombe, N.S. Picture this: Increasing math and science learning by improving spatial thinking. Am. Educ. 2010, 34, 29–35. Available online: https://www.aft.org/sites/default/files/Newcombe_1.pdf (accessed on 15 January 2023).
- Spires, H.A.; Himes, M.P.; Krupa, E. Supporting Students’ Science Content Knowledge and Motivation through Project-Based Inquiry (PBI) Global in a Cross-School Collaboration. Educ. Sci. 2022, 12, 412. [Google Scholar] [CrossRef]
- Reynolds, S.J.; Piburn, M.D.; Leedy, D.E.; McAuliffe, C.M.; Birk, J.P.; Johnson, J.K. The Hidden Earth—Interactive, computer-based modules for geoscience learning. Geol. Soc. Am. Spec. Pap. 2006, 413, 157–170. [Google Scholar]
- LaForce, M.; Noble, E.; Blackwell, C. Problem-Based Learning (PBL) and Student Interest in STEM Careers: The Roles of Motivation and Ability Beliefs. Educ. Sci. 2017, 7, 92. [Google Scholar] [CrossRef] [Green Version]
- Wai, J.; Lubinski, D.; Benbow, C.P. Spatial ability for STEM domains: Aligning over 50 years of cumulative psychological knowledge solidifies its importance. J. Educ. Psychol. 2009, 101, 817–835. [Google Scholar] [CrossRef]
- Gunderson, E.A.; Ramirez, G.; Beilock, S.L.; Levine, S.C. The relation between spatial skill and early number knowledge: The role of the linear number line. Dev. Psychol. 2012, 48, 1229–1241. [Google Scholar] [CrossRef] [PubMed] [Green Version]
- Verdine, B.N.; Irwin, C.M.; Golinkoff, R.M.; Hirsh-Pasek, K. Contributions of executive function and spatial skills to preschool mathematics achievement. J. Exp. Child Psychol. 2014, 126, 37–51. [Google Scholar] [CrossRef] [PubMed] [Green Version]
- Lubinski, D. Spatial ability and STEM: A sleeping giant for talent identification and development. Personal. Individ. Differ. 2010, 49, 344–351. [Google Scholar] [CrossRef]
- Uttal, D.H.; Cohen, C.A. Spatial thinking and STEM education: When, why, and how? In Psychology of Learning and Motivation; Ross, B., Ed.; Elsevier: Cambridge, MA, USA, 2012; Volume 57, pp. 147–181. [Google Scholar]
- McClarty, K.L.; Orr, A.; Frey, P.M.; Dolan, R.P.; Vassileva, V.; McVay, A. A Literature Review of Gaming in Education; Research Report; Pearson: Upper Saddle River, NJ, USA, 2012; pp. 1–35. [Google Scholar]
- Krisztián, Á.; Bernáth, L.; Gombos, H.; Vereczkei, L. Developing numerical ability in children with mathematical difficulties using origami. Percept. Mot. Ski. 2015, 121, 233–243. [Google Scholar] [CrossRef]
- Feldman, A. STEAM Rising: Why We Need to Put the Arts Into STEM Education. Slate, June 2015. Available online: https://slate.com/technology/2015/06/steam-vs-stem-why-we-need-to-put-the-arts-into-stem-education.html (accessed on 15 January 2023).
- Virani, T. Closing the Gender Gap: How Girls and STEAM Are Stepping Up. Vancouver Tech Journal, December 2021. Available online: https://www.vantechjournal.com/p/gender-gap-steam (accessed on 15 January 2023).
- Uttal, D.H.; Meadow, N.G.; Tipton, E.; Hand, L.L.; Alden, A.R.; Warren, C.; Newcombe, N.S. The malleability of spatial skills: A meta-analysis of training studies. Psychol. Bull. 2013, 139, 352–402. [Google Scholar] [CrossRef] [Green Version]
- Beták, M. Príklady didaktických materiálov pre rozvoj priestorových schopností žiakov pomocou Lego počas dištančného vzdelávania (Examples of didactic materials for the development of spatial skills using Lego during the distance learning). J. Technol. Inf. Educ. 2021, 2, 191–204. [Google Scholar] [CrossRef]
- Kmeťová, M.; Nagyová Lehocká, Z. Using Tangram as a Manipulative Tool for Transition between 2D and 3D Perception in Geometry. Mathematics 2021, 9, 2185. [Google Scholar] [CrossRef]
- Kmeťová, M.; Nagyová Lehocká, Z.; Szabó, T. Creativity and spatial skills in solid geometry and plane geometry in primary schools. In Proceedings of the 14th Annual International Conference of Education: Research and Innovation, Online Conference, 8–9 November 2021. [Google Scholar] [CrossRef]
- Nagyová Lehocká, Z.; Csáky, A.; Žitný, R. Best practices for improving spatial imagination in mathematics. AD ALTA J. Interdiscip. Res. 2021, 1, 162–166. [Google Scholar] [CrossRef]
- Lehot’áková, E.; Tóth, A. A térbeli alkotás oktatási jelentősége az általános iskolában (The significance of teaching spatial representation in primary school). Kultúratudományi Szemle. (Cult. Stud. Rev.) 2021, 4, 123–134. [Google Scholar]
- Tóth, A.; Žitný, R.; Szabó, T.; Csáky, A.; Kárpáti, A. Possibilities of Development of Spatial Imagination. In Proceedings of the 13th International Conference of Education, Research and Innovation: Transforming Education, Transforming Lives, Sevilla, Spain, 9–10 November 2020; Gómez Chova, L., López Martínez, A., Candel Torres, I., Eds.; International Academy of Technology, Education and Development (IATED): Valencia, Spain, 2020; pp. 565–573. [Google Scholar] [CrossRef]
- Žitný, R.; Szabó, T. Assignments in information science subject aimed to improve pupils’ spatial imagination. In Proceedings of the 20th Anniversary of International Conference on Emerging eLearning Technologies and Application, Starý Smokovec, Slovakia, 20–21 October 2022. [Google Scholar] [CrossRef]
- National Education Program for Lower Secondary Education in Slovak Republic-Informatics. Available online: https://www.statpedu.sk/files/articles/dokumenty/inovovany-statny-vzdelavaci-program/informatika_nsv_2014.pdf (accessed on 17 November 2022).
- National Education Program for Lower Secondary Education in Slovak Republic-Mathematics. Available online: https://www.statpedu.sk/files/articles/dokumenty/inovovany-statny-vzdelavaci-program/matematika_nsv_2014.pdf (accessed on 17 November 2022).
- National Education Program for Lower Secondary Education in Slovak Republic-Art Education. Available online: https://www.statpedu.sk/files/articles/dokumenty/inovovany-statny-vzdelavaci-program/vytvarna-vychova_nsv_2014.pdf (accessed on 17 November 2022).
- Kárpáti, A.; Babály, B.; Budai, L. Developmental assessment of spatial abilities through interactive, online 2D and virtual 3D tasks. Int. J. Arts Educ. 2014, 12, 94–124. Available online: http://ed.arte.gov.tw/uploadfile/periodical/3441_4-1-1124.pdf (accessed on 15 January 2023).
- Kárpáti, A.; Babály, B. Development of spatial skills through the Moholy-Nagy Visual Modules: A longitudinal study. In Crossing Boundaries and Disciplines: The Book of Selected Readings; Baylen, D.M., Ed.; International Visual Literacy Association (IVLA): Chicago, IL, USA, 2020; pp. 24–43. Available online: https://ivla.org/wp-content/uploads/2021/04/C2-FINAL-TBSR-2019-KARPATI-BABALY-FINAL.pdf (accessed on 15 January 2023).
- Urban, K. On the development of creativity in children. Creat. Res. J. 1991, 4, 177–191. [Google Scholar] [CrossRef]
- Kárpáti, A.; Gyebnár, V. The Test for Creative Thinking: An authentic tool for art education to assess creativity through visual expression. Vis. Inq. Learn. Teach. Art 2013, 2, 27–42. [Google Scholar] [CrossRef] [PubMed]
- Molnár, G.; Csapó, B. Online Diagnostic Assessment in Support of Personalized Teaching and Learning: The eDia System. Front. Psychol. 2019, 10, 183–196. [Google Scholar] [CrossRef] [Green Version]
Figure 1.
Sample task from the unit entitled “The Squares”, the arrow shows the starting position and the direction.
Figure 1.
Sample task from the unit entitled “The Squares”, the arrow shows the starting position and the direction.

Figure 2.
Sample task from the unit entitled “Space Cubes”.

Figure 3.
City building projects by students in (a) Grade 5; (b) Grade 6.

Figure 4.
(a) The stimulus for “The ladybird’s route” task: a 3D, spatial construction; (b) the solution of the task in a 2D drawing.
Figure 4.
(a) The stimulus for “The ladybird’s route” task: a 3D, spatial construction; (b) the solution of the task in a 2D drawing.

Figure 5.
“Make a map of your town/village indicating the most important buildings of your choice!” Girl, 6th grade.
Figure 5.
“Make a map of your town/village indicating the most important buildings of your choice!” Girl, 6th grade.

Figure 6.
(a) Photo of the desk of a boy, Grade 5; (b) drawing of the same desk. Boy, Grade 5.

Figure 7.
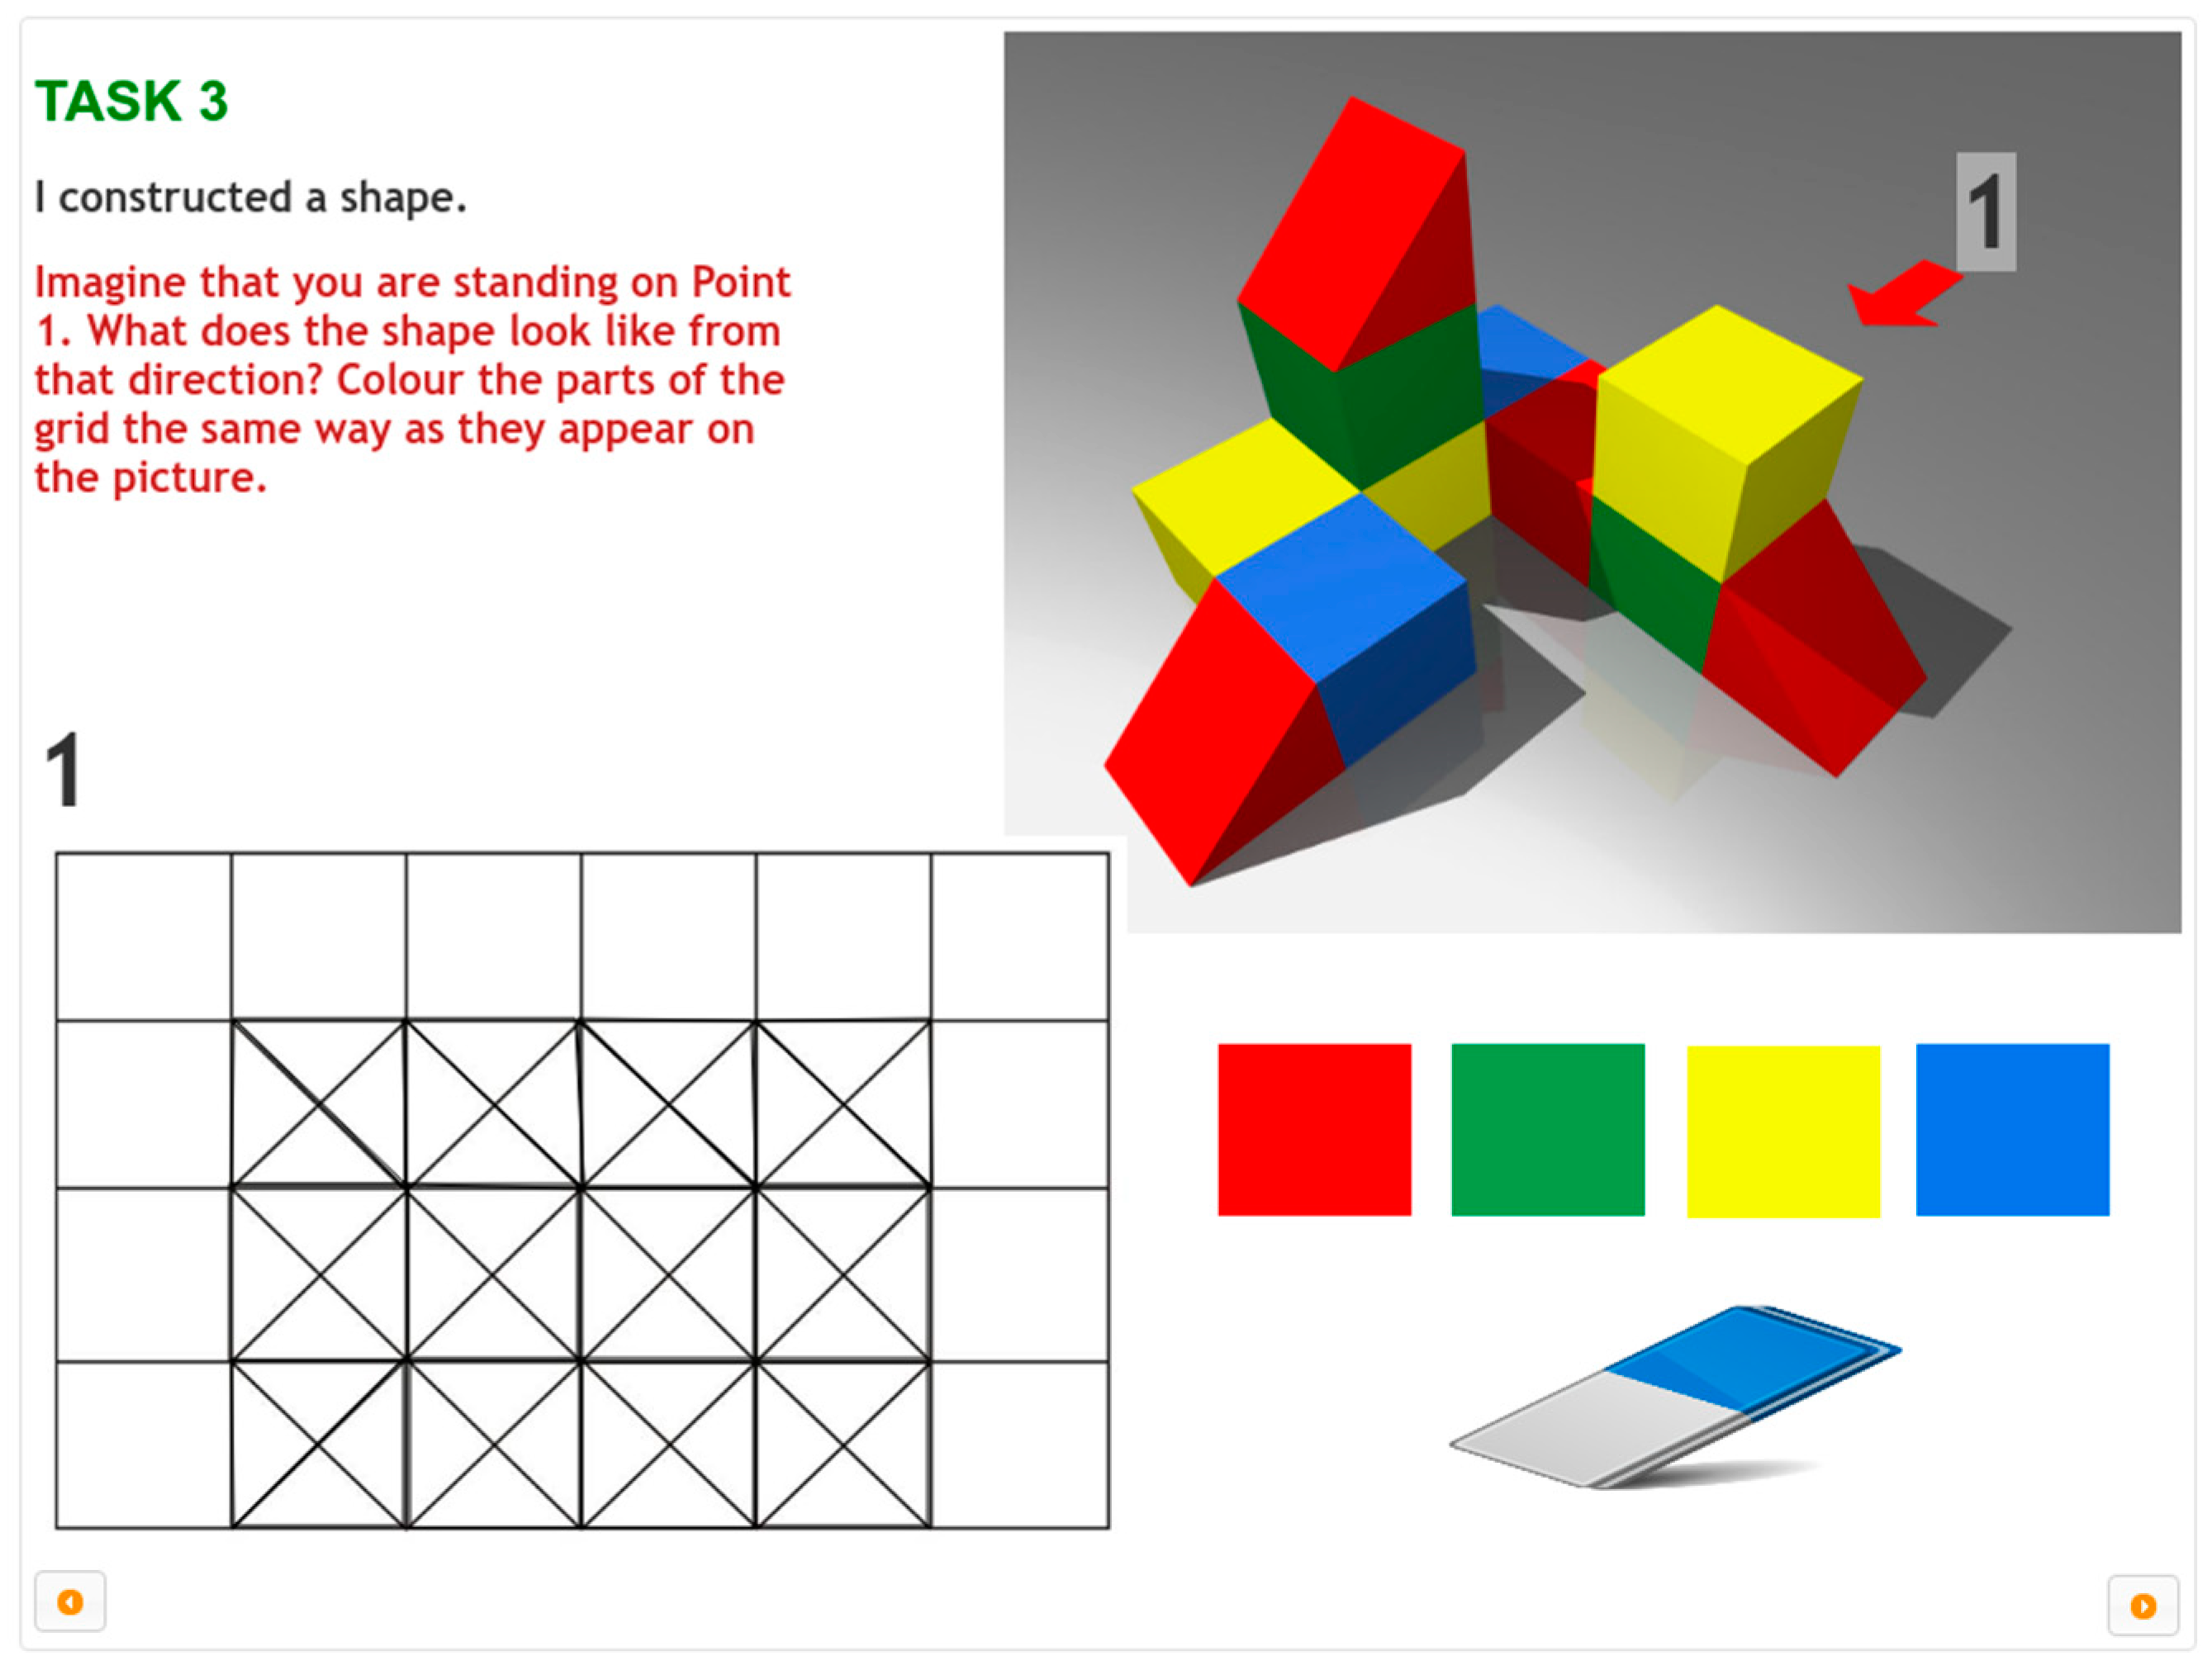
Visualisation task from eDIA, the online Hungarian testing environment (Grade 5). (“I constructed a shape. Imagine that you are standing on Point 1. What does the shape look like from that direction? Colour the parts of the grid the same way as they appear on the picture.”) The item from the paper-based test was completed on paper, with coloured pencil. The same item from the online test is completed through adding colours through mouse clicks.
Figure 7.
Visualisation task from eDIA, the online Hungarian testing environment (Grade 5). (“I constructed a shape. Imagine that you are standing on Point 1. What does the shape look like from that direction? Colour the parts of the grid the same way as they appear on the picture.”) The item from the paper-based test was completed on paper, with coloured pencil. The same item from the online test is completed through adding colours through mouse clicks.

Figure 8.
Results of Grade 5 (paper-based test takers: N = 100, digital test takers: N = 342).

Figure 9.
Results of Grade 5 and Grade 6 (pre-test takers: N = 100, post-test takers: N = 100).

Figure 10.
Results according to subskills in Grade 5 (paper-based test takers: N = 100, digital test takers: N = 342).
Figure 10.
Results according to subskills in Grade 5 (paper-based test takers: N = 100, digital test takers: N = 342).

Figure 11.
Results in Grade 5 (pre-test) and Grade 6 (post-test). N = 100 for pre- and post-test.

Figure 12.
Dendrogram, Grade 5 (N = 100).

Figure 13.
Comparison of the performance of the 5th- and 6th-graders at the different institutions (pre-test N = 100, post-test N = 100).
Figure 13.
Comparison of the performance of the 5th- and 6th-graders at the different institutions (pre-test N = 100, post-test N = 100).

Figure 14.
Comparison of spatial skills test results of Grades 5 and 6. (Pre-test taken by 5th-graders, N = 100, post-test taken by 6th-graders, N = 100). Note: Class names contain the following code: a letter S for the school and a number that indicates the school’s location. The second part of the code contains the abbreviation of the student performance level at the beginning of the experiment: low- or high-performing class. An example: S1-LPC means School 1, low-performing class.

Figure 15.
Comparison of the results of pre- and post-tests of the students according to their gender (girls, N = 50, boys, N = 50).
Figure 15.
Comparison of the results of pre- and post-tests of the students according to their gender (girls, N = 50, boys, N = 50).

Figure 16.
Comparison of results in Grade 5 (pre-test) and Grade 6 (post-test) of the two experimental groups (LPC, low-performing class N = 45, HPC, high-performing class N = 47).
Figure 16.
Comparison of results in Grade 5 (pre-test) and Grade 6 (post-test) of the two experimental groups (LPC, low-performing class N = 45, HPC, high-performing class N = 47).

Figure 17.
Comparison of the performance of the 5th- and 6th-graders at the participating schools (pre-test N = 92, post-test N = 92).
Figure 17.
Comparison of the performance of the 5th- and 6th-graders at the participating schools (pre-test N = 92, post-test N = 92).

Figure 18.
Comparison of creativity test results of Grades 5 and 6. (Pre-test taken by 5th-graders, N = 92, post-test taken by 6th-graders, N = 92). Note: Class names include a letter S for the school and a number that indicates the school’s location. The second part of the code contains the abbreviation of the student performance level at the beginning of the experiment: low- or high-performing class. An example: S1-LPC means School 1, low-performing class.


Table 1.
Sample sizes by school, gender, treatment type, and location of the school.
| Research Participants | School 1 | School 2 | School 3 | Total | |
|---|---|---|---|---|---|
| Sample size | 30 | 42 | 28 | 100 | |
| Gender | Girls | 15 | 20 | 15 | 50 |
| Boys | 15 | 22 | 13 | 50 | |
| Treatment type | Basic skill development | 15 | 20 | 14 | 49 |
| Skill enhancement | 20 | 22 | 14 | 51 | |
Table 2.
Reliability values of the test.
| Grades | Type of Assessment Tool | N | Number of Items | Cronbach’s Alpha |
|---|---|---|---|---|
| 5th–6th | paper-based test | 200 | 10 | 0.88 |
| 5th | digital test | 342 | 10 | 0.83 |
Table 3.
Results of the spatial skills test in 5th grade (pre-test) and 6th grade (post-test) in paper-based and digital testing environments.
Table 3.
Results of the spatial skills test in 5th grade (pre-test) and 6th grade (post-test) in paper-based and digital testing environments.
| Grades | Type of Assessment Tool | N | Number of Items | Mean (Point) | Mean (%) | Median (%) | Std. Deviation (%) | Minimum (%) | Maximum (%) |
|---|---|---|---|---|---|---|---|---|---|
| 5th | paper-based test | 100 | 10 | 5.33 | 53.30 | 50 | 33.73 | 0 | 100 |
| 6th | paper-based test | 100 | 10 | 7.9 | 79.00 | 90 | 23.93 | 10 | 100 |
| 5th | digital test | 342 | 10 | 5.34 | 53.36 | 50 | 29.80 | 0 | 100 |
Table 4.
Test results by institutions, Grade 5 (S1–S9: digital test takers: N = 342, S10–S12 paper-based test takers: N = 100).
Table 4.
Test results by institutions, Grade 5 (S1–S9: digital test takers: N = 342, S10–S12 paper-based test takers: N = 100).
| School Codes | Type of Assessment Tool | N | Mean (%) | Std. Deviation (%) | Minimum (%) | Maximum (%) |
|---|---|---|---|---|---|---|
| S1 | digital test | 59 | 39.83 | 26.62 | 0.00 | 90.00 |
| S2 | digital test | 35 | 64.29 | 26.71 | 0.00 | 100.00 |
| S3 | digital test | 23 | 60.43 | 28.36 | 10.00 | 100.00 |
| S4 | digital test | 50 | 70.40 | 26.95 | 10.00 | 100.00 |
| S5 | digital test | 24 | 58.75 | 31.94 | 10.00 | 100.00 |
| S6 | digital test | 42 | 37.86 | 25.43 | 0.00 | 100.00 |
| S7 | digital test | 41 | 65.37 | 26.37 | 10.00 | 100.00 |
| S8 | digital test | 34 | 46.76 | 28.04 | 10.00 | 100.00 |
| S9 | digital test | 34 | 43.23 | 29.20 | 0.00 | 100.00 |
| S10 | paper-based test | 30 | 48.67 | 32.88 | 0.00 | 100.00 |
| S11 | paper-based test | 42 | 38.33 | 31.23 | 0.00 | 100.00 |
| S12 | paper-based test | 28 | 80.71 | 19.42 | 20.00 | 100.00 |
Table 5.
Student performance on the pre- and post-test: a comparison of results of the two experimental groups (N = 100).
Table 5.
Student performance on the pre- and post-test: a comparison of results of the two experimental groups (N = 100).
| Experimental Groups | Pre-Test (%) | Post-Test (%) | Pre- and Post-Test (%) | |||
|---|---|---|---|---|---|---|
| Mean | Standard Deviation | Mean | Standard Deviation | Paired-Samples t-Test | Cohen’s d | |
| Low-performing classes (N = 49) | 45.51 | 32.73 | 77.35 | 20.89 | t = 8.87, p < 0.01 | 1.16 |
| High-performing classes (N = 51) | 60.78 | 33.28 | 80.59 | 26.64 | t = 5.78, p < 0.01 | 0.66 |
| Independent-samples t-test | t = 2.31, p < 0.05 | t = 0.68, p = 0.50 n.s. * | ||||
* not significant.
Table 6.
Results in the tasks of the different spatial subskills, according to gender.
| Subskills | Gender | N | Mean (%) | Standard Deviation (%) | Independent-Samples t-Test |
|---|---|---|---|---|---|
| Visualisation (Grade 5) | Boys | 50 | 45.20 | 40.569 | t = 0.66 p = 0.51 |
| Girls | 50 | 40.00 | 38.545 | ||
| Spatial orientation (Grade 5) | Boys | 50 | 70.00 | 35.714 | t = 2.13 p < 0.05 |
| Girls | 50 | 53.50 | 41.653 | ||
| Mental rotation (Grade 5) | Boys | 50 | 70.00 | 46.291 | t = −0.67 p = 0.50 |
| Girls | 50 | 76.00 | 43.142 | ||
| Test (Grade 5) | Boys | 50 | 57.60 | 32.86 | t = 1.28 p = 0.20 |
| Girls | 50 | 49.00 | 34.36 | ||
| Visualisation (Grade 6) | Boys | 50 | 77.60 | 27.89 | t = 1.60 p = 0.11 |
| Girls | 50 | 68.40 | 29.72 | ||
| Spatial orientation (Grade 6) | Boys | 50 | 88.50 | 23.80 | t = 1.42 p = 0.16 |
| Girls | 50 | 81.00 | 28.82 | ||
| Mental rotation (Grade 6) | Boys Girls | 50 50 | 90.00 82.00 | 30.30 38.81 | t = −1.15 p = 0.25 |
| Test (Grade 6) | Boys | 50 | 83.20 | 21.99 | t = 1.77 p = 0.08 |
| Girls | 50 | 74.80 | 25.25 |
Table 7.
Major indices of the Test for Creative Thinking (TCT).
| Grades | Type of Assessment Tool | N | Number of Items | Mean (Point) | Median (Point) | Std. Deviation (Point) | Minimum (Point) | Maximum (Point) |
|---|---|---|---|---|---|---|---|---|
| 5th | paper-based test | 92 | 1 | 16.32 | 16.00 | 5.13 | 2 | 33 |
| 6th | paper-based test | 92 | 1 | 23.29 | 23.00 | 8.13 | 8 | 56 |
Table 8.
Student performance on the pre- and post-TCT test: a comparison of results of the two experimental groups (N = 92).
Table 8.
Student performance on the pre- and post-TCT test: a comparison of results of the two experimental groups (N = 92).
| Experimental Groups | Pre-Test TCT (Point) | Post-Test TCT (Point) | Pre- and Post-Test TCT (Point) | |||
|---|---|---|---|---|---|---|
| Mean | Standard Deviation | Mean | Standard Deviation | Paired-Samples t-Test | Cohen’s d | |
| Low-performing classes (N = 45) | 15.93 | 3.62 | 21.56 | 5.56 | t = 5.77, p < 0.01 | 1.20 |
| High-performing classes (N = 47) | 16.68 | 6.26 | 24.96 | 9.77 | t = 6.09, p < 0.01 | 1.01 |
| Independent-samples t-test | t = 0.70 p = 0.49 n.s. * | t = 2.06 p < 0.05 | - | |||
* not significant.
Table 9.
Student performance on the pre- and post-TCT test: a comparison of results by gender (N = 92).
Table 9.
Student performance on the pre- and post-TCT test: a comparison of results by gender (N = 92).
| Gender | Pre-Test TCT (Point) | Post-Test TCT (Point) | Pre- and Post-Test TCT (Point) | |||
|---|---|---|---|---|---|---|
| Mean | Standard Deviation | Mean | Standard Deviation | Paired-Samples t-Test | Cohen’s d | |
| Girls (N = 45) | 17.67 | 3.90 | 24.64 | 9.14 | t = 5.28, p < 0.01 | 0.99 |
| Boys (N = 47) | 15.02 | 5.83 | 22.00 | 6.87 | t = 6.39, p < 0.01 | 1.10 |
| Independent-samples t-test | t = 2.55; p < 0.02 | t = 2.06; p = 0.12 n.s. * | ||||
* not significant.
Disclaimer/Publisher’s Note: The statements, opinions and data contained in all publications are solely those of the individual author(s) and contributor(s) and not of MDPI and/or the editor(s). MDPI and/or the editor(s) disclaim responsibility for any injury to people or property resulting from any ideas, methods, instructions or products referred to in the content. |
© 2023 by the authors. Licensee MDPI, Basel, Switzerland. This article is an open access article distributed under the terms and conditions of the Creative Commons Attribution (CC BY) license (https://creativecommons.org/licenses/by/4.0/).
Share and Cite
MDPI and ACS Style
Szabó, T.; Babály, B.; Pataiová, H.; Kárpáti, A. Development of Spatial Abilities of Preadolescents: What Works? Educ. Sci. 2023, 13, 312. https://doi.org/10.3390/educsci13030312
AMA Style
Szabó T, Babály B, Pataiová H, Kárpáti A. Development of Spatial Abilities of Preadolescents: What Works? Education Sciences. 2023; 13(3):312. https://doi.org/10.3390/educsci13030312
Chicago/Turabian StyleSzabó, Tibor, Bernadett Babály, Helena Pataiová, and Andrea Kárpáti. 2023. "Development of Spatial Abilities of Preadolescents: What Works?" Education Sciences 13, no. 3: 312. https://doi.org/10.3390/educsci13030312
Note that from the first issue of 2016, this journal uses article numbers instead of page numbers. See further details here.