
Gamifying Physics Laboratory Work Increases Motivation and Enhances Acquisition of the Skills Required for Application of the Scientific Method
 , , and
Abstract
:1. Introduction
2. Materials and Methods
2.1. Participants and Context
2.2. Description of Gamified and Non-Gamified Dynamics
2.3. Assessment of Student Satisfaction through a Survey
2.4. Assessment of Learning Outcomes
2.5. Data Analysis
2.5.1. Analysis of the Student Satisfaction Survey
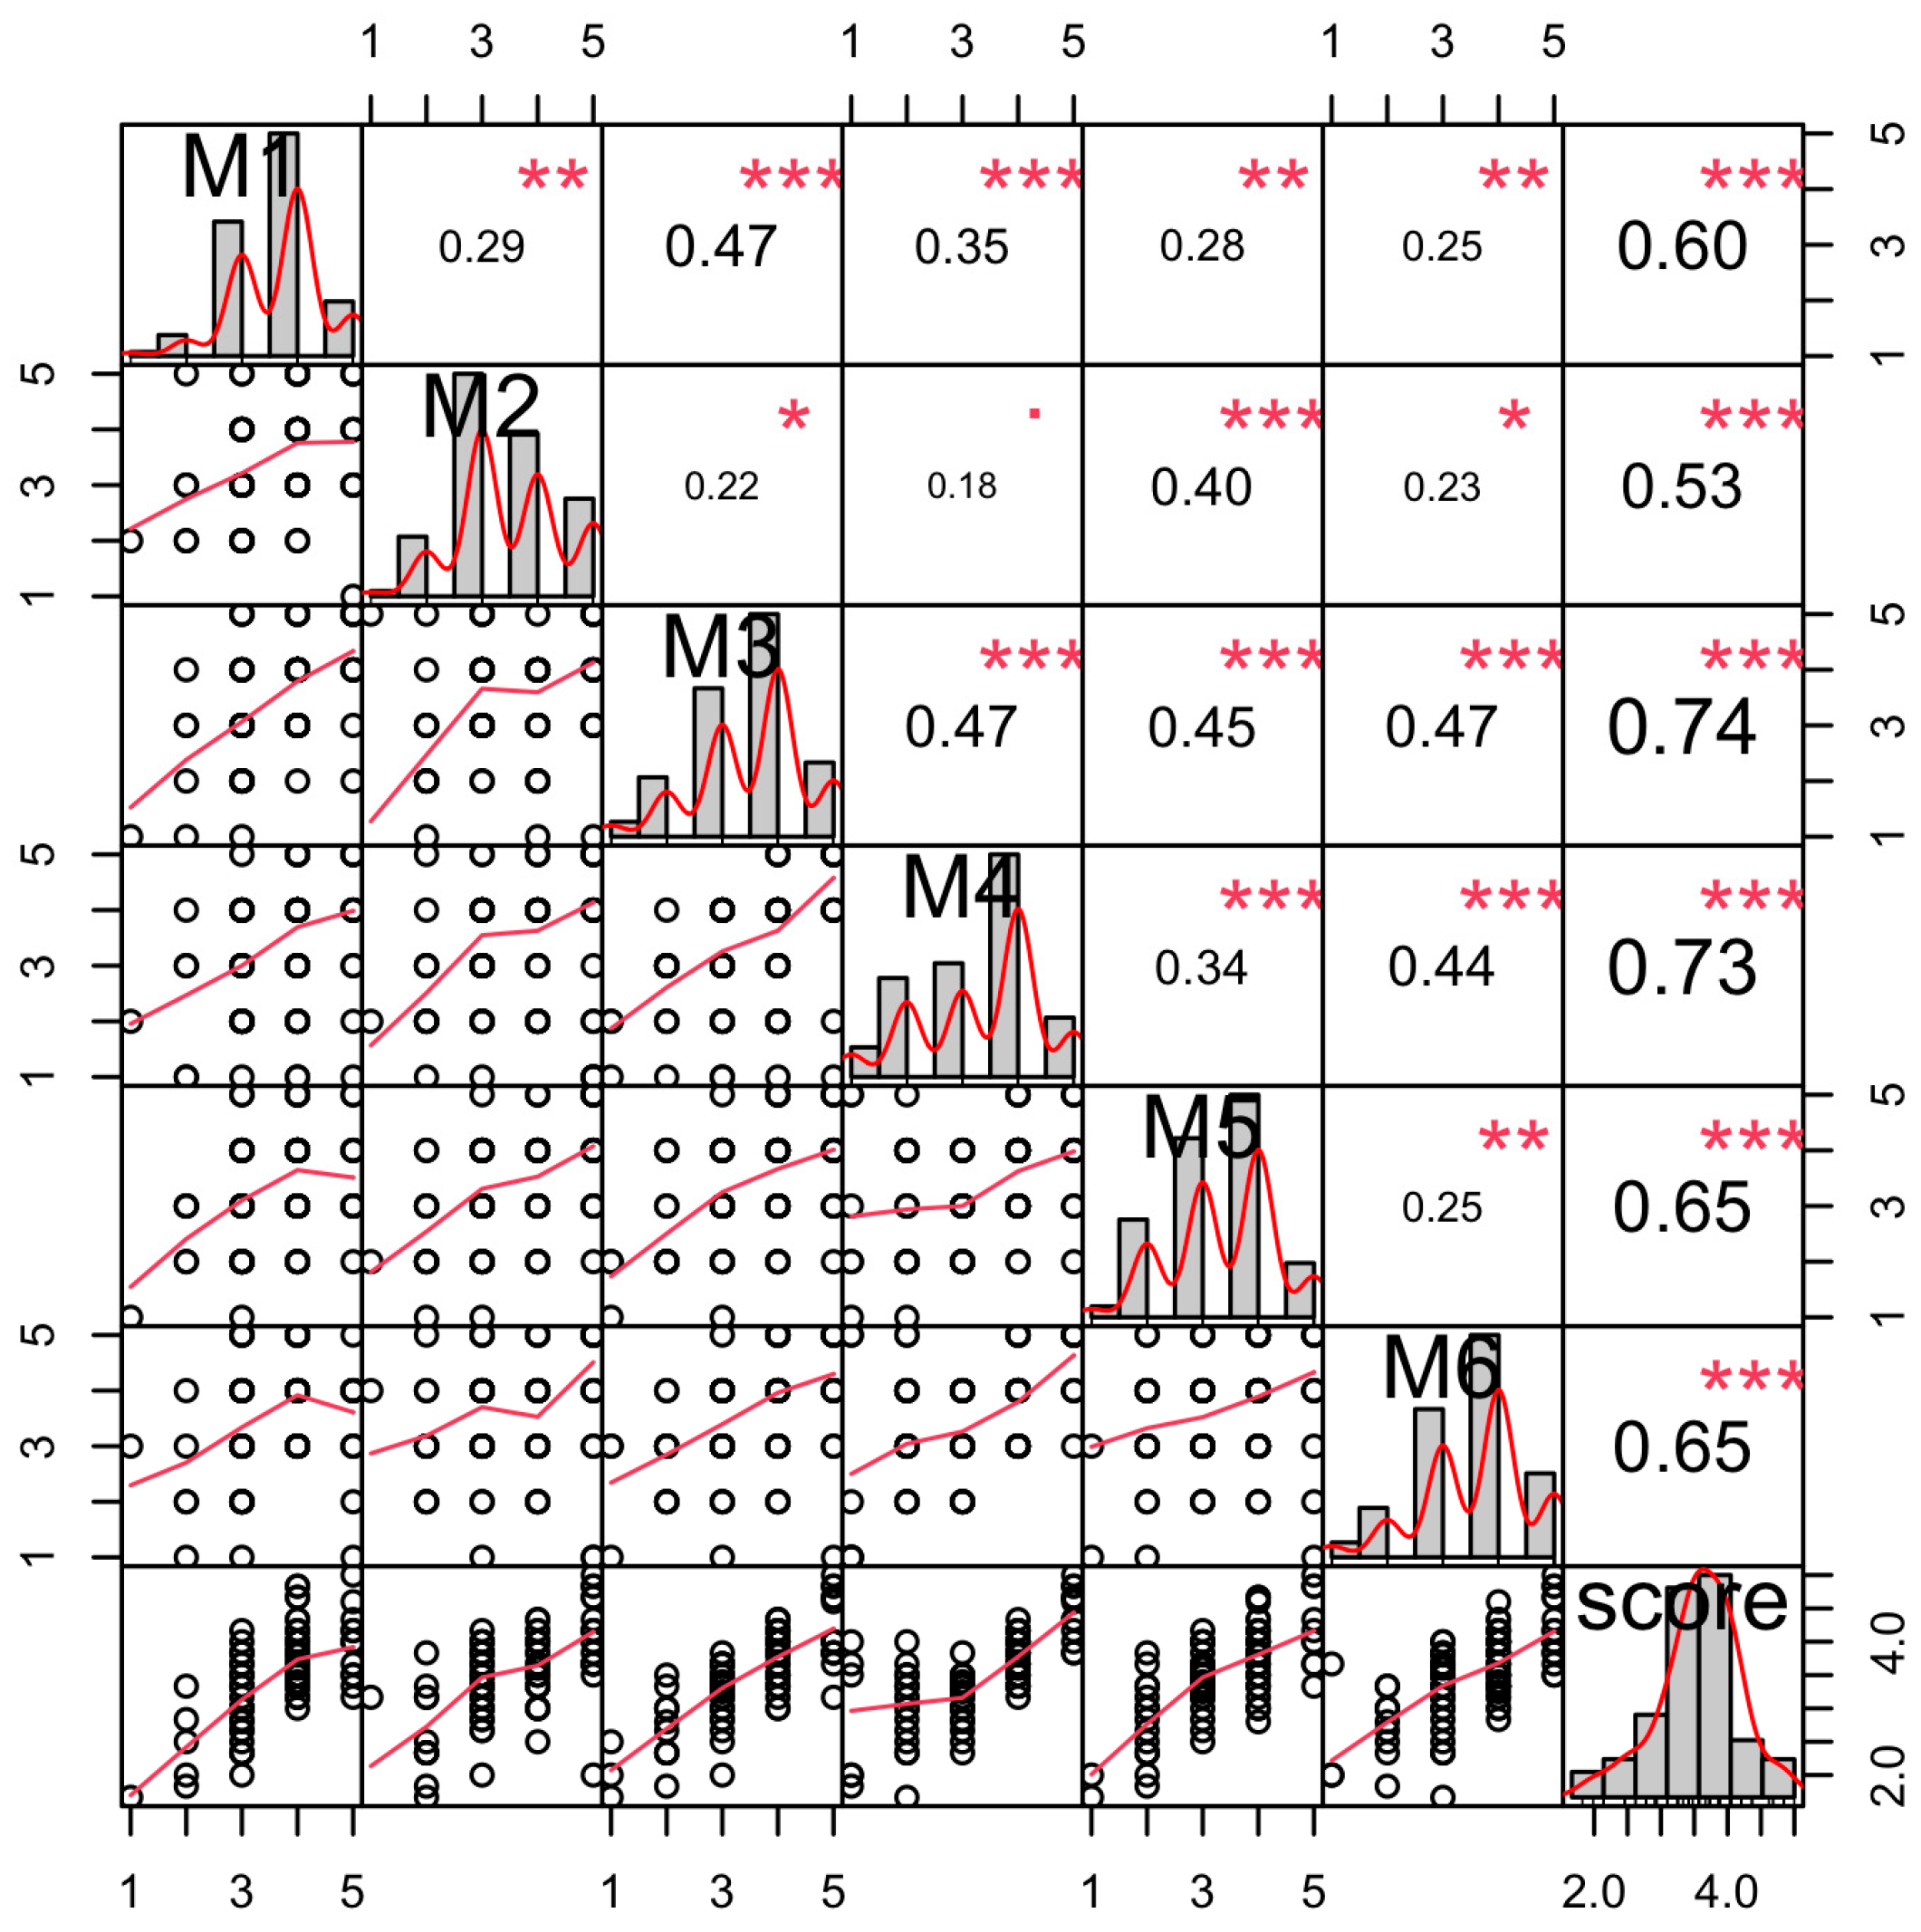
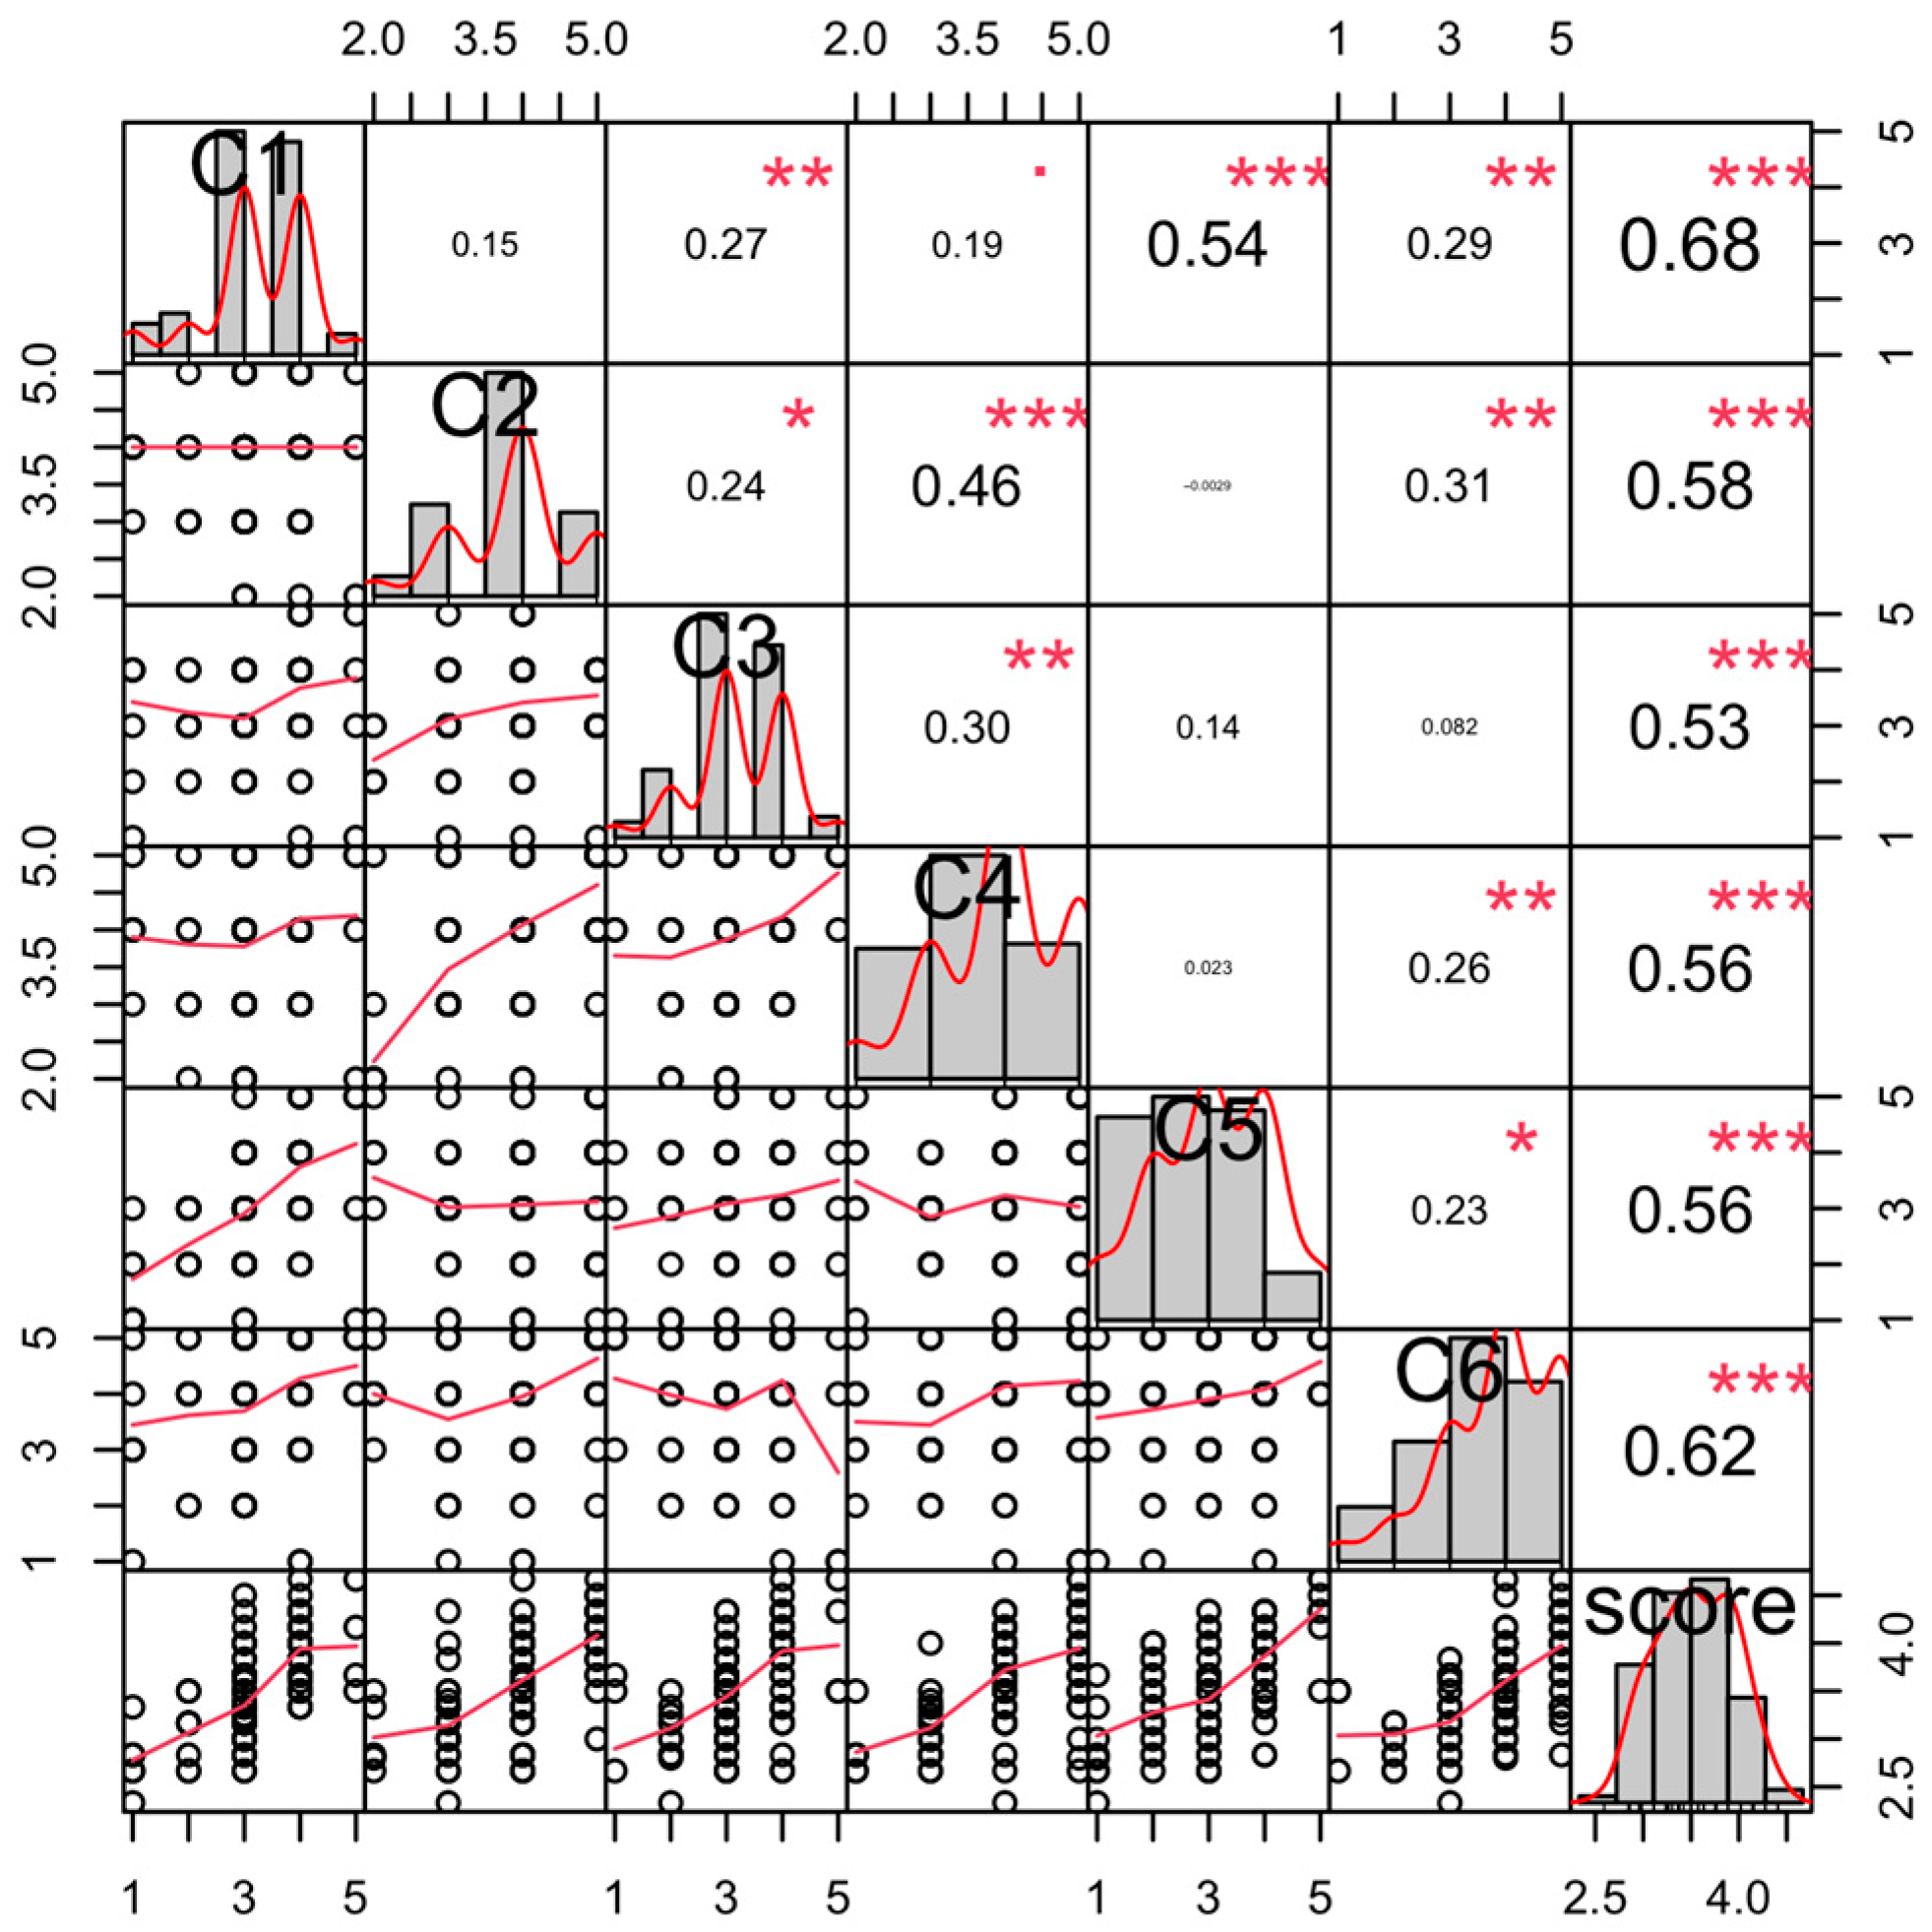
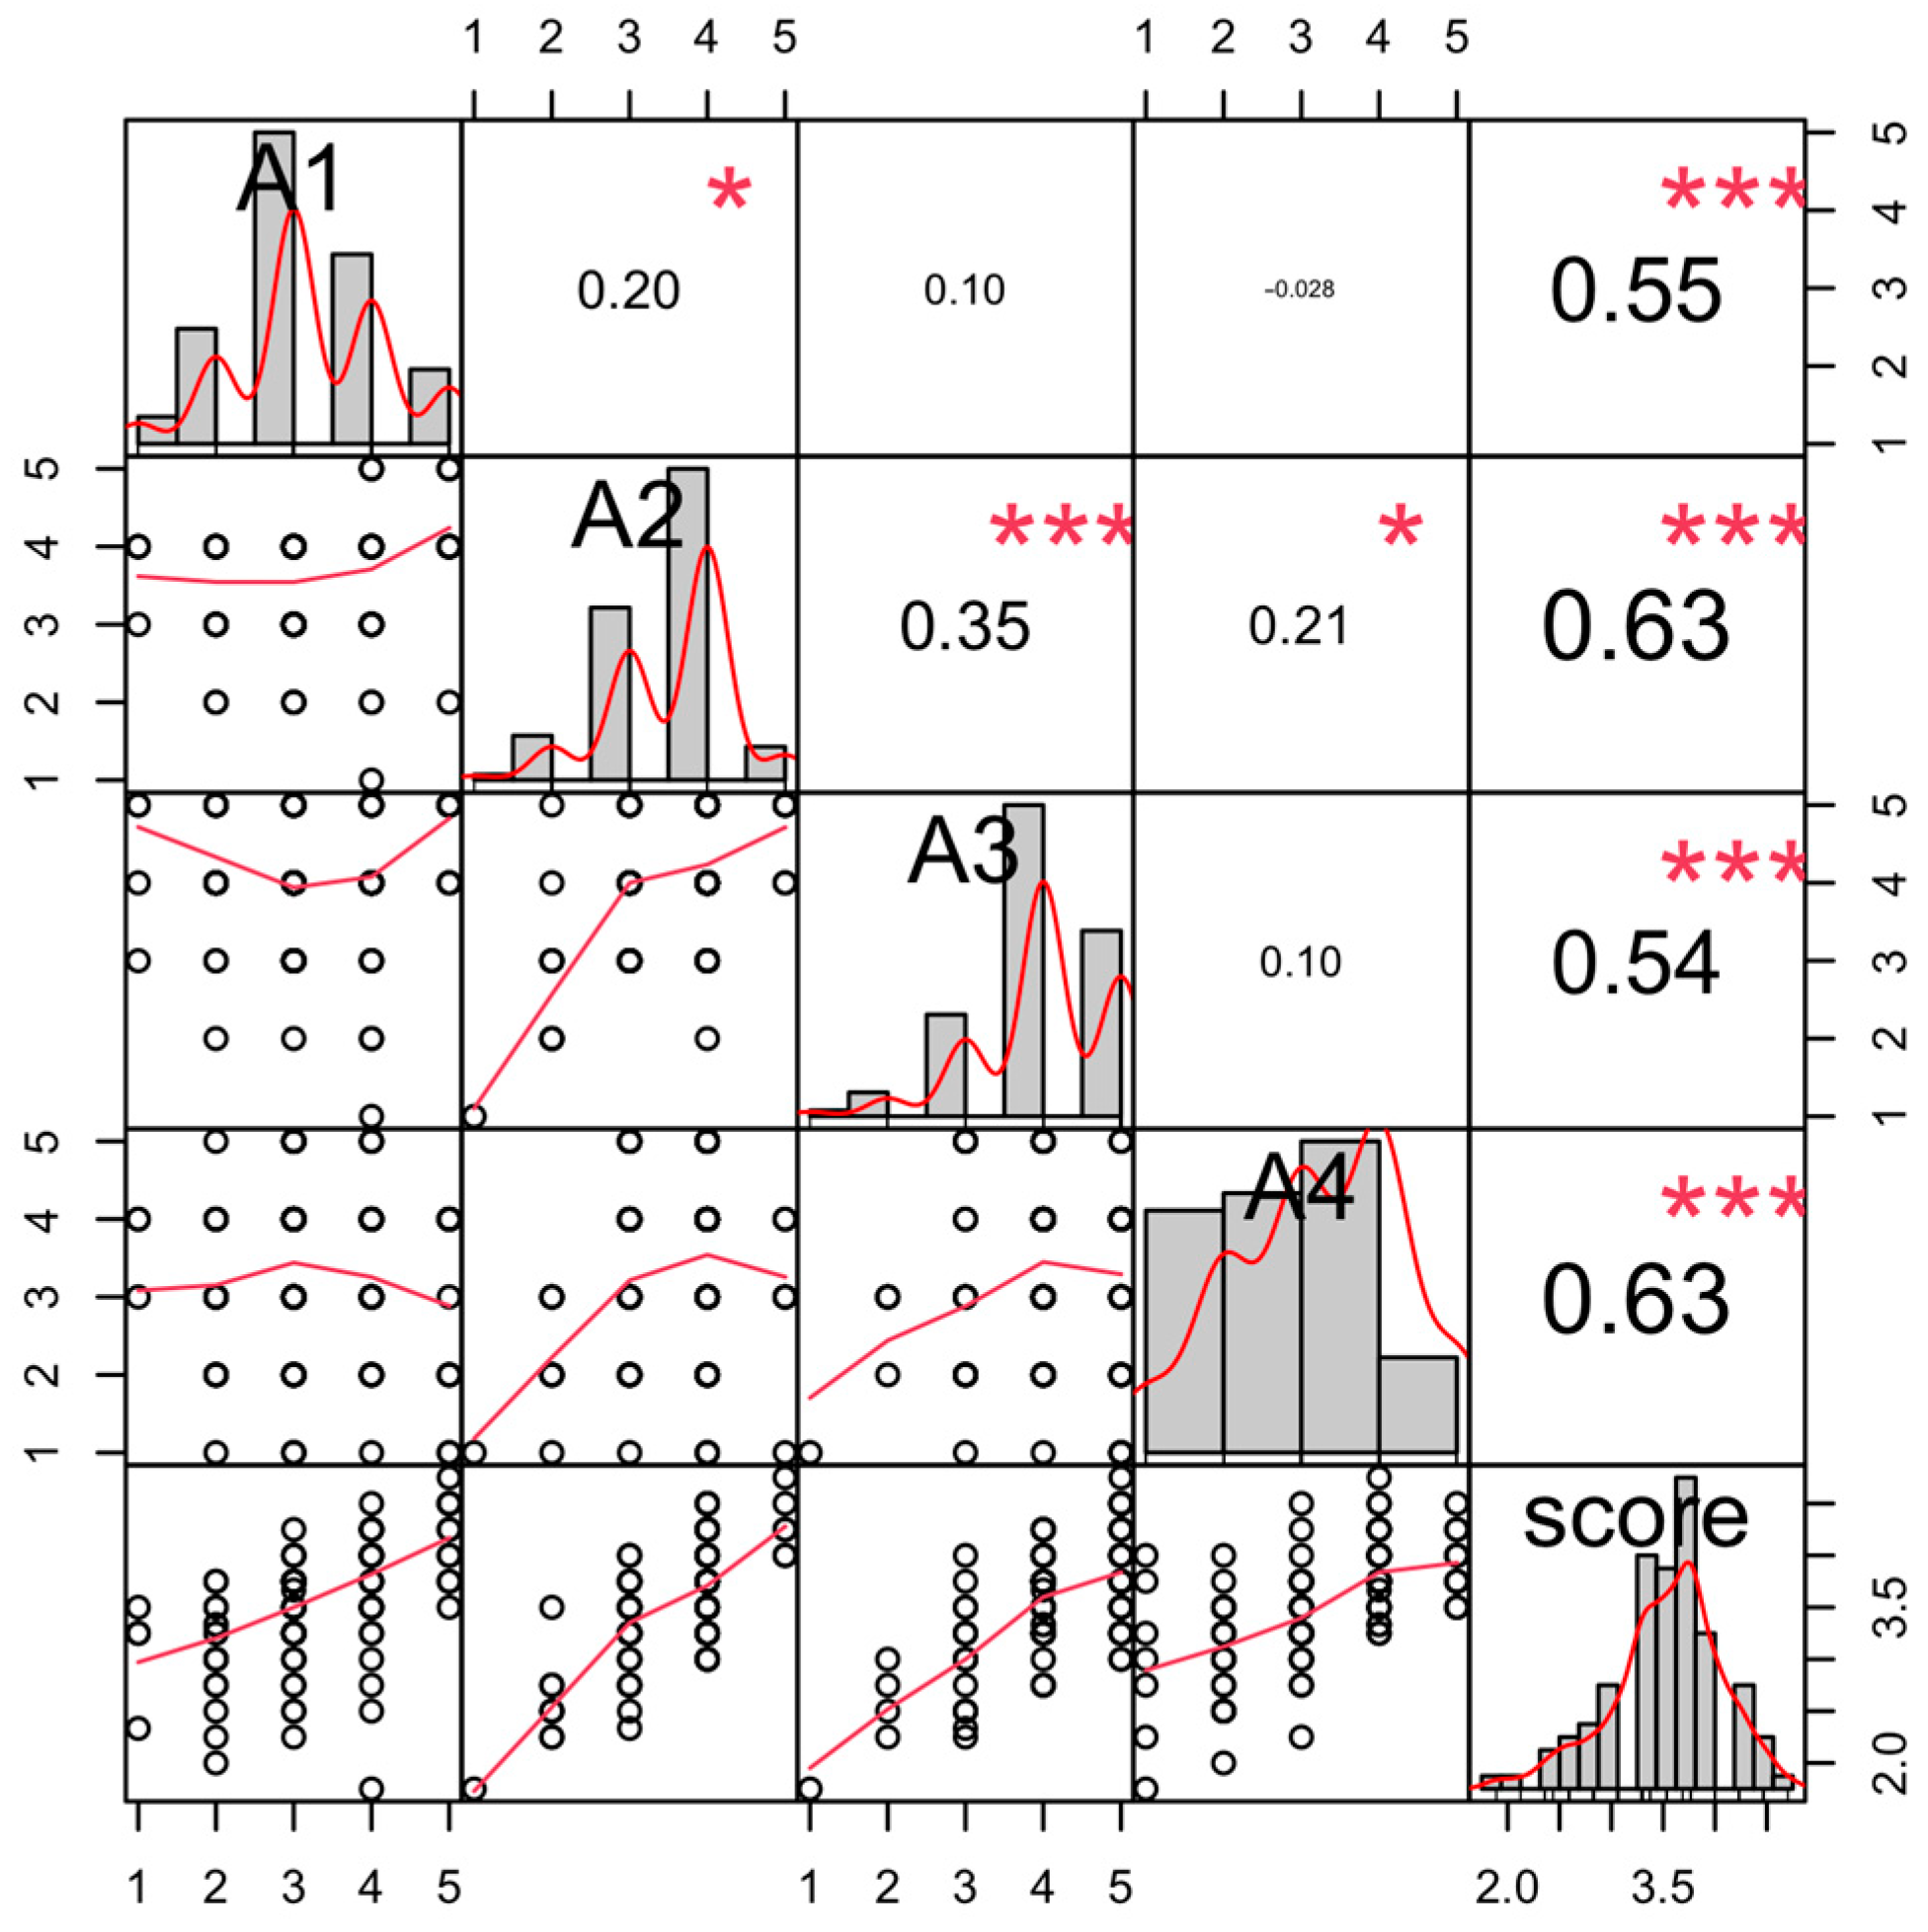
Validity and Internal Consistency
Effects of Gamification Sessions on Student Satisfaction
2.5.2. Analysis of Learning Outcomes
3. Results
3.1. Satisfaction, Survey Validity and Internal Consistency
3.2. Effects of Gamified Sessions on Student Motivation
3.3. Effects of Gamified Sessions on Learning Outcomes
4. Discussion and Conclusions
Author Contributions
Funding
Institutional Review Board Statement
Informed Consent Statement
Data Availability Statement
Conflicts of Interest
Appendix A
- –
- Dynamics of the particle
- –
- Work, energy and its conservation
- –
- Lineal momentum and its conservation
- –
- Dynamics of the rigid solid
- –
- Angular momentum and its conservation
- –
- Electric field and Gauss’s law
- –
- Electric potential
- –
- Capacitors and capacitance
- –
- Direct-current circuits
- –
- Magnetic field
- –
- Electromagnetic induction
- –
- Equations of Maxwell, electromagnetic waves.
Appendix B

| Motivation (M) | Likert Scale | ||||
| I´ve acquired skills invaluable for my training as an Engineer. | 1 | 2 | 3 | 4 | 5 |
| Completing the tasks satisfies me | 1 | 2 | 3 | 4 | 5 |
| The laboratory sessions have been stimulating and enriching | 1 | 2 | 3 | 4 | 5 |
| The laboratory dynamics don’t stimulate motivation to learn | 1 | 2 | 3 | 4 | 5 |
| I have progressed during the sessions, which encouraged me to persevere in my efforts | 1 | 2 | 3 | 4 | 5 |
| I get bored during lab sessions | 1 | 2 | 3 | 4 | 5 |
| Commitment and attitude (C) | Likert scale | ||||
| I feel identified with the way the class is run | 1 | 2 | 3 | 4 | 5 |
| I get involved and try to learn from and teach others | 1 | 2 | 3 | 4 | 5 |
| I am not consistent when faced with the difficulties of the proposed tasks | 1 | 2 | 3 | 4 | 5 |
| My behavior is positive with respect to the development of sessions and tasks | 1 | 2 | 3 | 4 | 5 |
| I would prefer to do the practicals/practical exercises using a different methodology | 1 | 2 | 3 | 4 | 5 |
| I can rely on my teammates for support when I need help | 1 | 2 | 3 | 4 | 5 |
| Subject-related knowledge, materials and suitability (A) | Likert scale | ||||
| My preparation for this type of lab-work has been adequate | 1 | 2 | 3 | 4 | 5 |
| The methodology applied is appropriate to the characteristics of the groups and to the subject | 1 | 2 | 3 | 4 | 5 |
| I find help and support in the materials provided and/or from the lab instructors | 1 | 2 | 3 | 4 | 5 |
| There is hardly any relationship between the lectures and the laboratory sessions | 1 | 2 | 3 | 4 | 5 |
| Category of the Items | Evaluated Skill | Item |
|---|---|---|
| Hypotheses | Hypothesis proposals |
|
| Formulation of hypotheses |
| |
| ||
| Experimental design and setup | Experimental design |
|
| ||
| ||
| ||
| Experimental setup |
| |
| ||
| Analysis of results | Presentation of experimental conditions and collected data |
|
| Graphical representation and quantification |
| |
| Error handling |
| |
| Adequate expression of measurements |
| |
|
| Category C | Category A | ||||||||
|---|---|---|---|---|---|---|---|---|---|
| Alpha | Lower CI | Upper CI | SE | Alpha | Lower CI | Upper CI | SE | ||
| C1 | 0.70 | 0.48 | 0.92 | 0.11 | A1 | 0.77 | 0.54 | 1.00 | 0.12 |
| C2 | 0.73 | 0.54 | 0.92 | 0.10 | A2 | 0.62 | 0.23 | 1.00 | 0.20 |
| C3 | 0.70 | 0.48 | 0.92 | 0.11 | A3 | 0.65 | 0.29 | 1.00 | 0.18 |
| C4 | 0.69 | 0.46 | 0.92 | 0.12 | A4 | 0.77 | 0.54 | 1.00 | 0.11 |
| C5 | 0.74 | 0.55 | 0.93 | 0.10 | |||||
| C6 | 0.72 | 0.52 | 0.92 | 0.10 | |||||
| C | 0.73 | 0.60 | 0.88 | 0.07 | A | 0.72 | 0.58 | 0.87 | 0.07 |


References
- Deterding, S.; Dixon, D.; Khaled, R.; Nacke, L. From game design elements to gamefulness: Defining “gamification. In Proceedings of the 15th International Academic MindTrek Conference: Envisioning Future Media Environments, Tampere, Finland, 28–30 September 2011; New York Association for Computing Machinery Publishing: New York, NY, USA, 2011; pp. 9–15. [Google Scholar] [CrossRef]
- Seaborn, K.; Fels, D.I. Gamification in theory and action: A survey. Int. J. Hum.-Comput. Stud. 2015, 74, 14–31. [Google Scholar] [CrossRef]
- Linehan, C.; Kirman, B.; Lawson, S.; Chan, G. Practical, appropriate, empirically-validated guidelines for designing educational games. In Proceedings of the ACM Annual Conference on Human Factors in Computing Systems, Vancouver, BC, Canada, 7–12 May 2011; New York Association for Computing Machinery Publishing: New York, NY, USA, 2011; pp. 1979–1988. [Google Scholar]
- Bonde, M.T.; Makransky, G.; Wandall, J.; Larsen, M.V.; Morsing, M.; Jarmer, H.; Sommer, M.O.A. Improving biotech education through gamified laboratory simulations. Nat. Biotechnol. 2014, 32, 694–697. [Google Scholar] [CrossRef] [Green Version]
- Prensky, M. Digital Natives, Digital Immigrants. Horiz 2001, 9, 1–6. [Google Scholar]
- Gee, J.P. Video Games and Learning. Week 1. Video 6/8. 13 Principles of Game-Based Learning. Available online: www.youtube.com/watch?v=bLdbIT-exMU&list=PLl02cFD2W03xWmCDnf_N78bIpMkfYEck (accessed on 28 October 2020).
- Lo, C.K.; Hew, K.F. A comparison of flipped learning with gamification, traditional learning, and online independent study: The effects on students’ mathematics achievement and cognitive engagement. Interact. Learn. Environ. 2020, 28, 464–481. [Google Scholar] [CrossRef]
- Larson, K. Serious Games and Gamification in the Corporate Training Environment: A Literature Review. Techtrends 2020, 64, 319–328. [Google Scholar] [CrossRef]
- Fuhrmann, T. Motivation Centered Learning. In Proceedings of the IEEE Frontiers in Education Conference (FIE), San José, CA, USA, 3–6 October 2018. [Google Scholar]
- Landers, R.N. Developing a theory of gamified learning: Linking serious games and gamification of learning. Simul. Gaming 2014, 45, 752–768. [Google Scholar] [CrossRef]
- Michael, D.; Chen, S. Serious Games: Games That Educate, Train, and Inform; Thomson Course Technology: Boston, MA, USA, 2005. [Google Scholar]
- Liu, D.; Santhanam, R.; Webster, J. Toward Meaningful Engagement: A Framework for Design and Research of Gamified Information Systems. MIS Q. 2017, 41, 1011–1034. [Google Scholar] [CrossRef] [Green Version]
- Inocencio, F. Using gamification in education: A systematic literature review. In Proceedings of the Thirty Ninth International Conference on Information Systems, San Francisco, CA, USA, 13–16 December 2018. [Google Scholar]
- Mekler, E.D.; Brühlmann, F.; Tuch, A.N.; Opwis, K. Towards understanding the effects of individual gamification elements on intrinsic motivation and performance. Comput. Hum. Behav. 2017, 71, 525–534. [Google Scholar] [CrossRef]
- Sailer, M.; Hense, J.U.; Mayr, S.K.; Mandl, H. How gamification motivates: An experimental study of the effects of specific game design elements on psychological need satisfaction. Comput. Hum. Behav. 2017, 69, 371–380. [Google Scholar] [CrossRef]
- Ryan, R.M.; Deci, E.L. Overview of self-determination theory: An organismic dialectical perspective. In Handbook of Self-Determination Research; Ryan, R.M., Deci, E.L., Eds.; University of Rochester Press: Rochester, NY, USA, 2002; pp. 3–33. [Google Scholar]
- Dichev, C.; Dicheva, D. Gamifying education: What is known, what is believed and what remains uncertain: A critical review. Int. J. Educ. Technol. High. Educ. 2017, 14, 9. [Google Scholar] [CrossRef] [Green Version]
- Sailer, M.; Homner, L. The Gamification of Learning: A Meta-analysis. Educ. Psychol. Rev. 2020, 32, 77–112. [Google Scholar] [CrossRef] [Green Version]
- Hamari, J.; Koivisto, J.; Sarsa, H. Does gamification work?—A literature review of empirical studies on gamification. In Proceedings of the 47th Annual Hawaii International Conference on System Sciences (ed Sprague RH Jr), Waikoloa, HI, USA, 6–9 January 2014; IEEE: Washington, DC, USA, 2014; pp. 3025–3034. [Google Scholar] [CrossRef]
- Kapp, K.M. The Gamification of Learning and Instruction; Pfeiffer: San Francisco, CA, USA, 2012. [Google Scholar]
- Kyewski, E.; Krämer, N.C. To gamify or not to gamify? An experimental field study of the influence of badges on motivation, activity, and performance in an online learning course. Comput. Educ. 2018, 118, 25–37. [Google Scholar] [CrossRef]
- Rapp, A.; Hopfgartner, F.; Hamari, J.; Linehan, C.; Cena, F. Strengthening gamification studies: Current trends and future opportunities of gamification research. Int. J. Hum.-Comput. Stud. 2019, 127, 1–6. [Google Scholar] [CrossRef]
- Tsay, C.H.-H.; Kofinas, A.; Luo, J. Enhancing student learning experience with technology-mediated gamification: An empirical study. Comput. Educ. 2018, 121, 1–17. [Google Scholar] [CrossRef]
- Oliveira, W.; Hamari, J.; Shi, L.; Toda, A.M.; Rodrigues, L.; Palomino, P.T.; Isotani, S. Tailored gamification in education: A literature review and future agenda. Educ. Inf. Technol. 2022, 28, 373–406. [Google Scholar] [CrossRef]
- Zainuddin, Z.; Chu, S.K.W.; Shujahat, M.; Perera, C.J. The impact of gamification on learning and instruction: A systematic review of empirical evidence. Educ. Res. Rev. 2020, 30, 100326. [Google Scholar] [CrossRef]
- Gott, R.; Duggan, S.; Johnson, P. What do Practising Applied Scientists do and What are the Implications for Science Education? Res. Sci. Technol. Educ. 1999, 17, 97–107. [Google Scholar] [CrossRef]
- Lottero-Perdue, P.S.; Brickhouse, N.W. Learning on the job: The acquisition of scientific competence. Sci. Educ. 2002, 86, 756–782. [Google Scholar] [CrossRef]
- Bybee, R.W.; Fuchs, B. Preparing the 21st century workforce: A new reform in science and technology education. J. Res. Sci. Teach. 2006, 43, 349–352. [Google Scholar] [CrossRef]
- Hofstein, A.; Kind, P.M. Learning in and from science laboratories. In Second International Handbook of Science Education; Fraser, B.J., Tobin, K.G., McRobbie, C.J., Eds.; Springer: Berlin/Heidelberg, Germany, 2012; pp. 189–207. [Google Scholar]
- Sarasola, A.; Rojas, J.F.; Okariz, A. Training to Use the Scientific Method in a First-Year Physics Laboratory: A Case Study. J. Sci. Educ. Technol. 2015, 24, 595–609. [Google Scholar] [CrossRef]
- Kirschner, P.; Meester, M. Laboratory approaches. High. Educ. 1988, 17, 81–98. [Google Scholar] [CrossRef] [Green Version]
- Huebra, M.; Ibarretxe, J.; Okariz, A.; Sarasola, A.; Zubimendi, J.L. Game-based learning of scientific skills. In Proceedings of the Edulearn 20 Proceedings, Online, 6–7 July 2020; pp. 2052–2057. [Google Scholar] [CrossRef]
- Vegt, N.; Visch, V.; Ridder, H.; Vermeeren, A. Designing Gamification to Guide Competitive and Cooperative Behaviour in Teamwork. In Gamification in Education and Business; Reiners, T., Wood, L.C., Eds.; Springer: Cham, Switzerland, 2015; pp. 513–533. [Google Scholar]
- Weiner, B. Intrapersonal and Interpersonal Theories of Motivation from an Attributional Perspective. Educ. Psychol. Rev. 2000, 12, 1–14. [Google Scholar] [CrossRef]
- Biggs, J.; Kember, D.; Leung, D.Y. The revised two-factor Study Process Questionnaire: R-SPQ-2F. Br. J. Educ. Psychol. 2001, 71, 133–149. [Google Scholar] [CrossRef] [PubMed]
- Likert, R. A technique for measurement of attitudes. Arch. Psychol. 1932, 140, 5–55. [Google Scholar]
- Boone, H.N.; Boone, D.A. Analyzing Likert Data. J. Ext. 2012, 50, 1–5. [Google Scholar]
- Cronbach, L.J. Coefficient alpha and the internal structure of tests. Psychometrika 1951, 16, 297–334. [Google Scholar] [CrossRef] [Green Version]
- Sheng, Y.; Sheng, Z. Is Coefficient Alpha Robust to Non-Normal Data? Front. Psychol. 2012, 3, 34. [Google Scholar] [CrossRef] [PubMed] [Green Version]
- Zhang, Z.; Yuan, K.-H. Robust Coefficients Alpha and Omega and Confidence Intervals With Outlying Observations and Missing Data. Educ. Psychol. Meas. 2016, 76, 387–411. [Google Scholar] [CrossRef] [PubMed] [Green Version]
- Fisher, R.A. On the Interpretation of χ2 from Contingency Tables, and the Calculation of P. J. R. Stat. Soc. 1922, 85, 87. [Google Scholar] [CrossRef]
- R Core Team. R: A Language and Environment for Statistical Computing. R Foundation for Statistical Computing, Vienna, Austria. 2020. Available online: http://www.r-project.org/index.html (accessed on 3 April 2020).
- Hsieh, T.-L. Motivation matters? The relationship among different types of learning motivation, engagement behaviors and learning outcomes of undergraduate students in Taiwan. High. Educ. 2014, 68, 417–433. [Google Scholar] [CrossRef]
- Subhash, S.; Cudney, E.A. Gamified learning in higher education: A systematic review of the literature. Comput. Hum. Behav. 2018, 87, 192–206. [Google Scholar] [CrossRef]
- Bai, S.; Hew, K.F.; Huang, B. Does gamification improve student learning outcome? Evidence from a meta-analysis and synthesis of qualitative data in educational contexts. Educ. Res. Rev. 2020, 30, 100322. [Google Scholar] [CrossRef]
- Park, S.; Kim, S. Leaderboard Design Principles to Enhance Learning and Motivation in a Gamified Educational Environment: Developmental Study. JMIR Serious Games 2021, 9, e14746. [Google Scholar] [CrossRef] [PubMed]
- Walker, I.; Pettigrew, T. Relative deprivation theory: An overview and conceptual critique. Br. J. Soc. Psychol. 1984, 23, 301–310. [Google Scholar] [CrossRef]

| Item Category | Evaluated Skill | Number of Items |
|---|---|---|
| Hypotheses | Proposal of hypotheses | 3 |
| Formulation of hypotheses | 2 | |
| Experimental design and setup | Experimental design | 4 |
| Experimental setup | 2 | |
| Analysis of the results | Presentation of experimental conditions and collected data | 2 |
| Graphical representation and quantification | 5 | |
| Error handling | 1 | |
| Adequate expression of the measurements | 2 |
| Items M | ||||
|---|---|---|---|---|
| alpha | Lower CI | Upper CI | SE | |
| M1 | 0.85 | 0.75 | 0.95 | 0.05 |
| M2 | 0.88 | 0.79 | 0.97 | 0.04 |
| M3 | 0.83 | 0.70 | 0.96 | 0.06 |
| M4 | 0.86 | 0.76 | 0.96 | 0.05 |
| M5 | 0.85 | 0.74 | 0.96 | 0.05 |
| M6 | 0.87 | 0.78 | 0.96 | 0.05 |
| M | 0.87 | 0.81 | 0.93 | 0.03 |
| First Laboratory Report | Second Laboratory Report | |||||
|---|---|---|---|---|---|---|
| Group G | Group NG | p-Value | Group G | Group NG | p-Value | |
| Hypotheses | ||||||
| Proposal of hypotheses (3 items) | 100% | 91% | 0.044 * | 96% | 100% | 0.50 |
| Formulation of hypotheses (2 items) | 98% | 89% | 0.046 * | 97% | 82% | 0.08 |
| Experimental design and setup | ||||||
| Experimental design (4 items) | 48% | 43% | 0.88 | 69% | 46% | 0.03 * |
| Experimental setup (2 items) | 34% | 15% | 1.0 | 45% | 42% | 1.0 |
| Analysis of results | ||||||
| Presentation of experimental conditions and collected data (2 items) | 72% | 48% | 0.27 | 85% | 70% | 0.23 |
| Graphical representation and quantification (5 items) | 69% | 62% | 0.88 | 64% | 56% | 0.04 * |
| Error handling (1 item) | 30% | 5% | 0.05 * | 29% | 27% | 1.0 |
| Adequate expression of measurements (2 items) | 47% | 22% | 0.007 * | 58% | 33% | 0.08 |
Disclaimer/Publisher’s Note: The statements, opinions and data contained in all publications are solely those of the individual author(s) and contributor(s) and not of MDPI and/or the editor(s). MDPI and/or the editor(s) disclaim responsibility for any injury to people or property resulting from any ideas, methods, instructions or products referred to in the content. |
© 2023 by the authors. Licensee MDPI, Basel, Switzerland. This article is an open access article distributed under the terms and conditions of the Creative Commons Attribution (CC BY) license (https://creativecommons.org/licenses/by/4.0/).
Share and Cite
Okariz, A.; Huebra, M.; Sarasola, A.; Ibarretxe, J.; Bidegain, G.; Zubimendi, J.L. Gamifying Physics Laboratory Work Increases Motivation and Enhances Acquisition of the Skills Required for Application of the Scientific Method. Educ. Sci. 2023, 13, 302. https://doi.org/10.3390/educsci13030302
Okariz A, Huebra M, Sarasola A, Ibarretxe J, Bidegain G, Zubimendi JL. Gamifying Physics Laboratory Work Increases Motivation and Enhances Acquisition of the Skills Required for Application of the Scientific Method. Education Sciences. 2023; 13(3):302. https://doi.org/10.3390/educsci13030302
Chicago/Turabian StyleOkariz, Ana, Marta Huebra, Ane Sarasola, Julen Ibarretxe, Gorka Bidegain, and Jose Luis Zubimendi. 2023. "Gamifying Physics Laboratory Work Increases Motivation and Enhances Acquisition of the Skills Required for Application of the Scientific Method" Education Sciences 13, no. 3: 302. https://doi.org/10.3390/educsci13030302