


Educational Innovation Faced with COVID-19: Deep Learning for Online Exam Cheating Detection

Abstract
:1. Introduction
2. Related Works
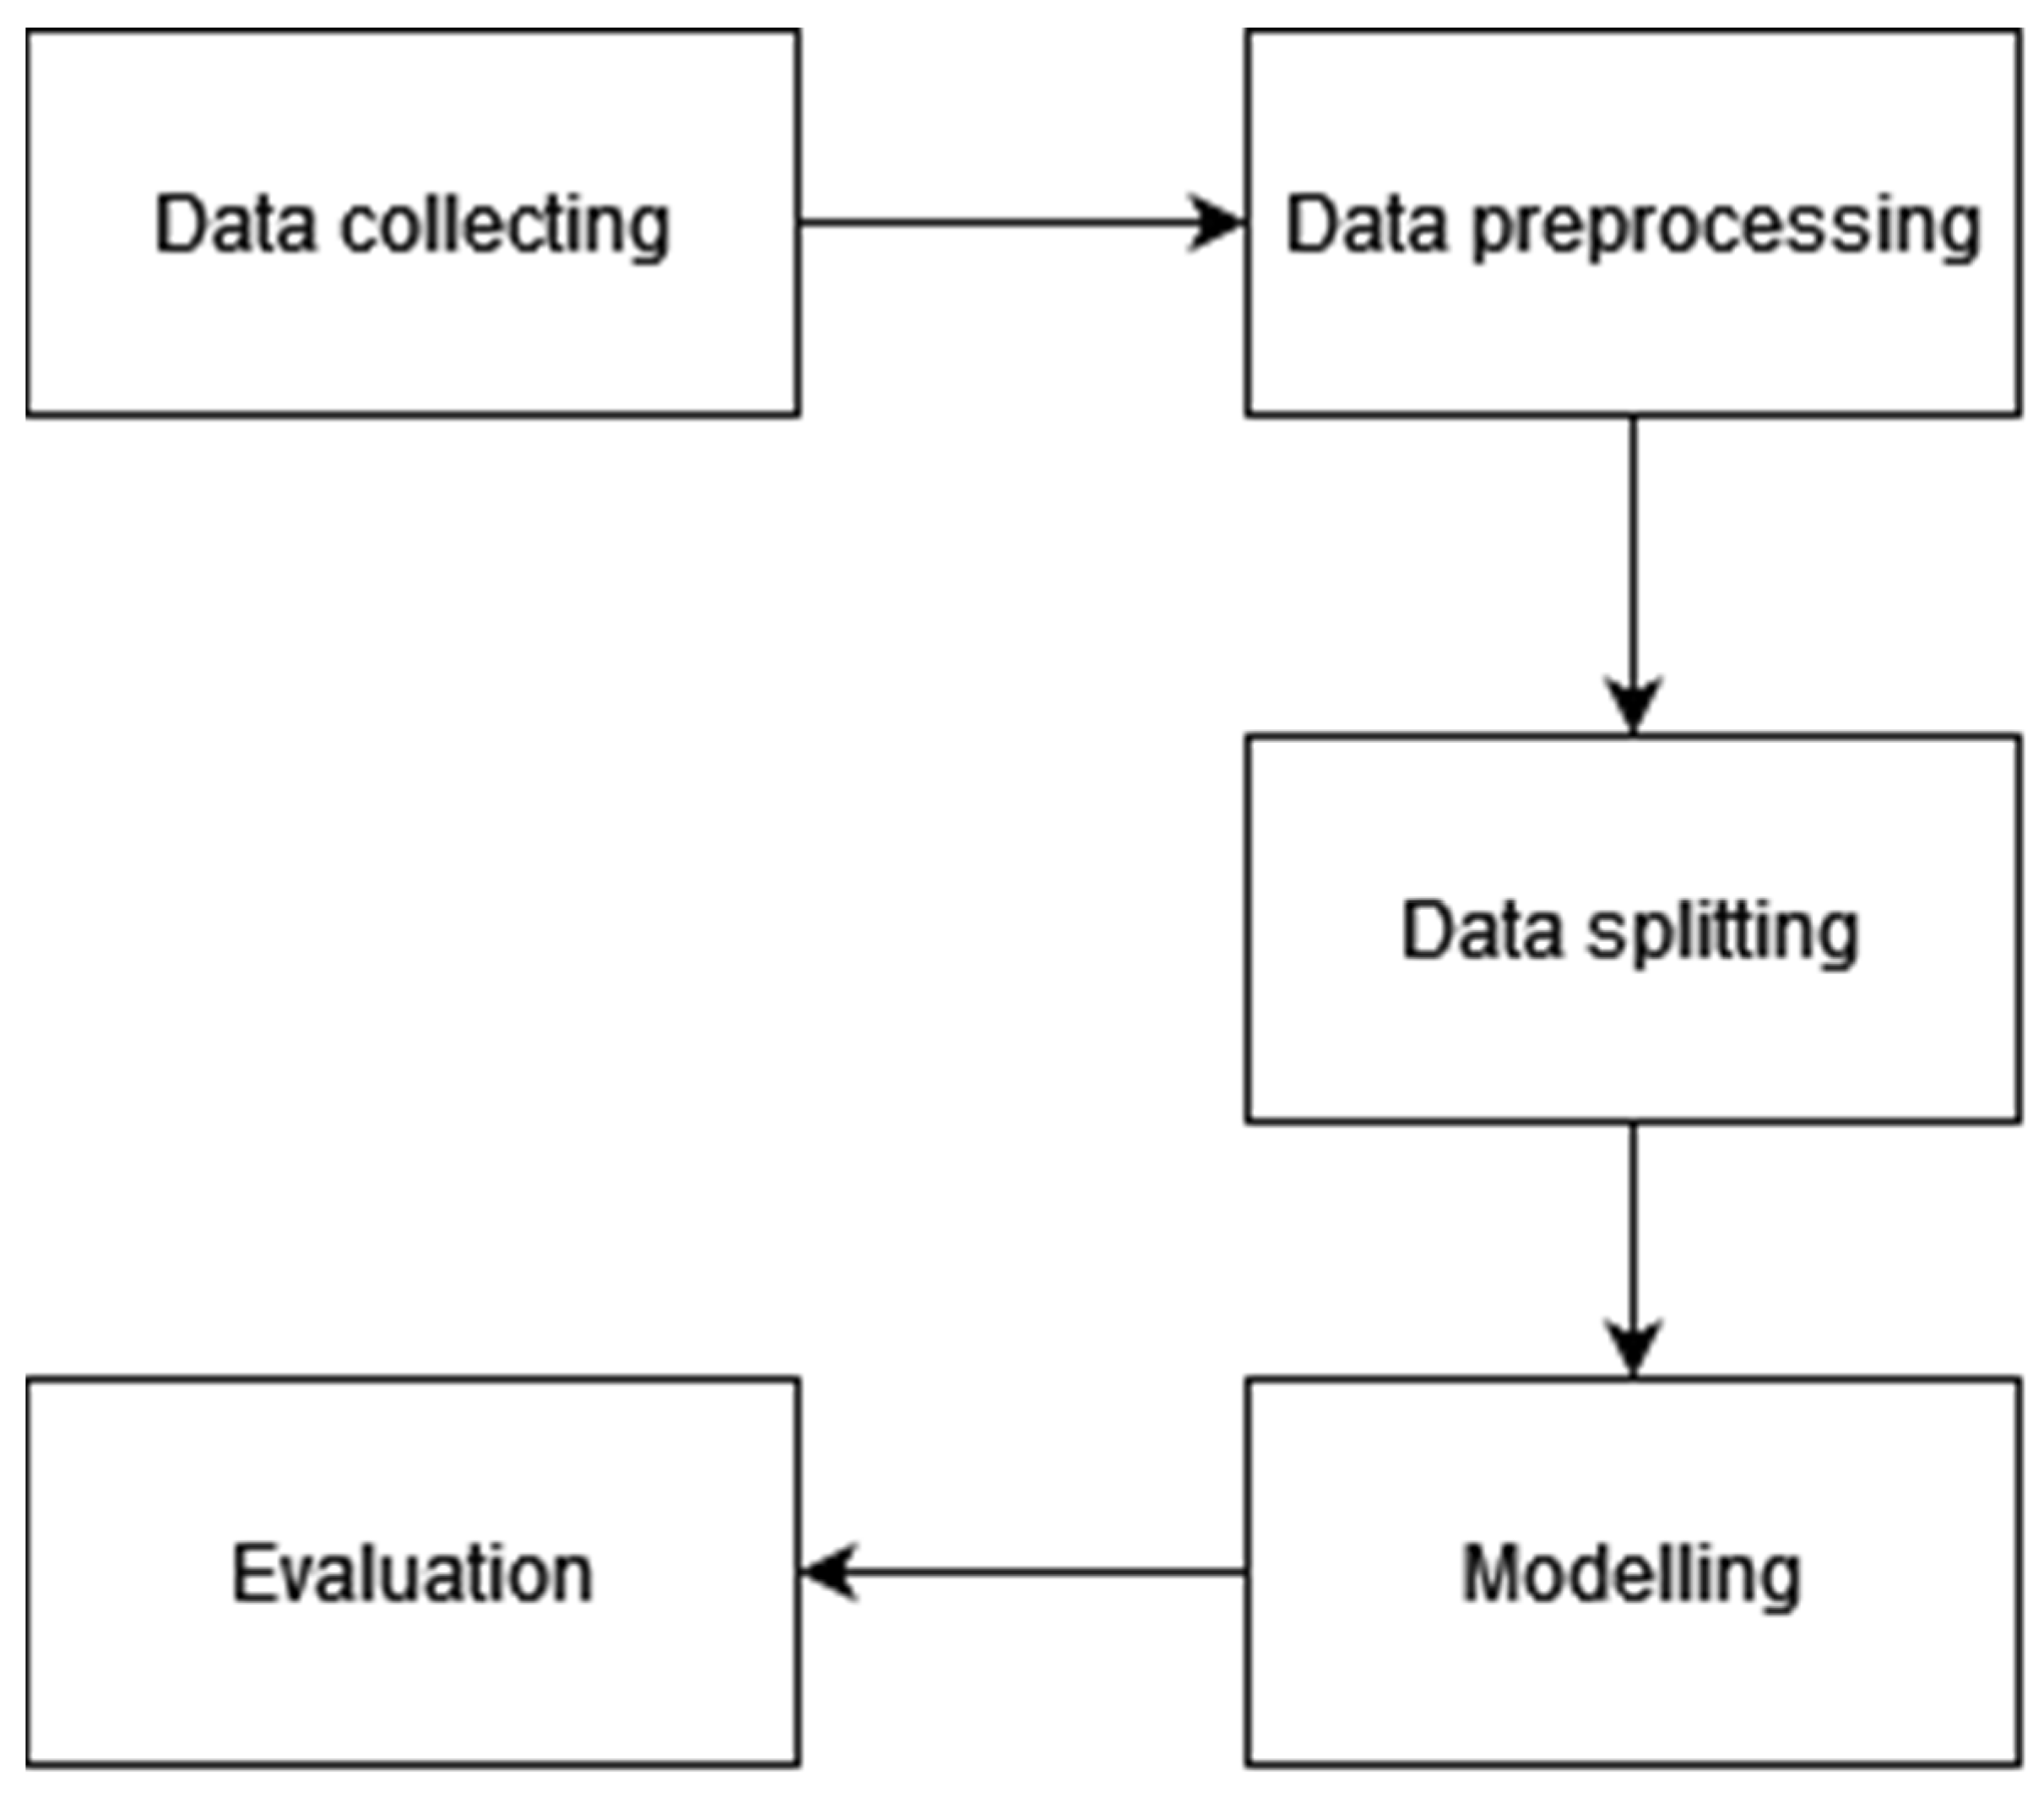
3. Methodology
3.1. Data Collecting
3.2. Data Preprocessing
3.3. Data Splitting
3.4. Modelling
- The input was a 224 by 224-pixel data frame.
- The data was run through a 2D convolution with dimensions of 224 × 224 × 3, where 3 was the RGB color model channel in the frame. The convolution layer was used to build a feature map that would be blended from the preceding layers.
- Data passed through the main components in MobileNetV2, namely the bottleneck residual blocks, which could number up to 17 and each had a different number of repetitions, pixel sizes, and dimensions, as well as the bottleneck residual blocks that data passed through, namely between stride 1 block and stride 2 blocks. The first block had dimensions of 112 × 112 × 32, the second block had dimensions of 112 × 112 × 16, the third block had dimensions of 56 × 56 × 24, the fourth block had dimensions of 28 × 28 × 32, the fifth block had dimensions of 14 × 14 × 64, the sixth block had dimensions of 14 × 14 × 96, and the last block had dimensions of 7 × 7 × 160. The bottleneck residual block is an important component of the MobileNetV2 design. The bottleneck residual block had two strides, one with one block and one with two blocks. There were various steps in a stride with one block, as follows:
- Inputs.
- Convolution using a 1 × 1 kernel size and the ReLU6 activation function.
- Depthwise Convolution using a 3 × 3 kernel size and the ReLU6 activation function.
- Convolution with a 1 × 1 kernel.
- Add, which is also known as the shortcut connection, was the addition of input from the previous process to the output of the current process, which was symbolized by an arrow pointing from input to add. The only distinction between the two blocks is the absence of an add stage. Essentially, the more layers utilized in the model, the higher the accuracy score.
- The data was processed using a 2D convolution with a kernel size of 1 × 1 and dimensions of 7 × 7 × 320.
- The data was routed through the head model, which was a model added to the MobileNetV2 architecture’s head section.
- The first layer in the head model was a 2D convolution with a kernel size of 3 × 3 and dimensions of 7 × 7 × 1280.
- The data was sent via 2D max pooling with a pool size of 2 × 2, which yielded the maximum value of the region of the frame covered by the kernel to minimize the size of the feature map with dimensions of 5 × 5 × 100.
- The data passed through a flattening with a dimension of 400, which converted data from the previous layer with multiple dimensions into one dimension so that it was utilized in the following layer, namely the fully linked layer.
- The data passed through a thick layer that got a feature map from the previous layer to link all data from one layer to each activation unit of the next layer, which was utilized for classification. The dense layer portion contained counts and units, where the count was the number of dense layers utilized and units was the number of units in the dense layer.
3.5. Evaluation
- Precision: Precision, also known as a positive predictive value, is the ratio of samples properly predicted as positive to all samples projected to be positive.
- Recall: The percentage of samples that are accurately predicted as positive to all positive samples is known as recall, also known as sensitivity or true positive rate.
- F1-score: The harmonic mean or ratio of the average comparison of the weighted precision and recall values is the F1-score. It considers precision and recall values simultaneously, allowing it to quantify model performance more precisely for imbalanced class scenarios. As a result, the F1-score was used in this study to assess the model’s performance.
4. Results and Discussion
4.1. Analysis of Batch Size
4.2. Analysis of the Number of Dense Layers
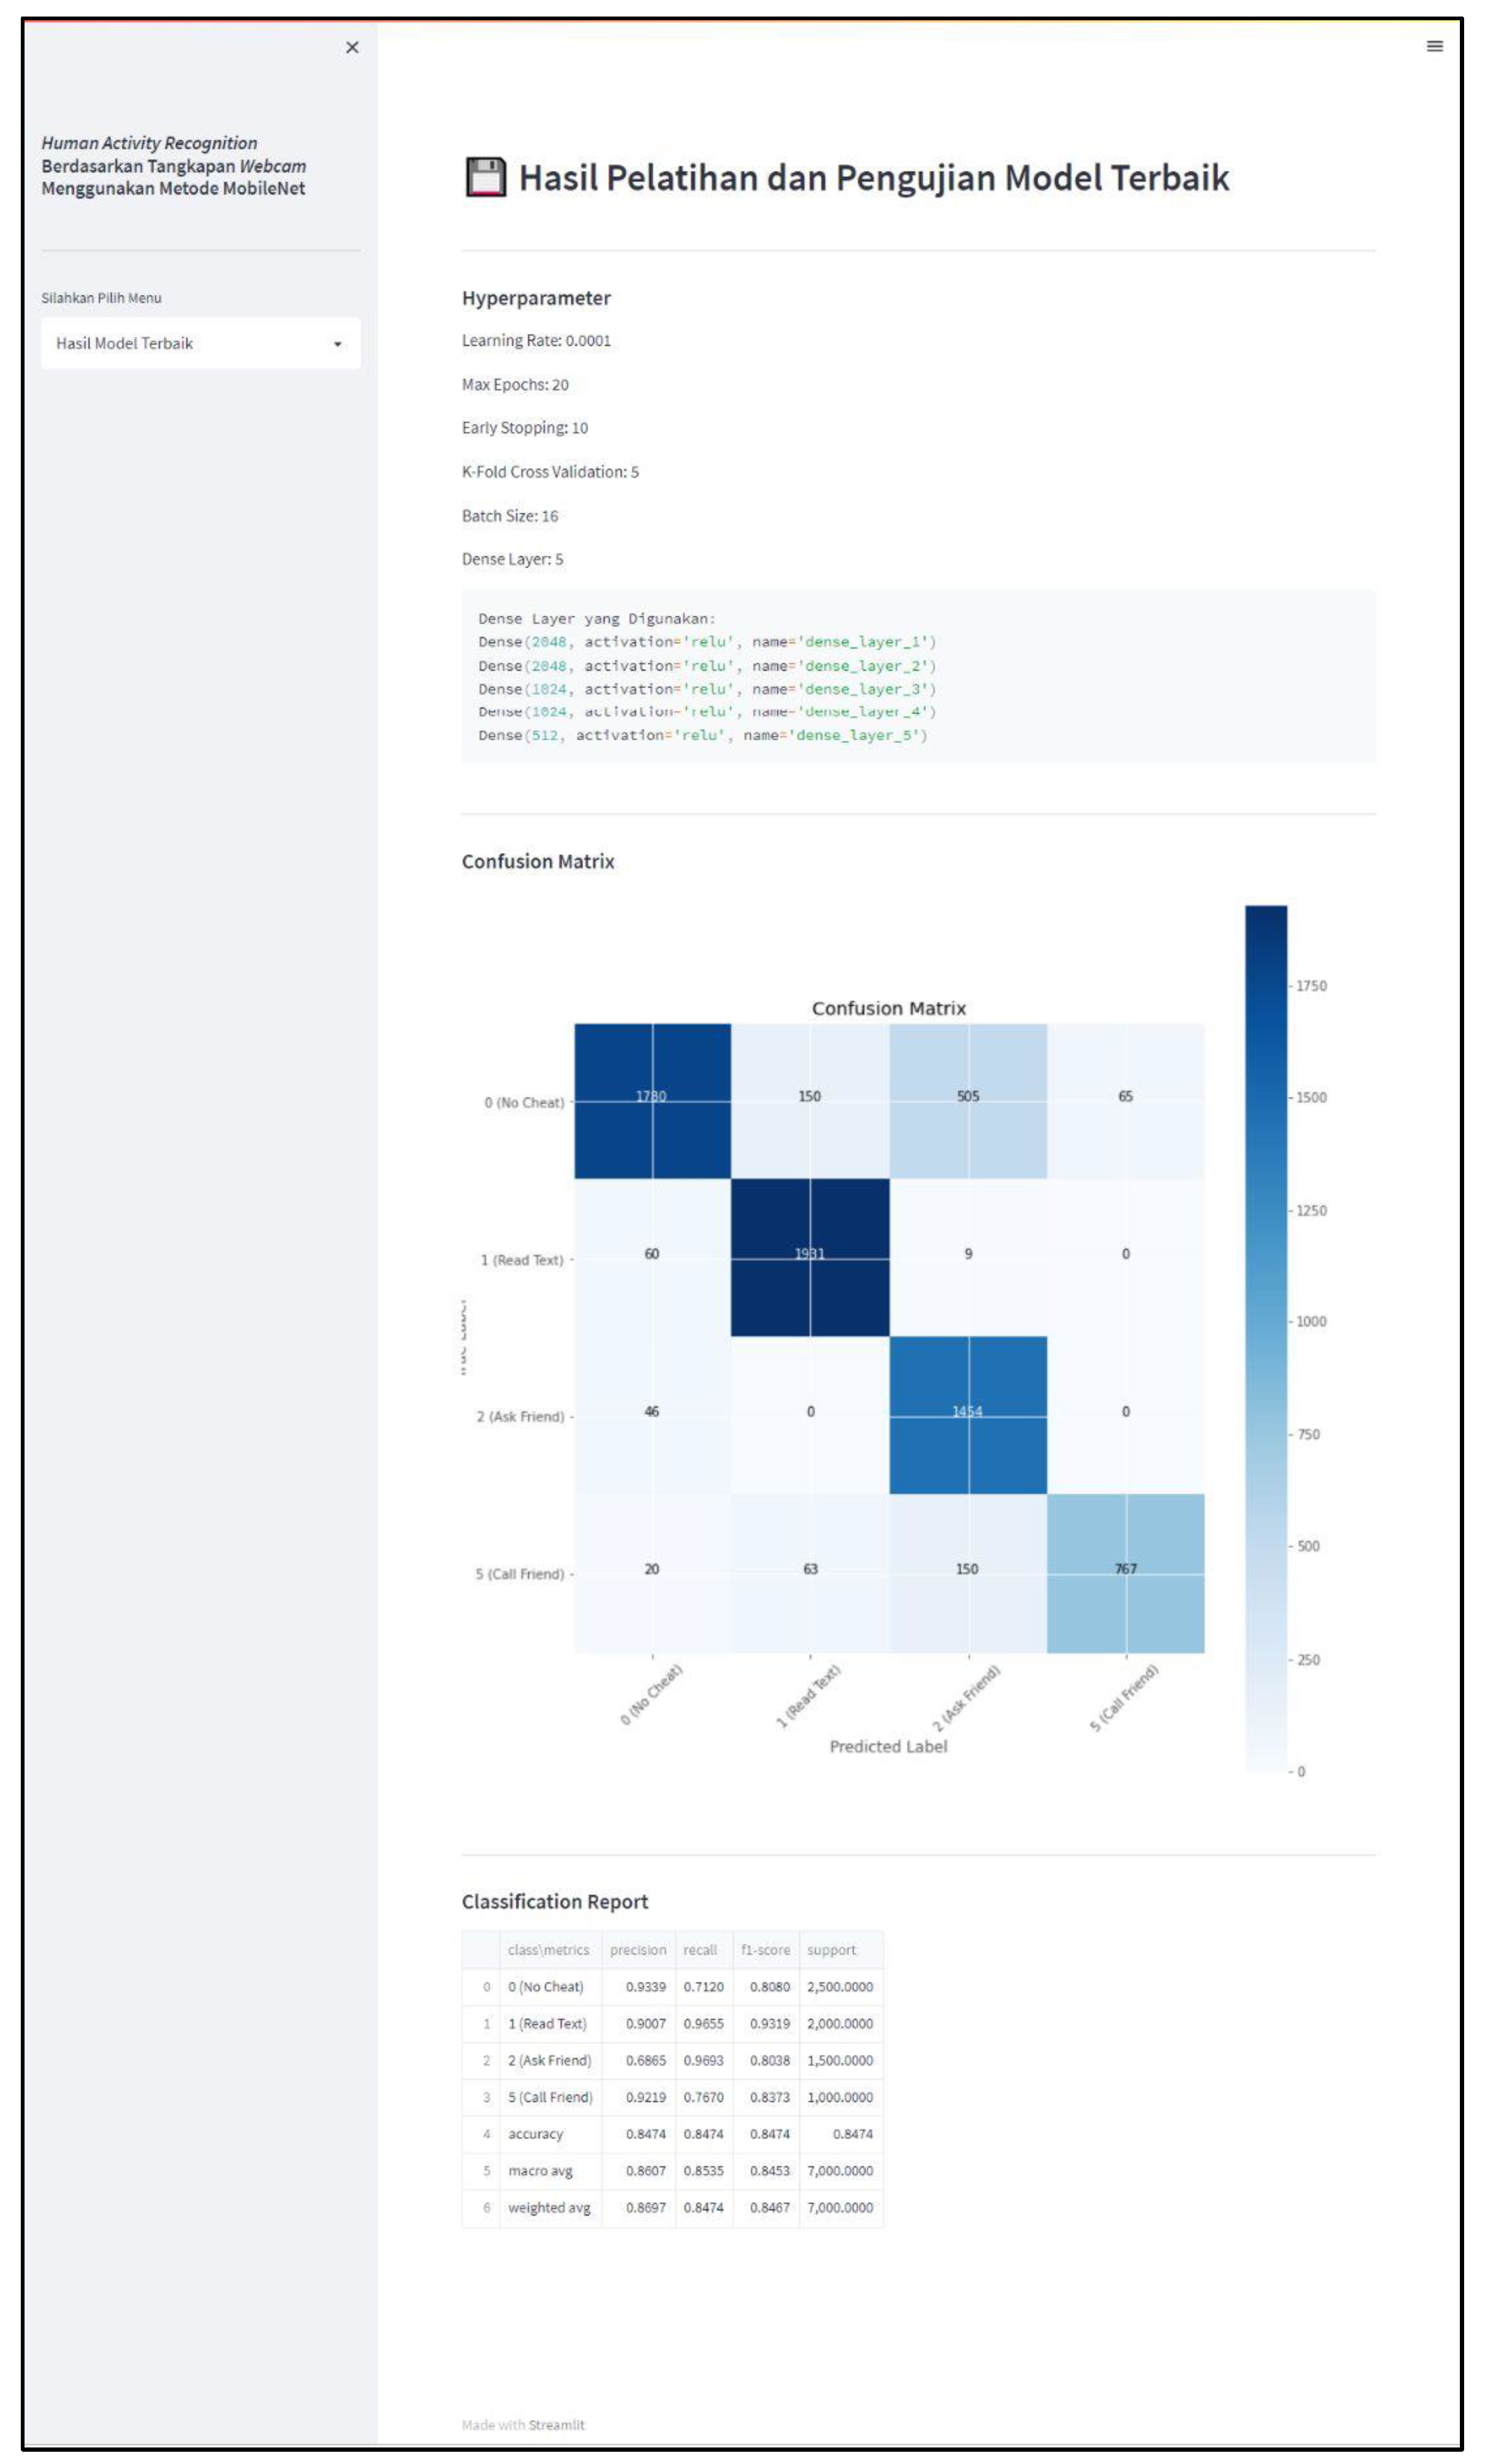
4.3. Final Evaluation of Model
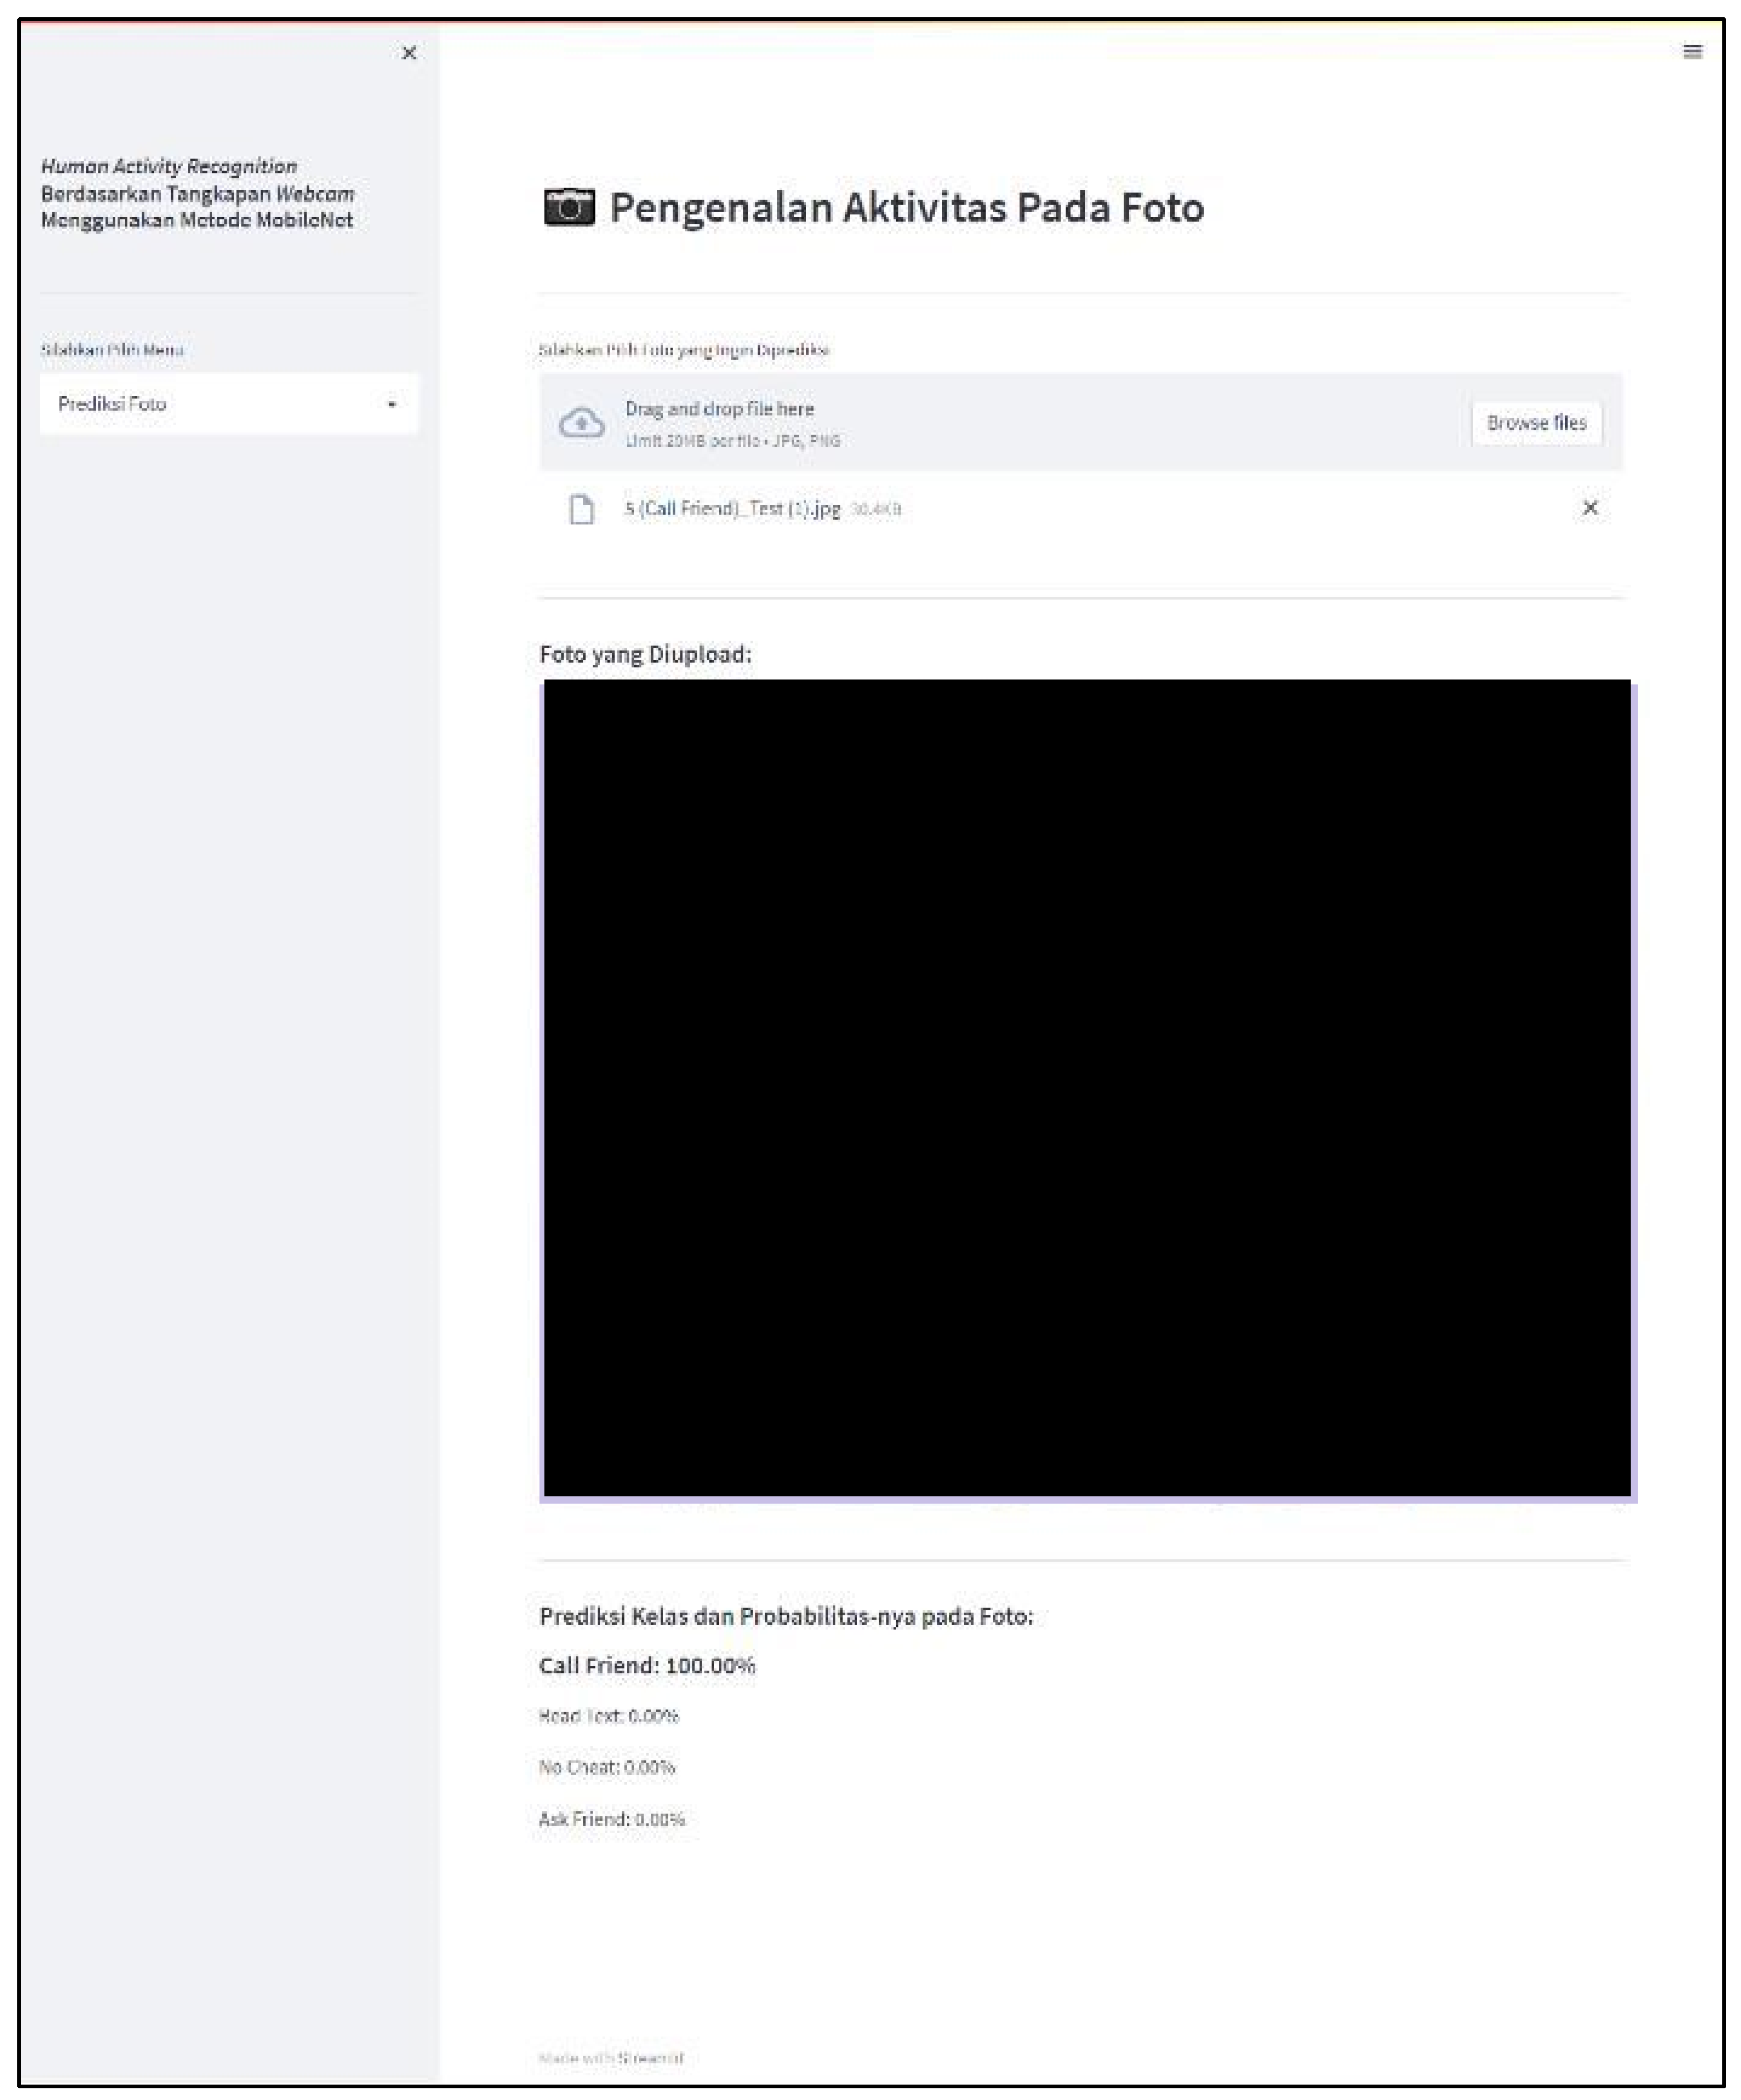
4.4. Application Implementation
5. Conclusions
Author Contributions
Funding
Institutional Review Board Statement
Informed Consent Statement
Data Availability Statement
Acknowledgments
Conflicts of Interest
References
- Kumala, R.D.M. Legal Analysis of Government Policy on Large Scale Social Restrictions in Handling COVID-19. Indones. J. Int. Clin. Leg. Educ. 2020, 2, 181–200. [Google Scholar] [CrossRef]
- Aboagye, E. Transitioning from face-to-face to online instruction in the COVID-19 era: Challenges of tutors at colleges of education in Ghana. Soc. Educ. Res. 2021, 2, 9–19. [Google Scholar] [CrossRef]
- Putarek, V.; Pavlin-Bernardić, N. The role of self-efficacy for self-regulated learning, achievement goals, and engagement in academic cheating. Eur. J. Psychol. Educ. 2020, 35, 647–671. [Google Scholar] [CrossRef]
- Ampuni, S.; Kautsari, N.; Maharani, M.; Kuswardani, S.; Buwono, S.B.S. Academic dishonesty in Indonesian college students: An investigation from a moral psychology perspective. J. Acad. Ethics 2020, 18, 395–417. [Google Scholar] [CrossRef]
- Balderas, A.; Caballero-Hernández, J.A. Analysis of learning records to detect student cheating on online exams: Case study during COVID-19 pandemic. In Proceedings of the Eighth International Conference on Technological Ecosystems for Enhancing Multiculturality, Salamanca, Spain, 21–23 October 2020; pp. 752–757. [Google Scholar]
- Abdelrahim, Y. How COVID-19 quarantine influenced online exam cheating: A case of Bangladesh University Students. J. Southwest Jiaotong Univ. 2021, 56, 1–10. [Google Scholar] [CrossRef]
- Bilen, E.; Matros, A. Online cheating amid COVID-19. J. Econ. Behav. Organ. 2021, 182, 196–211. [Google Scholar] [CrossRef]
- Rehman, A.; Saba, T.; Khan, M.Z.; Damaševičius, R.; Bahaj, S.A. Internet-of-Things-Based Suspicious Activity Recognition Using Multimodalities of Computer Vision for Smart City Security. Secur. Commun. Netw. 2022, 2022, 8383461. [Google Scholar] [CrossRef]
- Dang, L.M.; Min, K.; Wang, H.; Piran, M.J.; Lee, C.H.; Moon, H. Sensor-based and vision-based human activity recognition: A comprehensive survey. Pattern Recognit. 2020, 108, 107561. [Google Scholar] [CrossRef]
- Gu, F.; Chung, M.H.; Chignell, M.; Valaee, S.; Zhou, B.; Liu, X. A survey on deep learning for human activity recognition. ACM Comput. Surv. 2021, 54, 1–34. [Google Scholar] [CrossRef]
- Bouchabou, D.; Nguyen, S.M.; Lohr, C.; LeDuc, B.; Kanellos, I. A survey of human activity recognition in smart homes based on IoT sensors algorithms: Taxonomies, challenges, and opportunities with deep learning. Sensors 2021, 21, 6037. [Google Scholar] [CrossRef]
- Wang, P.; Fan, E.; Wang, P. Comparative analysis of image classification algorithms based on traditional machine learning and deep learning. Pattern Recognit. Lett. 2021, 141, 61–67. [Google Scholar] [CrossRef]
- Khamparia, A.; Singh, K.M. A systematic review on deep learning architectures and applications. Expert Syst. 2019, 36, e12400. [Google Scholar] [CrossRef]
- Ayachi, R.; Said, Y.; Atri, M. A convolutional neural network to perform object detection and identification in visual large-scale data. Big Data 2021, 9, 41–52. [Google Scholar] [CrossRef] [PubMed]
- Nguyen, H. Improving faster R-CNN framework for fast vehicle detection. Math. Probl. Eng. 2019, 2019, 3808064. [Google Scholar] [CrossRef]
- De-La-Hoz-Franco, E.; Ariza-Colpas, P.; Quero, J.M.; Espinilla, M. Sensor-based datasets for human activity recognition—A systematic review of literature. IEEE Access 2018, 6, 59192–59210. [Google Scholar] [CrossRef]
- Novac, P.E.; Pegatoquet, A.; Miramond, B.; Caquineau, C. UCA-EHAR: A Dataset for Human Activity Recognition with Embedded AI on Smart Glasses. Appl. Sci. 2022, 12, 3849. [Google Scholar] [CrossRef]
- Yulita, I.N.; Fanany, M.I.; Arymurthy, A.M. Combining deep belief networks and bidirectional long short-term memory: Case study: Sleep stage classification. In Proceedings of the 2017 4th International Conference on Electrical Engineering, Computer Science and Informatics, Yogyakarta, Indonesia, 19–21 September 2017; pp. 1–6. [Google Scholar]
- Wang, J.; Chen, Y.; Hao, S.; Peng, X.; Hu, L. Deep learning for sensor-based activity recognition: A survey. Pattern Recognit. Lett. 2019, 119, 3–11. [Google Scholar] [CrossRef]
- Wan, S.; Qi, L.; Xu, X.; Tong, C.; Gu, Z. Deep learning models for real-time human activity recognition with smartphones. Mob. Netw. Appl. 2020, 25, 743–755. [Google Scholar] [CrossRef]
- Xu, C.; Chai, D.; He, J.; Zhang, X.; Duan, S. InnoHAR: A deep neural network for complex human activity recognition. IEEE Access 2019, 7, 9893–9902. [Google Scholar] [CrossRef]
- Liu, H.; Lang, B. Machine learning and deep learning methods for intrusion detection systems: A survey. Appl. Sci. 2019, 9, 4396. [Google Scholar] [CrossRef]
- Uddin, S.; Khan, A.; Hossain, M.E.; Moni, M.A. Comparing different supervised machine learning algorithms for disease prediction. BMC Med. Inform. Decis. Mak. 2019, 19, 281. [Google Scholar] [CrossRef]
- He, H.; Jin, S.; Wen, C.K.; Gao, F.; Li, G.Y.; Xu, Z. Model-driven deep learning for physical layer communications. IEEE Wirel. Commun. 2019, 26, 77–83. [Google Scholar] [CrossRef]
- Spoorthi, G.E.; Gorthi, S.; Gorthi, R.K.S.S. PhaseNet: A deep convolutional neural network for two-dimensional phase unwrapping. IEEE Signal Process. Lett. 2018, 26, 54–58. [Google Scholar] [CrossRef]
- Yu, H.; Yang, L.T.; Zhang, Q.; Armstrong, D.; Deen, M.J. Convolutional neural networks for medical image analysis: State-of-the-art, comparisons, improvement and perspectives. Neurocomputing 2021, 444, 92–110. [Google Scholar] [CrossRef]
- Khan, M.A.; Sharif, M.; Akram, T.; Raza, M.; Saba, T.; Rehman, A. Hand-crafted and deep convolutional neural network features fusion and selection strategy: An application to intelligent human action recognition. Appl. Soft Comput. 2020, 87, 105986. [Google Scholar] [CrossRef]
- Arivazhagan, S.; Ligi, S.V. Mango leaf diseases identification using convolutional neural network. Int. J. Pure Appl. Math. 2018, 120, 11067–11079. [Google Scholar]
- Patel, S. A comprehensive analysis of Convolutional Neural Network models. Int. J. Adv. Sci. Technol. 2020, 29, 771–777. [Google Scholar]
- Saadati, M.; Nelson, J.; Ayaz, H. Mental workload classification from spatial representation of fnirs recordings using convolutional neural networks. In Proceedings of the 2019 IEEE 29th International Workshop on Machine Learning for Signal Processing (MLSP), Pittsburgh, PA, USA, 13–16 October 2019; pp. 1–6. [Google Scholar]
- Rogelio, J.; Dadios, E.; Bandala, A.; Vicerra, R.R.; Sybingco, E. Alignment control using visual servoing and mobilenet single-shot multi-box detection (SSD): A review. Int. J. Adv. Intell. Inform. 2022, 8, 97–114. [Google Scholar] [CrossRef]
- Gaba, S.; Budhiraja, I.; Kumar, V.; Garg, S.; Kaddoum, G.; Hassan, M.M. A federated calibration scheme for convolutional neural networks: Models, applications and challenges. Comput. Commun. 2022, 192, 144–162. [Google Scholar] [CrossRef]
- Antelo, C.; Martinho, D.; Marreiros, G. A Review on Supervised Learning Methodologies for Detecting Eating Habits of Diabetic Patients. In Proceedings of the EPIA Conference on Artificial Intelligence, Lisbon, Portugal, 31 August–2 September 2022; pp. 374–386. [Google Scholar]
- Li, Z.; Liu, F.; Yang, W.; Peng, S.; Zhou, J. A survey of convolutional neural networks: Analysis, applications, and prospects. IEEE Trans. Neural Netw. Learn. Syst. 2021, 33, 6999–7019. [Google Scholar] [CrossRef]
- Atoum, Y.; Chen, L.; Liu, A.X.; Hsu, S.D.H.; Liu, X. Automated online exam proctoring. IEEE Trans. Multimed. 2017, 19, 1609–1624. [Google Scholar] [CrossRef]
- Maharana, K.; Mondal, S.; Nemade, B. A Review: Data Pre-Processing and Data Augmentation Techniques. Glob. Transit. Proc. 2022, 3, 91–99. [Google Scholar] [CrossRef]
- Mumuni, A.; Mumuni, F. Data augmentation: A comprehensive survey of modern approaches. Array 2022, 16, 100258. [Google Scholar] [CrossRef]
- Shorten, C.; Khoshgoftaar, T.M. A survey on image data augmentation for deep learning. J. Big Data 2019, 6, 60. [Google Scholar] [CrossRef]
- Nalepa, J.; Marcinkiewicz, M.; Kawulok, M. Data augmentation for brain-tumor segmentation: A review. Front. Comput. Neurosci. 2019, 13, 83. [Google Scholar] [CrossRef]
- Moen, E.; Bannon, D.; Kudo, T.; Graf, W.; Covert, M.; Van Valen, D. Deep learning for cellular image analysis. Nat. Methods 2019, 16, 1233–1246. [Google Scholar] [CrossRef]
- Zaidi, S.S.A.; Ansari, M.S.; Aslam, A.; Kanwal, N.; Asghar, M.; Lee, B. A survey of modern deep learning based object detection models. Digit. Signal Process. 2022, 126, 103514. [Google Scholar] [CrossRef]
- Salih, A.A.; Abdulazeez, A.M. Evaluation of classification algorithms for intrusion detection system: A review. J. Soft Comput. Data Min. 2021, 2, 31–40. [Google Scholar] [CrossRef]
- Saba, T.; Rehman, A.; Jamail, N.S.M.; Marie-Sainte, S.L.; Raza, M.; Sharif, M. Categorizing the students’ activities for automated exam proctoring using proposed deep L2-GraftNet CNN network and ASO based feature selection approach. IEEE Access 2021, 9, 47639–47656. [Google Scholar] [CrossRef]
- Malhotra, M.; Chhabra, I. Student Invigilation Detection Using Deep Learning and Machine After Covid-19: A Review on Taxonomy and Future Challenges. In Future of Organizations and Work after the 4th Industrial Revolution: The Role of Artificial Intelligence, Big Data, Automation, and Robotics; Springer: Cham, Switzerland, 2022; Volume 1037, pp. 311–326. [Google Scholar]
- Mansour, R.F.; Escorcia-Gutierrez, J.; Gamarra, M.; Villanueva, J.A.; Leal, N. Intelligent video anomaly detection and classification using faster RCNN with deep reinforcement learning model. Image Vis. Comput. 2021, 112, 104229. [Google Scholar] [CrossRef]
- Maschler, B.; Weyrich, M. Deep transfer learning for industrial automation: A review and discussion of new techniques for data-driven machine learning. IEEE Ind. Electron. Mag. 2021, 15, 65–75. [Google Scholar] [CrossRef]
- Ayana, G.; Dese, K.; Choe, S.W. Transfer learning in breast cancer diagnoses via ultrasound imaging. Cancers 2021, 13, 738. [Google Scholar] [CrossRef] [PubMed]
- Kumar, Y.; Gupta, S. Deep transfer learning approaches to predict glaucoma, cataract, choroidal neovascularization, diabetic macular edema, drusen and healthy eyes: An experimental review. Arch. Comput. Methods Eng. 2022, 30, 1–21. [Google Scholar] [CrossRef]


| Hyperparameter | Value |
|---|---|
| Optimizer | Adam |
| Activation | Softmax |
| Max epoch | 20 |
| Early Stopping | 10 |
| Learning Rate | 0,0001 |
| Batch Size | [16; 32; 64] |
| Dense Layer | [1; 3; 5; 7] |
| Number of Dense Layer | Batch Size | Averaged F1-Score (%) |
|---|---|---|
| 1 | 64 | 66.53 |
| 1 | 32 | 73.15 |
| 1 | 16 | 73.65 |
| 3 | 64 | 69.02 |
| 3 | 32 | 75.43 |
| 3 | 16 | 76.73 |
| 5 | 64 | 70.80 |
| 5 | 32 | 71.58 |
| 5 | 16 | 80.81 |
| 7 | 64 | 71.87 |
| 7 | 32 | 71.03 |
| 7 | 16 | 77.55 |
| Fold | Averaged F1-Score (%) |
|---|---|
| 1 | 79.82 |
| 2 | 73.63 |
| 3 | 84.31 |
| 4 | 81.79 |
| 5 | 84.52 |
| Macro Average | 80.81 |
| Class | Precision (%) | Recall (%) | F1-Score (%) |
|---|---|---|---|
| 0 (No Cheat) | 93.38 | 71.20 | 80.79 |
| 1 (Read Text) | 90.06 | 96.55 | 93.19 |
| 2 (Ask Friend) | 68.64 | 96.93 | 80.37 |
| 5 (Call Friend) | 92.18 | 76.70 | 83.73 |
| Macro Average | 86.07 | 85.34 | 84.52 |
Disclaimer/Publisher’s Note: The statements, opinions and data contained in all publications are solely those of the individual author(s) and contributor(s) and not of MDPI and/or the editor(s). MDPI and/or the editor(s) disclaim responsibility for any injury to people or property resulting from any ideas, methods, instructions or products referred to in the content. |
© 2023 by the authors. Licensee MDPI, Basel, Switzerland. This article is an open access article distributed under the terms and conditions of the Creative Commons Attribution (CC BY) license (https://creativecommons.org/licenses/by/4.0/).
Share and Cite
Yulita, I.N.; Hariz, F.A.; Suryana, I.; Prabuwono, A.S. Educational Innovation Faced with COVID-19: Deep Learning for Online Exam Cheating Detection. Educ. Sci. 2023, 13, 194. https://doi.org/10.3390/educsci13020194
Yulita IN, Hariz FA, Suryana I, Prabuwono AS. Educational Innovation Faced with COVID-19: Deep Learning for Online Exam Cheating Detection. Education Sciences. 2023; 13(2):194. https://doi.org/10.3390/educsci13020194
Chicago/Turabian StyleYulita, Intan Nurma, Fauzan Akmal Hariz, Ino Suryana, and Anton Satria Prabuwono. 2023. "Educational Innovation Faced with COVID-19: Deep Learning for Online Exam Cheating Detection" Education Sciences 13, no. 2: 194. https://doi.org/10.3390/educsci13020194