Article

Student Acceptance of E-Learning during the COVID-19 Outbreak at Engineering Universities in Spain

by
Pedro Garrido-Gutiérrez
,
Teresa Sánchez-Chaparro
* and
María Jesús Sánchez-Naranjo
Escuela Técnica Superior de Ingenieros Industriales, Universidad Politécnica de Madrid, José Gutiérrez Abascal, 2, 28002 Madrid, Spain
*
Author to whom correspondence should be addressed.
Educ. Sci. 2023, 13(1), 77; https://doi.org/10.3390/educsci13010077
Submission received: 30 November 2022 / Revised: 28 December 2022 / Accepted: 6 January 2023 / Published: 10 January 2023

Abstract

:
This article analyses students’ intention to use a particular e-learning technology (MS Teams) at university during the COVID-19 outbreak in Spain using the Unified Theory of Acceptance and Use of Technology (UTAUT). The model was refined through a qualitative analysis based on six focus group discussions with students from different engineering faculties in Madrid, Spain. A survey involving 346 undergraduate students was subsequently fed into the model. Structural Equation Modelling (SEM) and SMART PLS software were applied for data analysis. The results shed light on theoretical and practical implications. The model was validated by the data and displayed a high predictive ability. Social influence was found to have the greatest influence over students’ acceptance, followed by the professor’s role in shaping the perception of improvement. Facilitating conditions were found to be the least relevant factor, probably due to the particular context in which this study was conducted. A significant difference was found between the public and private institutions in terms of the importance of the perceived usefulness for the professor (this factor was more important for students’ acceptance at the public university). In order to improve its acceptance and use under the current scenario, it is thus important for universities wishing to introduce e-learning to focus on creating a positive social environment around the e-learning platform, for example, by using social networks or relying on testimonies by professionals who could confirm the interest of such a platform in a future work environment. Understanding professors’ perspective on the implementation of the platform is also of paramount importance. More research is also needed regarding context-related differences when analysing students’ acceptance of e-learning.

1. Introduction

The COVID-19 crisis has transformed the world around us, and the university is no stranger to this transformation. It is clear that COVID-19 has resulted in a major disruption in the higher education system, whose consequences are still to be fully understood [1,2,3,4]. As a recent study from UNESCO points out, due to sudden and long-lasting school lockouts all over the world, the major impact of COVID-19 on teaching and learning in higher education is the increase in online education, and the hybrid mode of teaching has become the most popular form [4]. Indeed, universities worldwide have been pushed to experiment with e-learning due to the restrictions during the pandemic outbreak [5,6,7,8,9]. As the uncertainty regarding future global emergencies is high, distant education and e-learning could become even more strategic to avoid the discontinuation of a basic public service, such as education.
The issues associated with the successful implementation of e-learning in pre-pandemic times are well documented in academic literature [10,11,12]. The shift to e-learning implies a cultural transformation, and students, as well as teachers all over the world, have struggled throughout the e-learning adoption process [2,13,14,15,16,17]. Particularly, failures in e-learning adoption have been reported due to a lack of preparation of the institution and its constituents, specificities of the regional context, as well as difficulties in adapting to innovative teaching and learning approaches [18,19,20,21]. Indeed, the implementation of e-learning technologies involves a shift of focus from the lecturer to the educational process and the student experience [22], which is considered a revolution by some authors [23]. Beyond ensuring access to public service during difficult times, e-learning has the potential to improve communication, collaboration, knowledge transfer, and training to enhance the value provided to both individuals and organisations [24]. This implies contributing to the shift from a passive model of information transmission to an active model where the individual is monitored, tracked, and analysed in order to develop the best training process for each particular person [25].
An important success factor for the implementation of an e-learning system is the incumbent actors’ willingness to accept and actively engage in using this system [26,27,28,29,30,31]. Understanding these actors’ perspectives in this regard is of the utmost importance for higher education institutions. This is still under research, particularly under the new pandemic scenario [21]. Indeed, different theoretical models have captured the factors typically affecting technology acceptance by incumbent actors, particularly students and professors [32,33,34]. However, it is not yet clear the way the particular conditions created during the COVID-19 crisis have affected how these actors perceive and are willing to accept e-learning [35,36,37,38]. Characterising incumbent actors’ perceptions regarding e-learning during the pandemic is indeed the crux of the matter. This knowledge is essential to inform policymakers and higher institution managers on successful e-learning implementation in conditions similar to those created during the COVID-19 crisis. The objective of our study is to analyse the point of view of the students regarding e-learning adoption during the pandemic. In particular, this article presents a study on the acceptance and use of Microsoft Teams (hereinafter MS Teams) at universities in Madrid (Spain), using a sample of students from different engineering faculties belonging to two universities, one being a public establishment (Universidad Politécnica de Madrid, UPM) and the other a private one (CEU San Pablo). The Unified Theory of Acceptance and Use of Technology (UTAUT) model was used as a theoretical background for this research [32]. The particular research question addressed is formulated as follows: What are the main factors affecting students’ acceptance and use of an e-learning platform during the COVID-19 lockouts in engineering universities in Madrid?
Our study provides a fresh look at the acceptance of technology within higher education. Although a number of recent studies have explored student technology acceptance of e-learning during the COVID-19 outbreak [9,35,36,37,38,39,40,41,42], to the best of our knowledge, up to the current moment, no former study has been conducted in this particular regional context. Additionally, the number of works which have used the UTAUT model to study e-learning acceptance in this context is still limited [43,44,45,46,47,48,49,50,51,52,53,54,55,56,57,58,59,60,61]. Finally, no study to date has provided a comparison between public and private institutions. The minder of this article is structured as follows. Section 2 explains the theoretical background of this research, whereas the context of the study and the methodology used are explained in Section 3. Section 4 presents the results of the study. After that, the results are discussed in Section 5. Finally, Section 6 present some conclusions and limitations of this research.

2. Literature Review

2.1. The UTAUT Framework and E-Learning Acceptance during COVID-19

There exist several models designed to evaluate the factors affecting technology acceptance. Various studies have been based on the Technology Acceptance Model (TAM), such as [33,34]. Among several models derived from TAM, the UTAUT model was chosen (see Figure 1), which was created by unifying eight previously existing models that [32] tested and validated for different types of situations (including both optional and compulsory use by users, and these including both students and company employees). The versatility of this model was key in determining its suitability for this study. The model was chosen because of its explanatory power and completeness in the acceptance and use of IS studies [44]. Furthermore, the qualitative study conducted as part of this research (see Section 3.1) confirmed the significance of the factors considered in the UTAUT framework.
The UTAUT model is composed of six constructs, each defined as follows:
Performance expectancy (PE): the degree to which an individual believes that using the system will help him or her to attain a better job performance.
Effort expectancy (EE): the degree of ease associated with the use of the system.
Social influence (SI): the degree to which an individual perceives that influential people believe he or she should use the new system.
Facilitating conditions (FC): the degree to which an individual believes that an organisational and technical infrastructure exists to support the use of the system.
Behavioural intention (BI): the intention to use the system.
Use behaviour (UB): the actual user behaviour.
In the UTAUT model, four other variables are posited to moderate the impact of the four key constructs on usage intention (BI) and behaviour (UB): gender, age, experience, and voluntariness of use. For example, as depicted in Figure 1, the influence of performance expectancy on behavioural intention is moderated by gender and age; that of effort expectancy is moderated by gender, age, experience, etc.
Extant literature is still limited on the application of UTAUT to e-learning acceptance by students [44], particularly during the COVID-19 crisis. Experiences in the Middle East and East Asia [52,53,59,59,60,61], as well as in several African countries [50,51,55], are particularly represented in literature. Experiences in other parts of the world, such as Europe or America, are comparatively less represented [49,57]. Moreover, no previous studies have been conducted on the application of UTAUT to e-learning acceptance in the Spanish university context.

2.2. Hypothesis and Theoretical Framework

As it will be explained in the Methodology section, for the purposes of our study, this model was updated and fine-tuned with an additional construct (see Figure 2), which was introduced following the work of Escobar-Rodríguez et al. [34], and Hwang [62] This was deemed appropriate after conducting a preliminary qualitative analysis based on six focus-group discussions with students. The additional construct is defined as follows:
Perceived usefulness for the professor (PUP): defined as how the students believe the tool improves the usefulness to professors in terms of productivity, evaluation, and student follow-up.
The theoretical model was used as the basis upon which a number of hypotheses to be tested were drawn up. These hypotheses are:
Hypothesis 1.1 (H.1.1).
Perceived Usefulness for the Professor has a significant effect on the Performance Expectancy of MS Teams.
Hypothesis 1 (H.1).
Performance Expectancy has a significant effect on the Behavioural Intention to use MS Teams.
Hypothesis 2 (H.2).
Effort Expectancy has a significant effect on the Behavioural Intention to use MS Teams.
Hypothesis 3 (H.3).
Social Influence has a significant effect on the Behavioural Intention to use MS Teams.
Hypothesis 4 (H.4).
Facilitating Conditions have a significant effect on the Behavioural Intention to use MS Teams.
Hypothesis 5 (H.5).
Facilitating Conditions have a significant effect on the Use Behaviour of MS Teams.
Hypothesis 6 (H.6).
Behavioural Intention has a significant effect on the Use Behaviour of MS Teams.
These hypotheses were elaborated based on the conclusions drawn in the extant literature on the application of UTAUT to e-learning acceptance, particularly during the COVID pandemic [35,36,37,38,43,44,45,46,47,48,49,50,51,52,53,54,55,56,57,58,59,60,61]. Indeed, most of the experiences represented in the literature validate the cause-effect relationships between the main constructs of the UTAUT model. Hypothesis H1.1 was drawn as a result of the qualitative study conducted as part of this research, which is described in Section 3.2.

3. Materials and Methods

3.1. Context

This study assessed the intention to use a collaborative e-learning IT tool in two engineering institutions in Madrid, one being a public university (Universidad Politécnica de Madrid-UPM) and the other a private one (CEU San Pablo). UPM is one of the oldest polytechnic universities in Spain. It was founded in its present organisational form in 1971, but its origins can be traced back to the beginning of the 19th century. It comprises 18 engineering faculties and offers degree programmes covering all areas of architecture and engineering. Meanwhile, CEU San Pablo was founded in 1933 and is one of the largest and most traditional private universities in Spain. CEU San Pablo offers a wide range of subjects and 6 faculties, including an engineering faculty.
In order to address this study, a particular IT platform was chosen based on the expectation that users’ responses would be more accurate when asked about a particular tool rather than generally about all tools in the sector. The tool chosen was MS Teams. MS Teams is a unified communication and collaboration platform that combines workplace chatrooms, video meetings, file storage (including collaborative editing), and application integration. Microsoft launched the service worldwide on 14 March 2017. By 19 November 2019, it reached 19 million users, and on 19 March 2020 (around the start of the COVID-19 pandemic), it reached 44 million users.
Within our sample, in some cases, MS Teams represented the only available option and was compulsory (at the private university), while in others, it was optional, with professors choosing which collaborative tool to use to deliver their online classes (among several available options, such as Moodle, BB Collaborate, etc.). In addition, although this article focuses on students, it is part of a broader investigation in which the acceptance and use by faculty (i.e., employees of a university) were also assessed, which will be discussed in subsequent works.

3.2. Qualitative Analysis

As explained in the previous section, the conceptual model employed in this study was a slightly modified UTAUT model, in which one construct was added to the six original constructs, as described in Section 2 above.
In order to fine-tune our model, a qualitative analysis was conducted. Six different student focus groups were organised considering the following criteria:
  • Gender balance.;
  • Inclusion of students belonging to different academic levels (undergraduate, graduate, and doctoral levels);
  • Varied programme specialisations;
  • Varied geographical locations within Madrid amongst the different university schools.
The focus group discussions were conducted between 18 February and 6 March 2020. A number of open questions were launched to the students regarding their experience with different e-learning tools available at UPM (Moodle, MS Teams, Virtual Labs, MOOCs, etc.), the role of the faculty members, and possible improvement opportunities. Several specific questions were posed regarding MS Teams.
Each focus group brought together around twenty students from different schools within UPM.
The focus groups involved students from different engineering schools belonging to UPM. Information coming from the focus group was transcribed and systematically analysed using content analysis techniques (Weber, 1990). Content analysis is a technique for analysing the content of a text; content might include words, symbols, pictures, or any other format that can be communicated. It has been extensively used in social sciences and particularly in education [63,64,65]. An important step in content analysis is codifying the text (or content) of a piece into various categories depending on certain criteria [66]. In this case, the codes were established a priori using the UTAUT categories. The codes were assigned to the text by three independent researchers; discrepancies were discussed until a consensus was reached.
Several cross-cutting themes were identified thanks to this analysis that were of use to fine-tune the conceptual model:
  • The professor was acknowledged as a fundamental actor. The choice and efficacy of IT tools were deemed to be highly dependent on the kind of use made by the professor;
  • The facilitating conditions and, particularly, having a help desk and a clear and available institutional repository of information were considered to constitute an important factor;
  • The construct “Perceived usefulness for the professor” was deemed to be a key factor by the students. The role of professors in shaping the acceptance of the technology was thus incorporated as part of our model.

3.3. Data Collection

The survey involved a total of 346 undergraduate students from nine different engineering faculties belonging to the two analysed universities (50 students in the first year, 74 students in the second year, 137 students in the third year, 57 students in the fourth year and 28 in the fifth year). Indicators were designed to measure each variable (construct) in the model. These took the form of 34 questions that were posed to university students in an online survey. An online questionnaire was distributed by e-mail via the student associations present at the targeted university schools of engineering.
Responses were quantified using a 5-point Likert scale (where: 1 = totally disagree, 5 = totally agree), and in this manner, the indicators provided measurements for the variables in the model. The data collected were consolidated into tables containing all the responses. This data contained no personally identifiable information. Only non-identifying attributes were recorded: gender, the university and engineering school attended, and the academic level of the studies being pursued (undergraduate, graduate, or PhD). Our dataset was composed of the following groups:
  • 249 responses from the public university (UPM) vs. 97 from the private university (CEU San Pablo);
  • 165 responses from women vs. 181 from men;
  • 160 responses from students of industrial engineering, 45 from architecture, 42 from industrial design, 31 from biomedical engineering, 26 from telecommunications engineering, 15 from mining engineering, 13 from aeronautic engineering, 12 from IT engineering, and 2 from road engineering.

3.4. Statistical Analysis

The model was quantitatively analysed using structural equation modelling (SEM), and SMART PLS software was applied for data analysis. SEM is a multivariate technique that enables evaluation and tests multivariate causal relationships. The technique has been increasingly used since the beginning of the last century in multiple scientific domains, including education [67].
The first step was to analyse the data sample’s appropriateness for the chosen model. This involved testing the sample size as well as its qualities (missing values and normality). The second step was to perform an analysis of the measurement system, which meant validating the indicators (the survey questions). The specific statistical tests employed in these steps are detailed in the Results section. The third and final step was an analysis of the structural system, which assessed the validity of the relationships between the latent variables (or constructs) by testing the hypotheses (H1.1, H1, H2, H3, H4, H5 and H6).

4. Results

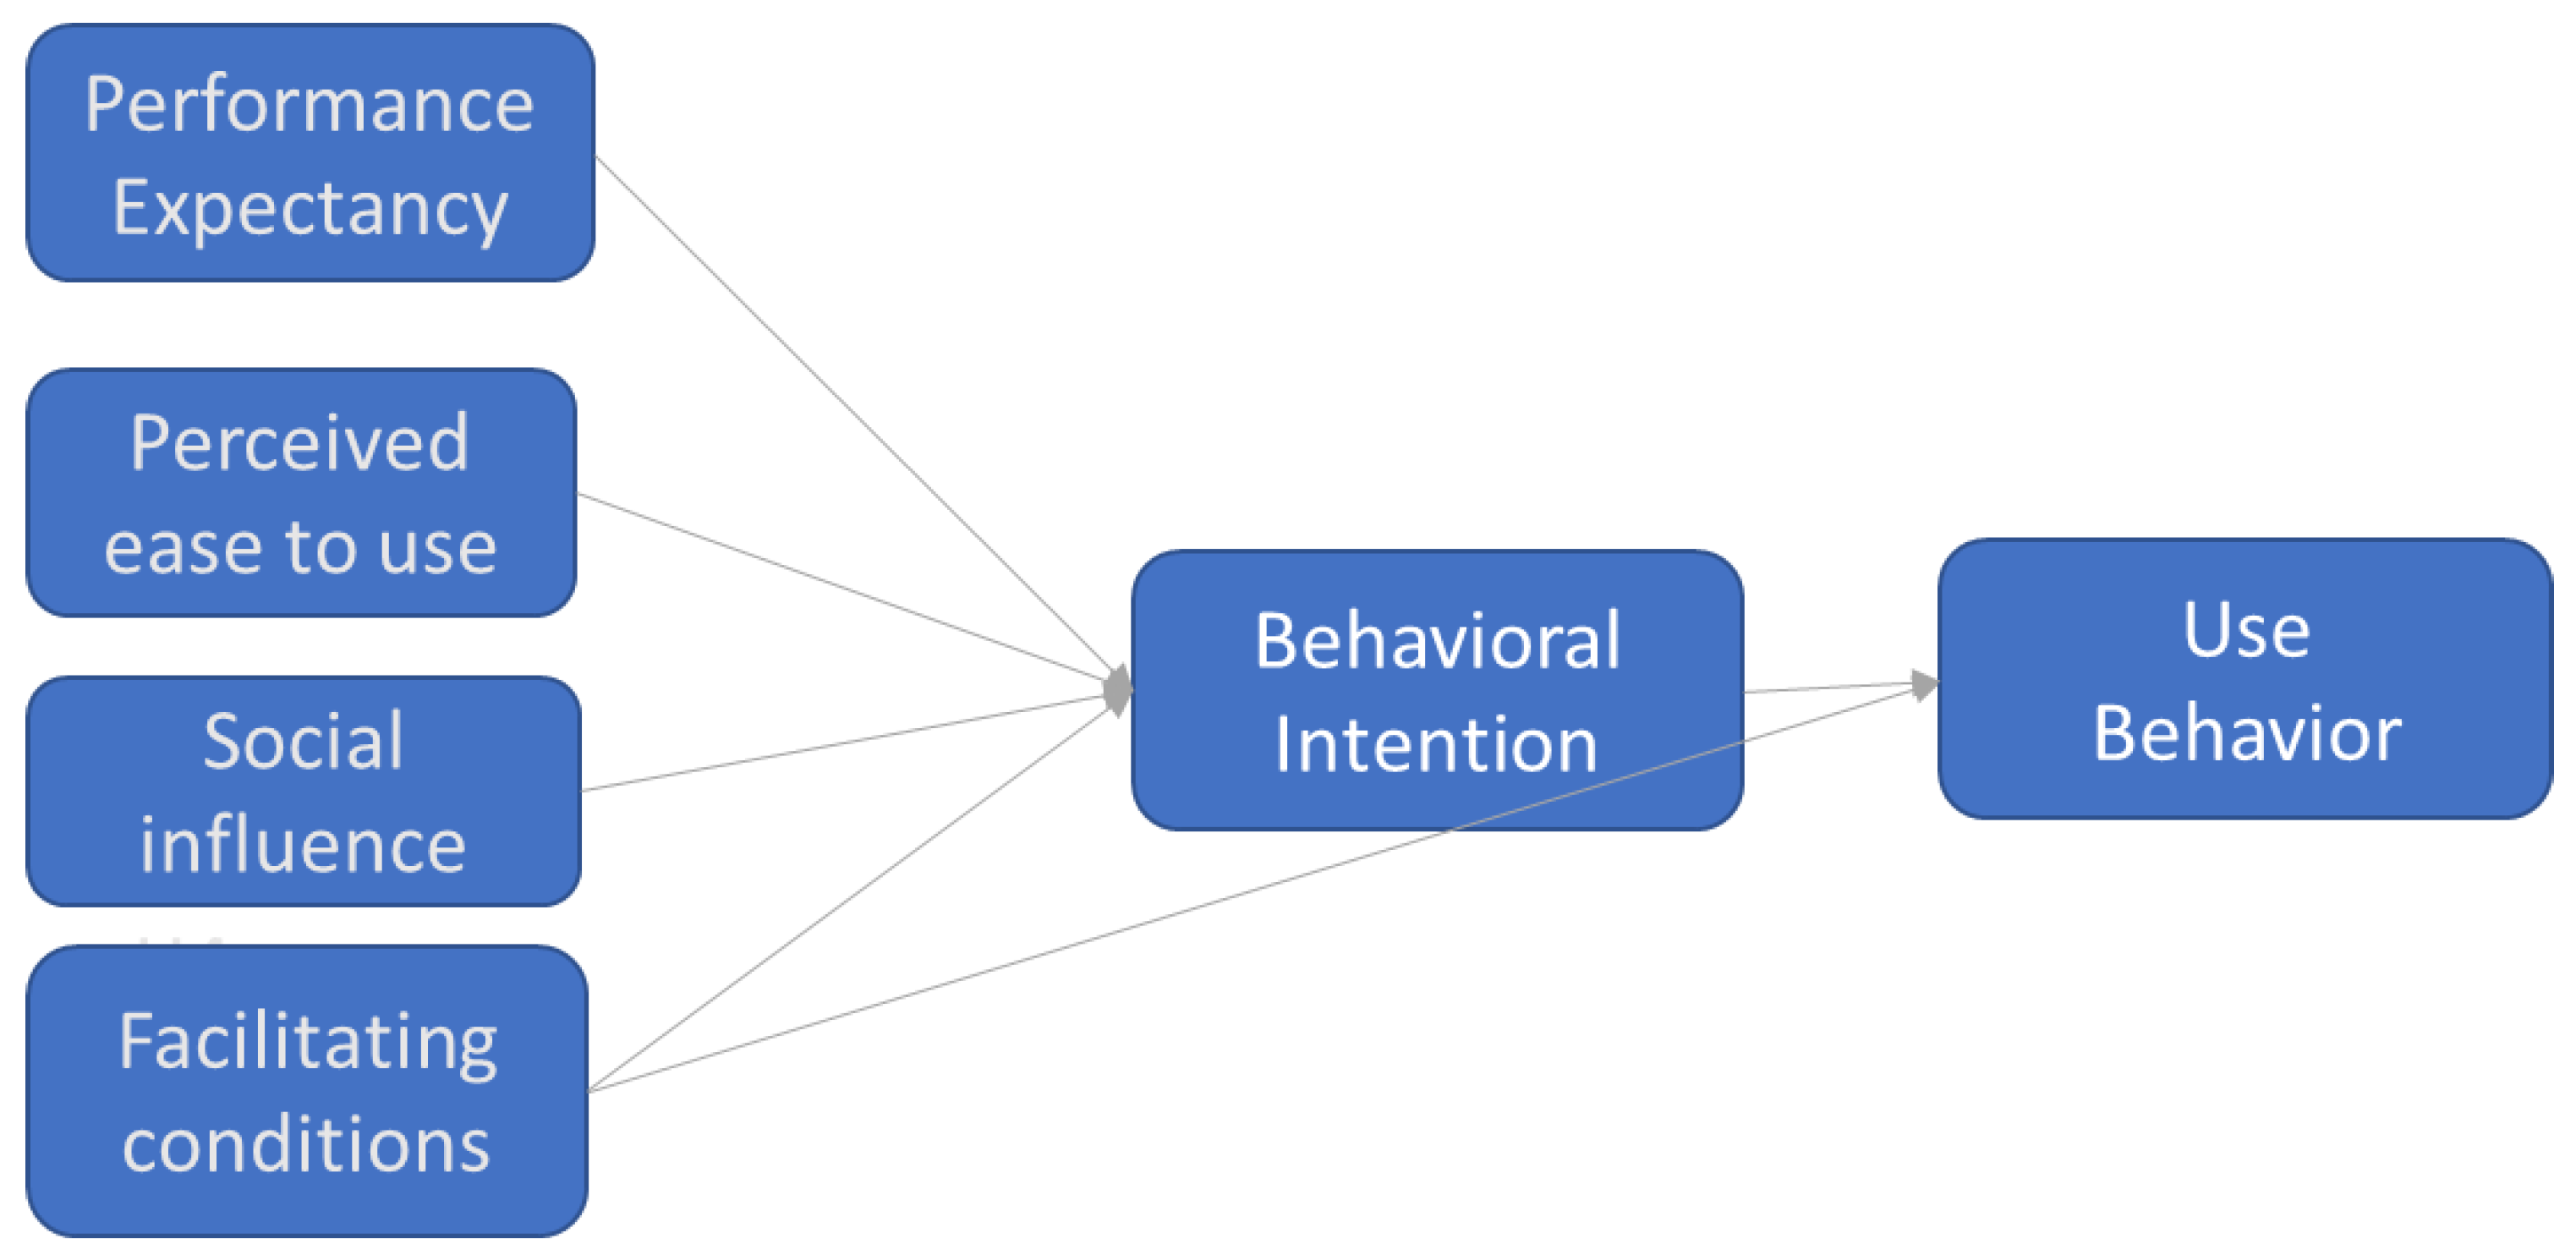
This section is composed of three parts. To begin with, an assessment of the volume and quality of the data in order to ensure it was sufficient and appropriate for carrying out the study. Secondly, an evaluation of the quality of our measurement system, in which each of the constructs in the model was decomposed into indicators, corresponded to the questions posed in the survey. Finally, an analysis of the quality of our model (structural analysis), the objective of which was to ensure there were no redundant elements (collinearity analysis) and to determine the predictive ability of the model, together with the relative weight of each of the constructs in the model. The predictive relevance of the model was analysed, and the weight of each of the constructs was determined, independently of the data, with the use of blindfolding techniques.

4.1. Data Analysis

This subsection deals with the evaluation of different aspects of the dataset, which consisted of a total of 346 samples. To begin with, the sample size was assessed in relation to the chosen model employing three different methods. The rule of [68] suggested a minimum viable sample size of between 40 and 60 (respectively equivalent to the highest number of formative indicators of a construct and the highest number of structural relationships, each multiplied by one order of magnitude). An estimate based on statistical power, developed by [69], indicated a minimum sample size of 97. (This method uses four parameters: the effect size, the power, alpha, and the number of predictors). The last method involved using the G Power programme, as recommended by [70], which yielded a value of 98. The threshold values thus obtained were, in all cases, amply surpassed by our dataset of 346 samples.
The second part assessed the qualities of the dataset. Missing values were evaluated using SmartPLS, which yielded a total of 290 missing values among a total of 34 indicators and 346 samples, which represented 2.4% of the dataset (290/(346 × 34)). This value being below the 5% threshold, the amount of missing data was thus considered quite acceptable. With regard to the distribution of the data, PLS does not impose any assumptions concerning its normality.
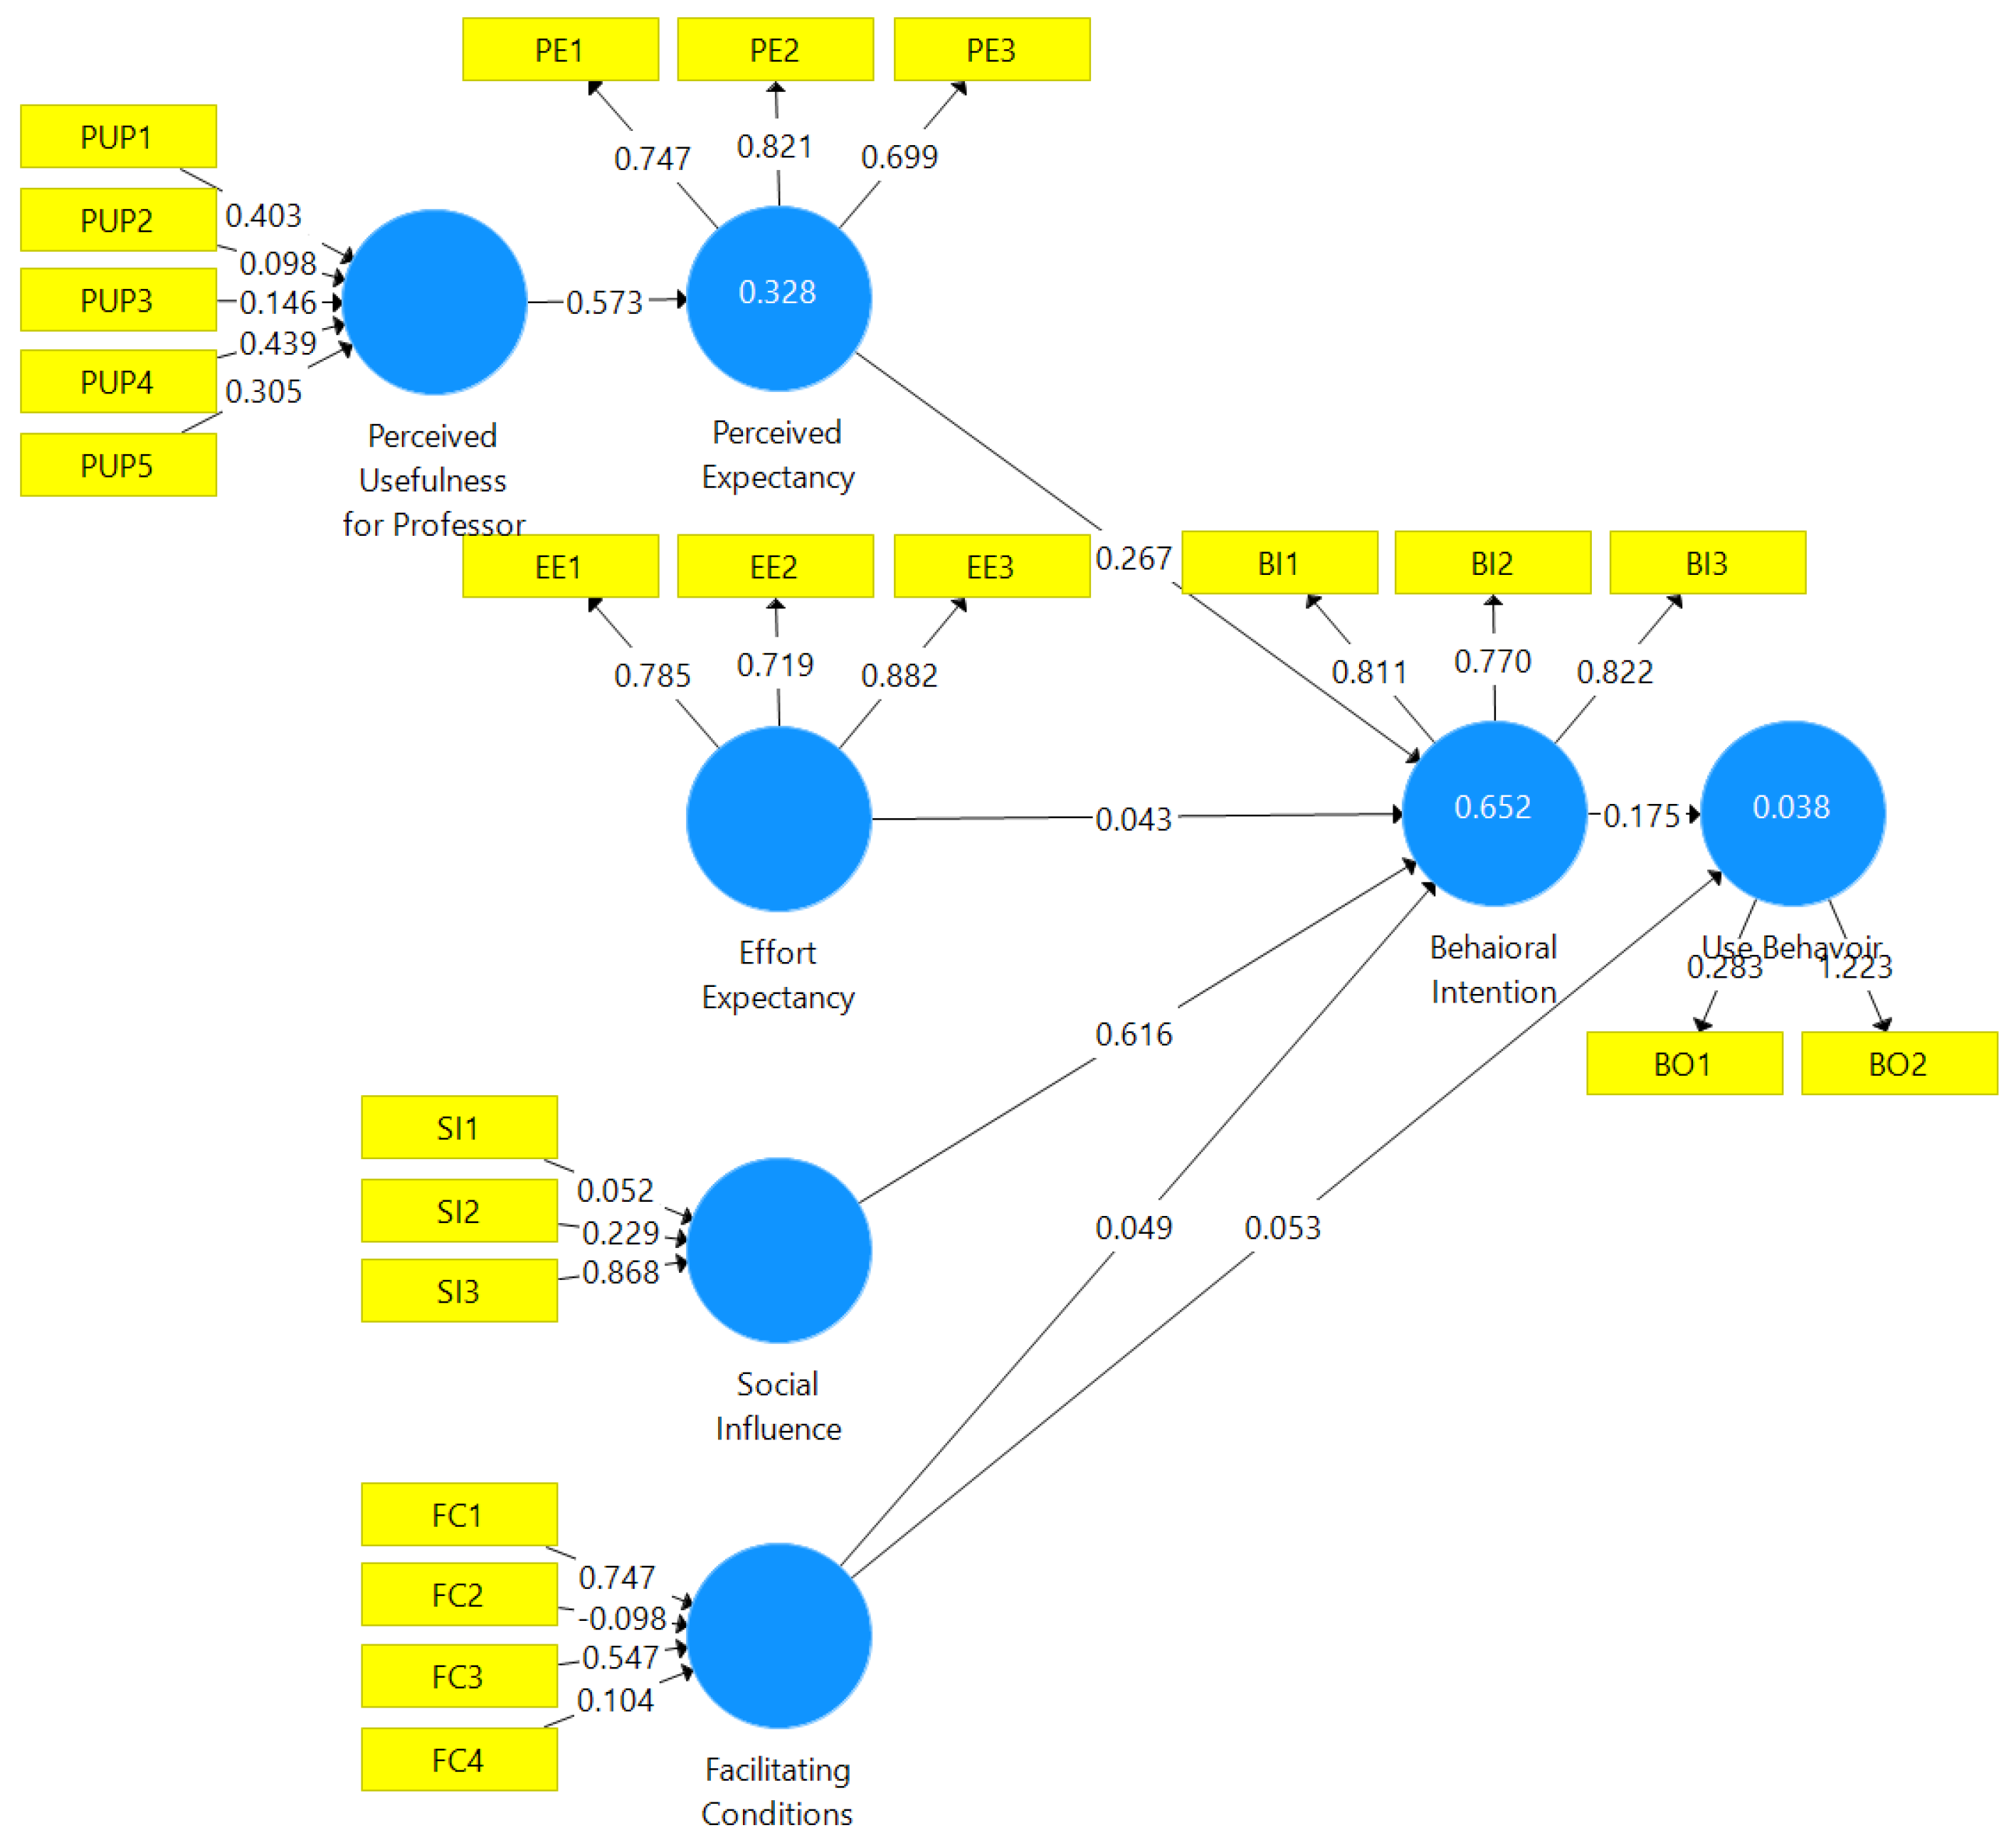
The theoretical model was set up in SmartPLS, as shown in Figure 3.

4.2. Analysis of the Measurement System

The objective of this analysis was to determine the extent to which the indicators for each construct or latent variable meet the required reliability and validity.
For the reflective indicators (outward arrows from the constructs), reliability was analysed using Cronbach’s alpha, composite reliability [71], and consistent reliability [72]. The resulting values were above 0.7. Convergent validity, or the extent to which a set of indicators represents a single construct, was evaluated through load analysis, commonality analysis, and AVE. Finally, discriminant validity, or the extent to which an indicator is different from the rest, was assessed using cross-load analysis [51].
The analysis of these indicators is reflected in Table 1. Focusing on the results for UB’s indicator B02, Cronbach’s alpha was 0.514, below the lower limit of 0.6, but composite reliability (0.843) and consistent reliability (1.369) were both acceptable. The indicator BO1 was dropped for having a load of less than 0.7. The criteria of [73] were followed.
The convergent validity of the reflective indicators was assessed, to begin with, by analysing loads. BO1 had a value below 0.7. The commonality of each indicator represents how much of the variance of the construct is due to the given indicator (with load values of 0.7, yielding 50% of construct variance). AVE describes how variations in the indicators are reflected in the construct. AVE values were above 0.5.
The discriminant validity was tested using the classical methods of cross-load analysis and the Fornell–Larcker criterion. Cross-loads were calculated using the correlations between the construct scores and the standardised data [53]. To comply, no item should load more heavily on another construct than on the one it is meant to measure [46]. The Fornell–Larcker criterion states that the amount of variance a construct receives from its indicators (measured by AVE) should be greater than the amount of variance it generates for other indicators. The results are presented in Table 2A,B. Cells in bold indicate links between the indicators and the constructs to which they belong (e.g., the intersections between BI and BI1, BI2, and BI3).
Ref. [74] demonstrated the lack of sensitivity of classical methods and devised the HTMT method. It represents the average correlation between HT (heterotrait-heteromethod) and MT (monotrait-heteromethod), and the values obtained should be below 0.9. The bootstrapping technique was then used to test whether the result was significantly different from 0.9. That is if the value 1 was included in the 90% confidence interval. The results for discriminant validity (HTMT) were as follows: EE effects in BI is 0.356; PE effects in BI is 0.588; PE effects in EE is 0.490; UB effects in BI is 0.188; UB effects in EE is 0.128; UB effects in PE is 0.124.
The following step was to evaluate the formative indicators (arrows from indicators towards constructs in Figure 3). It is important to note that the criteria applied to reflective constructors cannot be applied to constructive ones due to the inherent nature of how they are formed [75].
The formative constructs were tested through convergent validity analysis or redundancy analysis. This required a reflective indicator for every formative construct, which were included in the survey. Each formative construct was divided into two constructs. The first of these existed in the model, with the formative indicators, and it, in turn, communicate with a new global construct that had a single reflective indicator, which had already been considered in the survey. The path coefficient for this redundancy model will give us an idea of convergent validity. This is known as redundancy analysis [76]. A path coefficient value of around 0.7 or higher indicates convergent validity.
According to these criteria, the only formative indicators left were those for Social Influence (SI). The next step was to analyse the collinearity between them. VIF values < 3.3 indicate an absence of collinearity. Relevance and significance were then analysed. Given that the weights of the indicators decrease as they increase in number, the maximum possible weight value for each of the three SI indicators was 1/√3 = 0.58. The absolute importance of a formative indicator comes from its external load (loads come from simple regressions of the constructor with its indicators). Therefore, when the external weight of an indicator was not significant, the external load was analysed. If it was also below 0.5, its statistical significance was then analysed by applying the bootstrapping technique to more than 5000 samples. Doubts arose with respect to SI1, as it had the lowest external load, and its absolute contribution was 0.338 (below 0.5) and was not significant, but at the same time, it had no collinearity (VIF < 3.3) and was conceptually relevant [77]. See Table 3.
The remaining steps involved analysing the significance of the different groups of users that existed in the measurement system. These distinguished between:
  • Public and private university;
  • Men and women;
  • Different university schools.
Two types of non-parametric statistic tests were employed. The Mann-Whitney U test was employed when comparing two groups (see Table 4).
The different significance by universities (private/public) is B02, FCG, SI1 and BI3. On the other hand, BO2, SI1 and Si2 show different significance by gender.
The differences between the nine different engineering schools in the dataset were evaluated using the Kursaal-Wallis test for multigroup data (see Table 5).
Significance variance by engineering school grouping, according to the Kursaal-Wallis non-parametric test for multigroup data, are BO2, PUPG, FCG, SI1 and BI1.

4.3. Analysis of the Structural System

As a means for testing the hypotheses, the capacity of the model to predict one or more constructs was evaluated through an analysis of the structural model [76].
The following steps were taken:
  • Assessment of collinearity in the structural model;
  • Assessment of the significance and relevance of the relationships within the structural model;
  • Assessment of the level of R2;
  • Assessment of the effect size (f2);
  • Assessment of the predictive relevance (ϱ2);
  • Assessment of the predictive significance (q2).
Collinearity was evaluated considering a variance inflation factor (VIF), for which the value obtained was below the threshold of 3, thus meeting the criterion of acceptability. See Table 6.
Path coefficient values oscillate between −1 and 1, indicating stronger and more important relationships as they approach 1. The results yielded positive values in all cases, therefore supporting the model. Statistical significance depends on the standard error that results from applying the bootstrapping technique to a data sample. In this analysis, the two-tailed and 5000-sample test was employed. The higher the empirical t-value is above the critical value, the greater the statistical significance. Thus, with an alpha of 5% = 0.05, the critical value would be 1.96, and the result will have significance. The p-value is often used because it is easier to remember, as it corresponds to the alpha value and reflects the probability of erroneously rejecting the null hypothesis when it is true. Thus, a p-value below the significance level (alpha) implies the significance of the path coefficient. However, if zero is found within the confidence interval, it indicates non-significance. If a path coefficient is statistically significant, it indicates the extent to which the exogenous construct is linked to the endogenous construct [77] (see Table 7).
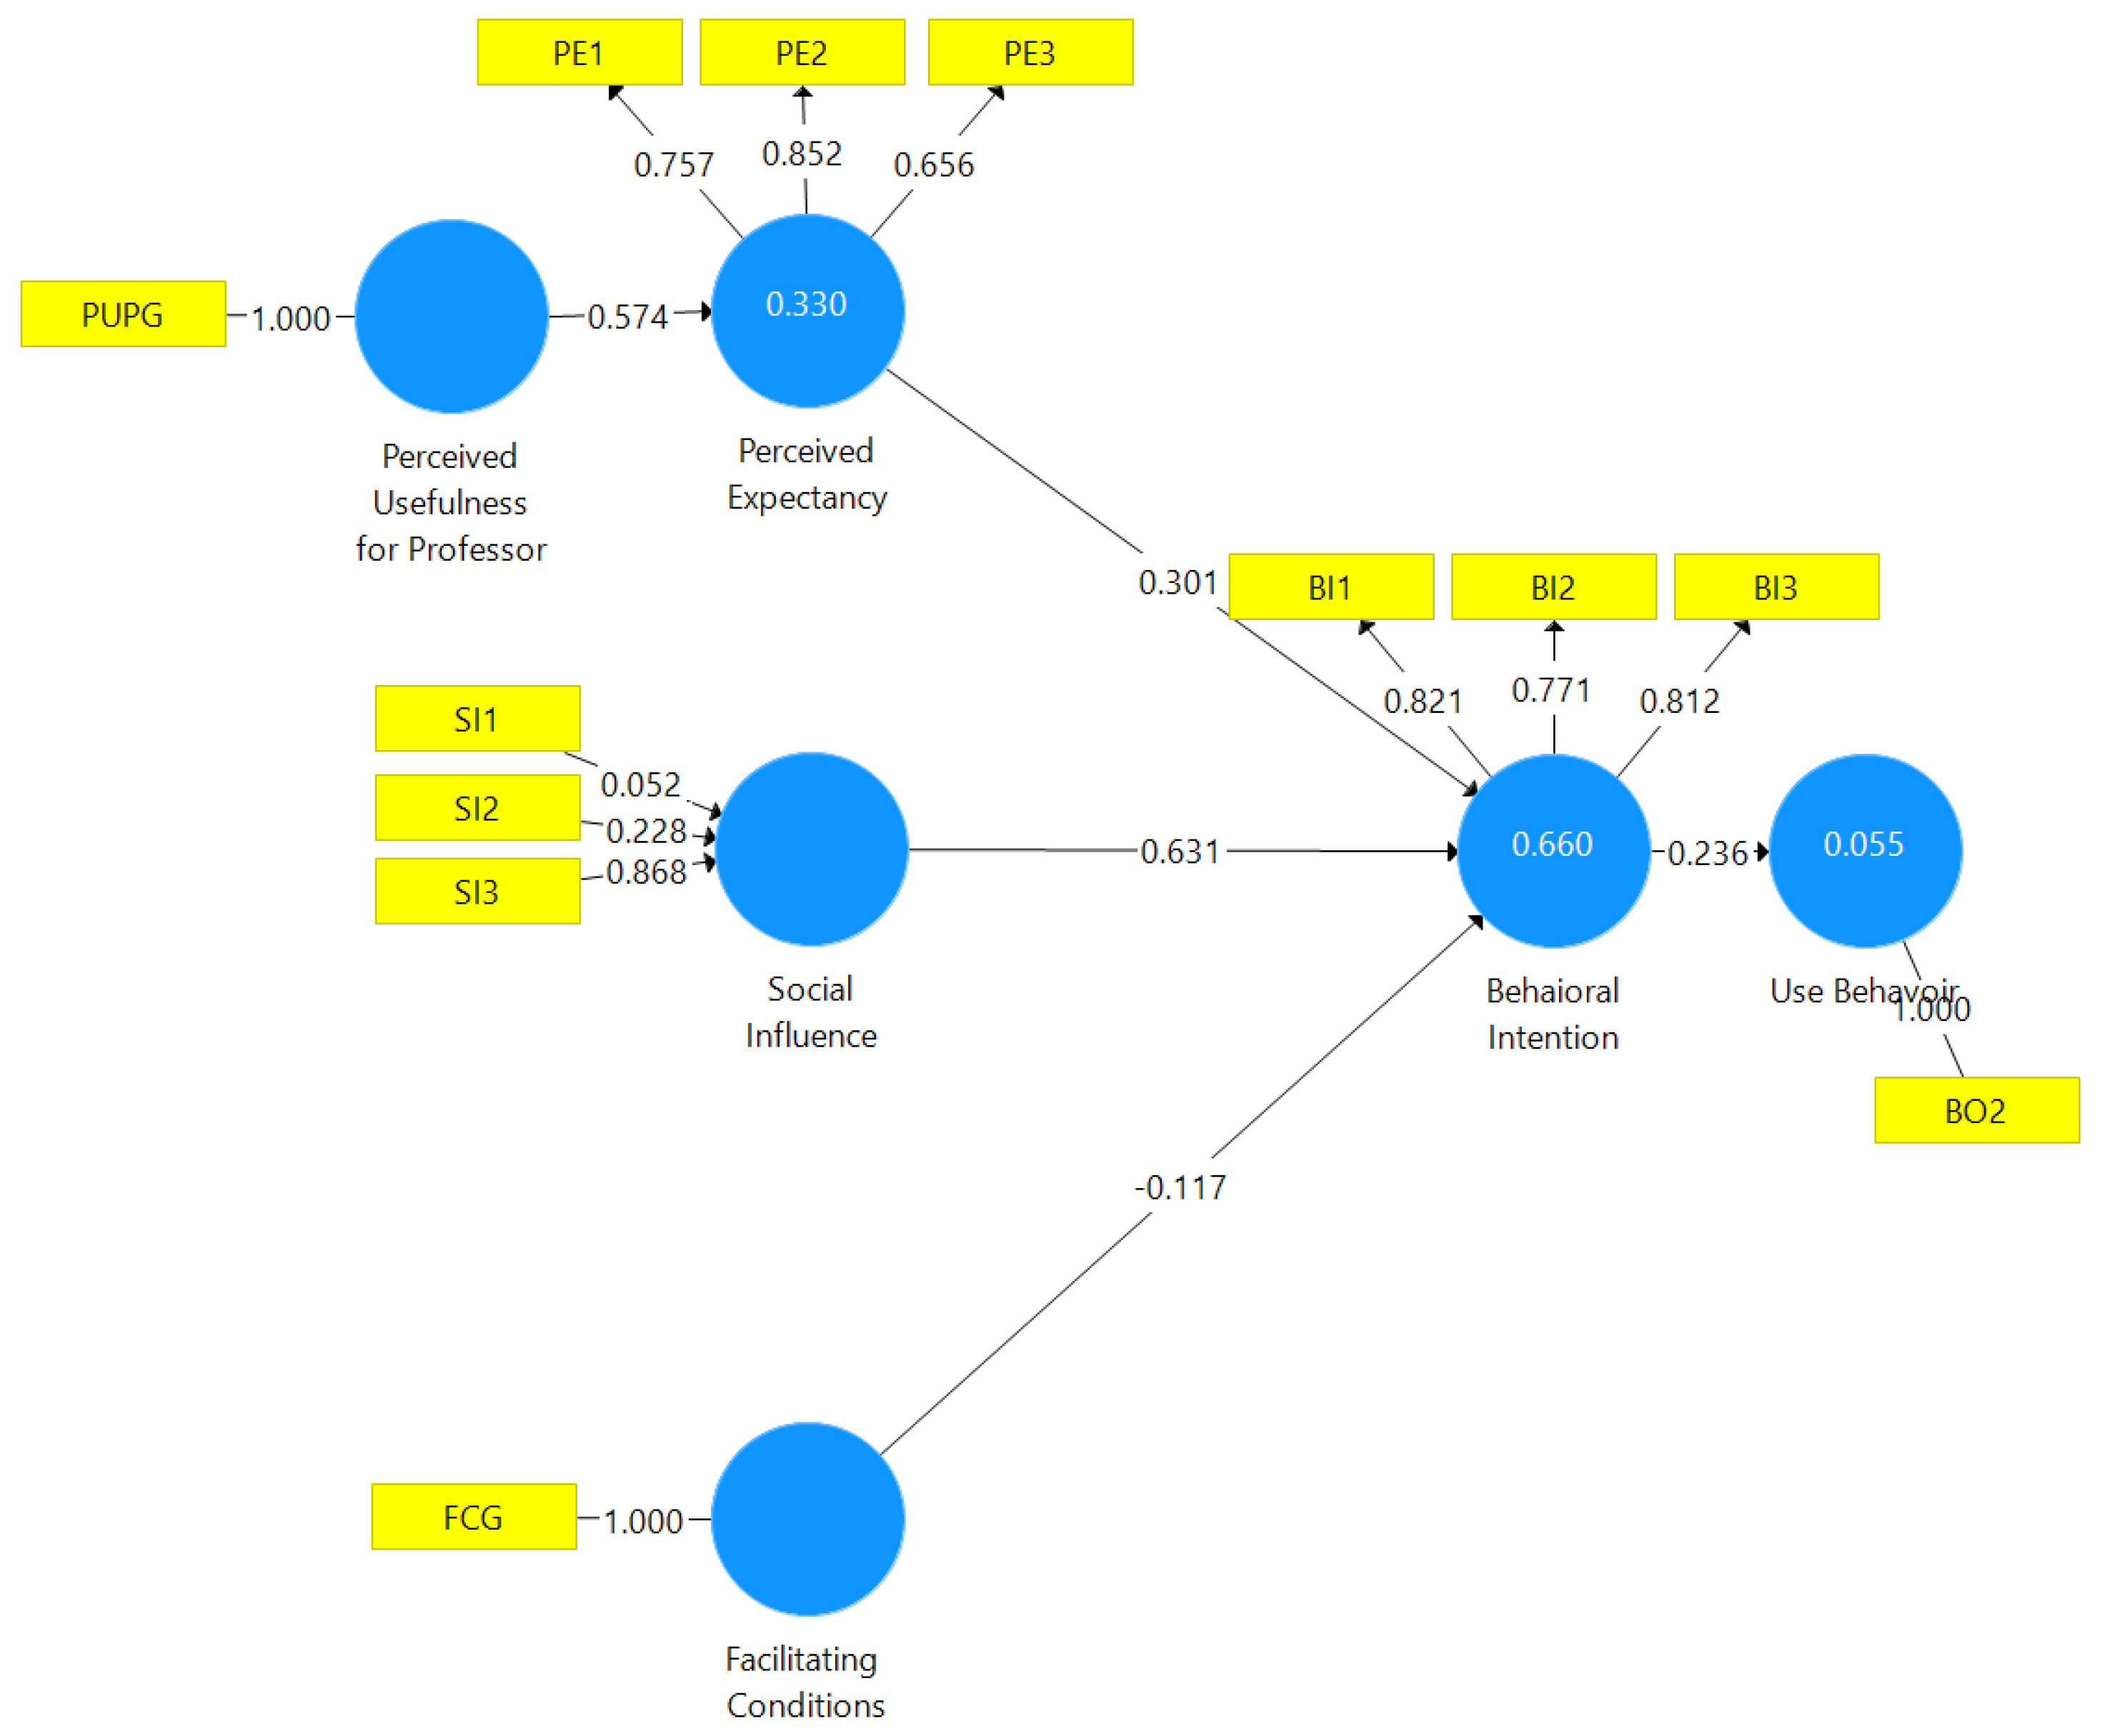
Therefore, our model is shown in Figure 4.
R-squared (R2) is useful as an assessment of the predictive ability of the model. It is calculated as the squared correlation between the actual and predicted value of a specific endogenous construct. This takes into account the combined effect of all exogenous constructs affecting the endogenous variable. Going further, an adjusted R-squared (R2 adj) that attempts to correct for the bias is more appropriate for complex models. R2 adj = 1 − (1 − R2) × (n − 1)/(n – k − 1), where n is the sample size and k is the number of exogenous variables affecting the endogenous construct being measured. The resulting values should be high enough to achieve a minimum explanatory power, which [78] state should be at least 0.1. [56] established that values of 0.67 and above were substantial, around 0.33 were moderate, and around 0.25 were weak in terms of explanatory power. [77] state that, in the field of marketing, values should be above 0.75, the explanatory power is substantial, around 0.5 and moderate, around 0.25. In the model, BI had a substantial predictive ability, PE moderate and UB weak. See Table 8.
Next, the impact of the non-significant constructs was measured, in particular, EE effects in BI and FC effects in UB. For the effect size, f2 was used, which measures the impact of omitting the effect of an exogenous construct on an endogenous construct, in terms of predictive ability (R2). The contributions of FC and EE to the predictive ability of the model were very small.
The heuristic rule established by [69] states that:
  • 0.02 ≤ f2 < 0.15: small effect;
  • 0.15 ≤ f2 < 0.35: moderate effect;
  • f2 ≥ 0.35: large effect.
Therefore, there was a large effect on SI effects in BI and PUP effects in PE, a small effect on PE effects in BI, and a negligible effect on PUP effects in BI, FC effects in BI, FC effects in UB, PE effects in UB, SI effects in UB (marked in red). See Table 9.
The predictive relevance (ϱ2) provides an assessment of out-of-sample predictive ability. For this purpose, a blindfolding technique was used, which consisted of reusing the sampled data, eliminating the dth datum, and re-estimating the parameters with the remaining data. The predictive relevance was obtained by calculating the difference between the true data (which were produced when omitting the edth datum) and that which was predicted. The Handbook of Partial Least Squares Structural Equation Modelling (PLS-SEM) states that for “the relative measure of predictive relevance, values of 0.02, 0.15, and 0.35 indicate that, for a particular construct, an exogenous construct has small, medium, or large predictive relevance, respectively”. Thus, the predictive relevance for BI was considerably high (0.406); for PE, moderate (0.187); and for UB, small (0.035).
Next, an analysis of the effect size was performed based on the predictive relevance, similar to what was previously done based on the R2 values.
Therefore, considering the value of the path coefficients, the significance of the path coefficients themselves, and the effect size on both BI and UB, the latent variables EE on BI and FC on UB were dropped from the model.
The following step was to analyse the heterogeneity of the dataset. To this end, the following category groups were analysed:
  • University (Public/Private);
  • Gender (Men/Women);
  • Schools.
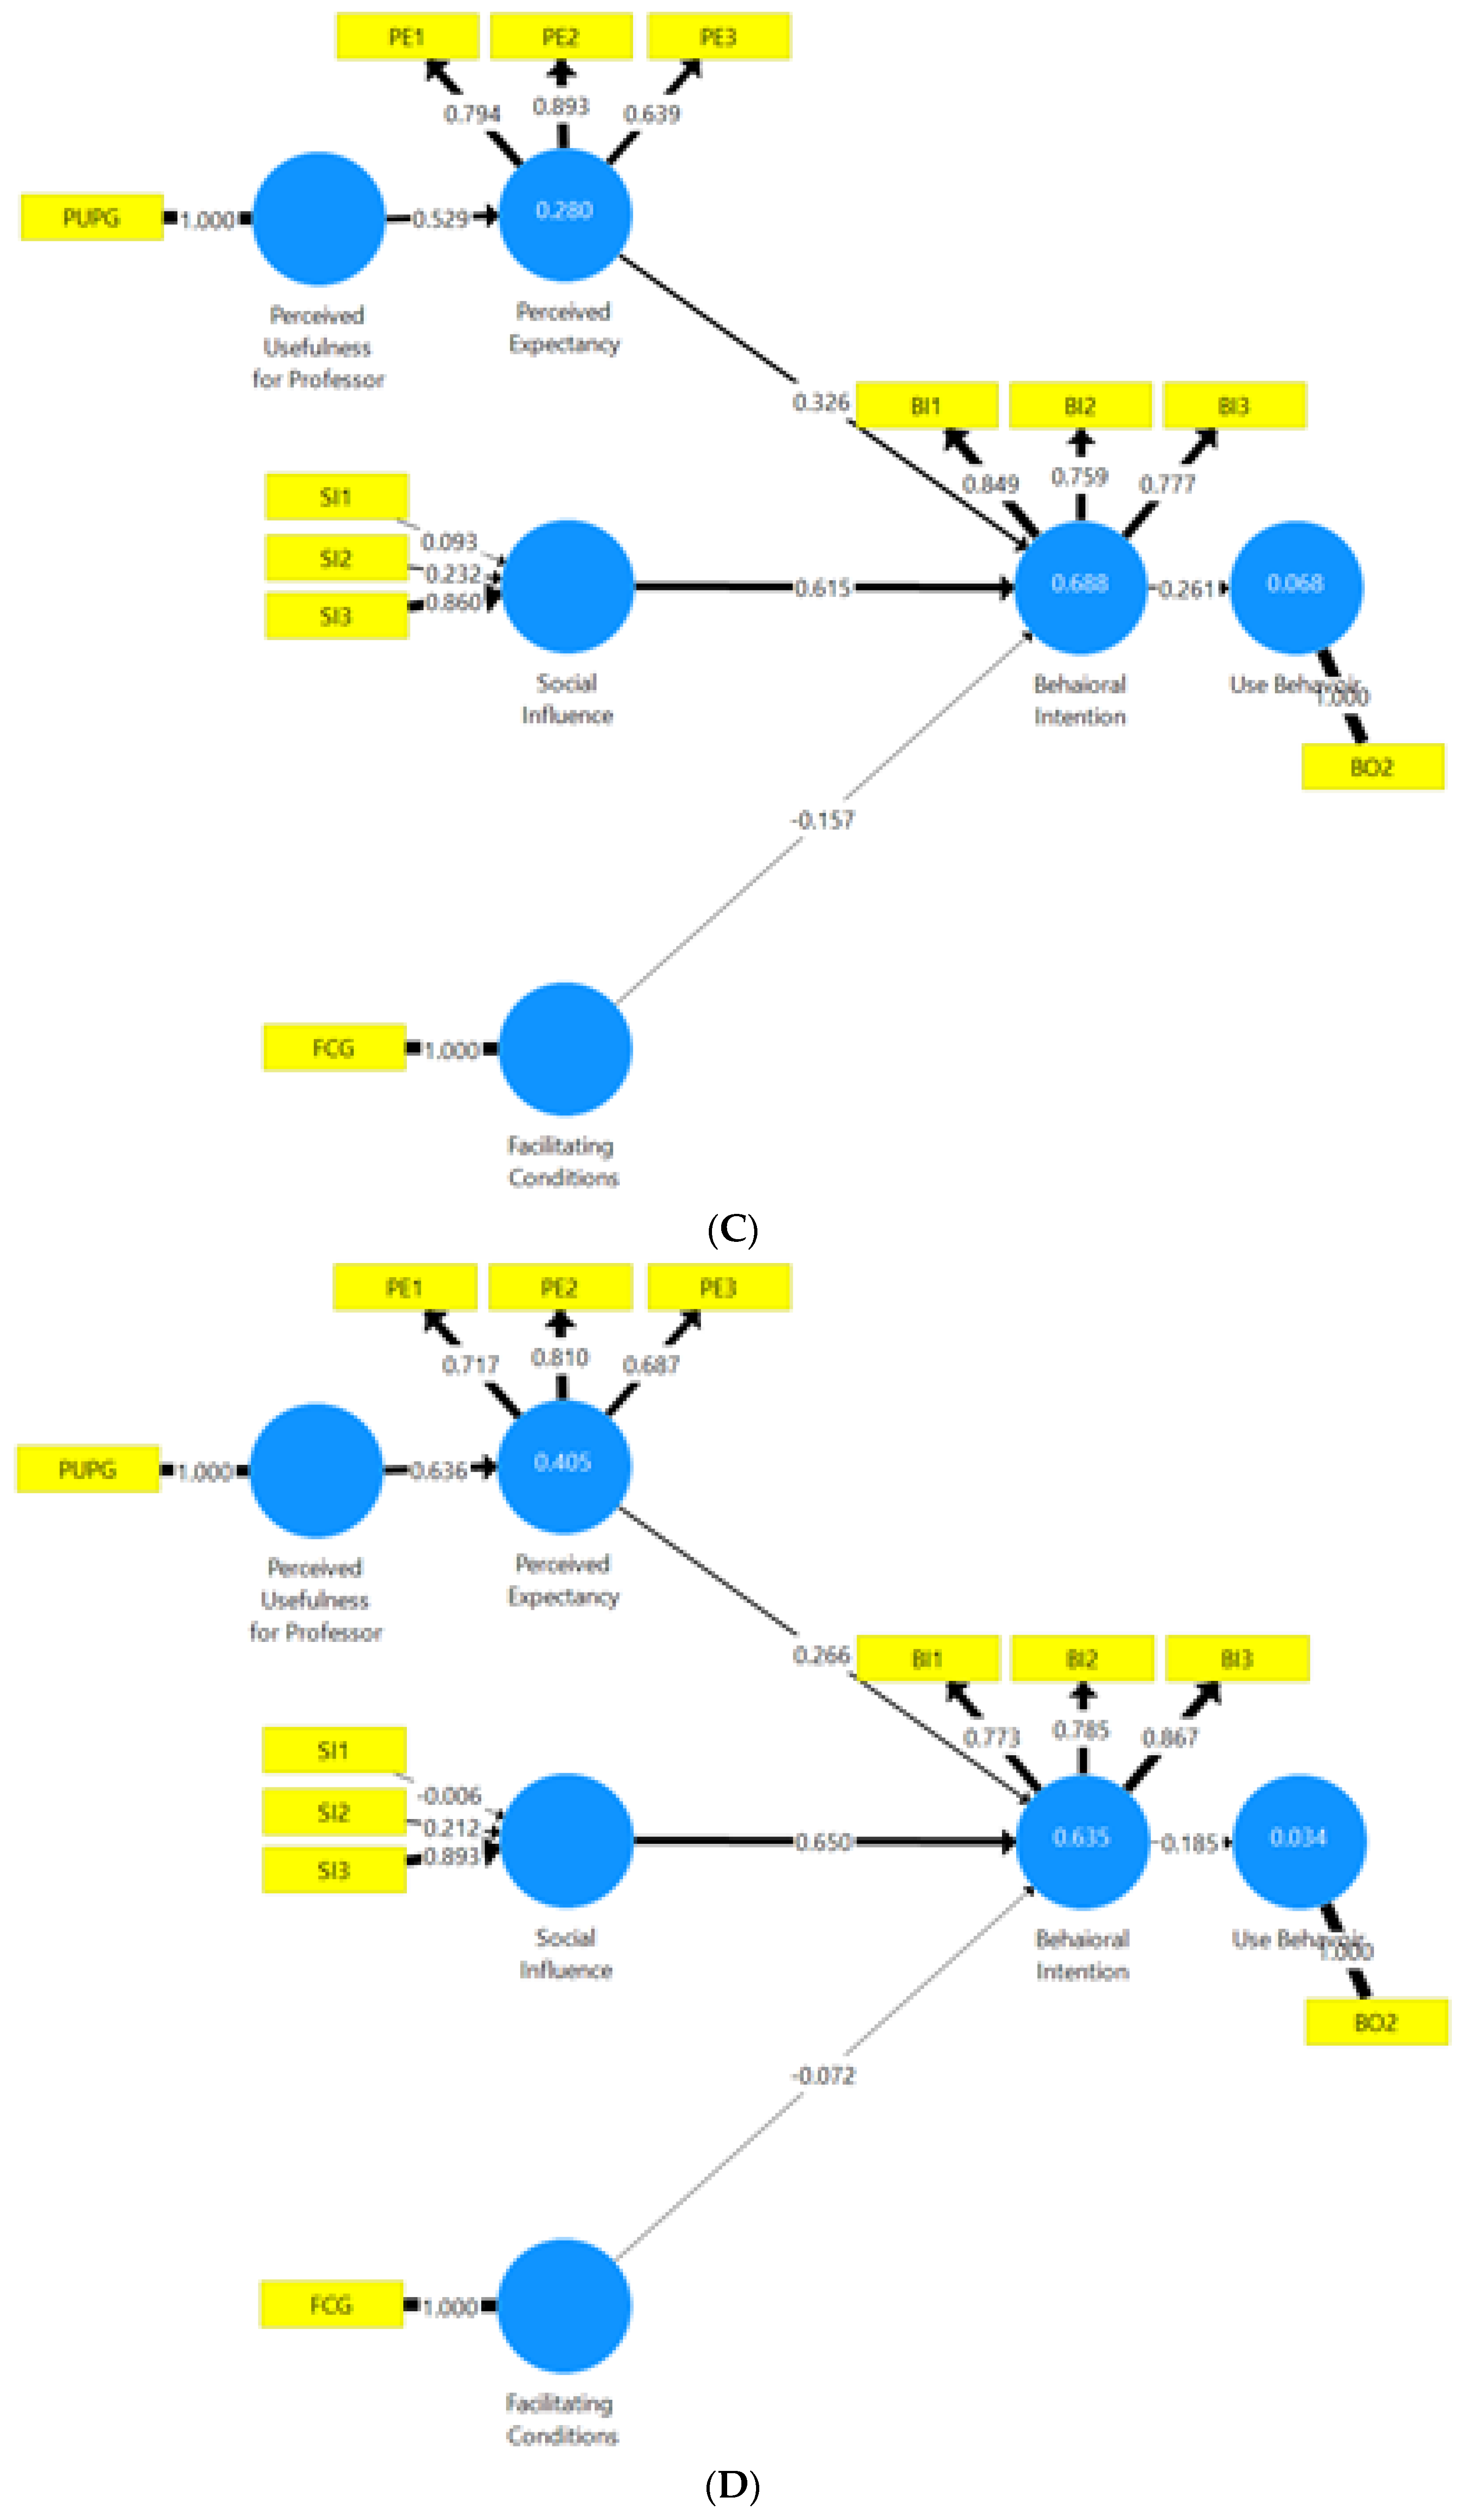
To end, the extent to which the groups differed was analysed, so as to determine if the differences among them were significant or not. The technique proposed by [74] was used, which involves applying bootstrapping to the dataset with 5000 samples. Parameters for each group were thus estimated, and a comparison among these determined if the differences were significant or not. This analysis was carried out using MGA multigroup analysis with SmartPLS. The results in 
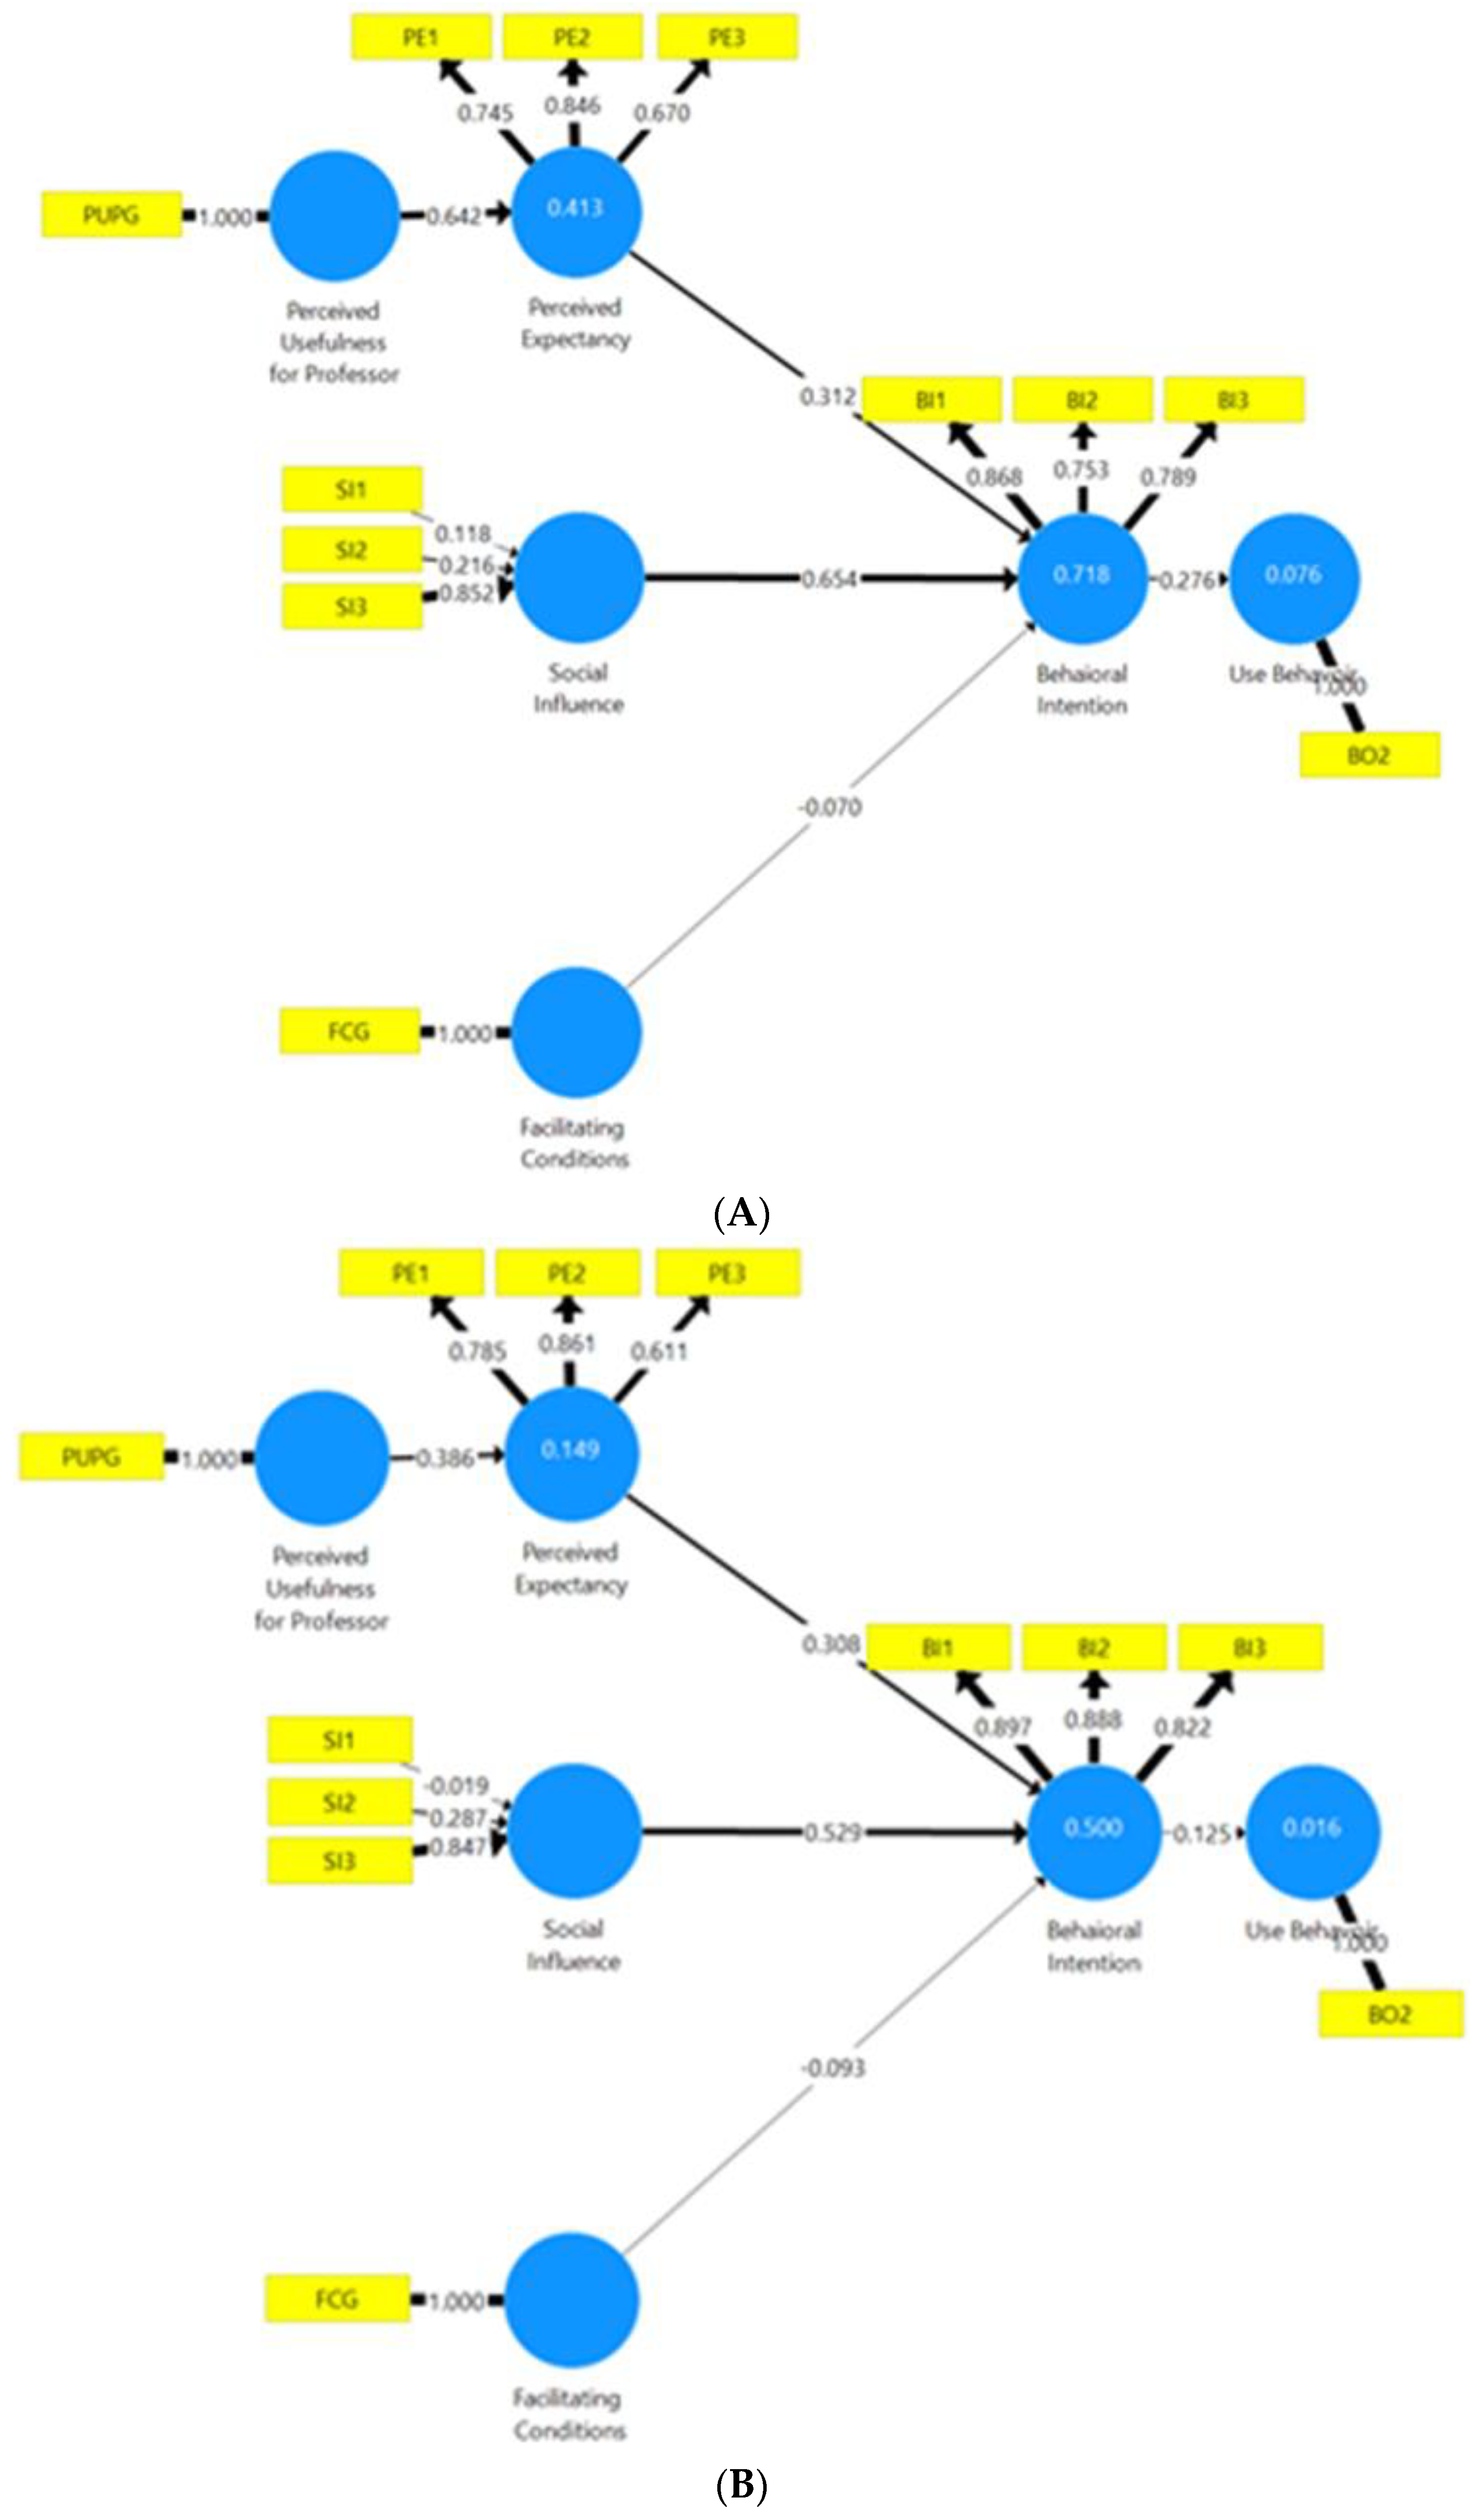
Table 10 show that only PUP was significant when comparing university types. Also, R2 was greater in the public sector than in the private one (0.714 vs. 0.493). See Figure 5A–D and Figure 6, and Table 10.
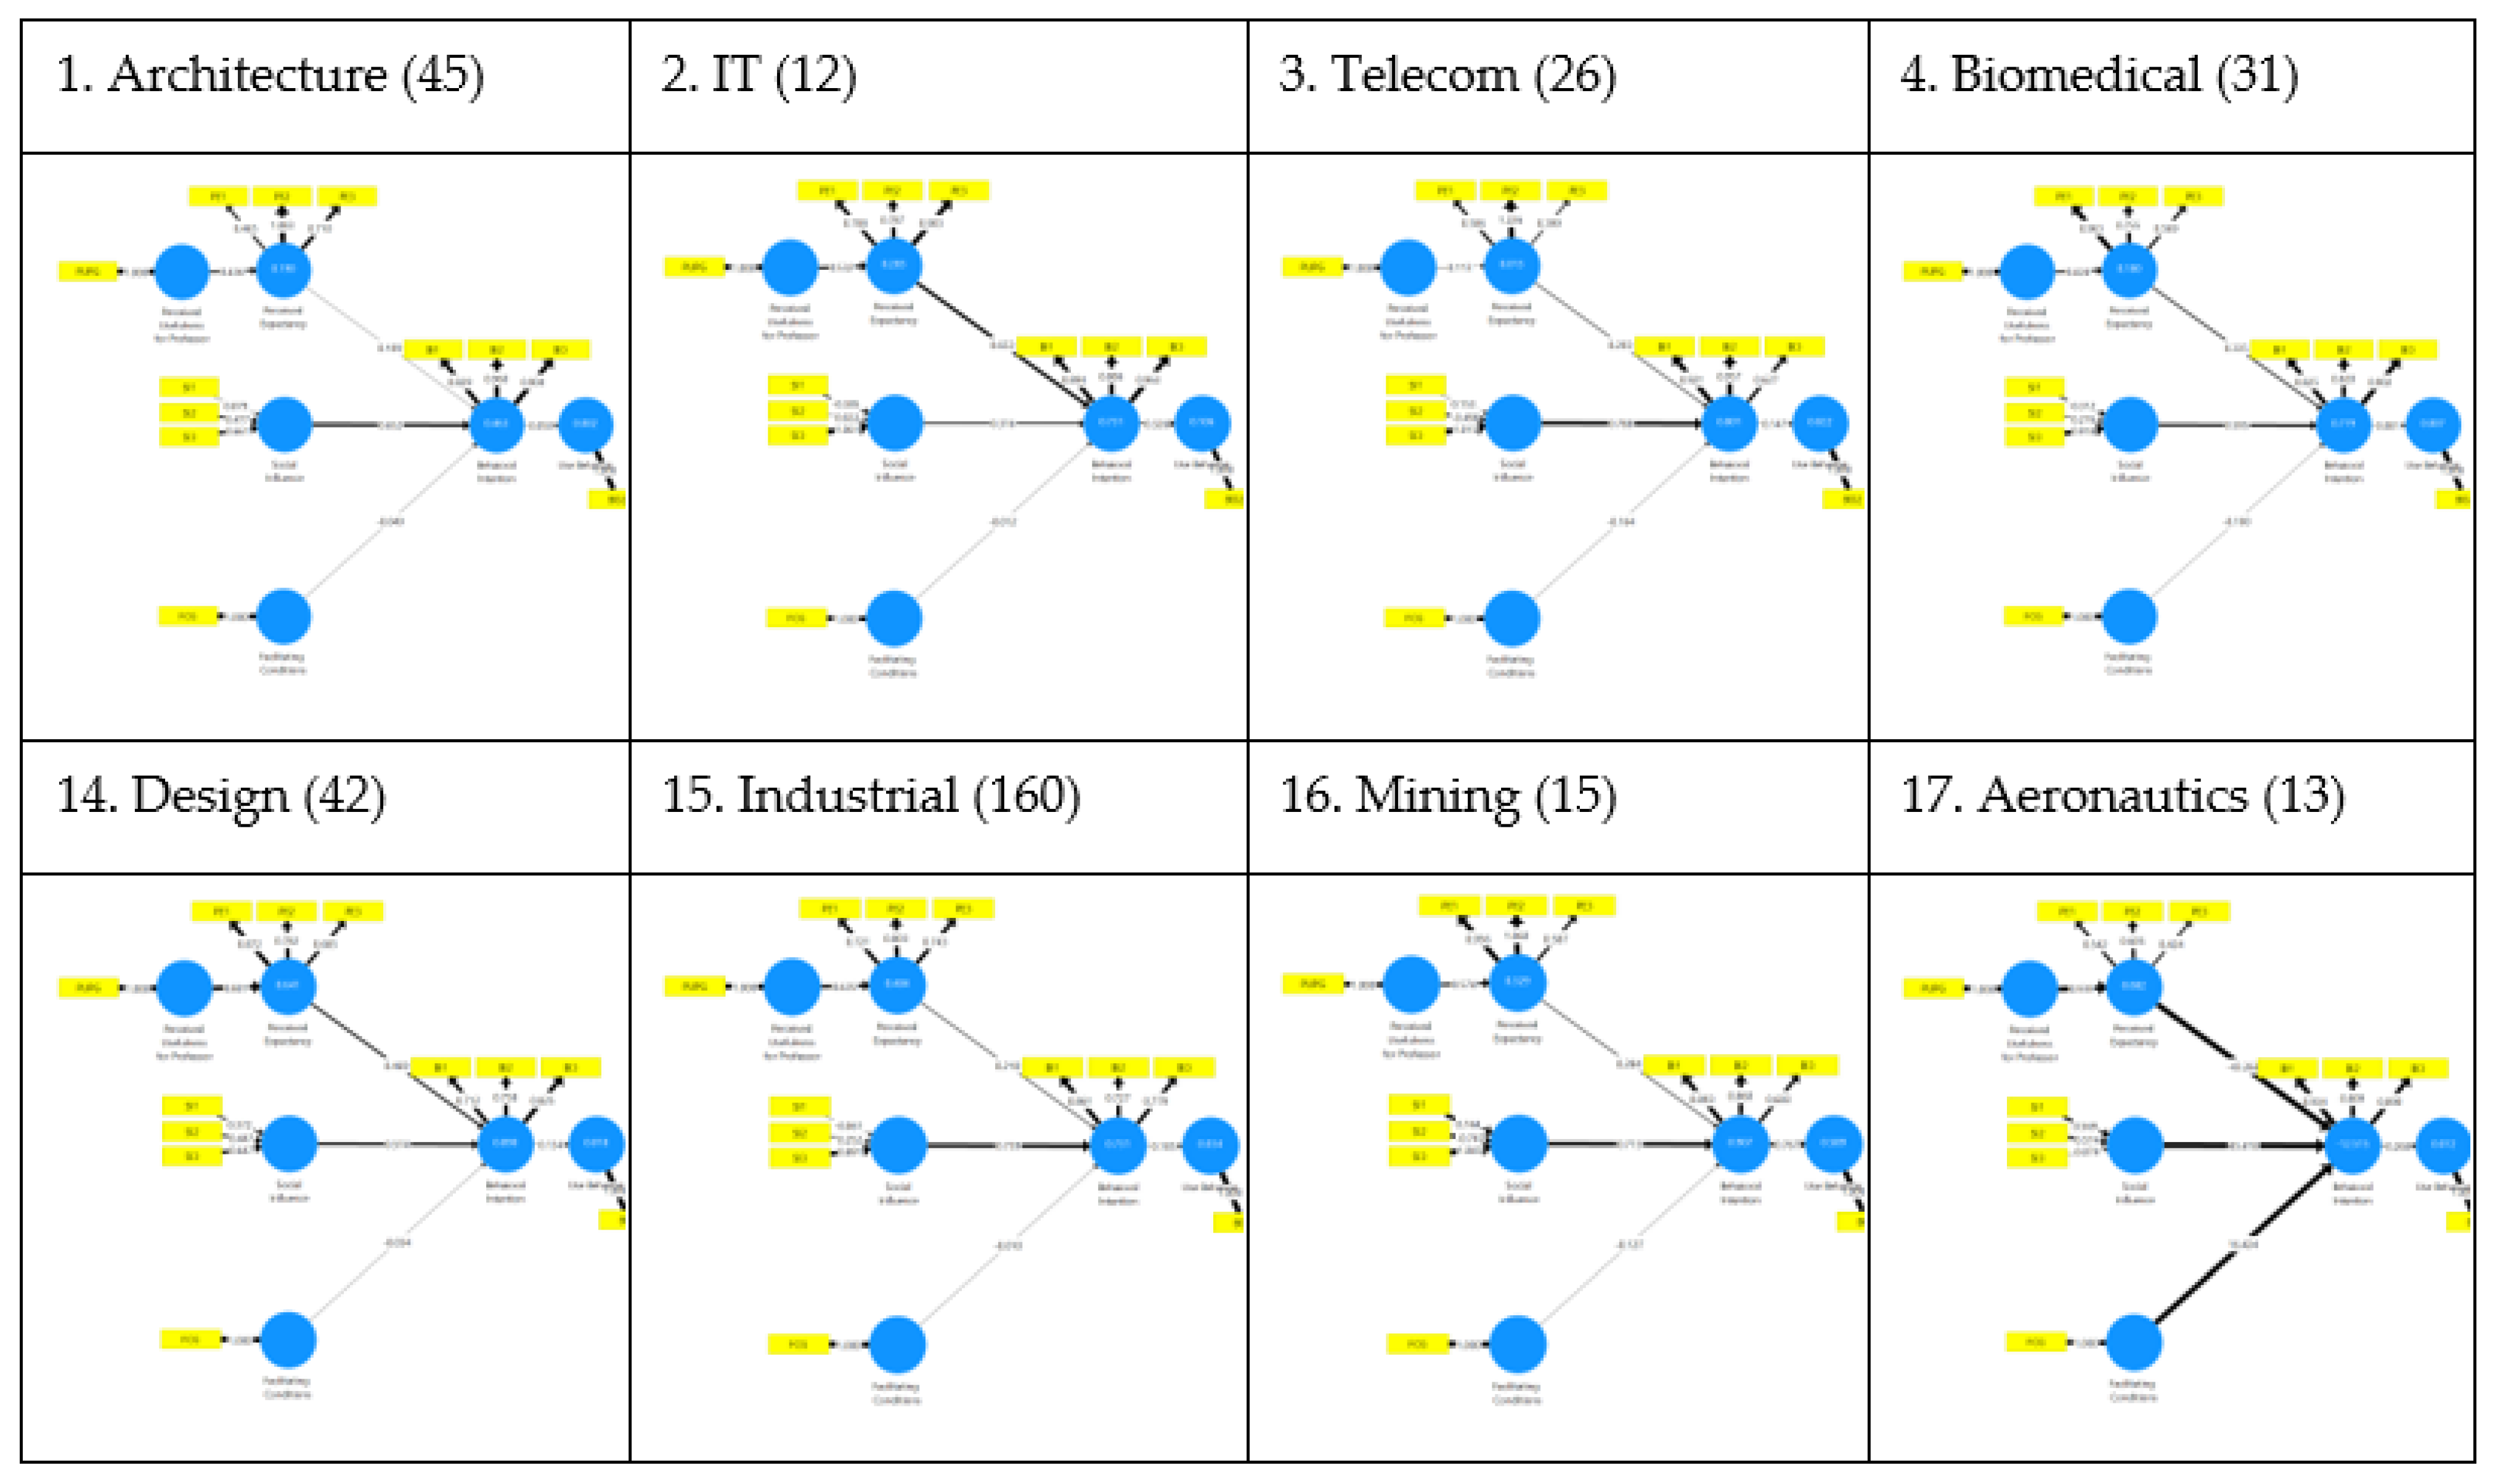
Grams for different university engineering schools. The brackets indicate the number of respondents from each school. Source: own elaboration.
The school-based models did not have sufficient sample sizes to validate them, except in the case of Industrial Engineering (160 samples, above the minimum sample size of 97). Therefore, it was not possible to analyse the extent to which differences among schools were significant. In addition, the school-based models displayed rather atypical results due to the limited amount of data available (see Figure 6).

4.4. Summary of Results

Table 11 presents a summary of significant differences by group for each indicator.
  • The indicator BO2 (use of MS Teams) displayed significant differences among all groupings. This is due to the tool being mandatory at the private university.
  • The indicator SI1 (the professor’s social influence) displayed significant differences between genders and types of universities, and it reflected the important influence exerted by the professor on public students and women.
  • The indicator SI2 (classmates’ social influence) displayed a significant difference between genders, being a more important factor for women than men.
The structural system shows a very good predictive ability (see Table 12). R2 values should be high enough for the model to achieve a minimum level of explanatory power [58] recommend values above 0.10, whereas [56] considers R2 values of 0.67, 0.33, and 0.19 as substantial, moderate, and weak, respectively. The model had a very high coefficient of determination (R2 = 0.660) for the intention to use MS Teams (BI), it being higher for public universities (R2 = 0.718) and men (R2 = 0.688). The value of 0.384 for BI indicates a high coefficient of determination. The model is, therefore, valid for BI.
The elements that determine BI are especially SI (Social Influence) and PE (Perceived Expectancy) according to the values of the path coefficients.
The differences between path coefficients when comparing public and private universities suggest reasons for it being higher in the public sector, given that it is for PE that the non-parametric statistical data show a significant difference (see the numbers in blue in Table 12). It is, therefore, for PE that predictive ability shifts between public and private institutions.

5. Discussion

The most important factor determining the intention to use (BI) was Social Influence (SI). When analysing the SI indicators (SI1, SI2 and SI3), it is worth mentioning the enormous weight that opinions from social and professional networks had in determining the intention to use e-learning. Social networks and professional forums are, therefore, key tools for developing a positive attitude towards e-learning by students in the current situation. This should lead to a reflection on the permeability of professors and higher education institutions to tool choices coming from professional or social networks. This is, in general terms, consistent with results found in previous research dealing with the application of UTAUT to e-learning acceptance during COVID-19 in very different regional contexts [43,46,49,50,54,60]. However, it is possible to mention some exceptions, as a similar study focused on a developing country found that social influence did not affect students’ acceptance of e-learning [52]. This seems to imply that the impact of social influence on e-learning acceptance in the pandemic context could be context-dependent.
The second most important factor affecting BI was the Performance Expectancy (PE), which in the model was determined by the new construct introduced: perceived usefulness for the professor (PUP). In other words, the professor’s attitude towards the e-learning tool was the second most important element influencing the acceptance of TEAMS. Moreover, the results suggest that professors could have more influence over student acceptance of the e-learning platform at public universities than at private ones. Although more research is needed to confirm and explain this result, a possible explanation for this could be the differences in terms of governance between these two types of institutions. Indeed, governance at private universities in Spain usually follows a top-down approach, whereas public universities are less hierarchical [79]. Indeed, the use of TEAMS in the private institution was imposed on the professors, whereas it was optional at public universities. Moreover, private institutions are usually more student-centred (as the student is in part considered as a “customer”), while public institutions follow a more traditional, professor-focused approach.
It is surprising how little weight the facilitating conditions (FC) had on determining the use of the tool, as prior studies on the matter have mostly found that facilitating conditions have a direct impact on students’ acceptance of e-learning during the pandemic [43,49,50,51,52,57]. In this case, the means provided by the university did not determine the students’ attitudes towards e-learning. The same occurred with effort expectancy (EE). The effort involved in assimilating a new collaborative tool did not condition the learner’s intention to use it. This suggests that, in this case, if network “influencers” establish that one tool is better than another in terms of prestige, improvement, and usefulness, it will not be the means provided by the university (support, manuals, networks, computers, etc.) that condition the students’ use. It seems that a fast-learning curve was achieved through the internet and through students sharing experiences among themselves. This result could be linked to the particular regional and disciplinary context in which this study was conducted. Indeed, engineering students in a developed country such as Spain are likely to have significant prior e-learning experience as well as appropriate equipment at home, which would explain the reason why facilitating conditions provided by the university and effort expectancy were not as important in predicting e-learning acceptance as in other cases reported in the literature, coming mostly from developing countries.

6. Conclusions

The main conclusion of this research is that social Influence was the most important factor determining the acceptance of Ms Teams by the students, while the perceived usefulness of the professor occupied the second place. The facilitating conditions and effort expectancy did not affect acceptance, probably due to the particular pandemic context. A significant difference was found between the public and private institutions in terms of the importance of the perceived usefulness for the professor (this factor was more important for students’ acceptance of MS Teams at the public university).
To sum up, for students, managing the change to a new e-learning tool under special circumstances lived during the COVID-19 pandemic requires, first of all, that the software package is positively considered in personal and professional circles and on social networks. This implies that universities wishing to introduce Ms Teams under the current scenario should focus on creating a positive social environment around the platform, for example, by using social networks or relying on testimonies by professionals who could confirm the interest of such a platform in a future work environment. Universities should also be very attentive to proposing to students with e-learning solutions that are used and valued in professional environments.
The second element is performance expectancy (the degree to which the student believes that using the system will help him or her to attain a better performance), where professors play a key role. It is, therefore, particularly important to seek the involvement of professors when implementing e-learning platforms. In that sense, more research is needed to better understand the professors’ perspective and the factors that would facilitate their acceptance of e-learning technology.
An obvious limitation of this research is the fact that it has been conducted in two specific higher education institutions in a particular geographic setting. Furthermore, the findings of this study are limited to an exploration of MS Teams acceptance and may not be applicable to other e-learning platforms. Future research endeavours could include an exploration of the acceptance of e-learning in other geographic contexts using platforms other than MS Teams. More research is also needed regarding the context-dependency of the factors affecting e-learning acceptance during the COVID-19 outbreak.

Author Contributions

Conceptualization, P.G.-G. and T.S.-C.; methodology, P.G.-G., T.S.-C. and M.J.S.-N.; software, P.G.-G.; validation, T.S.-C. and M.J.S.-N.; formal analysis, P.G.-G. and M.J.S.-N.; investigation, P.G.-G. and T.S.-C.; resources, T.S.-C. and P.G.-G.; data curation, P.G.-G.; writing—original draft preparation, P.G.-G. and T.S.-C.; writing—review and editing, P.G.-G., T.S.-C. and M.J.S.-N.; visualization, P.G.-G.; supervision, T.S.-C. and M.J.S.-N.; project administration, P.G.-G. and T.S.-C.; funding acquisition, P.G.-G. and T.S.-C. All authors have read and agreed to the published version of the manuscript.

Funding

This research received no external funding.

Institutional Review Board Statement

Not applicable.

Informed Consent Statement

Not applicable.

Data Availability Statement

Not applicable.

Conflicts of Interest

The authors declare no conflict of interest.

References

  1. Bryson, J.R.; Andres, L. COVID-19 and rapid adoption and improvisation of online teaching: Curating resources for extensive versus intensive online learning experiences. J. Geogr. High. Educ. 2020, 44, 608–623. [Google Scholar] [CrossRef]
  2. Crawford, J.; Butler-Henderson, K.; Rudolph, J.; Malkawi, B.; Glowatz, M.; Burton, R.; Magni, P.A.; Lam, S. COVID-19: 20 countries’ higher education intra-period digital pedagogy responses. J. Appl. Learn. Teach. 2020, 3, 1–20. [Google Scholar] [CrossRef] [Green Version]
  3. Toquero, C.M. Challenges and Opportunities for Higher Education amid the COVID-19 Pandemic: The Philippine Context. Pedagog. Res. 2020, 5, em0063. [Google Scholar] [CrossRef] [PubMed] [Green Version]
  4. UNESCO. COVID-19: Reopening and Reimagining Universities, Survey on Higher Education through the UNESCO National Commissions. 2021. Available online: https://unesdoc.unesco.org/ark:/48223/pf0000378174 (accessed on 18 June 2021).
  5. Demuyakor, J. Coronavirus (COVID-19) and Online Learning in Higher Institutions of Education: A Survey of the Perceptions of Ghanaian International Students in China. Online J. Commun. Media Technol. 2020, 10, e202018. [Google Scholar] [CrossRef]
  6. Radha, R.; Mahalakshmi, K.; Kumar, V.S.; Saravanakumar, A.R. E-Learning during lockdown of COVID-19 pandemic: A global perspective. Int. J. Control. Autom. 2020, 13, 1088–1099. [Google Scholar]
  7. Maatuk, A.M.; Elberkawi, E.K.; Aljawarneh, S.; Rashaideh, H.; Alharbi, H. The COVID-19 pandemic and E-learning: Challenges and opportunities from the perspective of students and instructors. J. Comput. High. Educ. 2021, 34, 21–38. [Google Scholar] [CrossRef]
  8. Naciri, A.; Baba, M.A.; Achbani, A.; Kharbach, A. Mobile Learning in Higher Education: Unavoidable Alternative during COVID-19. Aquademia 2020, 4, ep20016. [Google Scholar] [CrossRef] [PubMed]
  9. Tang, Y.M.; Chen, P.C.; Law, K.M.; Wu, C.H.; Lau, Y.Y.; Guan, J.; He, D.; Ho, G.T.S. Comparative analysis of Student’s live online learning readiness during the coronavirus (COVID-19) pandemic in the higher education sector. Comput. Educ. 2021, 168, 10421. [Google Scholar] [CrossRef]
  10. King, E.; Boyatt, R. Exploring factors that influence adoption of e-learning within higher education. Br. J. Educ. Technol. 2015, 46, 1272–1280. [Google Scholar] [CrossRef]
  11. Yakubu, M.N.; Dasuki, S.I. Factors affecting the adoption of e-learning technologies among higher education students in Nigeria: A structural equation modelling approach. Inf. Dev. 2019, 35, 492–502. [Google Scholar] [CrossRef]
  12. Karkar, A.; Fatlawi, H.K.; Al-Jobouri, A.A. Highlighting E-learning Adoption Challenges using data Analysis Techniques: University of Kufa as a Case Study. Electron. J. E-Learn. 2020, 18, 136–149. [Google Scholar] [CrossRef]
  13. Bao, W. COVID-19 and online teaching in higher education: A case study of Peking University. Hum. Behav. Emerg. Technol. 2020, 2, 113–115. [Google Scholar] [CrossRef] [PubMed] [Green Version]
  14. Ramos-Morcillo, A.J.; Leal-Costa, C.; Moral-García, J.E.; Ruzafa-Martínez, M. Experiences of Nursing Students during the Abrupt Change from Face-to-Face to e-Learning Education during the First Month of Confinement Due to COVID-19 in Spain. Int. J. Environ. Res. Public Health 2020, 17, 5519. [Google Scholar] [CrossRef]
  15. Rizun, M.; Strzelecki, A. Students’ Acceptance of the COVID-19 Impact on Shifting Higher Education to Distance Learning in Poland. Int. J. Environ. Res. Public Health 2020, 17, 6468. [Google Scholar] [CrossRef]
  16. Aboagye, E.; Yawson, J.A.; Appiah, K.N. COVID-19 and E-Learning: The Challenges of Students in Tertiary Institutions. Soc. Educ. Res. 2020. [CrossRef]
  17. Nichols, M. Institutional perspectives: The challenges of e-learning diffusion. Br. J. Educ. Technol. 2008, 39, 598–609. [Google Scholar] [CrossRef]
  18. Chitanana, L.; Makaza, D.; Madzima, K. The current state of e-learning at universities in Zimbabwe: Opportunities and challenges. Int. J. Educ. Dev. Using ICT 2008, 4, 5–15. [Google Scholar]
  19. Martins, J.T.; Nunes, M.B. Academics’ e-learning adoption in higher education institutions: A matter of trust. Learn. Organ. 2016, 23, 299–331. [Google Scholar] [CrossRef]
  20. Almaiah, M.A.; Al-Khasawneh, A.; Althunibat, A. Exploring the critical challenges and factors influencing the E-learning system usage during COVID-19 pandemic. Educ. Inf. Technol. 2020, 25, 5261–5280. [Google Scholar] [CrossRef]
  21. Zhang, Z.; Cao, T.; Shu, J.; Liu, H. Identifying key factors affecting college students’ adoption of the e-learning system in mandatory blended learning environments. Interact. Learn. Environ. 2020, 30, 1388–1401. [Google Scholar] [CrossRef]
  22. Lee, B.-C.; Yoon, J.-O.; Lee, I. Learners’ acceptance of e-learning in South Korea: Theories and results. Comput. Educ. 2009, 53, 1320–1329. [Google Scholar] [CrossRef]
  23. Biddix, J.P.; Chung, C.J.; Park, H.W. The hybrid shift: Evidencing a student-driven restructuring of the college classroom. Comput. Educ. 2015, 80, 162–175. [Google Scholar] [CrossRef]
  24. Kelly, T.M.; Bauer, D.K. Managing Intellectual Capital—via E-Learning—at Cisco. In Handbook on Knowledge Management: Knowledge Directions; Holsapple, C.W., Ed.; Springer: Berlin/Heidelberg, Germany, 2003; pp. 511–532. [Google Scholar] [CrossRef]
  25. Gunasekaran, A.; McNeil, R.D.; Shaul, D. E-learning: Research and applications. Ind. Commer. Train. 2002, 34, 44–53. [Google Scholar] [CrossRef]
  26. Watkins, R.; Leigh, D.; Triner, D. Assessing Readiness for E-Learning. Perform. Improv. Q. 2004, 17, 66–79. [Google Scholar] [CrossRef]
  27. Leijen, Ä.; Admiraal, W.; Wildschut, L.; Simons, P.R. Students’ perspectives on e-learning and the use of a virtual learning environment in dance education. Res. Dance Educ. 2008, 9, 147–162. [Google Scholar] [CrossRef]
  28. Zuvic-Butorac, M.; Roncevic, N.; Nemcanin, D.; Radojicic, Z. Blended E-Learning in Higher Education: Research on Students’ Perspective. Issues Informing Sci. Inf. Technol. 2011, 8, 409–429. [Google Scholar] [CrossRef]
  29. Al-Adwan, A.; Al-Adwan, A.; Smedley, J. Exploring students’ acceptance of e-learning using Technology Acceptance Model in Jordanian universities. Int. J. Educ. Dev. Using ICT 2013, 9, 4–18. [Google Scholar]
  30. Almaiah, M.A.; Jalil, M.A. Investigating Students’ Perceptions on Mobile Learning Services. Int. J. Interact. Mob. Technol. (IJIM) 2014, 8, 31. [Google Scholar] [CrossRef] [Green Version]
  31. Almaiah, M.A.; Alismaiel, O.A. Examination of factors influencing the use of mobile learning system: An empirical study. Educ. Inf. Technol. 2019, 24, 885–909. [Google Scholar] [CrossRef]
  32. Venkatesh, V.; Morris, M.G.; Davis, G.B.; Davis, F.D. User Acceptance of Information Technology: Toward a Unified View. MIS Q. 2003, 27, 425–478. [Google Scholar] [CrossRef] [Green Version]
  33. Padilla-Meléndez, A.; del Aguila-Obra, A.R.; Garrido-Moreno, A. Perceived playfulness, gender differences and technology acceptance model in a blended learning scenario. Comput. Educ. 2013, 63, 306–317. [Google Scholar] [CrossRef]
  34. Escobar-Rodríguez, T.; Monge-Lozano, P. The acceptance of Moodle technology by business administration students. Comput. Educ. 2012, 58, 1085–1093. [Google Scholar] [CrossRef]
  35. Sukendro, S.; Habibi, A.; Khaeruddin, K.; Indrayana, B.; Syahruddin, S.; Makadada, F.A.; Hakim, H. Using an extended Technology Acceptance Model to understand students’ use of e-learning during COVID-19: Indonesian sport science education context. Heliyon 2020, 6, e05410. [Google Scholar] [CrossRef]
  36. Mailizar, M.; Burg, D.; Maulina, S. Examining university students’ behavioural intention to use e-learning during the COVID-19 pandemic: An extended TAM model. Educ. Inf. Technol. 2021, 26, 7057–7077. [Google Scholar] [CrossRef] [PubMed]
  37. Fauzi, A.; Wandira, R.; Sepri, D.; Hafid, A. Exploring Students’ Acceptance of Google Classroom during the COVID-19 Pandemic by Using the Technology Acceptance Model in West Sumatera Universities. Electron. J. E-Learn. 2021, 19, 233–240. [Google Scholar] [CrossRef]
  38. Syahruddin, S.; Yaakob, M.F.M.; Rasyad, A.; Widodo, A.W.; Sukendro, S.; Suwardi, S.; Lani, A.; Sari, L.P.; Mansur, M.; Razali, R.; et al. Students’ acceptance to distance learning during COVID-19: The role of geographical areas among Indonesian sports science students. Heliyon 2021, 7, e08043. [Google Scholar] [CrossRef]
  39. Al-Maroof, R.; Alshurideh, M.; Salloum, S.; AlHamad, A.Q.M.; Gaber, T. Acceptance of Google Meet during the Spread of Coronavirus by Arab University Students. Informatics 2021, 8, 24. [Google Scholar] [CrossRef]
  40. Pal, D.; Vanijja, V. Perceived usability evaluation of Microsoft Teams as an online learning platform during COVID-19 using system usability scale and technology acceptance model in India. Child. Youth Serv. Rev. 2020, 119, 105535. [Google Scholar] [CrossRef] [PubMed]
  41. Hori, R.; Fujii, M. Impact of Using ICT for Learning Purposes on Self-Efficacy and Persistence: Evidence from Pisa 2018. Sustainability 2021, 13, 6463. [Google Scholar] [CrossRef]
  42. Sitar-Tăut, D. Mobile learning acceptance in social distancing during the COVID -19 outbreak: The mediation effect of hedonic motivation. Hum. Behav. Emerg. Technol. 2021, 3, 366–378. [Google Scholar] [CrossRef]
  43. Raman, A.; Thannimalai, R. Factors Impacting the Behavioural Intention to Use E- learning at Higher Education amid the COVID-19 Pandemic: UTAUT2 Model. Psychol. Sci. Educ. 2021, 26, 82–93. [Google Scholar] [CrossRef]
  44. Osei, H.V.; Kwateng, K.O.; Boateng, K.A. Integration of personality trait, motivation and UTAUT 2 to understand e-learning adoption in the era of COVID-19 pandemic. Educ. Inf. Technol. 2022, 27, 10705–10730. [Google Scholar] [CrossRef] [PubMed]
  45. Chatti, H.; Hadoussa, S. Factors Affecting the Adoption of E-Learning Technology by Students during the COVID-19 Quarantine Period: The Application of the UTAUT Model. Eng. Technol. Appl. Sci. Res. 2021, 11, 6993–7000. [Google Scholar] [CrossRef]
  46. Twum, K.K.; Ofori, D.; Keney, G.; Korang-Yeboah, B. Using the UTAUT, personal innovativeness and perceived financial cost to examine student’s intention to use E-learning. J. Sci. Technol. Policy Manag. 2021, 13, 713–737. [Google Scholar] [CrossRef]
  47. Cao, G.; Shaya, N.; Enyinda, C.; Abukhait, R.; Naboush, E. Students’ Relative Attitudes and Relative Intentions to Use E-Learning Systems. J. Inf. Technol. Educ. Res. 2022, 21, 115–136. [Google Scholar] [CrossRef] [PubMed]
  48. Qiao, P.; Zhu, X.; Guo, Y.; Sun, Y.; Qin, C. The Development and Adoption of Online Learning in Pre- and Post-COVID-19: Combination of Technological System Evolution Theory and Unified Theory of Acceptance and Use of Technology. J. Risk Financial Manag. 2021, 14, 162. [Google Scholar] [CrossRef]
  49. Malanga, A.C.M.; Bernardes, R.C.; Borini, F.M.; Pereira, R.M.; Rossetto, D.E. Towards integrating quality in theoretical models of acceptance: An extended proposed model applied to e-learning services. Br. J. Educ. Technol. 2022, 53, 8–22. [Google Scholar] [CrossRef]
  50. Terblanche, W.; Lubbe, I.; Papageorgiou, E.; van der Merwe, N. Acceptance of e-learning applications by accounting students in an online learning environment at residential universities. South Afr. J. Account. Res. 2022, 1–27. [Google Scholar] [CrossRef]
  51. Kosiba, J.P.B.; Odoom, R.; Boateng, H.; Twum, K.K.; Abdul-Hamid, I.K. Examining students’ satisfaction with online learning during the COVID-19 pandemic—An extended UTAUT2 approach. J. Furth. High. Educ. 2022, 1–18. [Google Scholar] [CrossRef]
  52. Abbad, M.M.M. Using the UTAUT model to understand students’ usage of e-learning systems in developing countries. Educ. Inf. Technol. 2021, 26, 7205–7224. [Google Scholar] [CrossRef]
  53. Xu, W.; Shen, Z.-Y.; Lin, S.-J.; Chen, J.-C. Improving the Behavioral Intention of Continuous Online Learning Among Learners in Higher Education During COVID-19. Front. Psychol. 2022, 13, 857709. [Google Scholar] [CrossRef] [PubMed]
  54. Raza, S.A.; Qazi, W.; Khan, K.A.; Salam, J. Social Isolation and Acceptance of the Learning Management System (LMS) in the time of COVID-19 Pandemic: An Expansion of the UTAUT Model. J. Educ. Comput. Res. 2021, 59, 183–208. [Google Scholar] [CrossRef]
  55. Edumadze, J.K.E.; Barfi, K.A.; Arkorful, V.; Baffour Jnr, N.O. Undergraduate student’s perception of using video conferencing tools under lockdown amidst COVID-19 pandemic in Ghana. Interact. Learn. Environ. 2022, 1. [Google Scholar] [CrossRef]
  56. Asvial, M.; Mayangsari, J.; Yudistriansyah, A. Behavioral Intention of e-Learning: A Case Study of Distance Learning at a Junior High School in Indonesia due to the COVID-19 Pandemic. Int. J. Technol. 2021, 12, 54–64. [Google Scholar] [CrossRef]
  57. Antoniadis, K.; Zafiropoulos, K.; Mitsiou, D. Measuring Distance Learning System Adoption in a Greek University during the Pandemic Using the UTAUT Model, Trust in Government, Perceived University Efficiency and Coronavirus Fear. Educ. Sci. 2022, 12, 625. [Google Scholar] [CrossRef]
  58. Tandon, U.; Mittal, A.; Bhandari, H.; Bansal, K. E-learning adoption by undergraduate architecture students: Facilitators and inhibitors. Eng. Constr. Arch. Manag. 2021, 29, 4287–4312. [Google Scholar] [CrossRef]
  59. Alwahaishi, S. Student Use of E-Learning During the Coronavirus Pandemic: An Extension of UTAUT to Trust and Perceived Risk. Int. J. Distance Educ. Technol. (IJDET) 2021, 19, 1–19. [Google Scholar] [CrossRef]
  60. Alghamdi, A.M.; Alsuhaymi, D.S.; Alghamdi, F.A.; Farhan, A.M.; Shehata, S.M.; Sakoury, M.M. University students’ behavioral intention and gender differences toward the acceptance of shifting regular field training courses to e-training courses. Educ. Inf. Technol. 2022, 27, 451–468. [Google Scholar] [CrossRef]
  61. Prasetyo, Y.; Roque, R.; Chuenyindee, T.; Young, M.; Diaz, J.; Persada, S.; Miraja, B.; Redi, A.P. Determining Factors Affecting the Acceptance of Medical Education eLearning Platforms during the COVID-19 Pandemic in the Philippines: UTAUT2 Approach. Healthcare 2021, 9, 780. [Google Scholar] [CrossRef]
  62. Hwang, Y. The moderating effects of gender on e-commerce systems adoption factors: An empirical investigation. Comput. Hum. Behav. 2010, 26, 1753–1760. [Google Scholar] [CrossRef]
  63. Zawacki-Richter, O.; Baecker, E.M.; Vogt, S. Review of distance education research (2000 to 2008): Analysis of research areas, methods, and authorship patterns. Int. Rev. Res. Open Distrib. Learn. 2009, 10, 21–50. [Google Scholar] [CrossRef] [Green Version]
  64. Bozkurt, A.; Akgun-Ozbek, E.; Yilmazel, S.; Erdogdu, E.; Ucar, H.; Guler, E.; Sezan, S.; Karadeniz, A.; Sen-Ersoy, N.; Goksel-Canbek, N.; et al. Trends in distance education research: A content analysis of journals 2009–2013. Int. Rev. Res. Open Distrib. Learn. 2015, 16, 330–363. [Google Scholar] [CrossRef]
  65. Sánchez-Chaparro, T.; Gómez-Frías, V.; González-Benito, Ó. Competitive implications of quality assurance processes in higher education. The case of higher education in engineering in France. Econ. Res. Ekon. Istraživanja 2020, 33, 2825–2843. [Google Scholar] [CrossRef]
  66. Saldaña, J. The Coding Manual for Qualitative Researchers; SAGE Publications: Thousand Oaks, CA, USA, 2021. [Google Scholar]
  67. Lin, H.; Lee, M.-H.; Liang, J.; Chang, H.; Huang, P.; Tsai, C. A review of using partial least square structural equation modeling in e-learning research. Br. J. Educ. Technol. 2020, 51, 1354–1372. [Google Scholar] [CrossRef]
  68. Barclay, D.; Higgins, C.; Thompson, R. The partial least squares (PLS) approach to ter adoption and use as an illustration. (Special Issue on Research Methodology). Technol. Stud. 1995, 2, 285–309. [Google Scholar]
  69. Cohen, J. Statistical Power Analysis. Curr. Dir. Psychol. Sci. 1992, 1, 98–101. [Google Scholar] [CrossRef]
  70. Faul, F.; Erdfelder, E.; Buchner, A.; Lang, A.-G. Statistical power analyses using G*Power 3.1: Tests for correlation and regression analyses. Behav. Res. Methods 2009, 41, 1149–1160. [Google Scholar] [CrossRef] [PubMed] [Green Version]
  71. Werts, C.E.; Linn, R.L.; Jöreskog, K.G. Intraclass Reliability Estimates: Testing Structural Assumptions. Educ. Psychol. Meas. 1974, 34, 25–33. [Google Scholar] [CrossRef]
  72. Dijkstra, T.K.; Henseler, J. Consistent Partial Least Squares Path Modeling. MIS Q. 2015, 39, 297–316. [Google Scholar] [CrossRef]
  73. Sarstedt, M.; Ringle, C.M.; Henseler, J.; Hair, J.F. On the Emancipation of PLS-SEM: A Commentary on Rigdon (2012). Long Range Plan. 2014, 47, 154–160. [Google Scholar] [CrossRef]
  74. Henseler, J.; Ringle, C.M.; Sarstedt, M. A new criterion for assessing discriminant validity in variance-based structural equation modeling. J. Acad. Mark. Sci. 2015, 43, 115–135. [Google Scholar] [CrossRef] [Green Version]
  75. Diamantopoulos, A. Formative indicators: Introduction to the special issue. J. Bus. Res. 2008, 61, 1201–1202. [Google Scholar] [CrossRef]
  76. Chin, W.W. The partial least squares approach to structural equation modeling. Mod. Methods Bus. Res. 1998, 295, 295–336. [Google Scholar]
  77. Hair, J.F., Jr.; Hult, G.T.M.; Ringle, C.; Sarstedt, M. A Primer on Partial Least Squares Structural Equation Modeling (PLS-SEM); Sage Publications: Thousand Oaks, CA, USA, 2014. [Google Scholar]
  78. Falk, R.F.; Miller, N.B. A Primer for Soft Modeling; The University of Akron: Akron, OH, USA, 1992. [Google Scholar]
  79. Elena, S.; Sánchez, M.P. Autonomy and governance models: Emerging paradoxes in Spanish universities. Perspective 2013, 17, 48–56. [Google Scholar]
Figure 1. UTAUT model. Source: Venkatesh (2003).
Education 13 00077 g001
Figure 2. The theoretical model of the acceptance of MS Teams technology by university students. Source: own elaboration.
Education 13 00077 g002
Figure 3. SmartPLS model. Load/weight values per indicator. Path coefficients between indicators. Within the R2 constructs. Source: own elaboration.
Education 13 00077 g003
Figure 4. SmartPLS model with validated hypotheses. Source: own elaboration.
Education 13 00077 g004
Figure 5. (A) SmartPLS model. MGA multigroup analysis. Public. Source: own elaboration. (B) SmartPLS model. MGA multigroup analysis. Private. Source: own elaboration. (C) SmartPLS model. MGA multigroup analysis. Men. Source: own elaboration. (D) SmartPLS model. MGA multigroup analysis. Women. Source: own elaboration.
Education 13 00077 g005aEducation 13 00077 g005b
Figure 6. Path diagrams for different university engineering schools. The brackets indicate the number of respondents from each school. Not included is Road Engineering, with only 2 responses.
Education 13 00077 g006
Table 1. Reflective measurement system. Source: own elaboration.
Construct
Indicators
ReliabilityConvergent ValidityDiscriminant Validity
Cronbach’s AlphaComposite ReliabilityConsistent ReliabilityLoadsIndicator CommonalityAVEHTMTHTMT Interval Excluding 1
0.6–0.90.6–0.90.6–0.9>0.7>0.5>0.5<0.9
BIBI10.8440.8430.8440.8110.6580.643YesYes
BI20.7700.593
BI30.8220.676
UBBO10.5140.8431.3690.2830.0800.788YesYes
BO21.2231.495
EEEE10.8380.8390.8460.8010.6420.637YesYes
EE20.7160.513
EE30.8690.755
PEPE10.7990.8010.8050.7470.5580.574YesYes
PE20.8210.674
PE30.6990.489
Table 2. (A). Measurement system for reflective indicators. Discriminant validity. Cross-load analysis. Source: own elaboration. (B) Measurement system for reflective indicators. Discriminant validity. Fornell–Larcker criterion. Source: own elaboration.
(A)BIEEFCPEPUPSIUB
BI10.8110.3520.1890.4970.1970.6160.125
BI20.7700.2780.2080.4620.2490.5800.144
BI30.8220.2280.2140.4550.2580.6260.182
BO10.0280.0360.0890.1010.1090.0820.283
BO20.2360.1570.1040.1370.0270.1691.223
EE10.2800.7850.2820.4180.2840.2160.125
EE20.2560.7190.2180.3910.2680.2280.063
EE30.3140.8820.2400.3700.2310.2110.116
SI10.2570.2120.1740.3160.2350.3380.203
SI20.4510.1160.1170.3030.1420.5950.151
SI30.7390.2700.1490.4310.2530.9750.116
(B)BIEEFCPEPUPSIUB
BI0.801
EE0.3560.798
FC0.2540.308
PE0.5880.4900.3390.758
PUP0.2930.3240.3220.573
SI0.7580.2720.1650.4600.265
UB0.1880.1280.0970.1240.0400.1460.888
Table 3. Reflective measurement system. Convergent validity. Collinearity (VIF). Relevance and significance. Source: own elaboration.
ConstructorIndicatorExternal WeightExternal LoadVIFt-Valuep-Value95% Confidence IntervalSignificance (p > 0.05)
SISI10.0520.3381.1030.7950.427[−0.077, 0.181]No
SI20.2280.5951.2303.5320.000[0.097, 0.350]Yes
SI30.9680.9751.24118.3030.000[0.772, 0.955]Yes
Table 4. Significance of the indicators for the group’s University and Gender. Mann–Whitney U test. Source: own elaboration.
Tests Statistics UniversityTests Statistics Gender
Univ.NMean RangeRange SumMann-Whitney USignif.GenderNMean RangeRange SumMann-Whitney USignif.
BO2Public249168.4441,941.0010,816.0000.022Women165180.7629,826.0013,734.0000.050
Private97186.4918,090.00Men181166.8830,205.00
PE1Public249172.2742,896.0011,771.0000.705Women165178.2029,402.5014,157.5000.388
Private97176.6517,135.00Men181169.2230,628.50
PE2Public249172.2042,878.5011,753.5000.685Women165176.3329,095.0014,465.0000.598
Private97176.8317,152.50Men181170.9230,936.00
PE3Public249169.5042,205.5011,080.5000.219Women165164.1627,087.0013,392.0000.087
Private97183.7717,825.50Men181182.0132,944.00
EE1Public249174.2443,386.0011,892.0000.810Women165182.6430,135.0013,425.0000.077
Private97171.6016,645.00Men181165.1729,896.00
EE2Public249175.4743,691.5011,586.5000.531Women165170.5528,141.5014,446.5000.576
Private97168.4516,339.50Men181176.1931,889.50
EE3Public249177.5744,214.5011,063.5000.166Women165175.8829,021.0014,539.0000.628
Private97163.0615,816.50Men181171.3331,010.00
PUPGPublic249173.3943,173.0012,048.0000.972Women165167.4727,633.0013,938.0000.272
Private97173.7916,858.00Men181178.9932,398.00
FCGPublic249153.8138,299.507174.5000.000Women165180.4029,766.0013,794.0000.211
Private97224.0421,731.50Men181167.2130,265.00
SI1Public249159.4239,695.008570.0000.000Women165188.8231,154.5012,405.5000.004
Private97209.6520,336.00Men181159.5428,876.50
SI2Public249168.7542,018.0010,893.0000.147Women165187.9731,015.0012,545.0000.009
Private97185.7018,013.00Men181160.3129,016.00
SI3Public249172.7943,025.5011,900.5000.827Women165176.7529,164.5014,395.5000.549
Private97175.3117,005.50Men181170.5330,866.50
BI1Public249187.6846,733.008545.0000.000Women165180.0129,701.0013,859.0000.230
Private97137.0913,298.00Men181167.5730,330.00
BI2Public249177.2644,137.0011,141.0000.248Women165180.4429,772.0013,788.0000.204
Private97163.8615,894.00Men181167.1830,259.00
BI3Public249167.57110,599.0000.070Women165178.3029,419.5014,140.5000.382
Private97188.732Men181169.1230,611.50
Table 5. Kursaal-Wallis non-parametric test for the multigroup variable “School”.
Ind.QuestionAsymptotic SignificanceSignificance
BO2Please tell us again how often you have used Teams during the COVID-19 pandemic. 0.004 Yes
PE1Teams enables me to improve my time management. 0.536 No
PE2Teams helps me achieve the objectives of the course. 0.119 No
PE3By using Teams, I improve my chances of getting a good grade in this course. 0.214 No
EE1Teams is easy to use. 0.753 No
EE2Teams can be used by anyone, with no need for specific training. 0.829 No
EE3I adapted quickly to using Teams. 0.445 No
PUPGOverall, I consider Teams a useful tool for the professor. 0.006 Yes
FCGThe resources provided by the university have enabled me to easily adapt to online classes. 0.000 Yes
SI1The professor advocates the use of Teams for class work. 0.003 Yes
SI2My classmates have encouraged and helped me to use Teams. 0.228 No
SI3Teams is a tool that professionals in my sector recommend. 0.323 No
BI1I intend to use Teams on a daily basis.0.001Yes
BI2I plan to use Teams regularly. 0.279 No
BI3I find Teams’ functions useful and will continue to use them. 0.082 No
Table 6. Structural measurement system. Collinearity analysis. VIF. Source: own elaboration.
BIEEFCPEPUPSIUB
BI 1.069
EE1.361
FC1.165 1.069
PE1.622
PUP 1.000
SI1.273
UB
Table 7. Structural measurement system. Significance and relevance of construct paths. Source: own elaboration.
HypothesisPathOriginal Sample (O)Sample
Mean (M)
Biasp-Value2.5%97.5%Sig.
p < 0.05?
H1PE -> BI0.2120.211000.1280.302Yes
H1.1PUP -> PE0.5180.518000.4260.597Yes
H2EE -> BI0.0710.0740.0030.078–0.010.147No
H3SI -> BI0.6020.6030.00100.5160.675Yes
H4FC -> BI–0.11–0.1090.0010.001–0.178−0.044Yes
H5FC -> UB0.0440.043−0.0010.377–0.0580.141No
H6BI -> UB0.2180.218000.1030.325Yes
Table 8. Structural measurement system. Predictive ability. Source: own elaboration.
R-SquaredAdjusted R-Squared
BI0.6600.657
PE0.3300.328
UB0.0550.053
Table 9. Structural measurement system. Effect size (f2). Source: own elaboration.
BIFCPEPUPSIUB
BI 0.059
FC0.04
PE0.211
PUP 0.493
SI0.917
Table 10. MGA multigroup analysis. Public/Private university. Men/Women. Bootstrapping. Significance. Source: own elaboration.
Public/Private UniversityMen/Women
Differences between. Opposed CategoriesPath Coefficient t-Valuep-ValueSignificance
p < 0.05?
Differences between. Opposed CategoriesPath Coefficient t-Valuep-ValueSignificance
p < 0.05?
BI -> UB0.0760.6140.54NoBI -> UB0.0760.6140.54No
FC -> BI−0.0851.1160.265NoFC -> BI−0.0851.1160.265No
PE -> BI0.0590.5270.598NoPE -> BI0.0590.5270.598No
PUP -> PE−0.1071.1530.25NoPUP -> PE−0.1071.1530.25No
SI -> BI−0.0350.3680.713NoSI -> BI−0.0350.3680.713No
Table 11. Summary of significant differences by group for each indicator. Source: own elaboration.
ConstructIndicatorSignificant Difference
GenderUniv (pub/priv)School
UBBO2YesYesYes
FCFCGNoYesYes
SISI1YesYesYes
SISI2YesNoNo
BIBI1NoNoYes
PUPPUPGNoNoYes
Table 12. Summary of predictive ability and path indicators by groups. Source: own elaboration.
DataR2BIR2UBR2PEPath
PE -> BISI -> BIBI -> UBFC -> BIPUP -> PE
Global0.6600.0550.3300.3010.6310.236−0.1170.574
Private0.5000.0160.1490.3080.5290.125−0.0930.386
Public0.7180.0760.4130.3120.6540.276−0.0760.642
Women0.6350.0340.4050.2660.6500.185−0.0720.636
Men0.6880.0680.2800.3260.6150.261−0.1570.529
Disclaimer/Publisher’s Note: The statements, opinions and data contained in all publications are solely those of the individual author(s) and contributor(s) and not of MDPI and/or the editor(s). MDPI and/or the editor(s) disclaim responsibility for any injury to people or property resulting from any ideas, methods, instructions or products referred to in the content.

