


How Does Simulation Contribute to Prospective Mathematics Teachers’ Learning Experiences and Results?
Abstract
:1. Introduction
1.1. Simulation as a Tool
1.2. The Use of Simulation in Distance Education
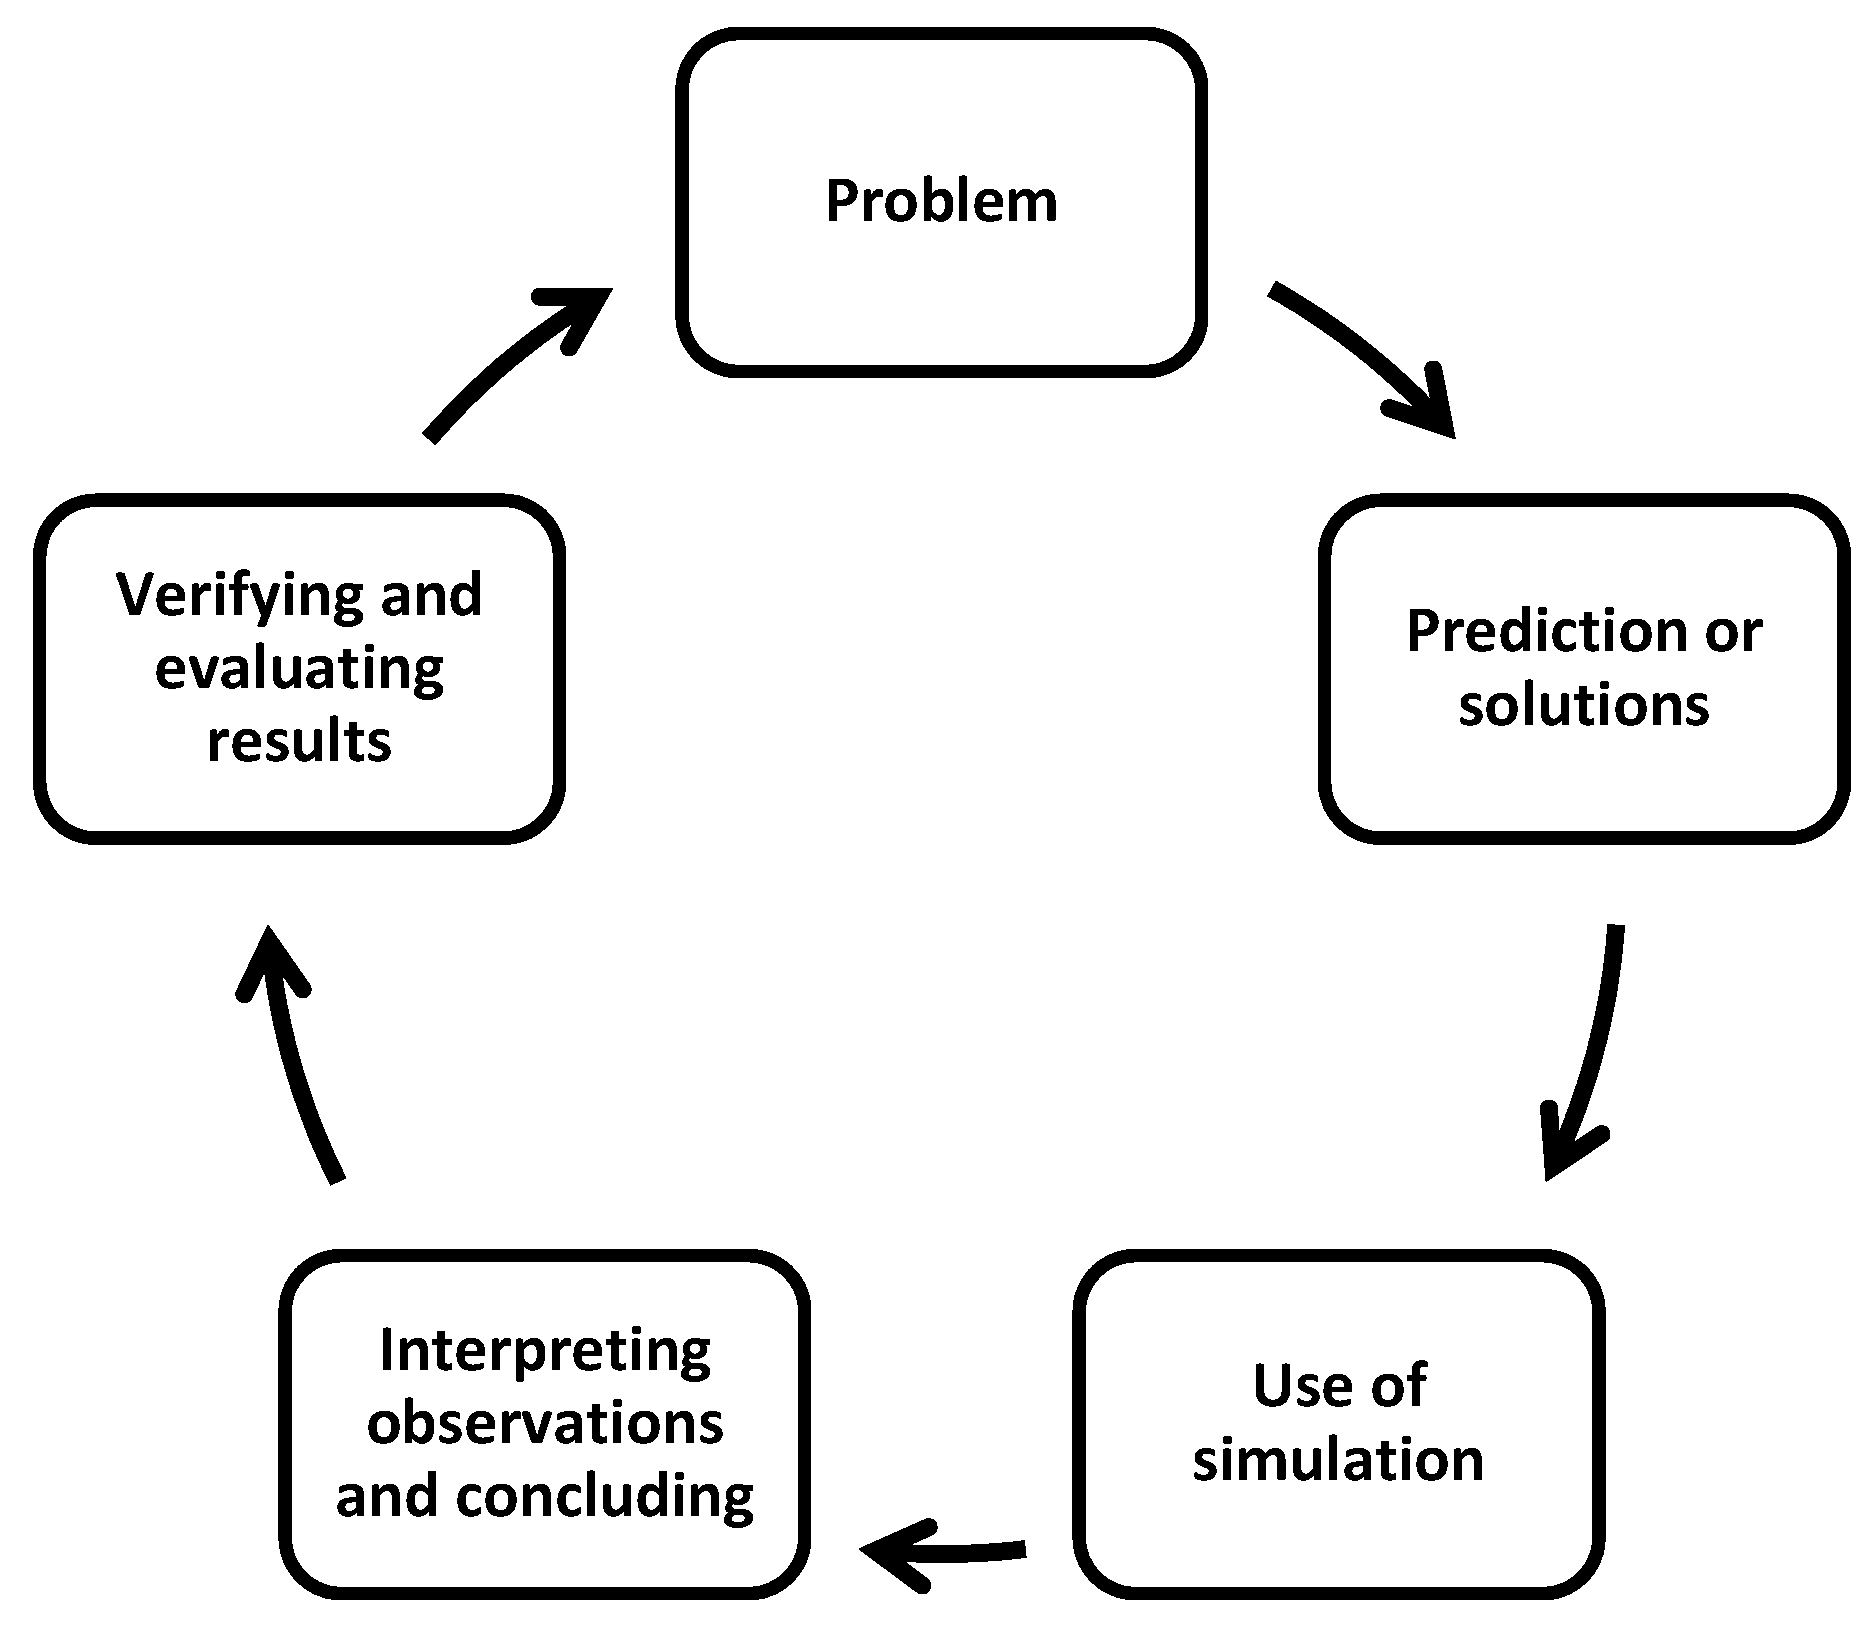
1.3. Theoretical Framework
1.4. Research Questions
2. Methods
2.1. Working Group
2.2. Data Collection Tools
2.3. Data Analysis
2.4. Application Process
3. Results
3.1. The Findings Obtained from the First Research Problem
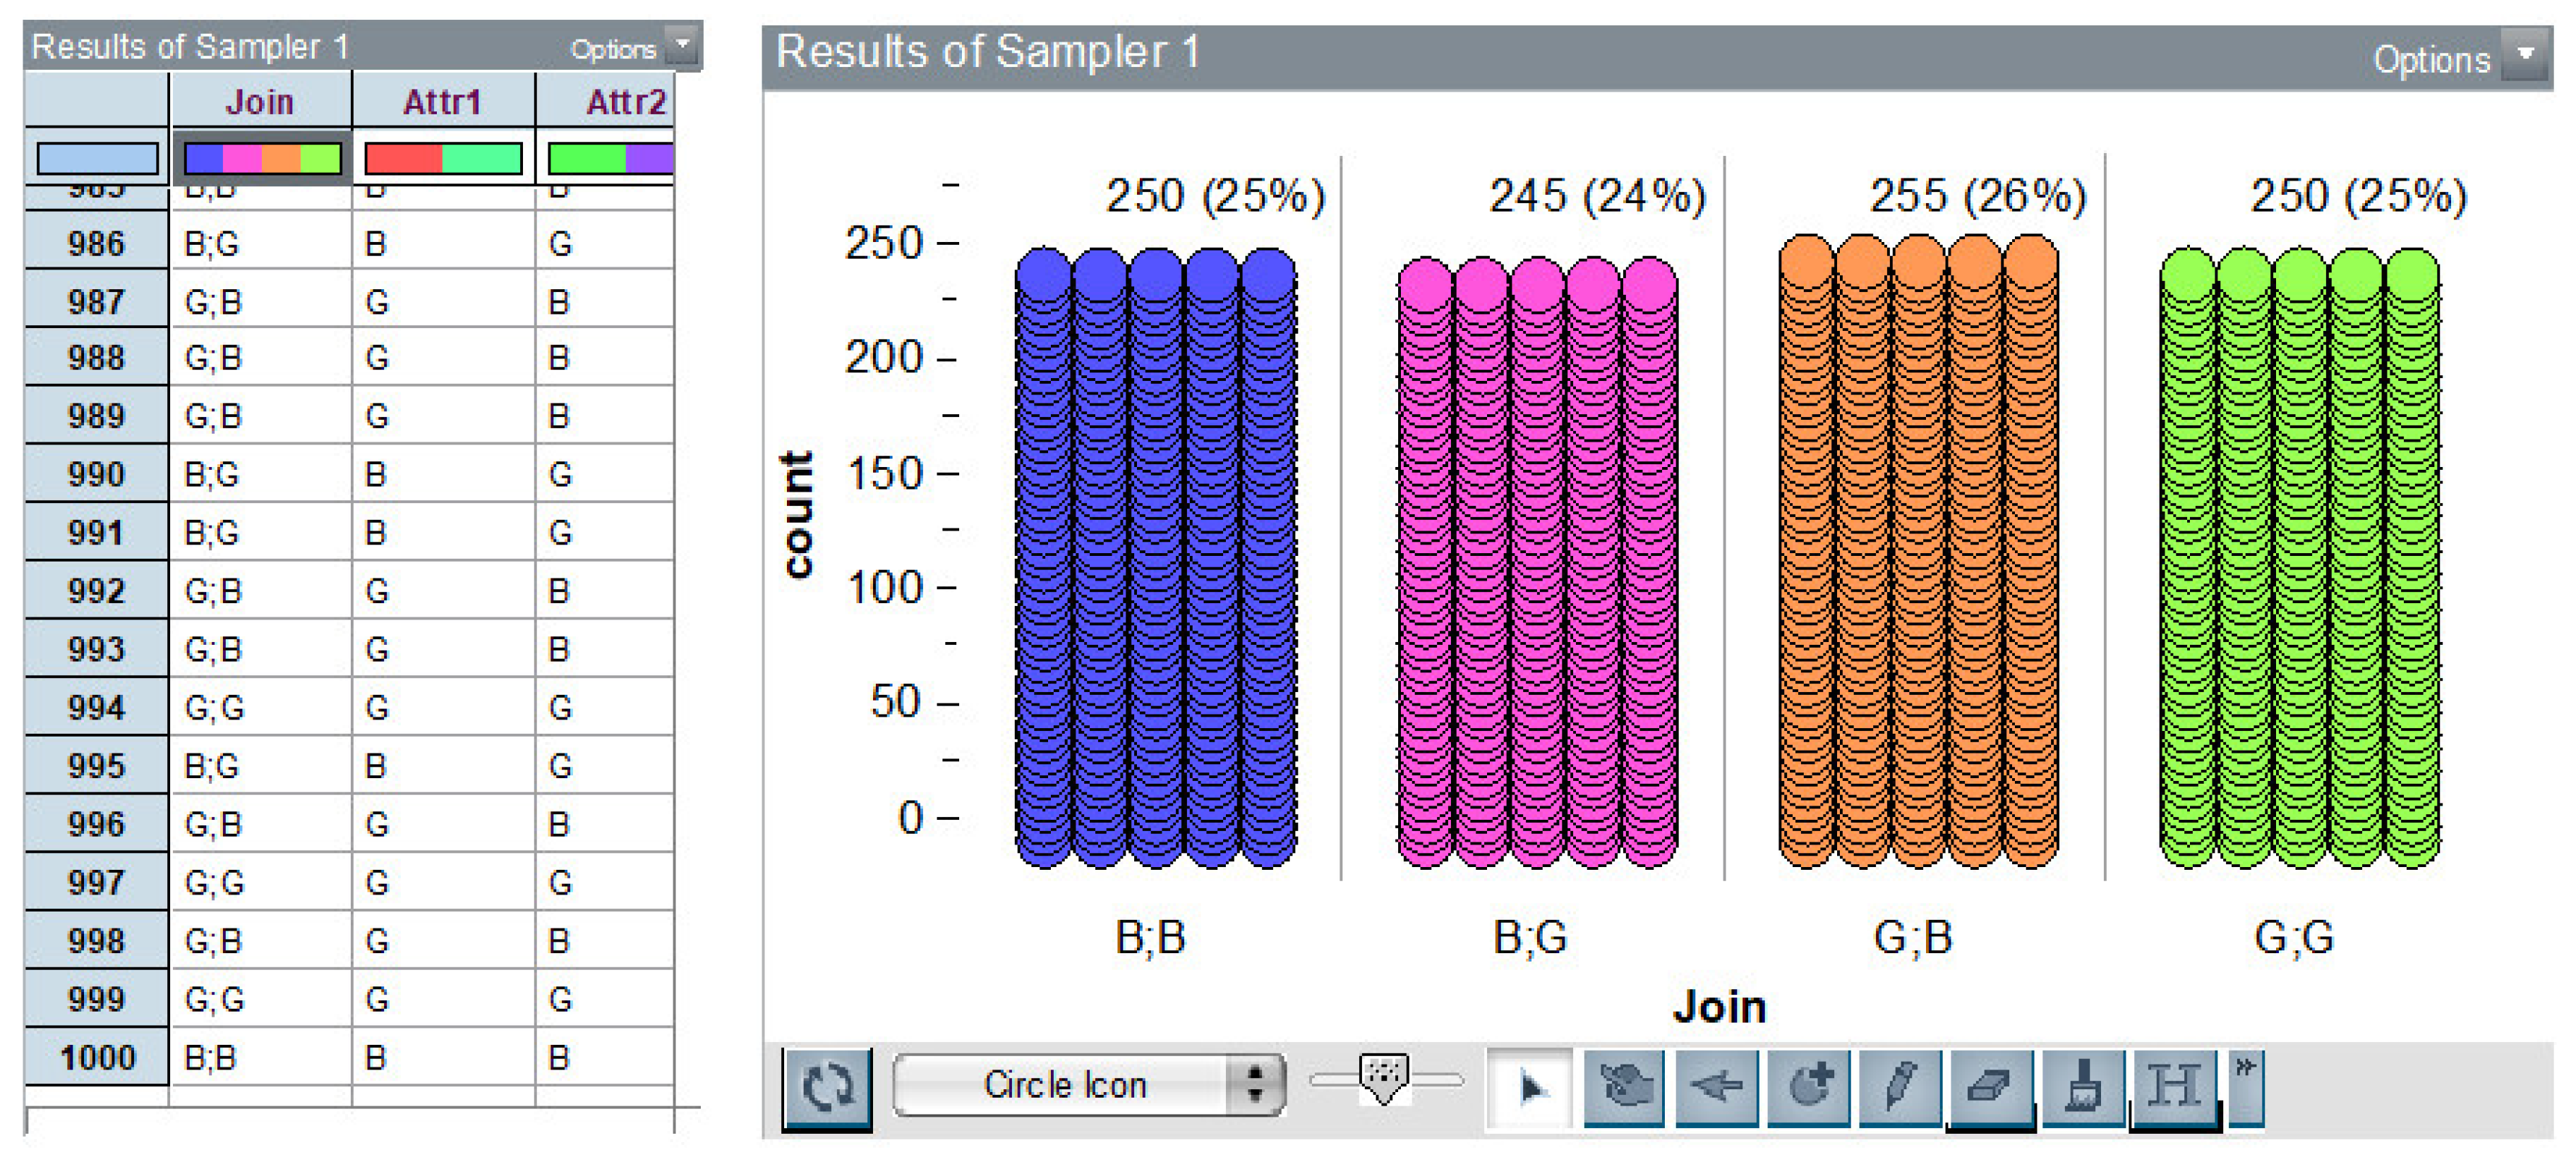
3.1.1. Problem 1
Predictions or Solutions to the Problem
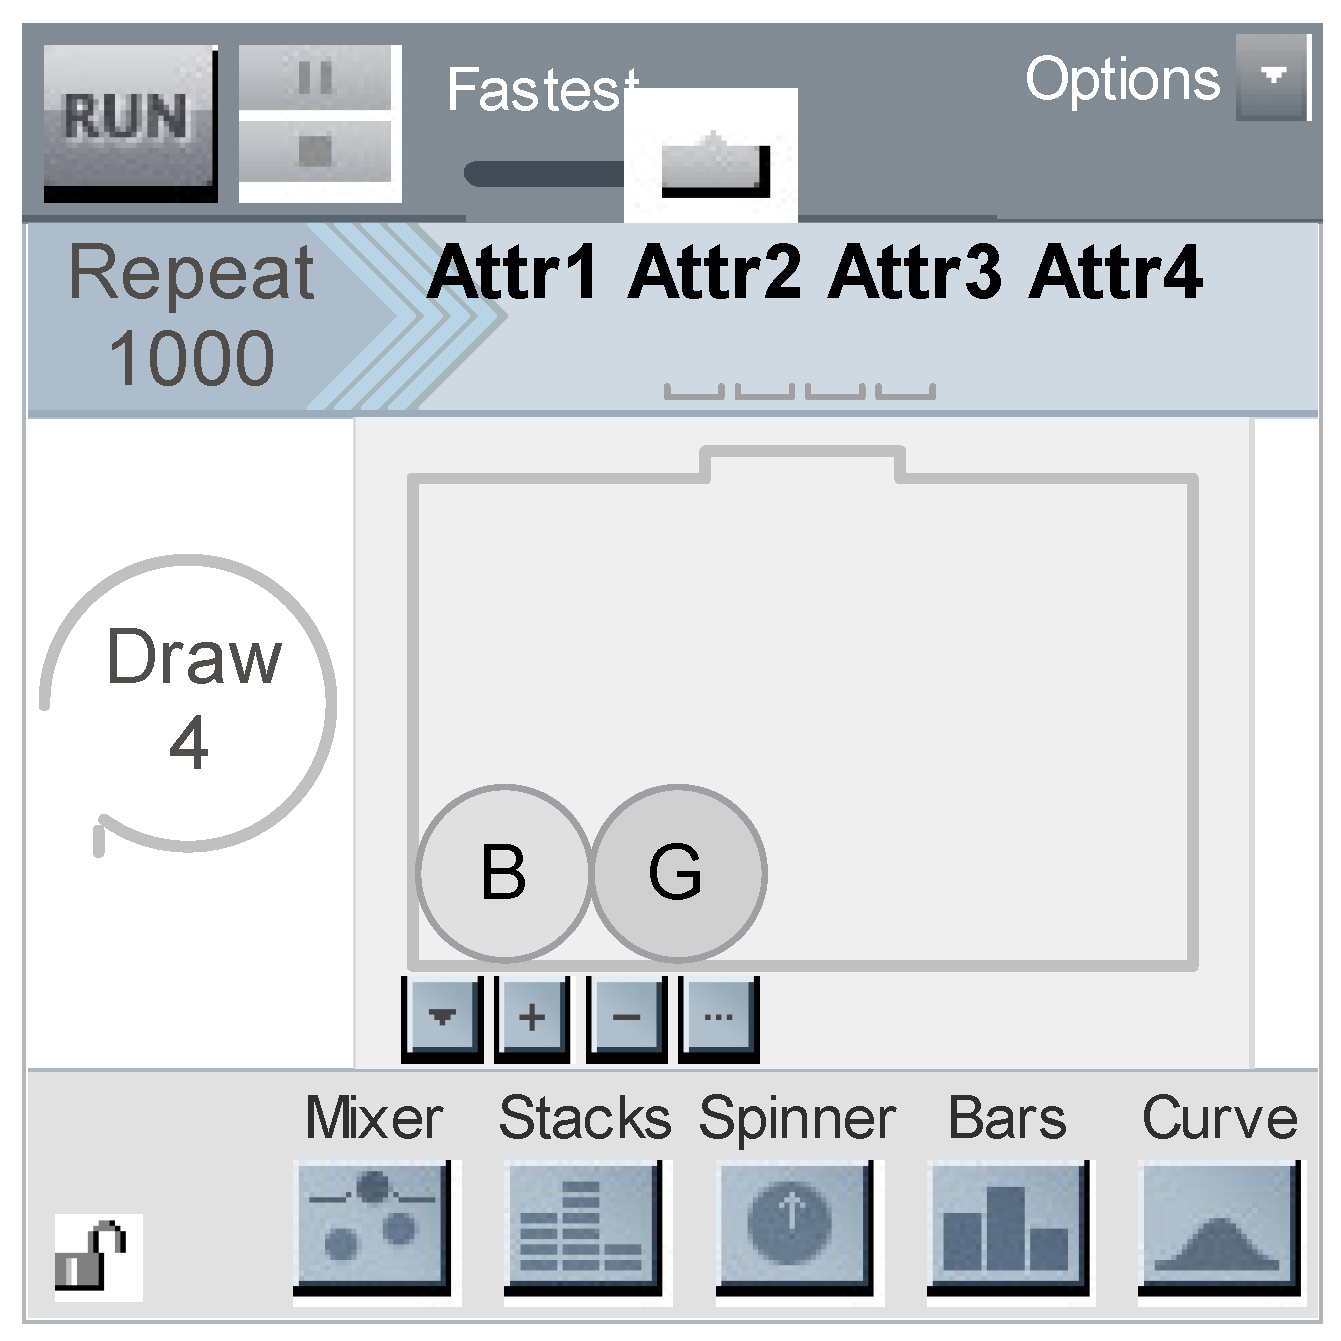
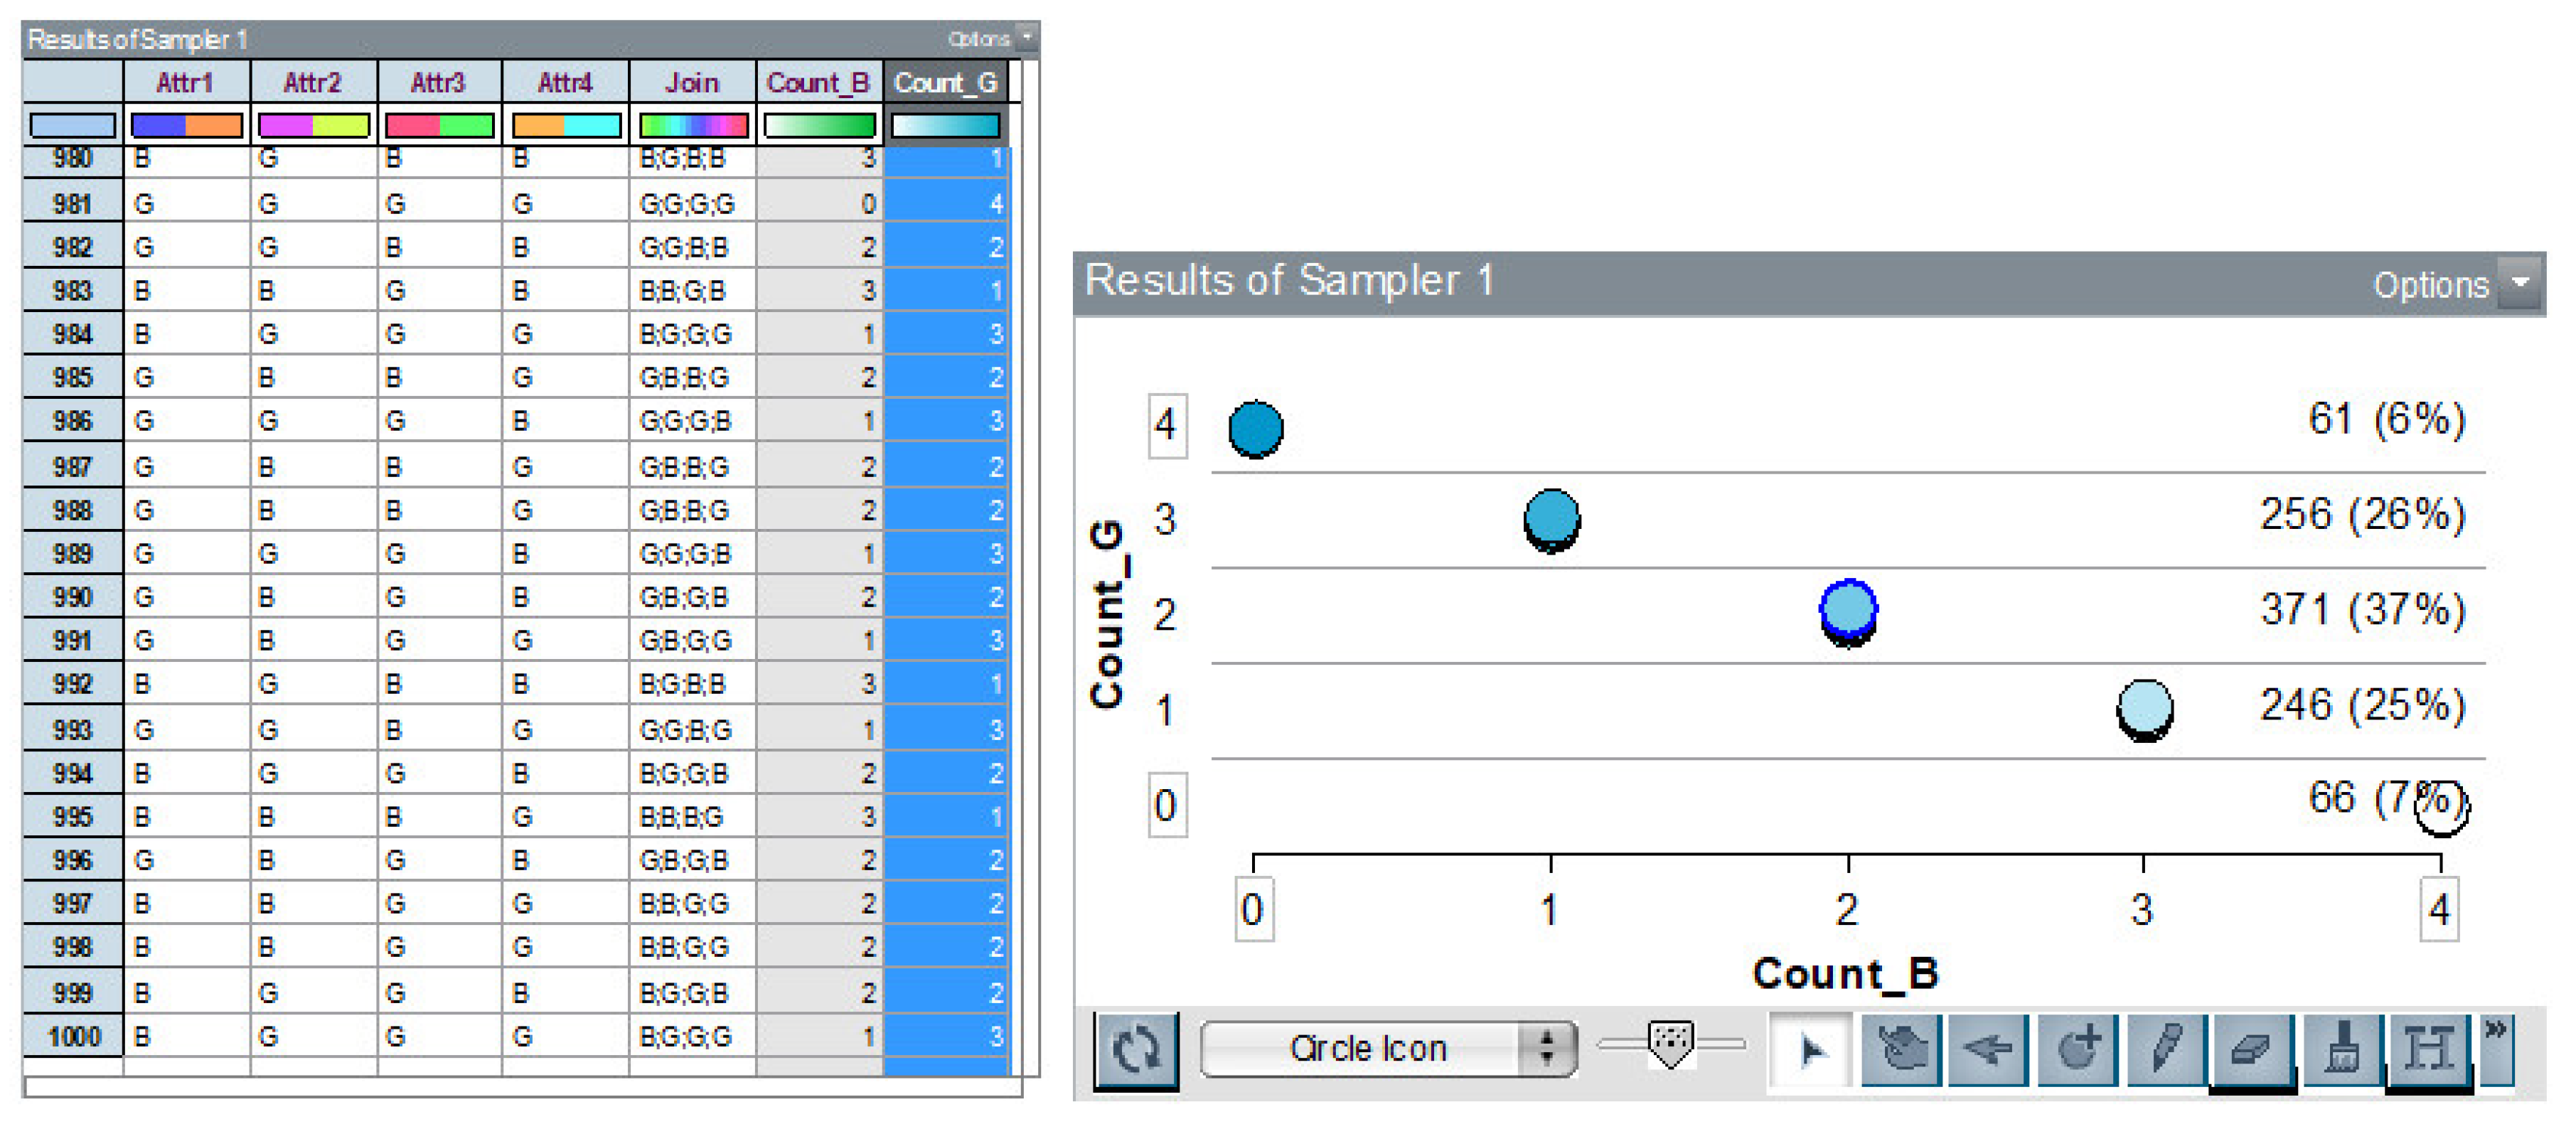
Use of Simulation
Interpreting Observations and Concluding
Verifying and Evaluating Results
3.1.2. Problem 2
Predictions or Solutions to the Problem
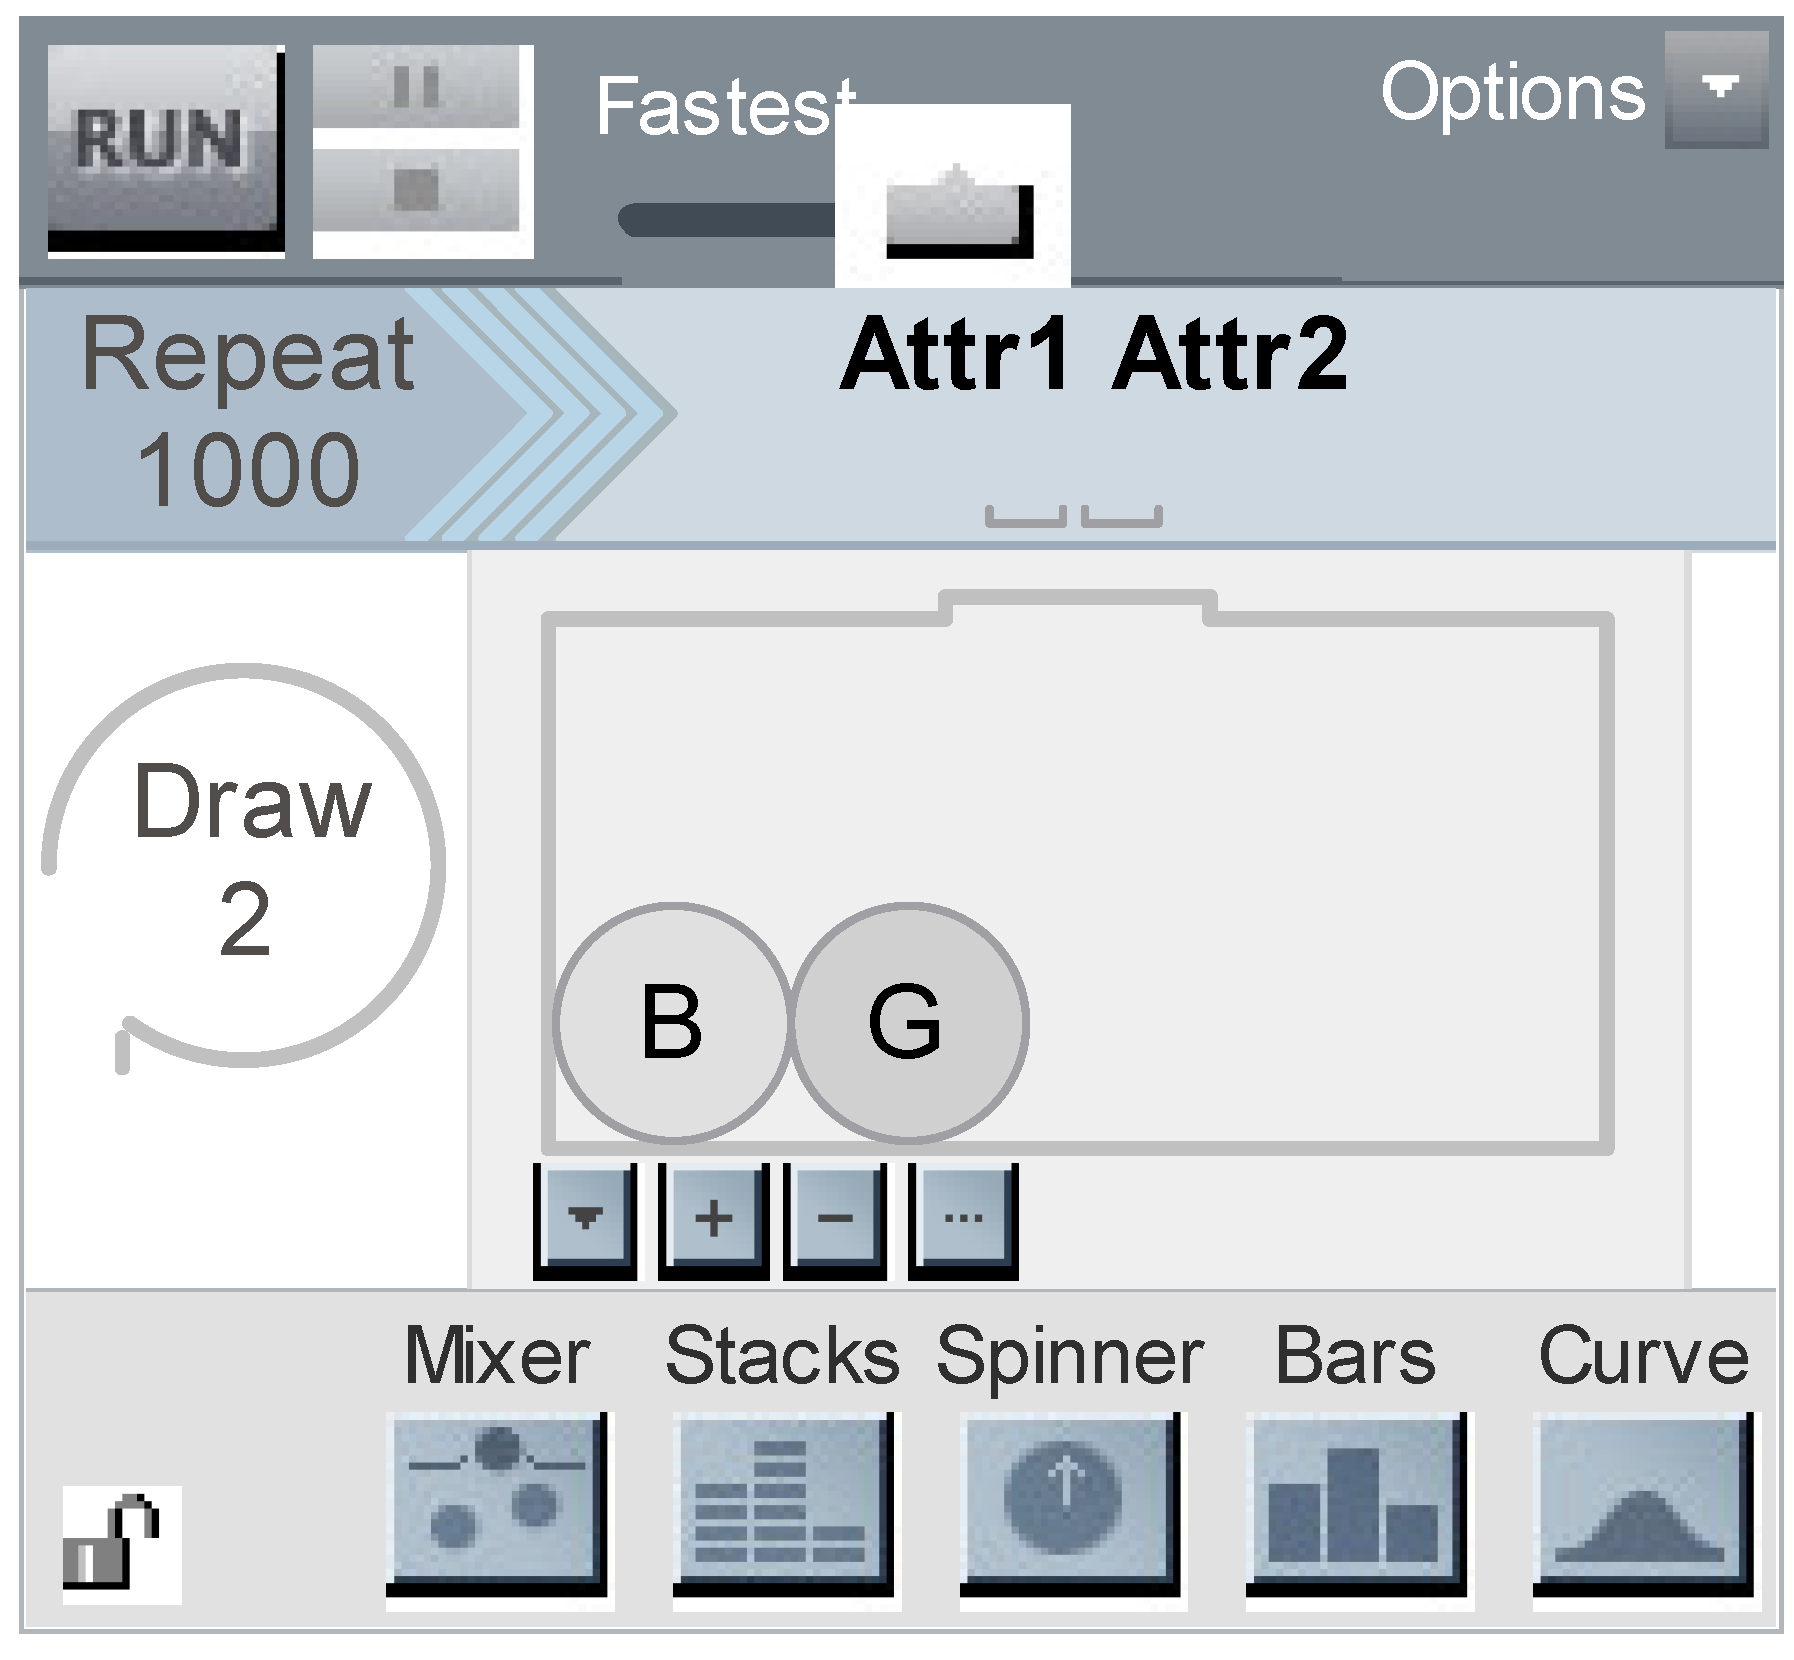
Use of Simulation
Interpreting Observations and Concluding
Verifying and Evaluating Results
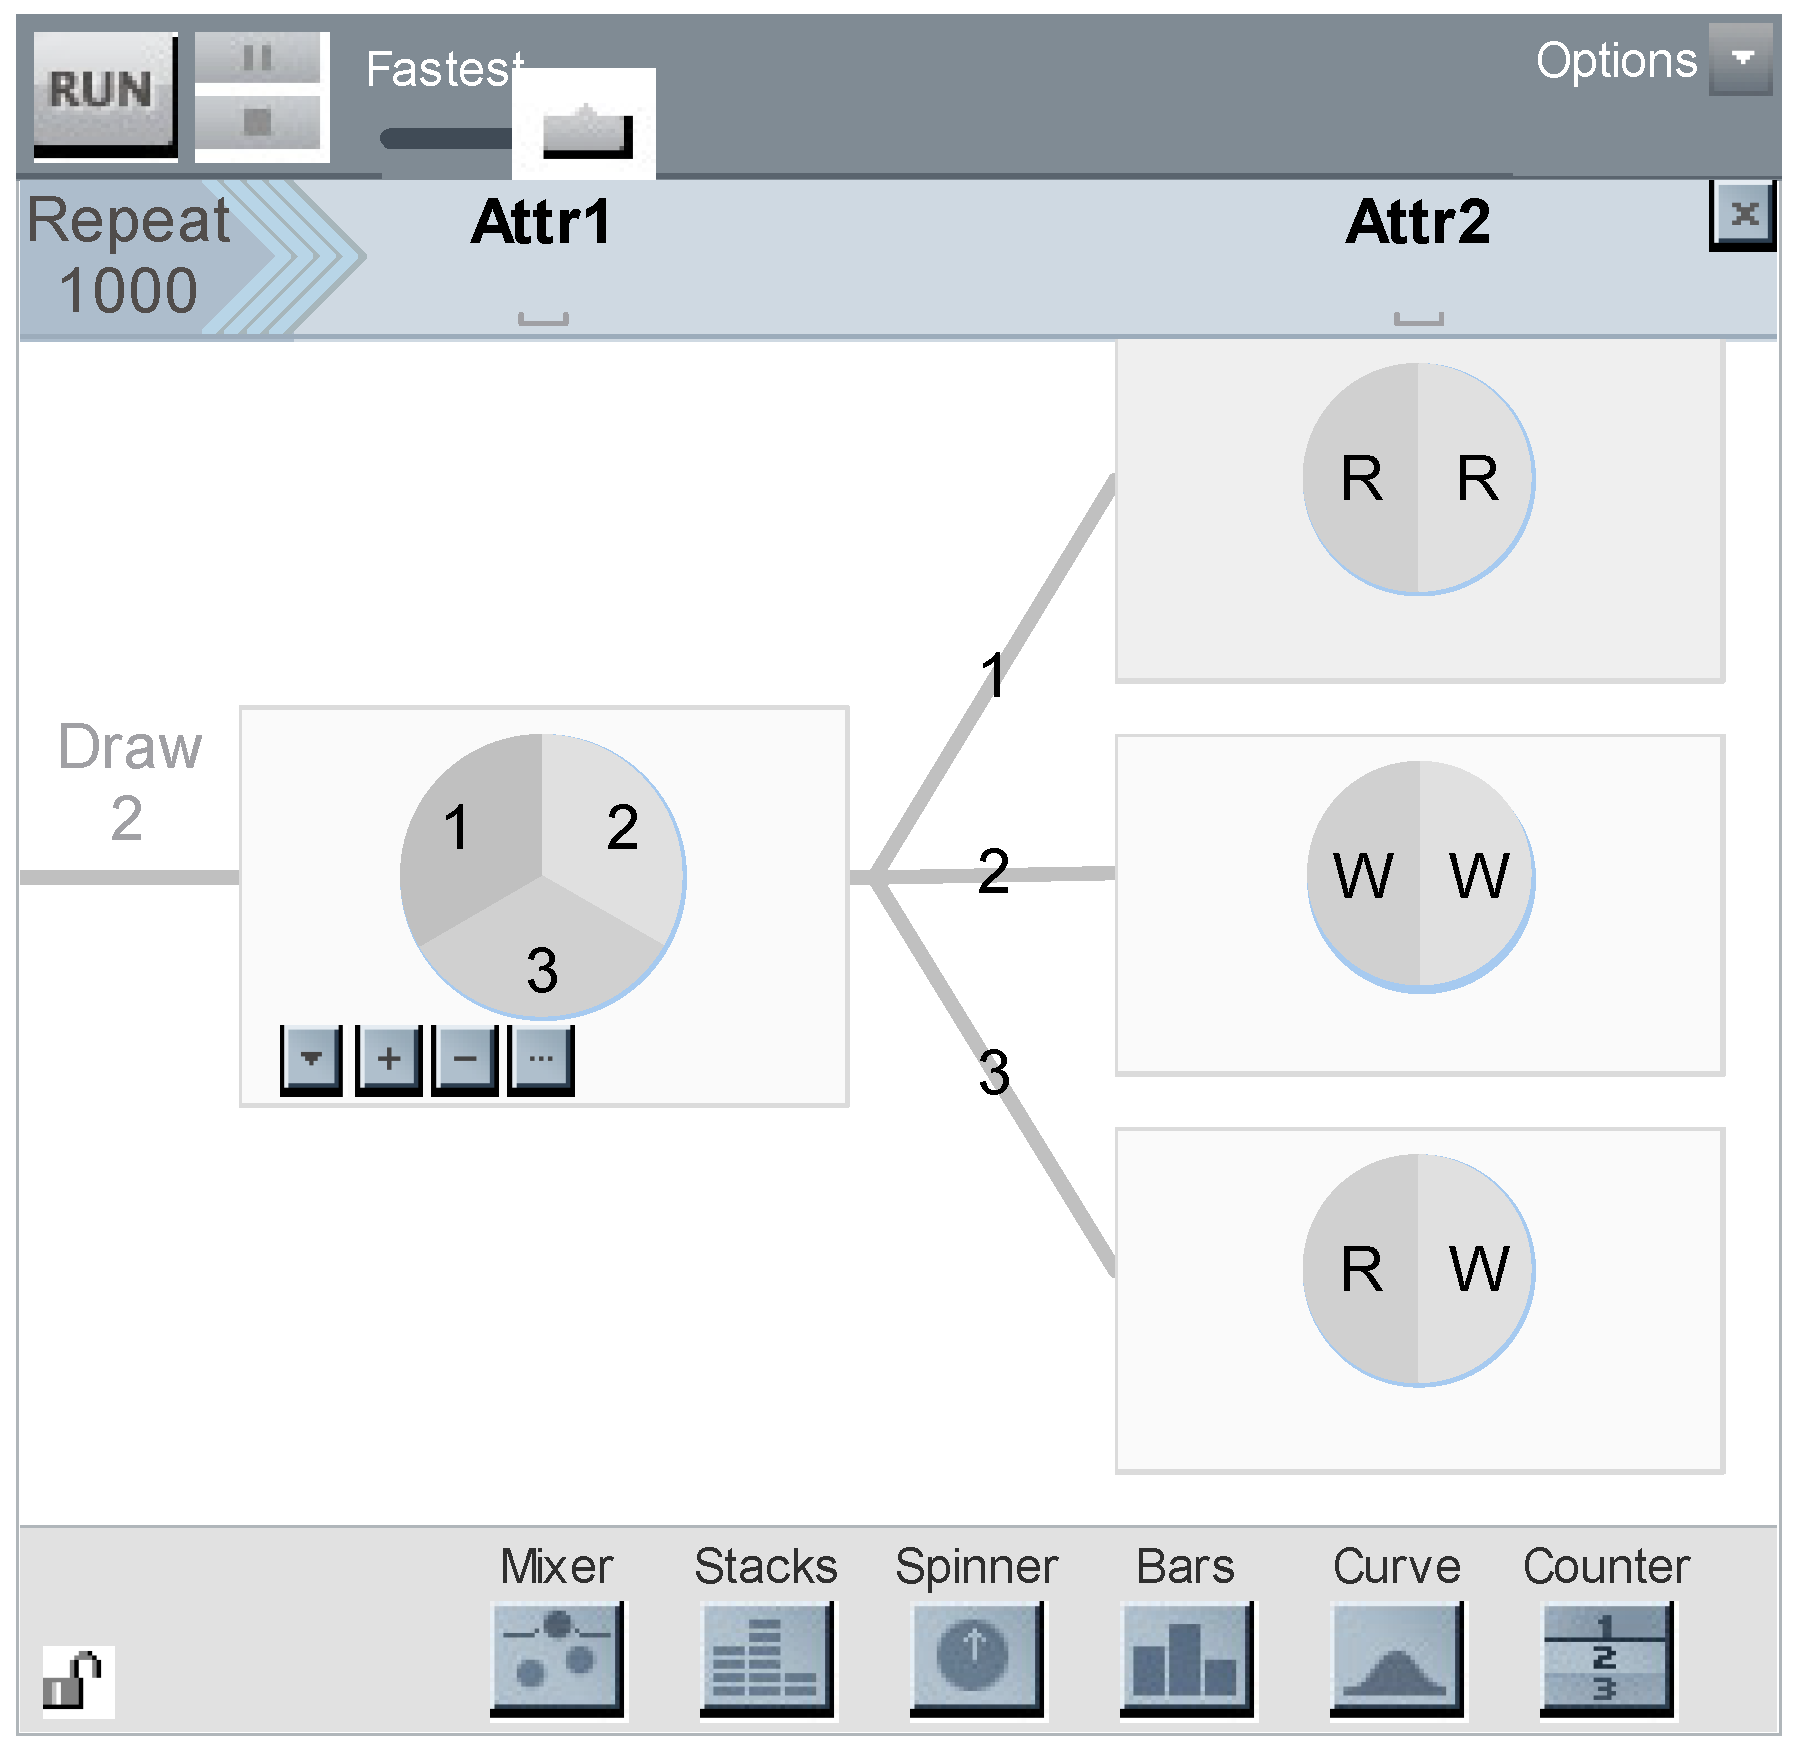
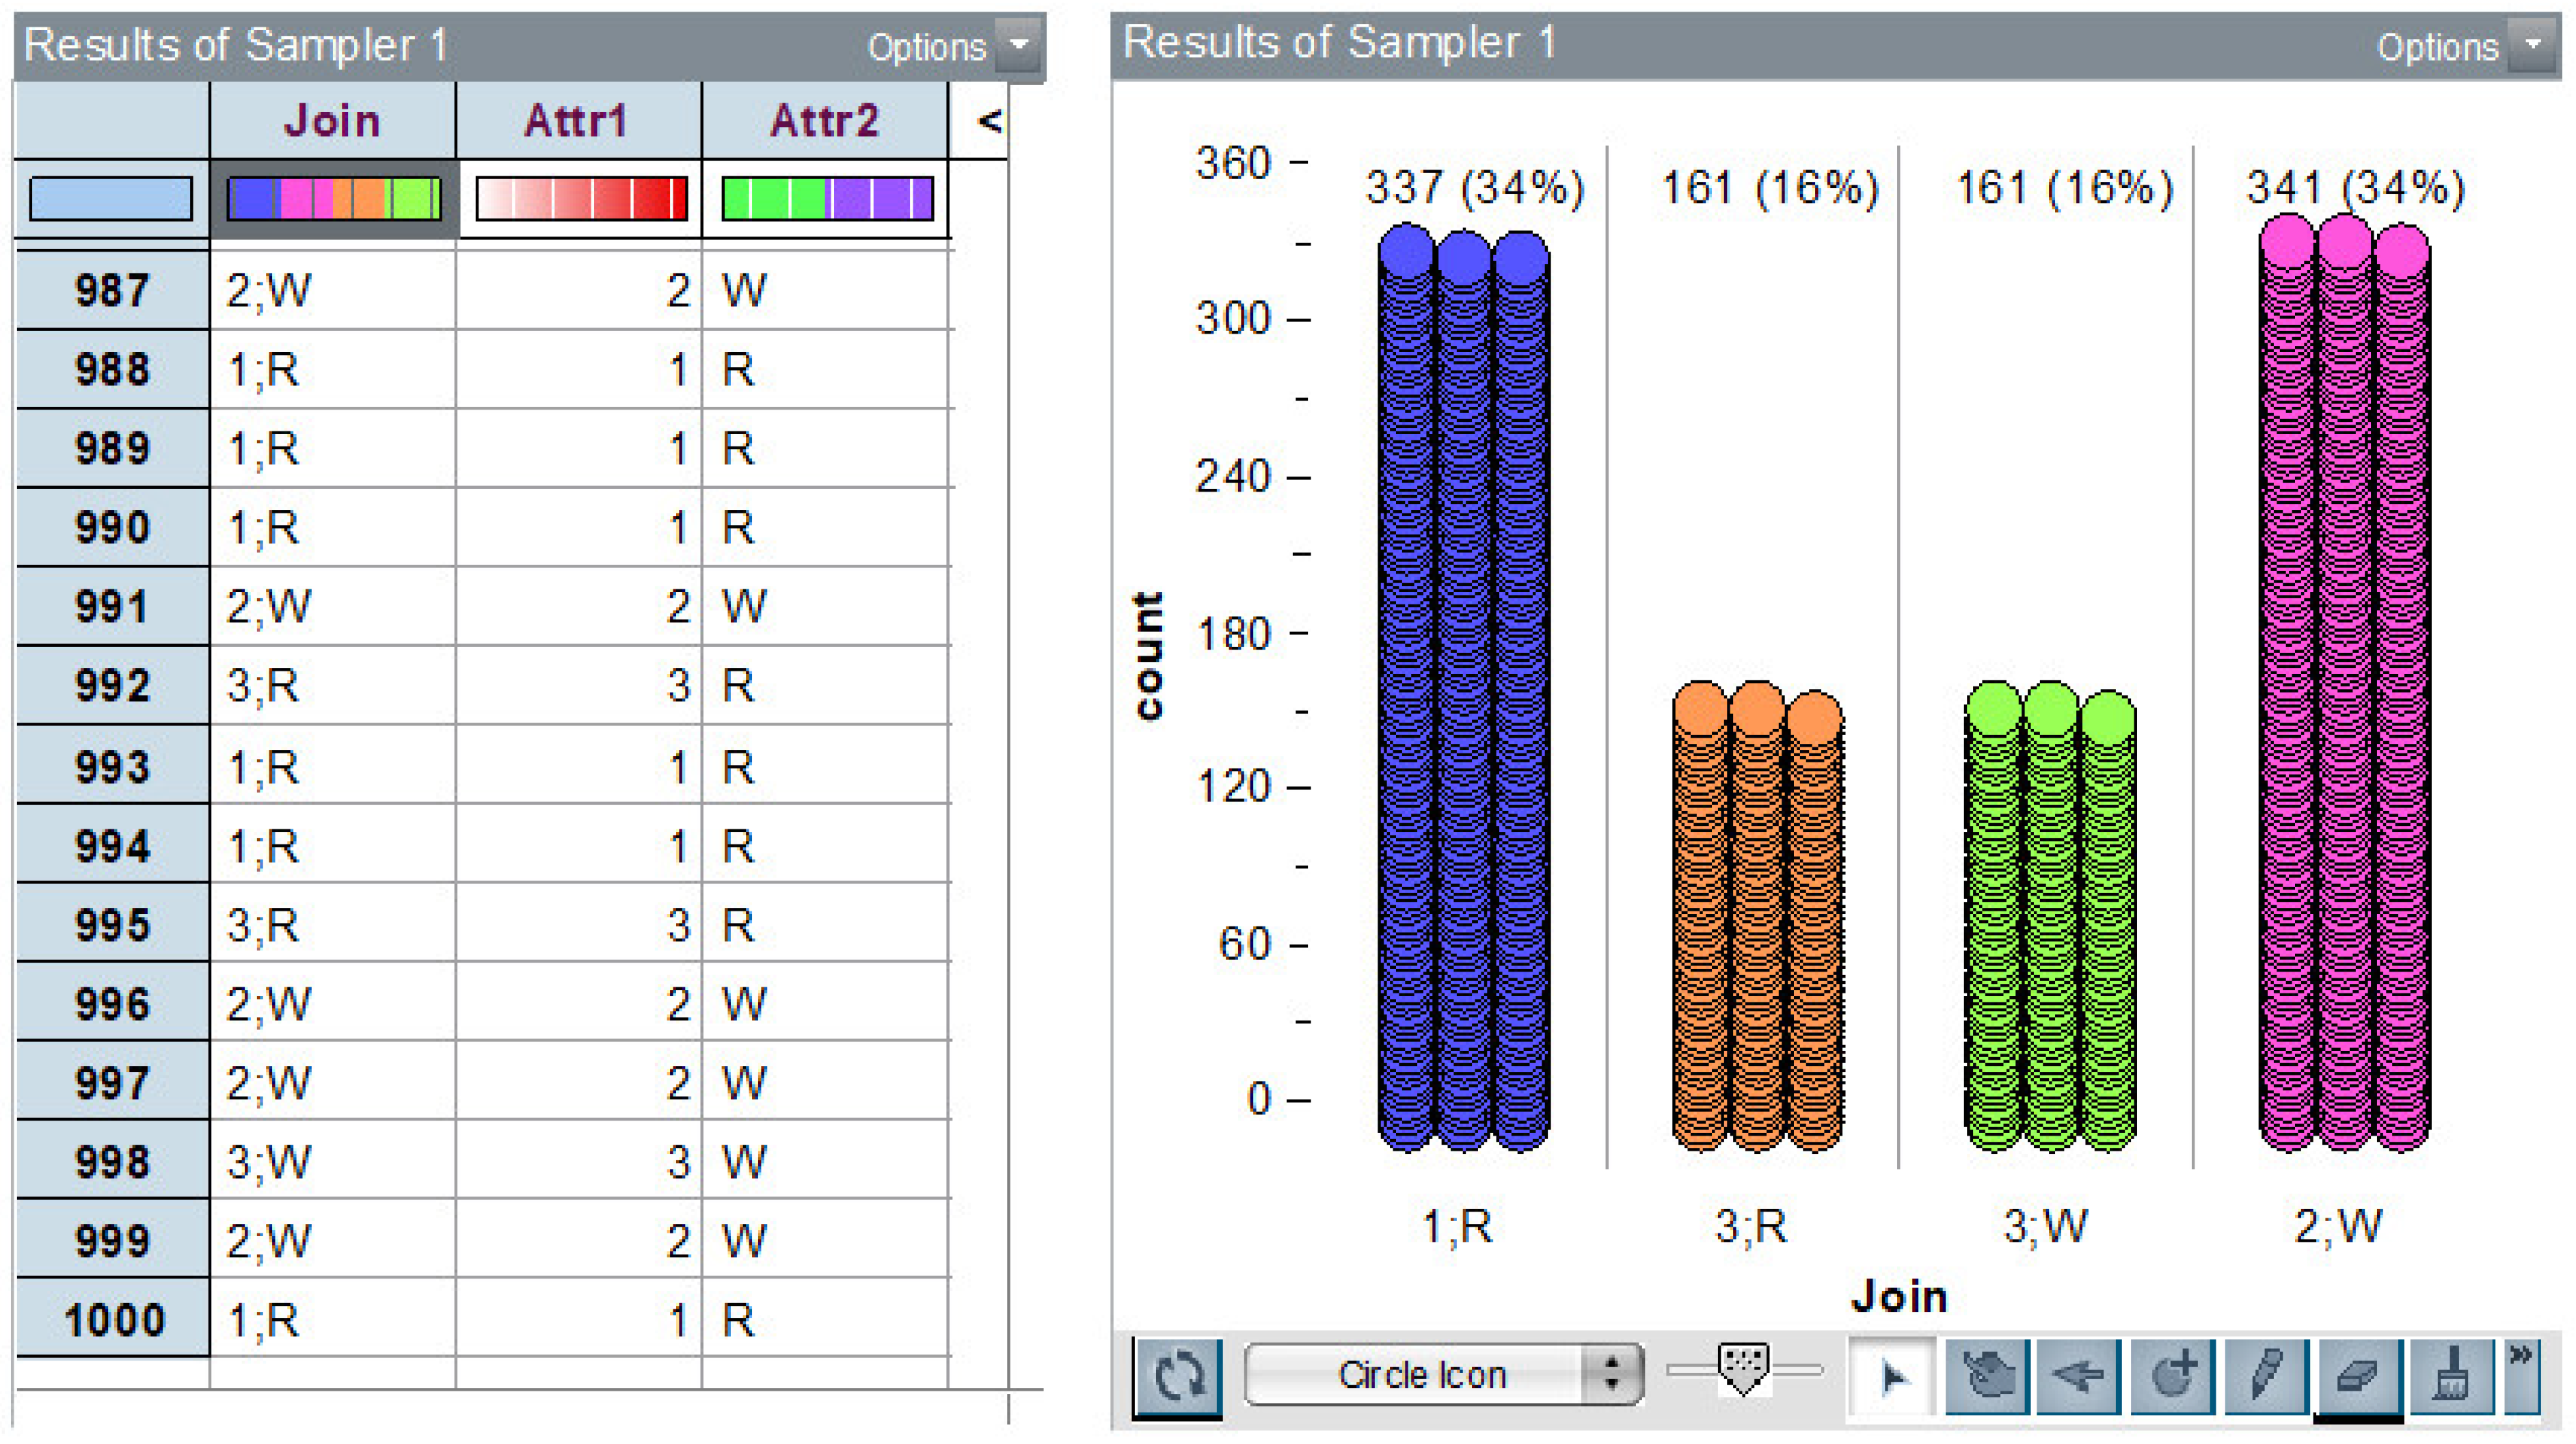
3.1.3. Problem 3
Predictions or Solutions to the Problem
Use of Simulation
Interpreting Observations and Concluding
Verifying and Evaluating Results
3.2. The Results Obtained from the Second Research Problem
4. Discussion
5. Conclusions and Suggestions
Funding
Institutional Review Board Statement
Informed Consent Statement
Data Availability Statement
Conflicts of Interest
References
- The Standing Conference of the Ministers of Education and Cultural Affairs (KMK). In Education in a Digital World; Strategy of the KMK; KMK: Bonn, Germany, 2017.
- Koparan, T. Teaching Game and Simulation-Based Probability. Int. J. Assess. Tools Educ. 2019, 6, 235–258. [Google Scholar] [CrossRef]
- delMas, R.; Garfield, J.; Chance, B. Assessing the effects of a computer microworld on statistical reasoning. J. Stat. Educ. 1999, 7, 1084–1090. [Google Scholar]
- Koparan, T. Difficulties in learning and teaching statistics: Teacher views. Int. J. Math. Educ. Sci. Technol. 2015, 46, 94–104. [Google Scholar] [CrossRef]
- Lane, D.M.; Tang, Z. Effectiveness of simulation training on transfer of statistical concepts. J. Educ. Comput. Res. 2000, 22, 383–396. [Google Scholar] [CrossRef]
- Mills, J. Using computer simulation methods to teach statistics: A review of the literature. J. Stat. Educ. 2002, 10, 1–20. [Google Scholar]
- Hawkins, A. Training Teachers to Teach Statistics; International Statistical Institute: Voorburg, The Netherlands, 1990. [Google Scholar]
- Fischbein, E.; Schnarch, D. The Evolution With Age Of Probabilistic, Intuitively Based Misconceptions. Educ. Stud. Math. 1997, 29, 97–105. [Google Scholar] [CrossRef]
- Borovcnik, M.; Kapadia, R. Research and developments in probability education. Int. Electron. J. Math. 2009, 4, 111–130. [Google Scholar] [CrossRef]
- Batanero, C.; Henry, M.; Parzysz, B. The nature of chance and probability. In Exploring Probability in School: Challenges for Teaching and Learning; Jones, G., Ed.; Springer: New York, NY, USA, 2005; pp. 15–37. [Google Scholar]
- Carver, R.; Everson, R.; Gabrosek, J.; Horton, N.; Lock, R.; Mocko, M.; Rossman, A.; Holmes, G.; Velleman, P.; Witmer, J.; et al. Guidelines for Assessment and Instruction in Statistics Education College Report. 2016. Available online: http://www.amstat.org/education/gaise (accessed on 12 July 2019).
- Koparan, T. Using Simulation as a Problem Solving Method in Dice Problems. Br. J. Educ. Soc. Behav. Sci. 2016, 18, 1–16. [Google Scholar]
- Jones, G.A.; Langrall, C.W.; Mooney, E.S. Research in probability: Responding to classroom realities. In Second Handbook of Research on Mathematics Teaching and Learning; Lester, F.K., Ed.; NCTM: Reston, VA, USA, 2007; pp. 909–955. [Google Scholar]
- Koparan, T.; Kaleli Yılmaz, G. The Effect of Simulation-Based Learning on Prospective Teachers’ Inference Skills in Teaching Probability. Univers. J. Educ. Res. 2015, 3, 775–786. [Google Scholar] [CrossRef]
- Koparan, T.; Taylan Koparan, E. Empirical Approaches to Probability Problems: An Action Research. Eur. J. Educ. Stud. 2019, 5, 100–117. [Google Scholar]
- Konold, C.; Harradine, A.; Kazak, S. Understanding distributions by modelling them. Int. J. Comput. Math. Learn. 2007, 12, 217–230. [Google Scholar] [CrossRef]
- Maxara, C.; Biehler, R. Constructing Stochastic Simulations with a Computer Tool-Students’ Competencies and Difficulties. In Proceedings of the Fifth Congress of the European Society for Research in Mathematics Education, Larnaca, Cyprus, 22–26 February 2007; University of Cypress: Nicosia City, Cyprus, 2007; pp. 1–13. Available online: http://www.ermeweb.free.fr/CERME%205/WG5/5_Maxara.pdf (accessed on 21 February 2015).
- Novak, E. Effects of simulation-based learning on students’ statistical factual, conceptual and application knowledge. J. Comput. Assist. Learn. 2014, 30, 148–158. [Google Scholar] [CrossRef]
- Lajoie, S.P.; Sharon, S.J. (Eds.) Computers as Cognitive Tools; Lawrence Erlbaum Associates: New York, NJ, USA, 1993. [Google Scholar]
- Batanero, C.; Godino, J. Estocástica y su Didáctica para Maestros [Stochastics and its Teaching for Teachers]. Proyecto Edumat-Maestros, Granada, Universidad de Granada. 2002. Available online: https://www.ugr.es/~jgodino/edumat-maestros/manual/6_Estocastica.pdf (accessed on 10 April 2022).
- Biehler, R. Computers in probability education. In Chance Encounters: Probability in Education; Kapadia, R., Borovcnik, M., Eds.; Kluwer: Dordrecht, NL, USA, 1991. [Google Scholar]
- Konold, C.; Miller, C. TinkerPlots™ Dynamic Data Exploration 1.0; Key Curriculum Press: Emeryville, CA, USA, 2004. [Google Scholar]
- Çekmez, E. An example of the use of GeoGebra for simulation: Buffon’s needle problem. Int. J. Math. Educ. Sci. Technol. 2022, 1–19. Available online: https://www.tandfonline.com/doi/abs/10.1080/0020739X.2022.2034063 (accessed on 10 April 2022).
- Koparan, T. The impact of a game and simulation-based probability learning environment on the achievement and attitudes of prospective teachers. Int. J. Math. Educ. Sci. Technol. 2021. [Google Scholar] [CrossRef]
- Bentley, P.J.; Meek, V.L. Development and Future Directions of Higher Degree Research Training in Australia. In Doctoral Education for the Knowledge Society; Knowledge Studies in Higher Education; Shin, J., Kehm, B., Jones, G., Eds.; Springer: Cham, Switzerland, 2018; pp. 123–146. [Google Scholar]
- Lavonen, J.; Henning, E.; Petersen, N.; Loukomies, A.; Myllyviita, A. A Comparison of Student Teacher Learning from Practice in University-affiliated Schools in Helsinki and Johannesburg. Eur. J. Teach. Educ. 2018, 42, 4–18. [Google Scholar] [CrossRef] [Green Version]
- Hawkins, A. Myth-Conceptions! In Research on the Role of Technology in Teaching and Learning Statistics; Garfield, J.B., Burril, G., Eds.; International Statistical Institute: Voorburg, The Netherlands, 1996. [Google Scholar]
- Merriam, S.B. Qualitative Research and Case Study Applications in Education; Jossey-Bass: San Francisco, CA, USA, 1998. [Google Scholar]
- Yıldırım, A.; Şimşek, H. Sosyal Bilimlerde Nitel Araştırma Yöntemleri. In Qualitative Research Methods in the Social Sciences; Seçkin Publ: Ankara, Turkey, 2008. [Google Scholar]
- Johnson, R.B.; Christensen, L.B. Educational Research: Quantitative, Qualitative and Mixed Approaches, 3rd ed.; Sage Publications, Inc.: Lose Angeles, CA, USA, 2008. [Google Scholar]
- Yin, R.K. Case Study Research: Design and Methods; Sage: Thousand Oaks, CA, USA, 2009. [Google Scholar]
- Demirci, Ö.; Özkaya, M.; Konyalıoğlu, A. Öğretmen Adaylarının Olasılık Konusuna İlişkin Hata Yaklaşımları. Erzincan Üniversitesi Eğitim Fakültesi Derg. 2017, 19, 153–172. [Google Scholar]
- Kazak, S. Olasılık konusu öğrencilere neden zor gelmektedir? In İlköğretimde Karşılaşılan Matematiksel Zorluklar ve Çözüm Önerileri içinde; Bingölbali, E., Özmantar, v.M.F., Eds.; Pegem Akademi: Ankara, Turkey, 2014; pp. 217–239. [Google Scholar]
- Liu, K. Creating a Dialogic Space for Prospective Teachers Critical Reflection and Transformative Learning. Reflective Pract. 2017, 18, 805–820. [Google Scholar] [CrossRef]
- Butvilofsky, S.A.; Escamilla, K.; Soltero-González, L.; Aragon, L. Promoting Reflective Teaching through Simulation in a Study in Mexico Program. J. Hisp. High. Educ. 2012, 11, 197–212. [Google Scholar] [CrossRef]
- Manburg, J.; Moore RGriffin, D.; Seperson, M. Building Reflective Practice through an Online Diversity Simulation in an Undergraduate Teacher Education Program. Contemp. Issues Technol. Teach. Educ. 2017, 17, 128–153. [Google Scholar]
- Bradley, E.G.; Kendall, B. A Review of Computer Simulations in Teacher Education. J. Educ. Technol. Syst. 2014, 43, 3–12. [Google Scholar] [CrossRef]
- Clapper, T.C. Role-Play and Simulation: Returning to Teaching for Understanding. Educ. Dig. 2010, 75, 39–43. [Google Scholar]
- Dieker, L.A.; Rodriguez, J.A.; Hynes, M.C.; Hughes, C.E. The Potential of Simulated Environments in Teacher Education: Current and Future Possibilities. Teach. Educ. Spec. Educ. 2014, 37, 21–33. [Google Scholar] [CrossRef]
- Girod, M.; Girod, G. Simulation and the Need for Quality Practice in Teacher Preparation. J. Technol. Teach. Educ. 2008, 16, 307–337. [Google Scholar]
- Kaufman, D.; Ireland, A. Enhancing Teacher Education with Simulations. Tech.Trends 2016, 60, 260–267. [Google Scholar] [CrossRef]
- Bautista, N.U.; Boone, W.J. Exploring the Impact of TeachMETM Lab Virtual Classroom Teaching Simulation on Early Childhood Education Majors’ Self-Efficacy Beliefs. J. Sci. Teach. Educ. 2015, 26, 237–262. [Google Scholar] [CrossRef]
- Clark, R.C.; Mayer, R.E. E-Learning and the Science of Instruction: Proven Guidelines for Consumers and Designers of Multimedia Learning; Pfeiffer: San Francisco, CA, USA, 2011. [Google Scholar]
- Dalgarno, B.; Gregory, S.; Knox, V.; Reiners, T. Practising Teaching Using Virtual Classroom Role Plays. Aust. J. Teach. Educ. 2016, 41, 126–154. [Google Scholar] [CrossRef]
- Cruz, B.C.; Patterson, J. Cross-Cultural Simulations in Teacher Education: Developing Empathy and Understanding. Multicult. Perspect. 2005, 7, 40–47. [Google Scholar] [CrossRef]
- Snoek, M.; Uzerli, U.; Schratz, M. Developing Teacher Education Policies through Peer Learning. In Teacher Education Policy in Europe: A Voice from Higher Education Institutions; Marco Snoek, Amsterdam Institute of Education, University of Umea: Umea, Sweden, 2008; pp. 135–155. Available online: https://www.hva.nl/binaries/content/assets/subsites/kc-oo/publicaties/snoek-schratz-uzerli-final-published.pdf (accessed on 21 May 2022).


| Examples of Problems | |
|---|---|
| 1 | What is the probability that two of the children are girls and two are boys in a family of 4 children? |
| 2 | One of the two children of a father is a boy. What is the probability that his other child is also a boy? |
| 3 | There are three cards in a hat. One of the cards is red (RR) on both sides, the other is white (WW) on both sides, and the last card is coloured red on one side and white (RW) on the other side. A random card is chosen from the hat and placed on the table. It seems that the visible side of the card is red. What is the probability that the bottom side of the card is also red? |
| Academic Goals | Social Goals | |
|---|---|---|
| Reasoning (R) | Generalizing (GE) | Attending events (AE) |
| Hypothesis (H) | Determining model problem fit (DMPF) | Freely sharing thoughts (FST) |
| Guessing (GU) | Performing a few and many experiments (PE) | Using mathematics as a communication tool (UMCT) |
| Testing (T) | Interpreting the test outputs (ITO) | Valuing the use of technology (VUT) |
| Observing (O) | Learn from mistakes (LFM) | Peer learning (PL) |
| Explaining (E) | Calculating experimental probability (CEP) | |
| Making inferences (MI) | Calculating theoretical probability (CTP) | |
| Using the language of probability (LP) | Bridging experimental and theoretical probability (BETP) | |
| All possible situations (APS) | Desired situations in all situations (DS) | |
| Response | Some Extracts of Ways of Thinking | f (%) |
|---|---|---|
| 1/16 | PT3: The probability that 2 out of 4 children are boys and 2 are girls | 30(68%) |
| PT18: The probability that 2 of them are men is The probability that 2 of them are girls is We multiply them and conclude | ||
| 1/5 | PT1: BBBB, BBBG, BBGG, BGGG, and GGGG are all states. We want one, probability 1/5. PT15: There may be cases of 4G, 4B, 3G1B, 2G2B, and 1G3B. There is only one situation we want. Probability 1/5. | 9(20%) |
| 3/8 | PT27: BBGG PT39: There is 1 case in the form of BBBB, 4 cases in the form of BBBB, 6 cases in the form of BBGG, 4 in the form of BGGG, and 1 case in the form of GGGG. There are a total of 16 situations. The state we want is six, with probability 6/16 = 3/8. | 3(7%) |
| 1/4 | PT43: There are 4 situations we want. These are BBGG, BGBG, GBGB, GGBB. All cases are 16. The probability is 1/4. PT17: The desired situation is 2 girls and 2 boys. There are 4 different situations in this way. GGBB, 2.1.2.1 = 4. In all cases, 2.2.2.2 = 16. Probability 4/16 = 1/4 | 2(5%) |
| Response | Some Extracts of Ways of Thinking | Frequency Percentage |
|---|---|---|
| 1/2 | PT7: The sex of the child is independent of the other. It can be a boy or a girl. Therefore, the probability of being a boy is 50%. | 33(75%) |
| PT11: The gender of the children is always 50% girls and 50% boys for each child. | ||
| PT32: It could be a girl, or it could be a boy. There are two sexes. So there are two situations. Probability 1/2. | ||
| PT40: %50. Because it doesn’t matter what the gender of the other child is. It is already known. | ||
| PT17: When a child is born, either a boy or a girl is born. In other words, the probability of a boy or girl being born is 50%. Even if ten boys are born, there is a 50% chance that the eleventh child will be born a boy or a girl. | ||
| PT12: All situations BG and BB. The desired state is BB. The probability is 1/2. | ||
| PT9: XX (Female) and XY (Male) from here XX (Girl), XY (Male), XX (Girl), XY (Male). | ||
| 1/3 | PT10: All occasions for two kids BB, BG, GB, GG. Since someone is a boy, there can be no GG status. There are three states in total (BB, BG, GB) and there is a desired state (BB). The probability is 1/3. | 5(11%) |
| PT33: All situations are situations where there is at least one male., the desired state is. The intersection of these two sets is. According to the conditional probability formula. | ||
| 1/4 | PT27: There are a total of four cases GG, BB, BG, and GB. The desired state is BB. So the probability is 1/4. | 4(9%) |
| 1/5 | PT3: Both are men (BB),The first is a boy and the other is a girl (BG),. The first is a girl and the other is a boy (GB),. If we divide the desired situation into all situations, we find the probability 1/5. | 2(5%) |
| Response | Some Extracts of Ways of Thinking | Frequency Percentage |
|---|---|---|
| 1/2 | PT12: It becomes 1/2. Because the card with a red side on one side is either the 1st card or the 3rd card. So there are 2 cards. The card with red on both sides is only the 1st card. So the probability is 1/2. | 28(64%) |
| PT23: All states are RR and RW. There are two situations. The desired state is RR, that is, a situation. The probability is 1/2. | ||
| PT10: It is obvious that the WW card is not drawn, and then the card on the table is either RR or RW. The probability of both must be the same; since we pulled randomly. | ||
| 1/3 | PT41: Since the cards are RR, WW, and RW, a total of in the 6 faces. In the first case we want, probability 2/6 = 1/3. | 7(16%) |
| PT18: There are 6 faces in total. Since we see a red, there are 2 reds left. Since all faces are 6, the probability is 2/6 = 1/3. | ||
| PT32: Out of three cards, there is one card with red on both sides. Therefore, the probability is 1/3. | ||
| PT11: RR, WW, RW. Red one hundred three. We see one of his faces. So two red faces remain. Probability 2/3. But we have to multiply this by 1/2. Because there are two red cards. There is a card that is red on both sides. As a result,(2/3).(1/2) = 1/3 is found. | ||
| PT5: Using the combination, I found the probability as. | ||
| 1/6 | PT16: Three sides of the cards are red and three sides are white. The probability of being red is 3/6, one of the three cards with two red sides, so the probability is 1/3. If these probabilities are multiplied, the result is 3/6. 1/3 = 1/6. | 6(14%) |
| PT38: First of all, the probability of choosing one of the three cards is 1/3. There are 2 cards with red on them (RR, RW). The probability of choosing one with red on both sides is 1/2. If we multiply, the result is 1/3. 1/2 = 1/6. | ||
| PT15: RR, WW, RW cards, 6 states are obtained in the form of RW, RB, RR, RW, RW, WW. Only one of these situations (RR) is required. The probability is 1/6. | ||
| 1/4 | PT13: All faces are shaped like KKBBKB. The probability that the randomly selected face is red is 1/2. The probability that the back of the red card is also red ½. Probability 1/2.1/2 = 1/4. | 1(2%) |
| 3/4 | PT21: These three cards have 3 red and 3 white faces. We should not take into account the card with white on both sides. So there are a total of 4 faces. Since what we want is red, the probability is 3/4. | 1(2%) |
| 2/3 | PT28: We neglect the card that is white on both sides. The remaining two cards have 3 red and 1 white face. Since we see a red face, we have 2 red faces and 1 white face. So the probability of being red is 2/3. | 1(2%) |
| Items | 1 | 2 | 3 | 4 | 5 | |
|---|---|---|---|---|---|---|
| 1 | Simulation offers different representations of data | 12 (27.3%) | 32 (72.7%) | |||
| 2 | Simulation allows variables to be changed | 3 (6.8%) | 12 (27.3%) | 29 (65.9%) | ||
| 3 | Simulation increases communication skills | 10 (22.7%) | 14 (31.8%) | 20 (45.5%) | ||
| 4 | Simulation provides visual learning | 4 (9.1%) | 12 (27.3%) | 28 (63.6%) | ||
| 5 | Simulation makes observation easy | 2 (4.5%) | 9 (20.5%) | 33 (75%) | ||
| 6 | Simulation can be used as a problem-solving tool | 2 (4.5%) | 13 (29.5%) | 29 (65.9%) | ||
| 7 | The simulation requires little effort for long trials | 4 (9.1%) | 5 (11.4%) | 35 (79.5%) | ||
| 8 | Using simulation in probability statistics teaching is a waste of time. | 25 (56.9%) | 11 (25%) | 3 (6.8%) | 3 (6.8%) | 2 (4.5%) |
| 9 | The use of simulation in teaching is interesting | 2 (4.5%) | 17 (38.6%) | 25 (56.8%) | ||
| 10 | The use of simulation is unnecessary in probability statistics teaching | 20 (45.5%) | 15 (34.1%) | 5 (11.4%) | 2 (4.5%) | 2 (4.5%) |
| 11 | Simulation offers a different learning experience | 2 (4.5%) | 11 (25%) | 32 (70.5%) | ||
| 12 | Simulation allows us to see unpredictable processes | 4 (9.1%) | 10 (22.7%) | 30 (68.2%) | ||
| 13 | The simulation provides the opportunity to test assumptions | 2 (4.5%) | 9 (20.5%) | 33 (75%) | ||
| 14 | Simulation supports classroom discussion | 2 (4.5%) | 9 (20.5%) | 10 (22.7%) | 23 (52.3%) | |
| 15 | Simulation bridges experimental probability and theoretical probability | 1 (2.3%) | 1 (2.3%) | 1 (2.3%) | 9 (20.5%) | 32 (72.7%) |
| 16 | Simulation improves generalization skills | 1 (2.3%) | 2 (4.5%) | 14 (31.8%) | 27 (61.4%) | |
| 17 | Simulation enables guesswork and prediction | 1 (2.3%) | 5 (11.4%) | 11 (25%) | 23 (52.3%) | |
| 18 | The simulation produces results compatible with real-word | 1 (2.3%) | 1 (2.3%) | 2 (4.5%) | 11 (25%) | 29 (65.9%) |
| 19 | A simulation is a tool for revealing and correcting misconceptions | 1 (2.3%) | 5 (11.4%) | 12 (27.3%) | 26 (59.1%) | |
| 20 | Simulation makes learning easier with feedback | 1 (2.3%) | 2 (4.5%) | 13 (29.5%) | 28 (63.6%) | |
| 21 | Simulation requires preparation | 2 (4.5%) | 3 (6.8%) | 10 (22.7%) | 9 (20.5%) | 20 (45.5%) |
| I gained new techniques and ideas in the SBL environment | Difficult to understand in the SBL environment | SBL contributed to my better understanding of probability and statistics | SBL is very useful for probability and statistics teaching | I would like to use simulation when I am a math teacher |
 |  |  |  |  |
Publisher’s Note: MDPI stays neutral with regard to jurisdictional claims in published maps and institutional affiliations. |
© 2022 by the author. Licensee MDPI, Basel, Switzerland. This article is an open access article distributed under the terms and conditions of the Creative Commons Attribution (CC BY) license (https://creativecommons.org/licenses/by/4.0/).
Share and Cite
Koparan, T. How Does Simulation Contribute to Prospective Mathematics Teachers’ Learning Experiences and Results? Educ. Sci. 2022, 12, 624. https://doi.org/10.3390/educsci12090624
Koparan T. How Does Simulation Contribute to Prospective Mathematics Teachers’ Learning Experiences and Results? Education Sciences. 2022; 12(9):624. https://doi.org/10.3390/educsci12090624
Chicago/Turabian StyleKoparan, Timur. 2022. "How Does Simulation Contribute to Prospective Mathematics Teachers’ Learning Experiences and Results?" Education Sciences 12, no. 9: 624. https://doi.org/10.3390/educsci12090624