Article

The Influence of School Factors on Students’ Mathematics Achievements in Trends in International Mathematics and Science Study (TIMSS) in Abu Dhabi Emirate Schools

1
Department of Curriculum and Instruction, College of Education, United Arab Emirates University, Al Ain 15551, Abu Dhabi, United Arab Emirates
2
Department of Curriculum and Instruction, Faculty of Mathematics Education, Higher College of Technology, Al Ain 17155, Abu Dhabi, United Arab Emirates
3
Department of Special Education, College of Education, United Arab Emirates University, Al Ain 15551, Abu Dhabi, United Arab Emirates
4
Department of Cognitive Sciences, College of Humanities and Social Sciences, United Arab Emirates University, Al Ain 15551, Abu Dhabi, United Arab Emirates
*
Author to whom correspondence should be addressed.
Educ. Sci. 2022, 12(7), 424; https://doi.org/10.3390/educsci12070424
Submission received: 25 May 2022 / Revised: 14 June 2022 / Accepted: 17 June 2022 / Published: 21 June 2022

Abstract

:
This study aimed to explore school factors that influence students’ achievements in Trends in International Mathematics and Science Study (TIMSS) in schools in the Emirate of Abu Dhabi, in the United Arab Emirates. The study sample for TIMSS 2015 consisted of 4838 students in eighth grade; 2172 girls, 2666 boys, and 156 schools from Abu Dhabi attended and participated in TIMSS 2015. Principal component analysis (PCA) was run on 77 items of school questionnaires administered to school principals to provide information about the school contexts for teaching and learning. The five factors from the school questionnaire were general school resources, school discipline and safety, parental support, principal experience and education, and library and instruction resources. Multiple regression models were implemented to examine the impact of school factors on student achievement in TIMSS 2015. The models are statistically significant, indicating that they fit the data well. This also demonstrates a significant linear relationship between students’ achievement in TIMSS 2015 and the variables related to school factors.

1. Introduction

Trends in International Mathematics and Science Study (TIMSS) provides reliable and valuable data about student performance in mathematics and science in the participating countries. TIMSS was first administered in 1995 by the International Association for the Evaluation of Educational Achievement (IEA), and has been administered every four years, becoming one of the lead international comparative studies that provides comparative data to assist participating countries in re-examining their student learning. Abu Dhabi participated in TIMSS 2011, 2015, and 2019, as a benchmark study for fourth and eighth grades mathematics and science [1]. The TIMSS 2015 results indicate that students in Abu Dhabi perform below the international average in mathematics and science [2]. According to the TIMSS 2015 mathematics results, Abu Dhabi students rank 36th amongst 4th graders, and 24th amongst 8th graders. The results prove there is a need to assess the predictors of mathematics achievement. Considering these factors, we investigated the influence of school factors in predicting the mathematics achievement of Abu Dhabi eighth grade students in TIMSS 2015. By determining significant and reliable factors in predicting the influence of school factors, the study results are expected to contribute toward curriculum reform implementation, in order to achieve the desired positive outcome in mathematics at a school level. The study was guided by the research question of which school characteristics effectively predict mathematics achievement for Abu Dhabi eighth grade students [3].
This research study attempts to explore the effects of school factors that affect the mathematics achievement of eighth grade students in the Emirate of Abu Dhabi in TIMSS 2015. It is of note that previous studies undertaken focus on implicated facts and datasheets upon the average score of students in the UAE in mathematics and science, while the underlying school factors behind students’ performance in TIMSS have not been emphasized in any studies. Therefore, this study aims to identify the school-related factors that influenced Abu Dhabi eighth grade students’ mathematics achievement in TIMSS 2015. The research questions for the study were: What school variables might have affected student performance in TIMSS 2015 eighth grade mathematics in the Emirate of Abu Dhabi? What factors related to Abu Dhabi schools might predict students’ achievement in TIMSS 2015?

2. School Variables on Students’ Mathematics Achievements

School-related variables, such as school resources, school environment in terms of discipline and safety, parental involvement and support in school-related activities, school principal experience and education, and library and instructional resources, might affect students’ achievement in mathematics. Studies find that school resources positively impact students’ learning and academic performance [4]. School climate may have a significant impact on student learning and performance in mathematics or other subjects [5]. This climate creates a positive atmosphere in the school, and classrooms with greater safety and student discipline, with self-responsibility and shared values, which may affect student achievement [6]. Likewise, studies report that parental involvement in school has a significant impact on students’ academic performance [7,8]. School principals are the major agents of impacting students’ performance in schools [9] (UChicago Consortium on School Research) [9]. School principals play a major role in teacher development, parental engagement in school, maintaining a safe climate, and providing instructional supervision and leadership to improve student achievement [9].
Several studies [10,11,12,13,14,15,16] highlight the impact of school factors on student performance in mathematics. However, most of these studies focus on classroom environment and some other school variables, for example, interactive classrooms, parental involvement in school, the nature of school management, school socioeconomic status, and teaching–learning approaches in terms of impact on students’ mathematics achievement.
Lamb and Fullarton [14] perform a comparative study on the effect of classroom and school on eighth grade students’ mathematics achievements between the United States and Australia. The findings reveal that students’ classroom interaction in both countries relies heavily on their higher vulnerability to the composition of students’ socioeconomic status. The researchers state that both the classroom environment and the interaction pattern between the students are crucial in amplifying the students’ learning techniques and protocols. If the classroom and the study pattern are interactive, the curricula are framed around those interactive sessions, learning from each other’s knowledge is embellished, and then the learning becomes much more accessible than conventional classroom teaching using chalk and a duster. The researchers also state that classrooms that encourage interactive sessions amongst students are more prone to showcase high attendance than other classes with high absenteeism, due to a lack of motivation inside the classrooms.
Sheldon et al. [16] conduct a study to determine whether creating partnerships can improve math proficiency among students. The assessment based on the multilevel statistical software only analyses the direct ‘effects’ of variables, and interaction ‘effects’ on the dependent variable. The researchers in this study also illustrate the utility of interactive sessions that can be considered in classroom settings in schools, to encourage students to improve their interest and inclination toward mathematics. It is seen that students become much more interested when introduced to interactive sessions in the case of science subjects, as compared to conventional classroom teachings. Bowen et al. [17] examine school engagement, academic performance, educational aspirations, students’ attendance, parental support, neighborhood, school, and classroom factors in another study. This study finds that within-school factors significantly impact students’ academic achievements. Likewise, Izumi [12] explores the impact of parental involvement on the achievements of junior secondary school students in Botswana in TIMSS 2007. The study employs independent variables, such as the participation of parents in meetings at a school level, whether or not the parents are requested to have active involvement in the school committee, and the degree of parental support for student achievement at a school level.
Joseph [13] studies how school variables influence students’ achievements in mathematics. The results from an achievement test in mathematics on 853 students from 20 different high schools in Akwa Ibom State in Nigeria reveal that school proprietorship (private and public school type) as a variable has a significant impact on students’ achievement in mathematics, indicating that private school students outperform the public schools. Other variables such as school locations, whether urban or rural, have no significant impact on students’ performance in mathematics [13].
Gustafsson et al. [11] conduct a study to understand the school variables capable of moderating the link between mathematics achievements and the socioeconomic status of eighth grade students. The study examines school factors, educational systems, and organizational differentiation. The results of the study vary, with some countries, having positive regression coefficients for school socioeconomic status (SES) with educational achievement in TIMSS, and others having negative regression coefficients. For example, South Africa, Botswana, Indonesia, and Thailand, to name a few, have significant positive slope variants. At the same time, countries such as Japan, Singapore, Armenia, Hungary, Russia, and Canada have a negative regression coefficient for school SES and student achievement. A negative regression coefficient is associated with instructional quality and student achievement with respect to SES. This way, school characteristics, in terms of SES, have a significant impact on student performance in TIMSS 2011.
Malik and Rizvi [15] conduct a study on the impact of the classroom environment on students’ mathematics achievements at the secondary level. The study is conducted in Tehsil Rawalpindi and Islamabad. The sample consists of 500 eighth grade students studying mathematics, who were selected randomly from different schools. During the study, the students who believe in the investigation, or use the inquiry approach to comprehend the content, do not achieve good marks in the Pakistani context, which may be due to a lack of priority by the agencies responsible for curriculum improvement and evaluation.

3. Methodology

This study utilized the publicly available TIMSS 2015 data from the International Database of TIMSS and PIRLS International Study Center (https://timssandpirls.bc.edu/index.html, accessed on 20 November 2019). The ontological assumption of the study is realism with objectivity, generalizability, and quantitative analysis of the data. Hence, this study followed a quantitative approach to analyze and interpret school variables and their impact on eighth grade students’ mathematics achievement in TIMSS 2015 in the Emirate of Abu Dhabi, UAE.

3.1. TIMSS 2015 Data

This study used data concerning the eighth grade mathematics achievement from the TIMSS 2015, conducted by the International Association for the Evaluation of Educational Achievement (IEA). TIMSS assessed mathematics and science in 1995, 1999, 2003, 2007, 2011, 2015, and 2019 [18,19]. Apart from monitoring trends in mathematics and science achievement in the fourth and eighth grades, TIMSS collects a vast array of background information in the context of varying educational systems, organizational approaches of schools, and instructional practices [19]. In this study, TIMSS 2015 sources, which covered 57 countries and 7 benchmarking entities worldwide, involving about 580,000 students, provided information about educational achievement across countries to serve as a resource for improving teaching and learning mathematics and science [19]. At the time of the implementation of TIMSS 2015, the Abu Dhabi Education Council (ADEC) was responsible for looking after the operations of 257 public schools across the Emirate of Abu Dhabi. In addition to these, 188 private schools operate within the Abu Dhabi Emirate regions. There are 223,803 students in private schools, and 127,770 students in public schools. The public school population reflects 23% expatriates, and 77% of Emirati nationals. The private school population represents 24% of Emirati citizens, and 76% of expatriates [19]. We retrieved TIMSS 2015 data on school questionnaires and students’ mathematics achievement for further analyses and interpretations, to examine the impacts of school variables on student achievement in eighth grade mathematics.

3.2. Questionnaires

This study used data from the TIMSS 2015, including a school questionnaire and eighth grade students’ achievements in math (five plausible values). The school questionnaire contained items that asked the school principal to provide information about school climate, resources available for teaching and learning, the national curriculum, school location, and other information about the context within which mathematics is taught and learned. As a result of this study’s goal, all questionnaire items related to science were removed (Table 1). The 22 broad item types break down into specific items, that make 77 items included in the current analysis.

3.3. Study Sample

The study population consisted of all eighth grade students in Abu Dhabi schools. The study sample targeted eighth grade students in mathematics in the Emirate of Abu Dhabi, including 156 schools that participated in TIMSS 2015. The students’ average age is 13.9 years [18]. The researcher combined the school questionnaire in addition to the students’ mathematics achievement on TIMSS 2015 in to one SPSS file. The number of participant students in the eighth grade reached 4,838 (out of 22,018 students) in selected Abu Dhabi public and private schools, and the number of participating schools was 156 public and private schools out of 257 public and 188 private schools in Abu Dhabi [20]. About 156 school principals from the public and private sectors participated in this study, and 205 mathematics teachers who taught the eighth grade curriculum were also participants in the TIMSS 2015 (Table 2).

3.4. TIMSS 2015 Data

Johansone [21] explains data collection operations for TIMSS 2015 as scheduled according to 57 participating countries and 7 benchmarking entities located in the southern and northern hemispheres. The school year typically ends in November or December for those schools in the southern hemisphere; the TIMSS assessment was given out in October or November 2014. Whereas, for schools in the northern hemisphere, the school year usually ends in May or June and, thus, the assessment was conducted in April, May, or June 2015. Survey and assessment operations procedures were developed and standardized to ensure the consistency and uniformity of high-quality, internationally comparable data among the participating countries. Each country or benchmark entity was charged with carrying out the data collection process, and maintaining quality control procedures as per the guidelines set forth by the National Research Coordinators. Testing administrators and participating school personnel were provided with training in test security, timing, rules for answering students’ questions, and control monitors, in order to maintain the high-quality and accurate data for the TIMSS 2015 survey and assessment.
In Abu Dhabi, the students from the sampled schools sat for the achievement tests and answered the questionnaire. At the same time, mathematics teachers and school principals of the participating schools completed the questionnaire [22]. The data collection procedure was applied in face-to-face mode in 75 sampling zones by the TIMSS study center in Abu Dhabi. The TIMSS 2015 eighth grade mathematics test data can be processed from two main areas: content and cognitive domains. Content areas cover real numbers, geometry, algebra, statistics, and probabilities, while cognitive domains include knowledge, application, and thinking [18]. This study did not cover the cognitive domains, because the intent was to study the school variables and their impacts on student achievement in mathematics in TIMSS for grade eight. Therefore, these two areas are grouped and presented in tables for comparative and interrelated analysis [23].

3.5. Analysis

First, we performed factor analysis with 77 items from the TIMSS 2015 school questionnaire, to reduce them into a few dominant categorical variables to relate them to students’ mathematics achievement. Then, one-sample t-tests were conducted to examine item-wise results within each categorical variable from the school factors, if they were statistically significant from the hypothesized means. One sample t-test was deemed suitable because of large sample size of the data, which does not require perfect normal distribution, the samples were independent, and the composite component variables were computed in the forms of ratio scale as averages of items loaded with them. A multiple linear regression analysis was performed to examine the impact of school-related categorical variables on eighth grade students’ achievement in TIMSS 2015 in mathematics. The statistical significance of the linear regressions was assessed at 0.01 level of significance. All analyses were performed in IBM SPSS version 26.

4. Results

4.1. Factor Analysis of School Questionnaire

A principal components analysis (PCA) was conducted on a 77 question questionnaire administered to school principals to provide information about the school contexts for teaching and learning. The suitability of PCA was assessed before analysis. Inspection of the rotated component matrix shows that all variables have a factor-loading coefficient greater than 0.3. The overall Kaiser–Meyer–Olkin (KMO) measure is 0.771, which is acceptable [24]. Bartlett’s test of sphericity is statistically significant (p < 0.05), indicating that the data is likely factorable. Component loadings and variables of the rotated solution are presented in Table 3.
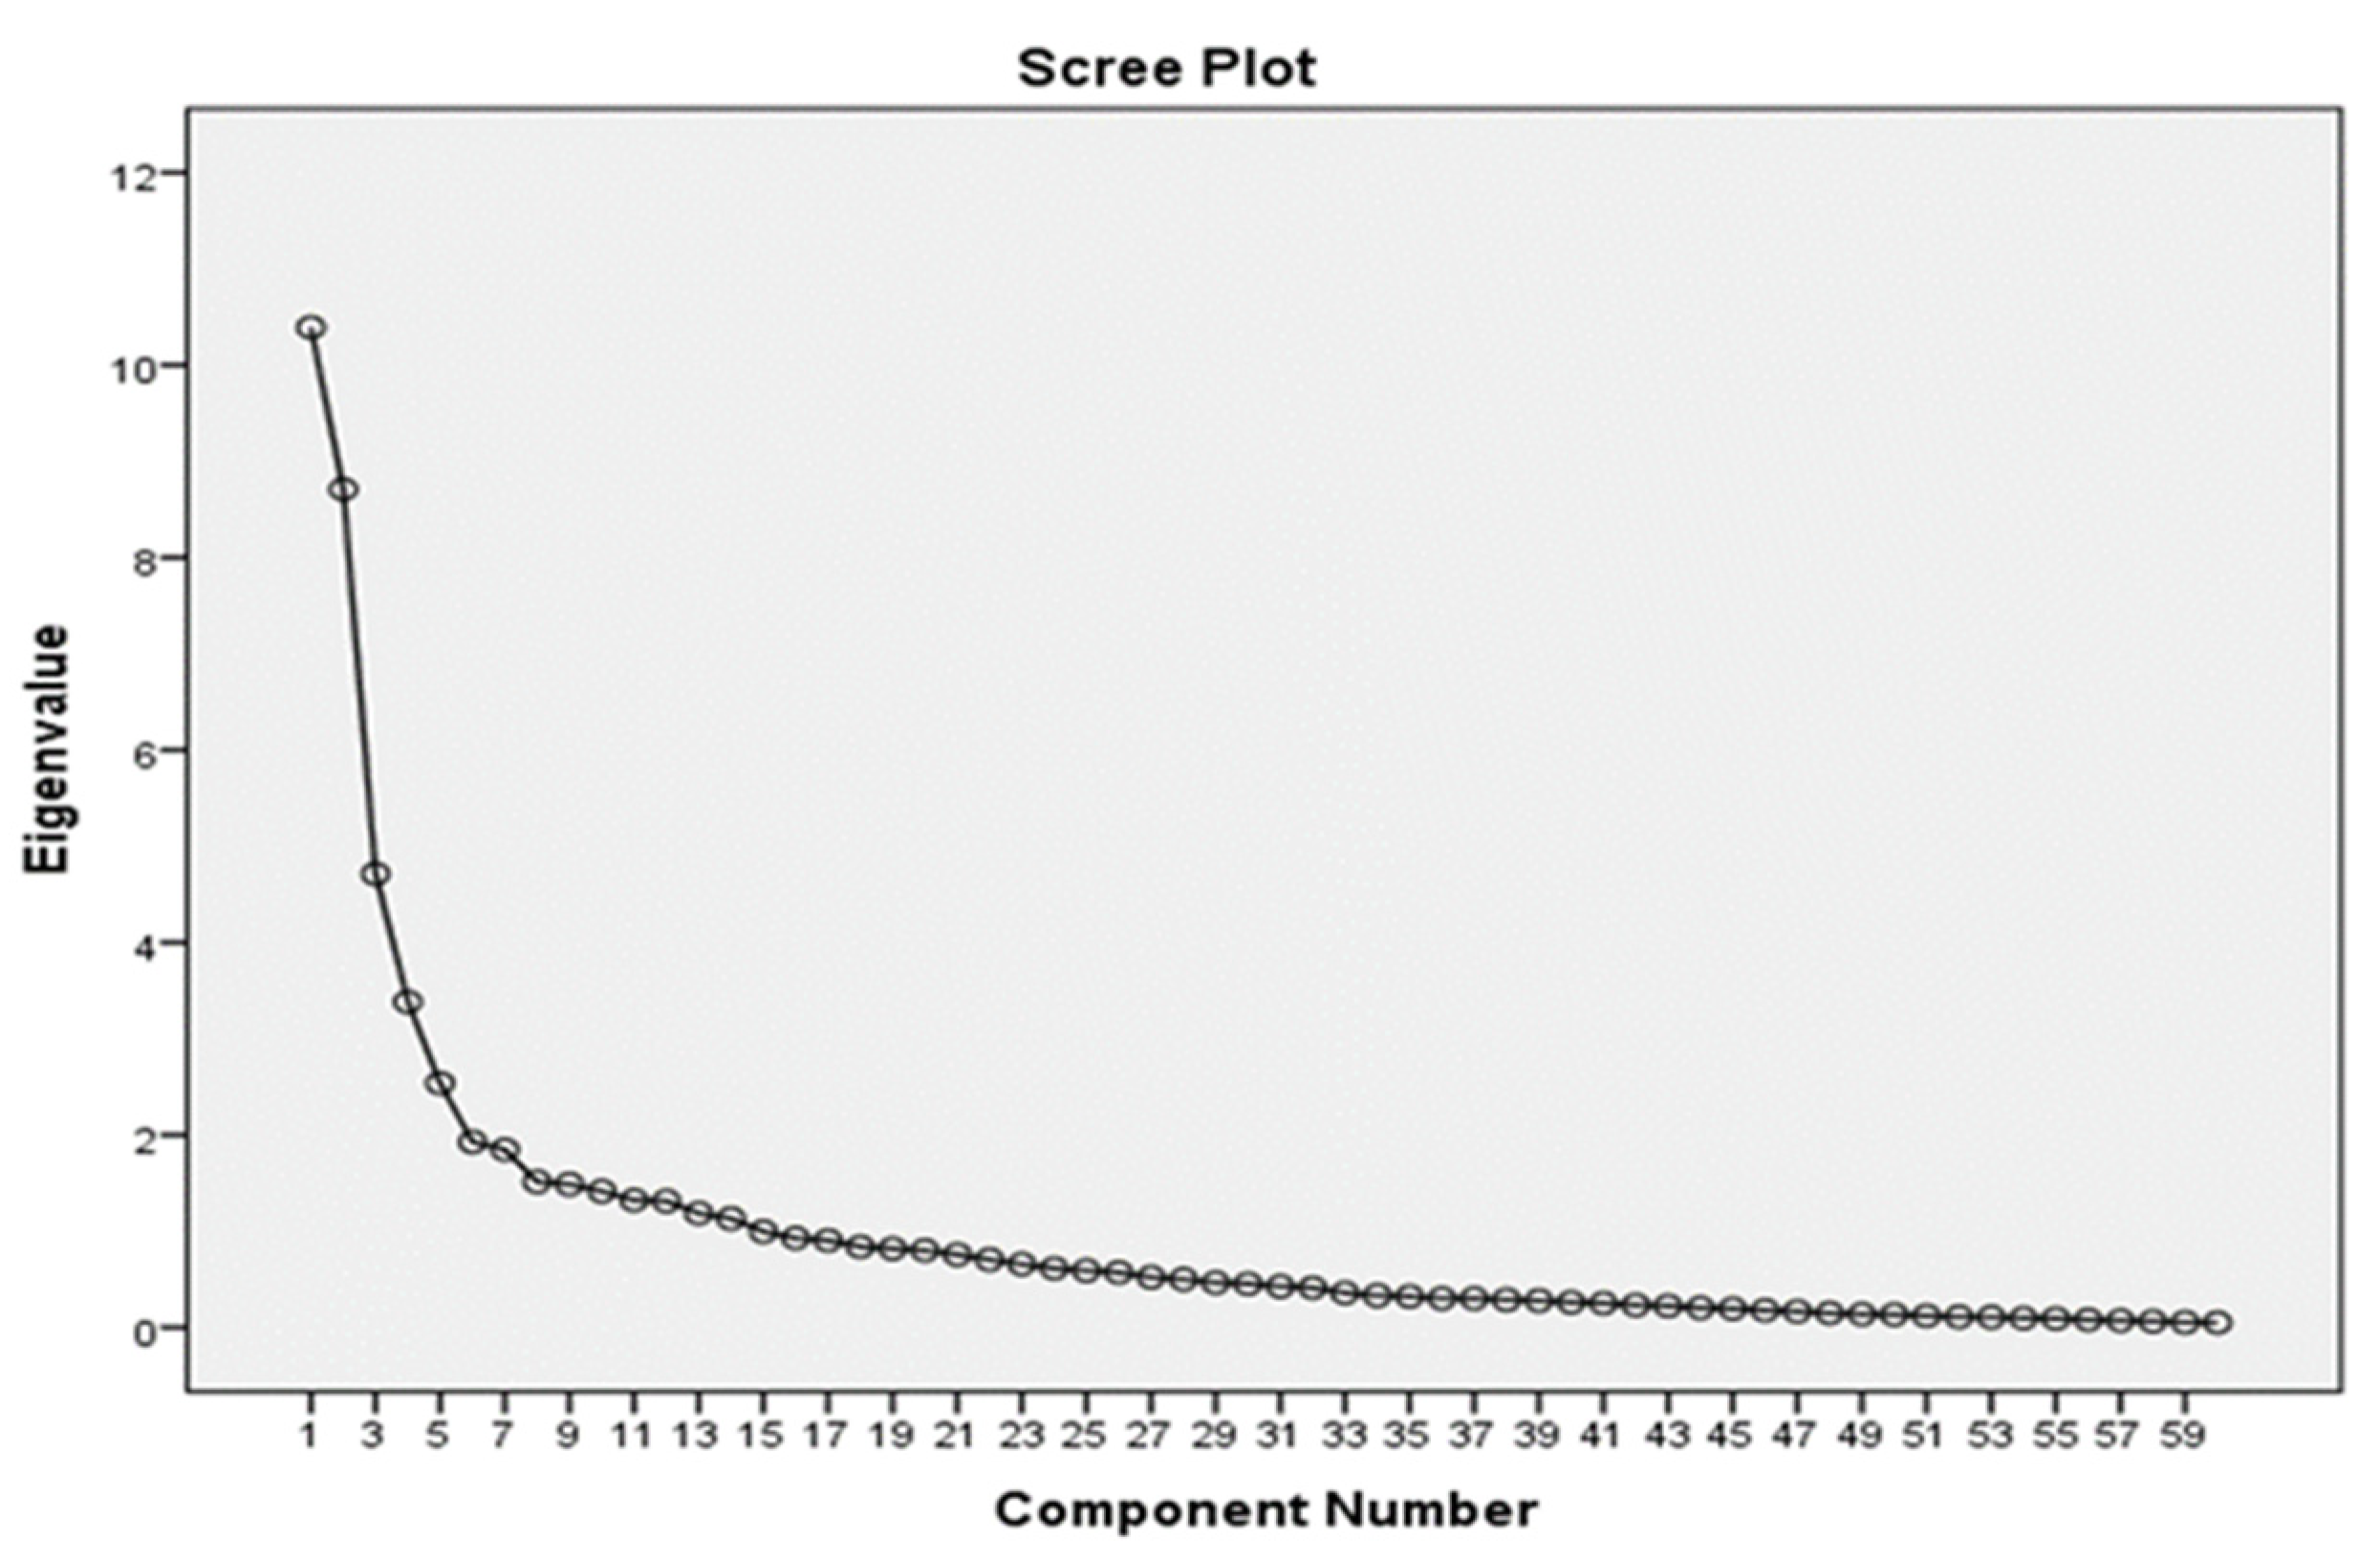
The PCA reveals five factors with eigenvalues greater than 1 among the 14 potential factors. Only five factors were retained and ran the principal component analysis ignoring the other factors that have a low-reliability coefficient and the coefficient of items loading. The five factors used as categorical variables explain 17.3%, 14.5%, 7.8%, 5.6%, and 4.2% of the total variance. If the first five factors explain most variables’ variability, they are a good, more straightforward substitute for all variables. Therefore, the rest of the factors were dropped without losing much of the original variability. A visual inspection of the scree plot indicates that five components should be retained. Besides, a five-component solution meets the interpretability criterion [25,26]. As such, five components are included. The five factors as categorical variables are selected based on several criteria. The first criterion is that an eigenvalue less than one indicates that the component explains less variance than a variable, and should not be retained (Table 4).
In this study, the components ranked 6th to 14th have an eigenvalue between (1.928 to 1.132). Still, these factors have a low-reliability coefficient and fewer items loading with them. Therefore, the interpretation is relatively straightforward: components 1 to 5 are retained, and components 6 to 14 are not. The second criterion is based on the cumulative percentage of variance explained by a set number of components, where the first 5 factors explain about 50% of the total cumulative variance. Using the lower criterion of at least 50% of total variance leads to the retention of the first five components [25,26]. The third criterion is a scree plot. The components to retain are those before the (last) inflection point of the graph (Figure 1). The inflection point represents where the graph begins to level out, and subsequent components add little to the total variance [25,26].
In this study, visual inspection of the scree plot leads to the retention of five components (Figure 1). The fourth criterion is reliability. The study adopted Cronbach’s alpha (α) to measure the internal consistency of the scales created. The internal consistency of the five components is high to low (0.94, 0.90, 0.91, 0.572, 0.695). One factor has a low internal reliability coefficient, but is near 0.60 and is retained. The components’ items are closely related, so this led to the retention of five components. The fifth criterion is the interpretability criterion. The interpretability criterion is arguably the most crucial. It mainly revolves around the concept of simple structure, and a readily explainable division of variables into separate components. Extracting five components in this example allows the attainment of simple structure, and given the leaning towards extracting five components, re-runs the principal components analysis, but forces SPSS to only extract (retain) five components, instead of the default, using eigenvalue-one criterion, and suppressing all coefficients less than 0.3 [25,26].
The five-component solution explains approximately 50% of the total variance. A varimax orthogonal rotation is employed to aid interpretability. The rotated solution exhibits a ‘simple structure’ [24,26]. The interpretation of the data is consistent with what the questionnaire is designed to measure, with strong loadings of items on factor 1, named general school resources; items on factor 2, named school discipline and safety; factor 3, named parental support; factor 4, named principal experience and education; and factor 5, named library and instruction resources (Table 5).
Table 5 shows that factor 1: general school resources is a combination of 14 variables, coded as BCBG13AE, BCBG13AE, BCBG13AE, etc. The value of Cronbach’s alpha (α) for factor 1 is 0.95, which is above 0.9, and considered excellent and acceptable [25,27]. It shows a high internal consistency of the variables within the factor. Therefore, the reliability of factor 1 within the variables is excellent. For factor 1: general school resources, each component variable loads moderately high on the underlying factor (loadings between 0.43 and 0.86), indicating that they measure the underlying construct relatively well. Variance in factor 1, explained by the component variables, is 17.32%, which is relatively high for a 14-variable scale. Cronbach’s alpha is 0.95, providing further evidence that the component variables are valid. These variables work well as a unit.
Factor 2: discipline and safety is a combination of 12 variables, i.e., BCBG15F, BCBG15G, BCBG15H, etc. The value of Cronbach’s alpha (α) for factor 2 is 0.90, which is considered excellent and acceptable, which is above 0.9 [25,26,27]. For factor 2: discipline and safety, each component variable loads moderately high on the underlying factor (loadings between 0.59 and 0.81), indicating that they measure the underlying construct relatively well. Variance in factor 2, explained by the component variables, is 14.52%, which is relatively high for a 12-variable scale. Cronbach’s alpha is 0.90, providing further evidence that the component variables are valid. These component variables work well as a unit.
Factor 3: parental support is a combination of 13 variables, i.e., BCBG14A, BCBG14D, BCBG14G, etc. The value of Cronbach’s alpha (α) for factor 3: parental support is 0.917, which is considered excellent and acceptable, which is above 0.9 [24,25]. For factor 3: parental support, each component variable loads moderately on the underlying factor (loadings between 0.51 and 0.83), indicating that they measure the underlying construct relatively well. The percentage of variance in factor 3, explained by the component variables, is 7.86%, which is relatively moderate for a 13-variable scale. Cronbach’s alpha is 0.92, providing further evidence that the component variables are valid. The component variables work well as a unit.
Factor 4: principal experience and education is a combination of five variables, i.e., BCBG22A, BCBG22A, BCBG03A, etc. The value of Cronbach’s alpha (α) for factor 4: principal experience and education is 0.57, which is low, but still acceptable for exploratory factor analysis, as it is close to reliability coefficient 0.6 [25]. It shows an acceptable degree of internal consistency of the variables within the factor. For factor 4: principal experience and education, each component variable loads moderately on the underlying factor (loadings between 0.38 and 0.69), indicating that they measure the underlying construct relatively well [25]. The percentage of variance in factor 4, explained by the component variables, is 5.64%, which is relatively moderate for a five variable scale. Cronbach’s alpha is 0.57, providing further evidence that the component variables are valid. The component variables work well as a unit.
Factor 5: library and instruction resources is a combination of seven variables, i.e., BCBG17A, BCBG08A, BCBG03BRSCHOOL, etc. The measure of internal consistency and reliability value of Cronbach’s alpha (α) for factor 5: library and instruction resources is 0.695, which is good and acceptable [25]. For factor 5: library and instruction resources, each component variable loads moderately on the underlying factor (loadings between 0.30 and 0.55), indicating that they measure the underlying construct relatively well. The percentage of variance in factor 5, explained by the component variables, is 4.23%, which is relatively low for a seven variable scale. Cronbach’s alpha is near 0.70, providing further evidence that the component variables are valid. The component variables work well as a unit.
The factor analysis results show that the internal consistency of factors 1, 2, and 3 are very high (0.94, 0.90, and 0.91, respectively), and the items in the factors are closely related. The internal consistency of factors 4 and 5 is moderate (0.57 and 0.70, respectively), in comparison to the internal consistency of factors 1, 2, and 3. As a result of the factor analysis with principal component analysis, five new factors are created throughout the school questionnaire, that are entitled factor 1: general school resources, factor 2: discipline and safety, factor 3: parental support, factor 4: principal experience and education, and factor 5: library and instruction resources. These factors are used for one sample t-test and regression analysis, to identify the school factors that most affected students’ achievement in TIMSS 2015.

4.2. One-Sample t-Test of School Questionnaire: Factor 1—General School Resources

A one-sample test was performed to examine the perceptions of the school principals on items related to factor 1: general school resources. These items have four-point Likert-scale responses, from A lot (coded 4), to Not at all (coded 1), and the neutral value of 2.5 is used as the test value. The one-sample t-test shows that the principals have an overall significant negative perception toward factor 1: general school resources (mean = 2.42, SD = 0.88, and p < 0.05), since it attains an overall mean of less than 2.5, with SD = 1.302 and p < 0.05. Their perceptions are negative toward school buildings and grounds, heating/cooling and lighting systems, and computer technology for teaching and learning (e.g., computers or tablets for student use). They express negative perceptions toward technologically competent staff (mean = 2.34, SD = 1.064, and p < 0.05), instructional materials (e.g., textbooks) (mean = 2.37, SD = 1.199, and p < 0.05), audio–visual resources for delivery of instruction (e.g., interactive whiteboards, digital projectors) (mean = 2.34, SD = 1.063, and p < 0.05), supplies (e.g., papers, pencils, materials) (mean = 2.15, SD = 1.186, and p < 0.05), concrete objects or materials to help students understand quantities or procedures (mean = 2.41, SD = 0.936, ad p < 0.05), library resources relevant to mathematics instruction (mean = 2.37, SD = 0.939, and p < 0.05), and toward calculators for mathematics instruction (mean = 2.26, SD = 1.140, and p < 0.05). Overall, the principals have a negative perception toward factor 1: general school resources (mean = 2.42, SD = 0.88, and p < 0.05) (Table 6).

4.3. One-Sample t-Test of School Questionnaire: Factor 2—School Discipline and Safety

A one-sample t-test was conducted to examine the Abu Dhabi school principals’ perceptions on items related to factor 2: school discipline and safety (Table 7). These items have four-point Likert-scale responses, from Serious problem (coded 4), to Not a problem (coded 1), and the neutral value of 2.5 is used as a test value. All the rated items are less than neutral values. The highest-rated item is classroom disturbance (mean = 2.06, SD = 0.745, and p < 0.05) and the lowest-rated item is physical injury to teachers or staff (mean = 1.10, SD = 0.403, and p < 0.05). Overall, the headmaster has a positive perception toward factor 2: school discipline and safety (mean = 1.6013, SD = 0.49186, and p < 0.05) (Table 7). This result aligns with the conceptual framework of this research. The school applies public safety to all students equally, in addition to applying the rules of discipline within the classroom and the school, so that all students in the school experience safety and discipline rules equally, which is positively reflected with the students’ achievement.

4.4. One-Sample t-Test of School Questionnaire: Factor 3—Parental Support

A one-sample t-test was conducted to examine the Abu Dhabi school principals’ perceptions of factor 3: parental support items (Table 8). These items have five-point Likert-scale responses, from strongly disagree (coded 5), to strongly agree (coded 1), and the neutral value of 3.0 is used as the test value. The one-sample t-test shows that the headmaster has an overall significant positive perception toward factor 3: parental support. The highest-rated item is parental commitment to ensure that students are ready to learn (mean = 2.06, SD = 0.745, and p < 0.05), and the lowest-rated item is students’ respect for classmates who excel in school (mean = 1.85, SD = 0.694, and p < 0.05), However, the principals express negative perceptions toward parental involvement in school activities (mean = 3.11, SD = 1.040, and p < 0.05). Overall, the headmaster has a positive perception toward factor 3: parental support (mean = 2.3159, SD = 0.55927, and p < 0.05) (Table 8).

4.5. One-Sample t-Test of School Questionnaire: Factor 4—Principal Experience and Education

A one-sample t-test was conducted to examine the principals’ perceptions on items related to factor 4: principal experience and education (Table 9). These items have Likert-scale responses with four and five multiple choice variables, and the neutral values of 2.5 and 3.0, respectively are used as test values. The one-sample t-test shows that the principals have a significantly positive perception toward percentage of students in school have as their native language (mean = 3.71, SD = 1.81, and p < 0.05), and the highest level of formal education they have completed (mean = 2.65, SD = 0.675, and p < 0.05). However, the principals express negative perceptions on degrees in educational leadership (mean = 1.75, SD = 0.435, and p < 0.05), GEN\DEGREES IN EDUCATION LEADERSHIP\ISCED8 (mean = 1.93, SD = 0.252, and p < 0.05). Overall, principals have a negative perception toward factor 4: principal experience and education (mean = 2.3159, SD = 0.55927, and p < 0.05) (Table 9).

4.6. One-Sample t-Test of School Questionnaire: Factor 5—Library and Instruction Resources

A one-sample t-test was conducted to examine the principal’s perceptions on items related to factor 5: library and instruction resources (Table 10). These items have Likert-scale responses, and the neutral values of 3.0, 2.0, and 1.5 are used as test values, depending on the scale ranges. The one-sample t-test results show that the rated items are more than neutral values. The highest-rated item is approximately how many books (print and digital) with different titles does your school library have (excluding magazines and periodicals) (mean = 5.53, SD = 1.05, and p < 0.05). The lowest-rated item is does your school currently use any incentives (e.g., pay, housing, signing bonus, smaller classes) to recruit or retain teachers in the following fields (mean = 1.72, SD = 0.451, and p < 0.05). Overall, principals have a negative perception toward factor 5: library and instruction resources (mean = 2.76, SD = 0.64013, and p < 0.05) (Table 10).

4.7. School Factors Multiple Regression

Multiple regression analysis was also employed to investigate the influence of school factors on eighth grade students’ mathematics achievement in TIMSS 2015. The student’s achievement in TIMSS 2015 was set as the dependent variable, and the five factors selected as the independent variables. Multiple regression using the enter method was deemed a suitable analysis method [28]. Before conducting the analysis, the relevant assumptions of this statistical analysis were examined. Tests conclude that the data meet the premises of no multicollinearity [29], and no independent errors (Durbin–Watson = 1.527). Further analysis of standard residuals identifies that the data obtained has no outliers (std. residual min = −4.159; std. residual max = 3.360). Scatter plots demonstrate that the assumptions of linearity and homogeneity are all satisfied [30].
A one-way ANOVA was conducted to determine the differences between five plausible values, and the average of five plausible values (Table 11). Student achievement was classified into six groups: first plausible value, second plausible value, third plausible value, fourth plausible value, fifth plausible value, and the average of five plausible values. In that order, there are no outliers. Data are normally distributed for each group, as assessed by the Shapiro–Wilk test (p > 0.05), and variances are homogeneous, as assessed by Levene’s test of homogeneity of variances. In that order, a one-way ANOVA indicates that the differences between all five plausible values and the average of the five plausible value groups are not statistically significant (p = 0.876 > 0.05) (Table 11).
To investigate the effects of school factors (factor 1: general school resources, factor 2: school discipline and safety, factor 3: parental support, factor 4: principal experience and education, and factor 5: library and instruction resources) on students’ achievement in TIMSS 2015, a five-stage multiple regression, using the enter method, was deemed a suitable method of analysis [28]. The purpose of multiple regression is to ascertain the variation in the dependent variable, clarified by the addition of new variables that are not dependent. Still, multiple regression can also be utilized to calculate dependent variable values centered on new values of the variables that are not dependent, and estimate the amount of change in the dependent variable when one unit of the independent variable varies. This unit focuses on clarifying the dependent variable’s proportion, while adding new variables that are not dependent. When explaining and stating findings from multiple regression, we operated through three phases: (a) calculating the regression models that were meant for comparison, (b) deciding whether the multiple regression model was good for the information, and (c) comprehending the coefficients in the multiple regression model [21].
Separate five-stage multiple regressions are conducted to investigate school factors’ effects on students’ achievement on TIMSS 2015 (Table 12). Factor 1: general school resources is entered at stage one of the regressions, as the main predictor, to observe their effects on students’ achievement on TIMSS 2015. Next, factor 2: discipline and safety is entered at stage two. Next, factor 3: parental support, is entered at stage three. Next, factor 4: principal experience and education, is entered at stage four. Factor 5: library and instruction resources is entered at stage five. This order seems plausible to investigate school factors’ effects on students’ achievement in the TIMSS 2015 (Table 12).
Before conducting a multiple regression, the relevant assumptions of this statistical analysis are tested. Firstly, a sample size of 4838 is deemed adequate, given that five independent variables are included in the analysis; Green [31] suggests the rule of thumb to determine the number of participants as appropriate via the formula: N > 50 + 8 m (where m is the number of independent variables). As per this formula, the minimum sample size required is a number greater than 90 (N > 50 + 8(5)) for a moderate relationship among the one dependent and five independent variables. An examination of correlations reveals a statistically significant correlation between achievement and school factors. However, as the collinearity tests indicate, the data meet no multicollinearity assumption [29].
The multiple regression reveals that in model 1, factor 1: general school resources contributes significantly to the regression model (F (1, 4374) = 19.946, p < 0.01). The prediction of students’ achievement in TIMSS 2015 (model 1) (R2 = 0.005) accounts for approximately 0.5% of the total variance in students’ achievement in TIMSS 2015. Adding factor 2: discipline and safety to the prediction of achievement (model 2) brings an improvement over the earlier model, which leads to a statistically significant increase in R2 of 0.029, F (2, 4373) = 64.609, p < 0.01, since it accounts for 2.9% of the total variance. The addition of factor 3: parental support to the prediction of achievement (model 3) leads to a statistically significant increase in R2 of 0.088, F (3, 4372) = 141.308, p < 0.01, and accounts for 8.8% of the total variance. The addition of factor 4: principal experience and education to the prediction of achievement (model 4) leads to a statistically significant increase in R2 of 0.163, F (4, 4371) = 213.486, p < 0.01, and accounts for 16.3% of the total variance. The fifth and final model, comprised of all five predictor factors (factor 1: general school resources, factor 2: discipline and safety, factor 3: parental support, factor 4: principal experience and education, and factor 5: library and instruction resources), in the prediction of student achievement on TIMSS 2015 (model 5), leads to a statistically significant increase in R2 of 0.168, F (1, 4370) = 176.022, p < 0.01, and accounts for 16.8% of the total variance (Table 12).
The ANOVA result (Table 13) indicates that there is a significance in each of the five models (one predictor, two predictors, three predictors, four predictors, and five predictors, respectively.) It is seen that all five models are significant (p < 0.01). In particular, it is noted that the F value is the largest for the model with the fourth predictor. The F values are the overall predictive effects, which are different from the F for the amount of changes in achievement when adding a variable. The p-value of 0.000 < 0.01 for models 1, 2, 3, 4, and 5 implies that the regression model is statistically significant, indicating a significant linear relationship between achievement and general school resources, school discipline and safety, parental support, principal experience and education, and library and instruction resources.
For general school resources, tolerance = 0.922, and VIF = 1.084; factor 2: discipline and safety, tolerance = 0.848, and VIF = 1.179; factor 3: parental support, tolerance = 0.839, and VIF = 1.191; factor 4: principal experience and education, tolerance = 0.942, and VIF = 1.061; and for factor 5: library and instruction resources, tolerance = 0.927, and VIF = 1.079. Furthermore, the data meet the assumption of independent errors (Durbin–Watson = 1.350). An analysis of standard residuals is carried out, which indicates that the data contains no outliers (standard residual min = −3.757, standard residual max = 3.853). Residual and scatter plots indicate the assumptions of linearity and homogeneity are all satisfied [30].
From Table 14, the results of the multiple regression model with five plausible values from student achievement in mathematics show the coefficients for the constant and the five predictors of student achievement in TIMSS 2015. The regression slopes (B) and significance values (alpha) are used to discuss the final model, combining the five factors on student achievement (average). These values are as follows:
(1)
Constant average score for B = 693.615, p = 0.000: significant;
(2)
General school resources B = −0.225, p = 0.880: not significant;
(3)
School discipline and safety B = −9.947, p = 0.000: significant;
(4)
School parental support B = −40.998, p = 0.000: significant;
(5)
Principal experience and education B = −48.932, p = 0.000: significant;
(6)
School library and instruction resources B = −9.545, p = 0.000: significant.
The best-fitting model for predicting student achievement in the TIMSS 2015 from the analysis above is the linear combination of the constant, factor 1: general school resources, factor 2: discipline and safety, factor 3: parental support, factor 4: principal experience and education, and factor 5: library and instruction resources for instruction.
Model 1:
Achievement in math = 693.615 − 0.225 (general school resources) − 9.947 (school discipline and safety) − 40.998 (school parental support) − 48.932 (school principal experience and education) and − 9.545 (school library and instruction resources).
This model indicates that for every one unit increase in general school resources, the achievement declines by 0.225; for one unit increase in school discipline and safety, the achievement declines by 9.947; for one unit increase in school parental support, the achievement declines by 40.998; for one unit increase in school principal experience and education, the achievement declines by 48.932; and for one unit increase in the school library and instruction resources, the achievement declines by 9.545.
In addition, p-value = 0.880 > 0.01 is not a significant level for general school resources; p-value = 0.000 < 0.01 is a significant level for discipline and safety; and p-value = 0.000 < 0.01 for parental support, school principal experience and education, and school library and instruction resources implies that school discipline and safety to the school library and instruction resources are statistically significant and, therefore, have a significant impact on achievement, while general school resources is not statistically significant. Meanwhile, the variance inflation factor for general school resources to the school library and instruction resources is less than five. This shows no multicollinearity among the explanatory variables that satisfy the assumptions that there should not be multicollinearity.

5. Discussion

5.1. General School Resources

School questionnaire results reveal that factor 1: general school resources does not significantly impact students’ achievement in the TIMSS 2015 (B = −3.127, p (0.048) > 0.01). The one-Sample t-test shows that the principal has a negative perception of factor 1: general school resources (mean = 2.4165, SD = 0.88074, and p < 0.05). This finding is in contrast to the results of previous studies. Alenezi [32] finds that general school resources are defined as facilities and services to achieve engaging and effective learning experiences. The technology of instruction plays a significant role in helping students understand what is required of them and effectively approach problem-solving. Similarly, Alenezi [32] also finds that instruction technology significantly improves students’ learning experience.
In Abu Dhabi schools, the school teachers require support and time to use recent technologies and strategies to improve their work, before learning to use them in the teaching process [33]. It is essential to understand the significance of instructional technology in helping eighth grade students perform well in mathematics in the TIMISS. Also, Abed [34] spots the significance of understanding students’ level of math anxiety in the UAE students. Technology may help in reducing such math anxiety, with flexible and multiple learning tools. These students are more able when it comes to using them than previous generations. Technological developments produce novel and advanced techniques to present and instruct students, and there is also a demand for integrating instructional technology in teaching mathematics.
In a study of eighth grade students, it is shown that it is possible to guide students to perform well on mathematics assessments, through the use of educational technology [35]. The students were given training for the Virginia Standards of Learning Mathematics tests by using computer technology and software related to the subject, by providing them access to various websites. When properly used, technology helps teachers present concepts to students more efficiently, and helps students learn with more convenience [36]. Technology also allows students to learn math in a more dynamic way [37]. Nowadays, students are getting many opportunities to connect with technology, as they can have access to it both in school and at home. Most of them are attracted to it by using their iPad, cell phone, or laptops, and they always remain in contact with some form of it. Applying technology in teaching to intensify students’ yearning to study and comprehend mathematics indeed nourishes their cravings to remain in close contact with technology, which positively affects their learning and performance in standardized tests [38,39].

5.2. Discipline and Safety

School discipline and safety significantly impact students’ achievement in the TIMSS 2015 (B = −8.329, p (0.004) < 0.01). One-sample t-test results show that principals have a positive perception of factor 2: school discipline and safety (mean = 1.6013, SD = 0.49186, and p < 0.05). This finding is consistent with the findings of Huguley et al. [40], which show that an eighth grade student needs to be optimally disciplined and, at the same time, feel safe to perform well. The school administration and the teachers are responsible for coming up with rules to be followed in school. They also have the responsibility of providing the students with the necessary safety. When discipline and safety are enhanced, a better learning environment is created, which directly translates to improved performance [41].
Young students in the eighth grade might not fully understand the importance of discipline. These students have a lot of energy, and they want to experiment in different ways. This leads to indiscipline, and can easily result in a lack of safety [42]. If discipline is instilled correctly, and the necessary safety is provided, they perform better. Indiscipline is cited as one of the primary factors that leads to distractions and, therefore, results in poor performance [43]. Safety also plays an integral role where students feel safer meaning they are able to perform well [44]. Kibriya et al. [45] find that safety positively impacts the performance of students in some African countries. There are negative effects of a potentially unsafe classroom and school environment on achievement in math and other disciplines among Rwandan and Tanzanian students [45].
The most critical factors appear to be students’ concerns about school discipline, their relationships with teachers, and their concerns about classroom disruption [46]. Past studies link safety issues in schools with low performance of students in mathematics [47]. According to this structure, the traditional way of dealing with indiscipline, mainly in the classroom, seems insufficient. It suspects that the school-level indiscipline, such as vandalism and illegal use of drugs, may provide shelters or excuses for classroom misbehavior. Classroom disruption can also be a natural reflection of the conflict or tension between teachers and students, and affects mathematics achievements [48]. In other words, if the disciplinary climate is unhealthy at the school level, it may well be problematic at the classroom level. These results of discipline and safety align with the conceptual framework of this research. The school applies public safety to all students equally, in addition to using the rules of discipline within the classroom and the school, so that all students in the school are equal in terms of all safety and discipline rules that are positively reflected with the student’s achievement.

5.3. Parental Support

Parental support significantly impacts students’ achievement in TIMSS 2015 (B = −31.846, p (0.000) < 0.01). A one-sample t-test shows that principals have a positive perception toward factor 3: parental support (mean = 2.3159, SD = 0.55927, and p < 0.05). This finding is somewhat consistent with the results of Davis and Carlo [49], who report that parents play a significant role in students’ education in data collection and analysis, they are an integral part of a student’s performance, and approximately 60% offer a valid response to parental influence on mathematics performance. Davis and Carlo [48] use a simple t-test to determine whether parental support impacts the overall performance of the students in TIMSS. They acquire an overall mean of 2.245, which is <2.5; these results show that parental support has a negative impact on the average performance of the students. Eldeeb [50] reports a high level of parental involvement in the children’s educational outcomes in the same vein. For 60% of the parents (48.6% of whom are highly-educated), parental time with children varies from 3 to 5 h daily. Yet, 57.2% of these parents are aware that they are partly responsible for their children’s educational outcomes, with 52.3% deflecting their low academic achievement in schools [51].
Parents in Abu Dhabi play a significant role in supporting their children in mathematics performance in eighth grade because parents’ support involves certain attributes, such as monitoring their children and motivating them in mathematics content, counseling in relation to mathematics, and providing resources [52]. It is crucial to understand that students with supportive parents tend to perform better in mathematics, and develop a positive attitude towards it [53]. Ridge [54] explains that students with non-supportive parents are likely to develop negative attitudes towards mathematics, hence, perform poorly in it. Students with parents who are motivators, resource providers, and good monitors of their children are better in their mathematics performance. Therefore, parents may have a significant role in ensuring their children achieve better performance when it comes to mathematics, just by being supportive, motivators, resource providers, good advisors, and counselors. Khamis et al. [55] state that parental expectations could be connected to parental pressure, which could have different results, depending on whether it is positive or negative. Research shows that a significant positive predictor of student math achievement is how much parents restrict out-of-school activities [56].

5.4. Principal Experience and Education

School principals with experience and high education qualifications significantly impact students’ achievement in TIMSS 2015 (B = −30.126, p (0.000) < 0.01). A one-sample t-test shows that the principals have a positive perception of factor 4: principal experience and education (mean = 2.3159, SD = 0.55927, and p < 0.05). This finding is consistent with the results of Huguley et al. [40] in those principals with 20 years and above having a positive perception and awareness of students’ achievement. Lubienski, Lubienski, and Crane [57] report similar findings, and they observe that principals with higher qualifications portray the school climate as positive, to obtain higher achievement scores. Similarly, Gentilucci and Muto (Ref. [58]) suggest that students identify direct and highly influential instructional leadership behaviors. Among these are principal approachability, interactive classroom observation/visitation, and instructional leadership behaviors that firmly establish administrators as the “principal teachers” in their respective schools. According to Incikabi et al. [59], the principal’s experience plays a vital role in determining and influencing teachers’ professional development. That reflects in teachers helping their students achieve better performance in their education [60].
Vale et al. [61] report that principals significantly affect students’ math outcomes. Much of the effect is likely related to the match between the principal and the school; a principal’s education also plays a small role in improving students’ scores. Principals with high value-added increase test scores, while low value-added or new principals reduce scores [62]. Despite examining a variety of school inputs and outcomes, we could find only part of the puzzle to help us disentangle the contributions that high- and low-value-added principals make to their schools and students [63].

5.5. Library and Instruction Resources

Library and instruction resources significantly affects students’ achievement in the TIMSS 2015 (B = −9.784, p (0.000) < 0.01); and a one-sample t-test shows that principals have a negative perception toward factor 5: library and instruction resources (mean = 2.7595, SD = 0.64013, and p < 0.05). This finding is consistent with Oddone’s [64] study that shows that students obtain only about 20% of their learning through teaching. The student’s responsibility is to research and find more details regarding what is taught in class. Oddone [64] conducted an ANOVA test where students were examined, and it is determined that students obtain 80% insight from the library and only 20% from class teaching. Therefore, library and instructional resources need to be provided for a student to learn mathematics more effectively.
Some of the most critical components that affect performance in a TIMSS class include library and instruction resources. So, in Abu Dhabi schools, students need resources that provide more insight in addition to what is taught in the class. The resources are also helpful because they can be used at almost any time. This study shows that students with access to these resources tend to perform better. The schools have the responsibility of providing these resources. A student can also decide to acquire these resources independently, to better his or her education. Library resources complement the education provided in class. A student can use these resources to practice what was taught in class. The student needs to choose the appropriate resources that resonate with the lessons learned in class [57]. Al-Yateem [44] reports library services as one of the services needed to upgrade students’ knowledge. It is a place for self-development.
The finding is similar to studies conducted in the past to understand the concept of library services in the school setting. Most of the studies describe library services in different versions [65]. A library is a place where necessary materials (print and non-print materials) are put in place for self-development. A library is the collection of newspapers, books, tapes, television, etc., which are kept for students and staff to use during and after school hours. The library is essential in the learning process. The books control the learning process. The academic library aims to enhance users’ knowledge for their betterment [66].
The five factors related to school and classroom environment, together with leadership quality of school principals, seem to have a significant role in students’ achievement in mathematics in TIMSS 2015, and possibly other years too. While considering school planning and educational polies, other factors such as mathematics teachers’ perceptions of TIMSS [39], and interdisciplinary approaches to collaboration, communication, and creative educational practices could be enhanced, with greater prospects, decentralized priorities, and STEM/STEAM movement as a process [67] to improve students’ achievement in mathematics and science in TIMSS, PISA, and PIRLS. Therefore, these five school factors should be studied in conjunction with other factors related to teachers, students, parents, and interdisciplinary activities.

6. Conclusions

This study aimed to examine how school factors influenced students’ performance in the Trends in International Mathematics and Science Study (TIMSS) in schools in the Emirate of Abu Dhabi, in the UAE. A total of 4838 eighth grade students, with 2172 females, 2666 males, and 156 Abu Dhabi school principals, taken from TIMSS 2015, data were the sample in the study. Principal component analysis (PCA) was used on 77 questions from a school questionnaire that was given to school administrators in order to gather information about the teaching and learning environments in their schools. One sample t-tests were performed for each of the five components, such as general school resources, school discipline and safety, parental support, principal experience and education, and library and instruction resources, to understand the participant views about the school environment. Overall, the school principals seem to possess a negative perception toward general school resources, principal experience and education, and library and instruction resources indicating these factors are not adequate to support schools. However, they have a positive perception toward school discipline and safety, and parental support to schools, indicating that these factors are important for maintaining the school environment. The multiple regression models show that all the five models are statistically significant by entering one, two, three, four, and five independent variables, such as those named above. One factor, general school resources, is a statically significant factor when combined with the other four or five factors to predict students’ achievement in mathematics (in models 4 and 5). This also indicates a significant linear association between students’ achievement and school factor characteristics in TIMSS 2015. There is a need to increase and improve school-related activities, and create a conducive atmosphere in which children can learn and improve their academic accomplishments in TIMSS, and other national and international tests in the UAE in general, and the Emirate of Abu Dhabi in particular.

Author Contributions

Conceptualization, Y.W. and S.B.; methodology, Y.W., S.B. and H.D.; software, Y.W. and S.B.; validation, Y.W., S.B., H.T., R.A.T., M.E. and H.D.; formal analysis, Y.W. and S.B.; investigation, Y.W.; resources, Y.W., S.B., H.T., R.A.T. and M.E.; data curation, Y.W. and S.B.; writing—original draft preparation, Y.W.; writing—review and editing, S.B., H.T., R.A.T., M.E. and H.D.; visualization, Y.W., S.B. and H.D.; supervision, S.B., H.T., R.A.T., M.E. and H.D.; project administration, Y.W. and S.B.; funding acquisition, Y.W. All authors have read and agreed to the published version of the manuscript.

Funding

This research received no external funding. The APC cost was covered by the College of Education, United Arab Emirates University under graduate student research fund.

Institutional Review Board Statement

The study was conducted in accordance with the Declaration of Helsinki, and approved by the Ethics Committee of United Arab Emirates University protocol code ERS_2020_6205 and date of approval was 22 October 2020.

Informed Consent Statement

Informed consent was not needed as the study was based on publicly available TIMSS 2015 data from TIMSS & PRILS International Study Center, Lynch School of Education, Boston College (https://timssandpirls.bc.edu/timss2015/international-database/).

Data Availability Statement

The data for the study is publicly available from TIMSS & PIRLS International Study Center, Lynch School of Education, Boston College (https://timssandpirls.bc.edu/timss2015/international-database/).

Conflicts of Interest

The authors declare no conflict of interest.

References

  1. National Center for Education Statistics. Trends in International Mathematics and Science Study (TIMSS): Participating Countries. 2020. Available online: https://nces.ed.gov/timss/participation.asp (accessed on 20 January 2021).
  2. Mullis, I.V.S.; Martin, M.O.; Foy, P.; Hooper, M.; TIMSS 2015 International Results in Mathematics. Retrieved from Boston College, TIMSS & PIRLS International Study Center. 2016. Available online: http://timssandpirls.bc.edu/timss2015/international-results/ (accessed on 18 September 2019).
  3. Hooper, M.; Mullis, I.V.S.; Martin, M.O. TIMSS 2015 context questionnaire framework. In TIMSS 2015 Assessment Frameworks; Mullis, I.V.S., Martin, M.O., Eds.; TIMSS & PIRLS International Study Center, Lynch School of Education, Boston College: Boston, MA, USA, 2015; pp. 61–82. Available online: https://timssandpirls.bc.edu/timss2015/downloads/T15_Frameworks_Full_Book.pdf (accessed on 13 June 2022).
  4. Greenwald, R.; Hedges, L.V.; Laine, R.D. The effect of school resources on student achievement. Rev. Educ. Res. 1996, 66, 361–396. [Google Scholar] [CrossRef]
  5. Maxwell, S.; Reynolds, K.J.; Lee, E.; Subasic, E.; Bromhead, D. The impact of school climate and school identification on academic achievement: Multilevel modeling with student and teacher data. Front. Psychol. 2017, 8, 2069. [Google Scholar] [CrossRef] [PubMed] [Green Version]
  6. Collins, T.N.; Parson, K.A. School climate and student outcomes. J. Cross Discip. Perspect. Educ. 2010, 3, 34–39. Available online: https://wmpeople.wm.edu/asset/index/mxtsch/collinsparsonsschoolclimateandstudentoutcomespdf (accessed on 17 November 2021).
  7. Garbacz, S.A.; Herman, K.C.; Thompson, A.M.; Reinke, W.M. Family engagement in education and intervention: Implementation and evaluation to maximize family, school, and student outcomes. J. Sch. Psychol. 2017, 62, 1–10. [Google Scholar] [CrossRef]
  8. Lara, L.; Saracostti, M. Effect of parental involvement on children’s academic achievement in Chile. Front. Psychol. 2019, 10, 1464. [Google Scholar] [CrossRef]
  9. UCHICAGO Consortium on School Research. How Do Principals Influence Student Achievement? 2018. Available online: https://consortium.uchicago.edu/sites/default/files/2018-10/Leadership%20Snapshot-Mar2018-Consortium.pdf (accessed on 20 December 2021).
  10. Dulay, S.; Karadag, E. The effect of school climate on student achievement. In The Factors Effecting Student Achievement: Meta-Analysis of Empirical Studies; Karadag, E., Ed.; Springer: Cham, Switzerland, 2017; pp. 199–213. [Google Scholar] [CrossRef]
  11. Gustafsson, J.; Nilsen, T.; Hansen, K.Y. School characteristics moderating the relation between student socioeconomic status and mathematics achievement in grade 8. Evidence from 50 countries in TIMSS 2011. Stud. Educ. Eval. 2018, 57, 16–30. [Google Scholar] [CrossRef]
  12. Izumi, Y.A.M.A.S.A.K.I. The effect of parental involvement on student achievement in junior secondary school: Examining data from the Botswana TIMSS 2007. J. Int. Coop. Stud. 2013, 21, 96–117. [Google Scholar]
  13. Joseph, E.U. School variables and mathematics performance among students in Akwa Ibom State. Int. J. Dev. Sustain. 2014, 3, 1558–1568. [Google Scholar]
  14. Lamb, S.; Fullarton, S. Classroom and school factors affecting mathematics achievement: A comparative study of Australia and the United States using TIMSS. Aust. J. Educ. 2002, 46, 154–171. [Google Scholar] [CrossRef]
  15. Malik, R.H.; Rizvi, A.A. Effect of classroom learning environment on students’ academic achievement in mathematics at secondary level. Bull. Educ. Res. 2018, 40, 207–218. [Google Scholar]
  16. Sheldon, S.B.; Epstein, J.L.; Galindo, C.L. Not just numbers: Creating a partnership climate to improve math proficiency in schools. Leadersh. Policy Sch. 2010, 9, 27–48. [Google Scholar] [CrossRef] [PubMed] [Green Version]
  17. Bowen, G.L.; Hopson, L.M.; Rose, R.A.; Glennie, E.J. Students’ perceived parental school behavior expectations and their academic performance: A longitudinal analysis. Fam. Relat. 2012, 61, 175–191. [Google Scholar] [CrossRef]
  18. Martin, M.O.; Mullis, I.V.; Foy, P.; Stanco, G.M. TIMSS 2011 International Results in Science; International Association for the Evaluation of Educational Achievement. 2012. Available online: https://timssandpirls.bc.edu/timss2011/downloads/T11_IR_Science_FullBook.pdf (accessed on 13 June 2022).
  19. TIMSS & PIRLS International Study Center. TIMSS: Trends in International Mathematics and Science Study. Available online: https://timssandpirls.bc.edu/timss-landing.html (accessed on 17 February 2021).
  20. LaRoche, S.; Foy, P. Sample implementation in TIMSS 2015. In Methods and Procedures in TIMSS 2015; Martin, M.O., Mullis, I.V.S., Hooper, M., Eds.; TIMSS & PIRLS International Study Center, Lynch School of Education, Boston College: Boston, MA, USA, 2016; pp. 5.1–5.175. Available online: https://timssandpirls.bc.edu/publications/timss/2015-methods/T15-Methods-and-Procedures-TIMSS-2015.pdf (accessed on 13 June 2022).
  21. Johansone, I. Survey operations procedures in TIMSS 2015. In Methods and procedures in TIMSS 2015; Martin, M.O., Mullis, I.V.S., Hooper, M., Eds.; TIMSS & PIRLS International Study Center, Lynch School of Education, Boston College: Boston, MA, USA, 2016; pp. 6.1–6.22. Available online: https://timssandpirls.bc.edu/publications/timss/2015-methods.html (accessed on 13 June 2022).
  22. Emirates News Agency WAM. Abu Dhabi Schools Students Participate in TIMSS 2015. 18 February 2015. Available online: http://wam.ae/en/details/1395276704747 (accessed on 13 June 2022).
  23. Drent, M.; Meelissen, M.R.M.; van der Kleij, F.M. The contribution of TIMSS to the link between school and classroom factors and student achievement. J. Curric. Stud. 2012, 45, 198–224. [Google Scholar] [CrossRef]
  24. Chan, L.L.; Idris, N. Validity and reliability of the instrument using exploratory factor analysis and Cronbach’s alpha. Int. J. Acad. Res. Bus. Soc. Sci. 2017, 7, 400–410. [Google Scholar]
  25. Straub, D.; Boudreau, M.C.; Gefen, D. Validation guidelines for IS positivist research. Commun. Assoc. Inf. Syst. 2004, 13, 24. [Google Scholar] [CrossRef]
  26. Osborne, J.W. What is rotating in exploratory factor analysis? Pract. Assess. Res. Eval. 2015, 20, 2. [Google Scholar] [CrossRef]
  27. Cho, M.O. A Comparison of the Effectiveness of Science Education in Korea and South Africa: A Multilevel Analysis of TIMSS 2003 Data. Doctoral Dissertation, University of Pretoria, Pretoria, South Africa, 2011. Available online: http://hdl.handle.net/2263/28600 (accessed on 15 January 2022).
  28. Bos, K.; Kuiper, W. Modelling TIMSS data in a European comparative perspective: Exploring influencing factors on achievement in mathematics in grade 8. Educ. Res. Eval. 1999, 5, 157–179. [Google Scholar] [CrossRef]
  29. Coakes, S.J.; Steed, L.G.; Ong, C. SPSS: Analysis without Anguish: Version 16 for Windows; John Wiley & Sons: Milton, Australia, 2009. Available online: https://nla.gov.au/nla.cat-vn4406035 (accessed on 17 March 2020).
  30. Hair, J.F., Jr.; Black, W.C.; Babin, B.J.; Anderson, R.E.; Tatham, R.L. Multivariate Data Analysis; Prentice Hall: Upper Saddle River, NJ, USA, 2010. [Google Scholar]
  31. Green, S. How many subjects does it take to do a regression analysis. Multivar. Behav. Res. 1991, 26, 499–510. [Google Scholar] [CrossRef]
  32. Alenezi, A. Obstacles for teachers to integrate technology with instruction. Educ. Inf. Technol. 2017, 22, 1797–1816. [Google Scholar] [CrossRef]
  33. Hamad, S.; Tairab, H.; Wardat, Y.; Rabbani, L.; AlArabi, K.; Yousif, M.; Abu-Al-Aish, A.; Stoica, G. Understanding science teachers’ implementations of integrated stem: Teacher perceptions and practice. Sustainability 2022, 14, 3594. [Google Scholar] [CrossRef]
  34. Abed, A.S. Mathematics anxiety among eighth-grade students of the United Arab Emirates. Psychol. Rep. 2001, 89, 65. [Google Scholar] [CrossRef]
  35. Najm, N.A. Arab culture dimensions in the international and Arab models. Am. J. Bus. Econ. Manag. 2015, 3, 423–431. [Google Scholar]
  36. Alotaibi, A.; Khalil, I.; Wardat, Y. Teaching practices of the mathematics male and female teachers according to the PISA framework and its relation to their beliefs towards their students. Elem. Educ. Online 2021, 20, 1247–1265. [Google Scholar] [CrossRef]
  37. Harb, N.; El-shaarawi, A. Factors affecting business students’ performance: The case of students in United Arab Emirates. J. Educ. Bus. 2007, 82, 282–290. [Google Scholar] [CrossRef] [Green Version]
  38. Viberg, O.; Gronlund, A.; Andersson, A. Integrting digital technology in mathematics education: A Swedish case study. Interact. Learn. Environ. 2020; 1–12. [Google Scholar] [CrossRef]
  39. Wardat, Y.; Belbase, S.; Tairab, H. Mathematics teachers’ perceptions of trends in international mathematics and science study (TIMSS)-related practices in Abu Dhabi Emirate schools. Sustainability 2022, 14, 5436. [Google Scholar] [CrossRef]
  40. Huguley, J.P.; Wang, M.; Pasarow, S.; Wallace, J.M. Just discipline in schools: An integrated and interdisciplinary approach. Child. Sch. 2020, 42, 195–199. [Google Scholar] [CrossRef]
  41. Bdeir, R. Investigating the Progress of Dubai Private Schools’ PISA and TIMSS Results and School Inspection Reports from 2011 to 2018. Ph.D. Thesis, The British University in Dubai (BUiD), Dubai, United Arab Emirates, 2019. [Google Scholar]
  42. Booren, L.M.; Handy, D.J.; Power, T.G. Examining perceptions of school safety strategies, school climate, and violence. Youth Violence Juv. Justice 2011, 9, 171–187. [Google Scholar] [CrossRef]
  43. Mullis, I.V.S.; Martin, M.O.; Foy, P.; Kelly, D.L.; Fishbein, B. TIMSS 2019 International Results in Mathematics and Science. Retrieved from Boston College, TIMSS & PIRLS International Study Center. 2020. Available online: https://timssandpirls.bc.edu/timss2019/international-results/ (accessed on 20 December 2019).
  44. Kutsyuruba, B.; Klinger, D.A.; Hussain, A. Relationships among school climate, school safety, and student achievement and well-being: A review of the literature. Rev. Educ. 2015, 3, 103–135. [Google Scholar] [CrossRef]
  45. Kibriya, S.; Zhou, S.; Zhang, Y.; Fatema, N. The Effects of School Safety on Academic Achievement. United States Agency for International Development (USAID). 2018. Available online: https://pdf.usaid.gov/pdf_docs/PA00TGVG.pdf (accessed on 13 June 2022).
  46. Whisman, A.; Hammer, P.C. The Association between School Discipline and Mathematics Performance: A Case for Positive Discipline Approaches. West Virginia Department of Education Office of Research. 2014. Available online: https://files.eric.ed.gov/fulltext/ED569903.pdf (accessed on 14 June 2022).
  47. Zhang, A.; Wang, K.; Zhang, J.; Oudekerk, B.A. Indicators of School Crime and Safety: 2018 (NCES 2019-047/NCJ 252571). National Center for Education Statistics. 2019. Available online: https://nces.ed.gov/pubs2019/2019047.pdf (accessed on 27 February 2022).
  48. Bodovski, K.; Nahum-Shani, I.; Walsh, R. School disciplinary climate and students’ early mathematics learning: Another search for contextual effects? Am. J. Educ. 2013, 119, 209–234. Available online: http://eric.ed.gov/?id=EJ1003815 (accessed on 14 June 2022). [CrossRef]
  49. Davis, A.N.; Carlo, G. The roles of parenting practices, sociocognitive/emotive traits, and prosocial behaviors in low-income adolescents. J. Adolesc. 2018, 62, 140–150. [Google Scholar] [CrossRef] [PubMed]
  50. Eldeeb, A.M.Z. The Impact of Parental Involvement on Academic Student Achievement. Ph.D. Thesis, The British University in Dubai (BUiD), Dubai, United Arab Emirates, 2012. [Google Scholar]
  51. Wagie, D.; Fox, W. Transforming Higher Education in the United Arab Emirates (UAE): Contributing to Social Progress and the New Economy. Int. J. Learn. Annu. Rev. 2006, 12, 277–286. [Google Scholar] [CrossRef]
  52. Alhashmi, S.F.; Salloum, S.A.; Abdallah, S. Critical success factors for implementing artificial intelligence (AI) projects in Dubai government United Arab Emirates (UAE) health sector: Applying the extended technology acceptance model (TAM). In Advances in Intelligent Systems and Computing, Proceedings of the International Conference on Advanced Intelligent Systems and Informatics 2019, Cairo, Egypt, 26–28 October 2019; Hassanien, A., Shaalan, K., Tolba, M., Eds.; Springer: Cham, Switzerland, 2019; Volume 1058, pp. 393–405. [Google Scholar] [CrossRef]
  53. Ersan, O.; Rodriguez, M.C. Socioeconomic status and beyond: A multilevel analysis of TIMSS mathematics achievement given student and school context in Turkey. Large-Scale Assessments Educ. 2020, 8, 1–32. [Google Scholar] [CrossRef]
  54. Ridge, N. Teacher Quality, Gender and Nationality in the United Arab Emirates: A Crisis for Boys; Dubai School of Government: Dubai, United Arab Emirates, 2010; Available online: https://www.arabdevelopmentportal.com/publication/teacher-quality-gender-and-nationality-united-arab-emirates-crisis-boys (accessed on 11 May 2021).
  55. Khamis, V.; Dukmak, S.; Elhoweris, H. Factors affecting the motivation to learn among United Arab Emirates middle and high school students. Educ. Stud. 2008, 34, 191–200. [Google Scholar] [CrossRef]
  56. Dukmak, S.; Ishtaiwa, F.F. Factors influencing the academic achievement of students in the preparatory and secondary schools of the United Arab Emirates. Eur. J. Soc. Sci. 2015, 46, 132–148. [Google Scholar]
  57. Lubienski, S.T.; Lubienski, C.; Crane, C.C. Achievement Differences and School Type: The Role of School Climate, Teacher Certification, and Instruction. Am. J. Educ. 2008, 115, 97–138. [Google Scholar] [CrossRef] [Green Version]
  58. Gentilucci, J.L.; Muto, C.C. Principals’ influence on academic achievement: The student perspective. NASSP Bull. 2007, 91, 219–236. [Google Scholar] [CrossRef]
  59. Incikabi, L.; Kepceoglu, I.; Pektas, M. Gamification of middle school mathematics and science: Game-playing for learning. In Handbook of Research on Integrating Computer Science and Computational Thinking in K-12 Education; IGI Global: Hershey, PA, USA, 2020; pp. 301–316. [Google Scholar]
  60. Mignani, S.; Shi, X.; Rodrigues, J.; Tomas, H.; Karpus, A.; Majoral, J.P. First-in-class and best-in-class dendrimer nanoplatforms from concept to clinic: Lessons learned moving forward. Eur. J. Med. Chem. 2021, 219, 113456. [Google Scholar] [CrossRef]
  61. Vale, C.; Davies, A.; Weaven, M.; Hooley, N.; Davidson, K.; Loton, D. Leadership to improve mathematics outcomes in low SES schools and school networks. Math. Teach. Educ. Dev. 2010, 12, 47–71. Available online: https://files.eric.ed.gov/fulltext/EJ940921.pdf (accessed on 14 December 2021).
  62. Zaharna, R. Understanding cultural preferences of Arab communication patterns. Public Relations Rev. 1995, 21, 241–255. [Google Scholar] [CrossRef]
  63. Vally, Z.; Salloum, L.; AlQedra, D.; El Shazly, S.; Albloshi, M.; Alsheraifi, S.; Alkaabi, A. Examining the effects of creativity training on creative production, creative self-efficacy, and neuro-executive functioning. Think. Ski. Creat. 2019, 31, 70–78. [Google Scholar] [CrossRef]
  64. Oddone, K. The Importance of School Libraries in the Google Age. 2016. Available online: https://tinyurl.com/munxb2pu (accessed on 1 May 2022).
  65. Alghizzawi, M.; Habes, M.; Salloum, S.A.; Ghani, M.A.; Mhamdi, C.; Shaalan, K. The effect of social media usage on students’ eLearning acceptance in higher education: A case study from the United Arab Emirates. Int. J. Inf. Technol. Lang. Stud. 2019, 3, 13–26. Available online: https://journals.sfu.ca/ijitls/index.php/ijitls/article/view/109 (accessed on 13 June 2022).
  66. Daleure, G.M.; Albon, R.; Hinkston, K.; Ajaif, T.; McKeown, J. Family involvement in Emirati college student education and linkages to high and low achievement in the context of the United Arab Emirates. FIRE Forum Int. Res. Educ. 2014, 1, 2. [Google Scholar] [CrossRef] [Green Version]
  67. Belbase, S.; Mainali, B.R.; Kasemsukpipat, W.; Tairab, H.; Gochoo, M.; Jarrah, A. At the dawn of science, technology, engineering, arts, and mathematics (STEAM) education: Prospects, priorities, processes, and problems. Int. J. Math. Educ. Sci. Technol. 2021; online first. [Google Scholar] [CrossRef]
Figure 1. Plot of eigenvalues from exploratory factor analysis of the school questionnaire variables.
Education 12 00424 g001
Table 1. School questionnaire items (Martin et al., 2016).
CategoriesNumber of QuestionsTotal
School enrolment and characteristicsQ1, Q2, Q3(a–b), Q4, Q5(a–b), Q6(a–b)9
Instructional timeQ7(a–c), Q8(a–b), Q9(a–b)7
Resources and technologyQ10, Q11(a–b), Q12(a–b), Q13A(a–i), Q13B(a–e), Q13C(a–e)24
School emphasis on academic successQ14(a–m)13
School discipline and safetyQ15(a–k)11
Teachers in your schoolQ16(a–c), Q17(a–c), Q18(a–b)8
Principal experience and educationQ19, Q20, Q21, Q22(a–b)5
Total 77
Table 2. Participants of TIMSS 8th grade mathematics test in Abu Dhabi.
CountryNumber of SchoolsNumber of StudentsThe Average Age of StudentsNumber of MalesNumber of Females
UAE\Abu Dhabi156483813.9 years26662172
Table 3. KMO and Bartlett’s test.
Kaiser–Meyer–Olkin measure of sampling adequacy.0.771
Bartlett’s test of sphericity
a. based on correlations
Approx. chi-square24,302.067
Df1770
Sig.0.000
Table 4. Exploratory factor analysis of school questionnaire.
Initial EigenvaluesExtraction Sums of Squared LoadingsRotation Sums of Squared Loadings
Total% of VarianceCumulative %Total% of VarianceCumulative %Total% of VarianceCumulative %
10.39217.32017.32010.39217.32017.3209.15415.25715.257
8.71014.51731.8378.71014.51731.8377.16211.93727.194
4.7137.85539.6934.7137.85539.6936.99111.65138.845
3.3835.63845.3313.3835.63845.3313.5865.97744.823
2.5384.23049.5612.5384.23049.5612.8434.73849.561
1.9283.21352.774
1.8493.08155.855
1.5132.52258.377
Extraction method: principal component analysis.
Table 5. School questionnaire factor analysis and reliability statistics.
NoItem CodeItemLoading FactorsCronbach’s AlphaSchool Factors
1BCBG13AEGen\Shortage\Gen\Instructional Space0.860.95
(14 items)
Factor 1: general school resources
BCBG13ADGen\Shortage\Gen\Heating Systems0.84
BCBG13AFGen\Shortage\Gen\Technological Staff0.84
BCBG13AAGen\Shortage\Gen\Instructional Material0.84
BCBG13AGGen\Shortage\Gen\Audio-Video Res0.82
BCBG13ACGen\Shortage\Gen\School Buildings0.84
BCBG13ABGen\Shortage\Gen\Supplies0.82
BCBG13BEGen\Shortage\Math\Concrete Objects0.81
BCBG13AHGen\Shortage\Gen\Comp Technology0.81
BCBG13BAGen\Shortage\Math\Teach Spec Math0.80
BCBG13BCGen\Shortage\Math\Library Resources0.75
BCBG13BDGen\Shortage\Math\Calculators0.73
BCBG13BBGen\Shortage\Math\Computer Software0.64
BCBG13AIGen\Shortage\Gen\Resources Std With Disab0.43
BCBG15FGen\Degree Probs\Vandalism0.810.903
(12 items)
Factor 2: school discipline and safety
BCBG15JGen\Degree Probs\Intimidation Of Teacher0.79
BCBG15GGen\Degree Probs\Theft0.78
BCBG15EGen\Degree Probs\Profanity0.77
BCBG15HGen\Degree Probs\Intimidation Among Stud0.74
BCBG15IGen\Degree Probs\Physical Injury0.73
BCBG15DGen\Degree Probs\Cheating0.68
BCBG15CGen\Degree Probs\Classroom Disturbance0.68
BCBG15AGen\Degree Probs\Arriving Late At School0.66
BCBG18AGen\Degree Probs Teach\Arriving Late At School0.61
BCBG18BGen\Degree Probs Teach\Absenteeism0.59
BCBG15KGen\Degree Probs\Physical Injury To Tch0.59
BCBG14CGen\Sch Character\Tch Expectations0.830.917
(13 items)
Factor 3: parental support
BCBG14EGen\Sch Character\Tchrs Ability To Inspire0.79
BCBG14BGen\Sch Character\Tch Success0.78
BCBG14KGen\Sch Character\Std Desire To Do Well0.74
BCBG14AGen\Sch Character\Tch Understanding0.73
BCBG14DGen\Sch Character\Tchrs Working Together0.72
BCBG14GGen\Sch Character\Parental Commitment0.70
BCBG14IGen\Sch Character\Parental Support0.65
BCBG14LGen\Sch Character\Ability To Reach Goals0.65
BCBG14JGen\Sch Character\Parental Pressure0.63
BCBG14HGen\Sch Character\Parental Expectations0.63
BCBG14FGen\Sch Character\Parental Involvement0.58
BCBG14MGen\Sch Character\Respect For Classmates0.51
BCBG21RSCHOOLGen\Highest Level Of Formal Education (Reverse)0.690.572
(5 items)
Factor 4: principal experience and education
BCBG04RSCHOOLGen\Percent Of Students <Lang Of Test> (Reverse)0.68
BCBG22AGen\Degrees In Education Leadership\Isced 70.49
BCBG22BGen\Degrees In Education Leadership\Isced 80.49
BCBG03AGen\Students Background\Economic Disadva0.38
BCBG12BBRSCHOOLGen\Magazines In Library\Digital (Reverse)0.550.695
(7 items)
Factor 5: library and instruction resources
BCBG03BRSCHOOLGen\Students Background\Economic Affluent (Reverse)0.55
BCBG12BARSCHOOLGen\Magazines In Library\Print (Reverse)0.54
BCBG08AGen\Have Place For Schoolwork0.47
BCBG12ABRSCHOOLGen\Books In Library\Digital (Reverse)0.46
BCBG12AARSCHOOLGen\Books In Library\Print (Reverse)0.39
BCBG17AGen\Use Incentives\Math0.30
(Reverse item): means that the numerical scoring scale runs in the opposite direction. So, in the above items: strongly disagree attracts a score of 5, disagree is 4, neutral still equals 3, agree becomes 2, and strongly agree = 1.
Table 6. Descriptive statistics and one-sample t-test for the components of factor 1: general school resources.
One-Sample Statistics and t-Test (Test Value = 2.5)
ItemsNMeanStd. DeviationMean Differencet-ValueSig. (2-Tailed)Confident and Not Confident
Factor 1: general school resources43762.420.881−0.083−6.2710.000SN
GEN\SHORTAGE\GEN\INSTRUCTIONAL SPACE43762.541.2300.0442.3470.019N
GEN\SHORTAGE\GEN\HEATING SYSTEMS43762.451.253−0.046−2.4370.015N
GEN\SHORTAGE\GEN\TECHNOLOGICAL STAFF43212.341.064−0.157−9.6710.000SN
GEN\SHORTAGE\GEN\INSTRUCTIONAL MATERIAL43762.371.199−0.135−7.4290.000SN
GEN\SHORTAGE\GEN\AUDIO-VIDEO RES43762.341.063−0.156−9.6840.000SN
GEN\SHORTAGE\GEN\SCHOOL BUILDINGS43762.531.1430.0281.6400.101N
GEN\SHORTAGE\GEN\SUPPLIES43762.151.186−0.349−19.4810.000SN
GEN\SHORTAGE\MATH\CONCRETE OBJECTS42972.410.936−0.091−6.3490.000SN
GEN\SHORTAGE\GEN\COMP TECHNOLOGY43462.481.042−0.019−1.1940.233N
GEN\SHORTAGE\MATH\TEACH SPEC MATH43762.611.3020.1125.7030.000SP
GEN\SHORTAGE\MATH\LIBRARY RESOURCES42902.370.939−0.131−9.1360.000SN
GEN\SHORTAGE\MATH\CALCULATORS42862.261.140−0.237−13.6020.000SN
GEN\SHORTAGE\MATH\COMPUTER SOFTWARE43212.530.9860.0291.9360.053N
GEN\SHORTAGE\GEN\RESOURCES STD WITH DISAB42182.351.128−0.147−8.4370.000SN
Note: significant positive [SP], significant negative [SN], neutral [N].
Table 7. Descriptive statistics and one-sample t-test for the components of factor 2: school discipline and safety (test value = 2.5).
ItemsNMeanStd. DeviationMean Differencet-ValueSig. (2-Tailed)Confident and Not Confident
Factor 2: school discipline and safety44221.600.492−0.89869−121.5000.000SP
GEN\DEGREE PROBS\VANDALISM44221.560.732−0.942−85.5520.000SP
GEN\DEGREE PROBS\INTIMIDATION OF TEACHER44221.280.558−1.221−145.5000.000SP
GEN\DEGREE PROBS\THEFT43951.250.532−1.254−156.1820.000SP
GEN\DEGREE PROBS\PROFANITY43401.720.775−0.782−66.5210.000SP
GEN\DEGREE PROBS\INTIMIDATION AMONG STUD43661.590.711−0.914−84.9410.000SP
GEN\DEGREE PROBS\PHYSICAL INJURY44221.760.729−0.743−67.7530.000SP
GEN\DEGREE PROBS\CHEATING44111.510.640−0.994−103.2000.000SP
GEN\DEGREE PROBS\CLASSROOM DISTURBANCE44222.060.745−0.436−38.9620.000SP
GEN\DEGREE PROBS\ARRIVING LATE AT SCHOOL44221.920.672−0.578−57.1930.000SP
GEN\DEGREE PROBS TEACH\ARRIVING LATE AT SCHOOL43991.620.837−0.880−69.7460.000SP
GEN\DEGREE PROBS TEACH\ABSENTEEISM43991.930.882−0.573−43.1080.000SP
GEN\DEGREE PROBS\PHYSICAL INJURY TO TCH43961.100.403−1.400−230.4540.000SP
Note: significant positive [SP], significant negative [SN], neutral [N].
Table 8. Descriptive statistics and one-sample t-test for the components of factor 3: parental support one-sample statistics and t-test (test value = 3.0).
NoItemsNMeanStd. DeviationMean Differencet-ValueSig. (2-Tailed)Confident or Not Confident
Factor 3: parental support44222.320.559−0.684−81.3380.000SP
GEN\SCH CHARACTER\TCH EXPECTATIONS43562.210.686−0.787−75.7670.000SP
GEN\SCH CHARACTER\TCHRS ABILITY TO INSPIRE43322.040.761−0.965−83.4100.000SP
GEN\SCH CHARACTER\TCH SUCCESS43561.960.701−1.041−97.9820.000SP
GEN\SCH CHARACTER\STD DESIRE TO DO WELL43962.310.806−0.689−56.6280.000SP
GEN\SCH CHARACTER\TCH UNDERSTANDING44221.820.666−1.177−117.5390.000SP
GEN\SCH CHARACTER\TCHRS WORKING TOGETHER43301.990.743−1.008−89.2250.000SP
GEN\SCH CHARACTER\PARENTAL COMMITMENT44222.840.881−0.161−12.1820.000SP
GEN\SCH CHARACTER\PARENTAL SUPPORT44222.770.829−0.230−18.4400.000SP
GEN\SCH CHARACTER\ABILITY TO REACH GOALS43672.360.650−0.640−65.0780.000SP
GEN\SCH CHARACTER\PARENTAL PRESSURE44222.420.837−0.582−46.2230.000SP
GEN\SCH CHARACTER\PARENTAL EXPECTATIONS44222.400.796−0.597−49.8510.000SP
GEN\SCH CHARACTER\PARENTAL INVOLVEMENT44223.111.0400.1147.3160.000SN
GEN\SCH CHARACTER\RESPECT FOR CLASSMATES44221.850.694−1.146−109.8020.000SP
Table 9. Descriptive statistics and one-sample t-test for the components of factor 4: principal experience and education (test value = 1.5 *, 2.5 **, 3 ***).
ItemsNMeanStd. DeviationMean Differencet-ValueSig. (2-Tailed)Confident and Not Confident
GEN\HIGHEST LEVEL OF FORMAL EDUCATION REVERSE**43892.350.6750.14814.5790.000SP
GEN\DEGREES IN EDUCATION LEADERSHIP\ISCED 7*40661.750.435−0.754−110.4360.000SN
GEN\DEGREES IN EDUCATION LEADERSHIP\ISCED 8 *35141.930.252−0.568−133.7200.000SN
GEN\STUDENTS BACKGROUND\ECONOMIC DISADVA **41772.251.140−0.252−14.2660.000SN
GEN\PERCENT OF STUDENTS <LANG OF TEST> REVERSE ***44293.711.8230.7121226.0000.000SP
Note: significant positive [SP], significant negative [SN], neutral [N]. *, **, *** Different test values selected for items with different scales.
Table 10. Descriptive statistics and one-sample t-test for the components of factor 5: library and instruction resources. One-sample statistics and t-test (test value =1.5 *, 2.5 **, 3 ***, 3.5 ****).
ItemsNMeanStd. DeviationMean Differencet-ValueSig. (2-Tailed)Confident and Not Confident
Factor 5: library and instruction resources44532.760.6400.25927.0490.000SP
GEN\HAVE PLACE FOR SCHOOLWORK *44531.800.3990.30150.3710.000SP
GEN\USE INCENTIVES\MATH43561.720.4510.21631.6150.000SP
GEN\STUDENTS * BACKGROUND\ECONOMIC AFFLUEN REVERSE **41102.621.1990.1799.5600.000SP
GEN\MAGAZINES IN LIBRARY\DIGITAL REVERSE ***21254.271.2210.77429.2170.000SP
GEN\MAGAZINES IN LIBRARY\PRINT REVERSE ***40143.411.1060.090−5.1530.000SP
GEN\BOOKS IN LIBRARY\DIGITAL REVERSE ****19775.531.0602.03385.2860.000SP
GEN\BOOKS IN LIBRARY\PRINT REVERSE ****41972.991.245−0.51026.5580.000SN
Note: significant positive [SP], significant negative [SN], neutral [N]. *, **, ***, **** Different test values selected for items with different scales.
Table 11. One-way ANOVA.
GradesSum of SquaresdfMean SquareFSig.
Between groups16,553.71853310.7440.3610.876
Within groups266,456,192.10029,0239180.863
Total266,472,745.90029,028
Table 12. Multiple regression analysis between the five school predictor factors on student achievement in TIMSS 2015.
ModelRR SquareAdjusted R SquareStd. Error of the EstimateChange StatisticsDurbin–Watson
R Square ChangeF Changedf1df2Sig. F Change
10.0670.0050.00490.946110.00519.946143740.000
20.1690.0290.02889.845900.024108.780143730.000
30.2970.0880.08887.051310.060286.277143720.000
40.4040.1630.16383.400890.075392.096143710.000
50.4090.1680.16783.200740.00422.056143700.0001.256
Note: Dependent variable: students’ achievement in TIMSS 2015.
Table 13. ANOVA results of the five school factors model—multiple regression analysis.
ModelSum of SquaresDfMean SquareFSig.
1Regression164,974.7871164,974.78719.9460.000 *
Residual36,178,206.56043748271.195
Total36,343,181.3504375
2Regression10,43,077.9602521,538.98064.6090.000 *
Residual35,300,103.39043738072.285
Total36,343,181.3504375
3Regression3,212,467.87831,070,822.626141.3080.000 *
Residual33,130,713.47043727577.931
Total36,343,181.3504375
4Regression5,939,776.58741,484,944.147213.4860.000 *
Residual30,403,404.76043716955.709
Total36,343,181.3504375
5Regression6,092,453.54951,218,490.710176.0220.000 *
Residual30,250,727.80043706922.363
Total36,343,181.3504375
Note: Dependent variable: achievement. * The models are significant at the 0.01 level (2-tailed).
Table 14. Multiple regression analysis for five school predictor factors on student achievement in TIMSS 2015.
No.ModelsAverage of 5 PVs 1st PV 2nd PV 3rd PV 4th PV 5th PV
BSigBSigBSigBSigBSigBSig
1(Constant)447.2940.000447.930.000446.0210.000447.8810.000445.4340.000449.1980.000
General School Resources−6.9720.000−7.1310.000−6.43310.000−6.9920.000−6.8780.000−7.4830.000
R Square0.004 0.004 0.004 0.004 0.004 0.005
2(Constant)488.1880.000488.330.000487.0830.000488.5640.000488.3330.000488.6230.000
Factor 1: General School Resources−4.7330.002−4.9180.002−4.1820.010−4.5290.004−4.5290.006−5.2700.001
Factor 2: Discipline and Safety−28.9590.000−28.610.000−29.0780.3000−28.8090.000−30.3780.000−27.9180.000
R Square0.0028 0.026 0.026 0.026 0.028 0.026
3(Constant)562.5670.000560.840.000562.2000.000564.0030.000562.3810.000563.4040.000
Factor 1: General School Resources−6.3810.000−6.520.000−5.8470.000−6.4360.000−6.1700.000−6.9270.000
Factor 2: Discipline and Safety−11.3080.000−11.400.000−11.2520.000−10.9060.000−12.8060.000−10.1720.000
Factor 3: Oarental Support−42.6870.000−41.610.000−43.1100.000−43.2950.000−42.4970.000−42.9170.000
R Square0.088 0.079 0.081 0.081 0.081 0.082
4(Constant)669.0830.000667.050.000670.7770.000671.6830.000669.5310.000666.3750.000
Factor 1: General School Resources−1.3760.349−1.5350.318 *−0.7450.631 *−1.3770.379*−1.1350.467−2.0890.175*
Factor 2: Discipline and Safety−9.1570.001−9.2580.001−9.0600.002−8.7330.003−10.6420.000−8.0930.005
Factor 3: Parental Support−43.1280.000−42.050.000−43.5600.000−43.7410.000−42.9410.000−43.3440.000
Factor 4: Principal Experience and Education−47.1440.000−47.000.000−48.0560.000−47.6590.000−47.4240.000−45.5740.000
R Square0.163 0.149 0.152 0.149 0.150 0.1470.000
5(Constant)693.6150.000692.790.000695.5140.000695.5350.000697.4710.000692.7630.585 *
Factor1: General School Resources−0.2250.880-−0.3270.833*0.4150.791 *−0.2580.571 *−0.1060.947−0.8510.002
Factor 2: Discipline and Safety−9.9470.000−10.0870.000−9.8570.001−9.5010.001−11.3490.000−8.9430.000
Factor 3: Parental Support−40.9980.000−39.8200.000−41.4150.000−41.6700.000−41.0360.000−41.0520.000
Factor 4: Princaipal Experience and Education−48.9320.000−48.8820.000−49.8600.000−49.3980.000−49.0240.000−47.4990.000
Factor 5: Library and Instruction Rescources−9.5450.000−10.0160.000−9.6250.000−9.2800.000−8.5360.000−10.2670.000
R Square0.167 0.153 0.156 0.153 0.153 0.151
Note: * B is not significant at the 0.01 level (2-tailed). Dependent variable: achievement (5 plausible value mathematics).
Publisher’s Note: MDPI stays neutral with regard to jurisdictional claims in published maps and institutional affiliations.

