Article

Ascertaining the Online Learning Behaviors and Formative Assessments Affecting Students’ Academic Performance during the COVID-19 Pandemic: A Case Study of a Computer Science Course

1
Faculty of Data Science and Information Technology, INTI International University, Nilai 71800, Malaysia
2
School of Information Technology, Monash University Malaysia, Bandar Sunway 47500, Malaysia
*
Author to whom correspondence should be addressed.
Educ. Sci. 2022, 12(12), 935; https://doi.org/10.3390/educsci12120935
Submission received: 4 November 2022 / Revised: 14 December 2022 / Accepted: 15 December 2022 / Published: 18 December 2022

Abstract

:
Prior education research has focused on using learning analytics to predict the academic performance of Massive Online Learning Courses (MOOCs) and e- learning courses in universities. There is limited research on online learning that has been transitioned from physical classes and that has continued to use active learning approaches in an online environment. This study aims to determine the variables affecting students’ academic performance for a computing course in a research-intense university during the COVID-19 pandemic. Variables that are indicative of self-regulated learning such as time management, frequency of accessing learning materials and the Learning Management System (LMS), participation in assessment activities and discussions, and the results of formative assessments were extracted from the LMS reports and log files to predict the students’ total marks and final exam results. The findings revealed that good time management and active participation are important for academic success. The results also supported the model for the early prediction of summative assessment performance using formative assessment results. Additionally, this study concludes that the gap in predictive power between formative assessment results and online learning behaviors is small. This research is considered unique because it demonstrates predictive models for students’ academic success for an institution that was forced to transition from physical to online learning. It highlights the importance of self-regulated learning behavior and formative assessments in the contemporary era.

1. Introduction

Due to the unprecedented circumstances of the COVID-19 pandemic, universities worldwide were forced to transition from physical to online learning to ensure that courses could proceed during the pandemic. For many of the students, studying online was a new learning experience [1,2,3]. Online learning requires discipline and self-regulation from students, as they may easily feel demotivated and become stuck throughout the course [4]. This is because students face various issues in online learning, such as difficulties in using learning technology, lack of communication, and lack of self-discipline [5]. However, the obstacles from the technology aspect are not the main factors that affect students’ online learning performance [6]. Rather, it is highly affected by student learning behaviors [6]. Due to the isolated environment associated with online classes, students can feel bored, frustrated, and anxious [7], which erodes their persistence in online learning. Therefore, students are required to have a higher level of self-regulation to prevent procrastination [8]. Furthermore, students who show self-regulation behaviors have the ability to set goals, manage time effectively, exercise problem solving skills, and seek help when necessary [9]. Hence, more self-regulated students tend to outperform those who are less self-regulated, creating a significant difference in learning performance [10,11].
The main systems used in online learning are Learning Management Systems (LMS). LMS have been used to support the teaching and learning process, as well as facilitate the sharing of learning resources [12]. Some instructors adopt discussion forums, which facilitate critical discussions and interaction among students [13]. With the deployment of online systems, the vast amount of information collected autonomously is an insightful source of data that supports the learning process [14]. Moreover, log files from the LMS provide behavioral evidence for self-regulated learning [15]. Therefore, we could identify the real-time learning behaviors of the students in our study from these data using learning analytics. Learning analytics makes use of data mining techniques in log files to uncover patterns and provide insights into the learning and teaching process, which supports decision making and predicts students’ learning success [16,17]. Consequently, learning analytics enable the identification of successful and unsuccessful patterns among students, so the course design can be adjusted to prevent the use of unsuccessful learning resources [18]. As a result, institutions can ensure a better quality of online learning and provide support to students in need [19].

2. Related Works

In recent years, studies have been conducted on online courses taught in higher education institutions to investigate the efficacy of learning analytics in building models to predict students’ success based on learning behaviors. Similar methodologies have been used by various researchers, where the variables were extracted from the LMS log files for correlation analysis and the building of predictive models. Many of the variables extracted from the log files reflect the students’ learning activities within the LMS, such as “total clicks”, “access to course materials”, “timely assignment submission”, and “reading content in the forum”. A study by You (2016) on a university’s e-learning course known as “Introduction to Colors” evidently showed that students’ learning behaviors that positively impact their academic performance include accessing materials according to schedule, completing assignments on time, frequent access to learning materials, and reading important course information [4]. The study also concluded that regular study, total viewing time, late submissions, proof of reading the course information, and midterm exam results are significant predictors of the students’ final marks. Similarly, Soffer and Cohen (2019) studied four e-learning courses from the fields of humanities, arts, and medicine and found that students who completed a course had twice as many learning activities as non-completers, except for writing in the forums [20]. Additionally, course discipline and assignment submissions were significant in predicting a student’s course completion. Moreover, Soffer and Cohen’s 2019 study showed that high engagement in the course could increase the students’ success, especially in terms of engagement with the learning materials, forum discussions, and assignment submissions.
However, some studies show that LMS data could not be used effectively to predict academic performance. A study by Conijn et al. (2016) attempted to create a generalized model to predict academic performance across 17 blended-learning e-learning courses [21]. This study was data-driven and not explicitly based on theory. The results showed that there was no fixed set of variables that could be used in various courses. Furthermore, when student performance was predicted using course-specific models, the precision of the prediction models varied from 8% to 37%, and the LMS data were insignificant in predicting student academic performance due to the possibility of students using other online systems in addition to the LMS for their studies. Similarly, Gašević et al.’s 2016 study on nine different e-learning courses (Accounting, Communications, Computer Science, Economics, Graphic Design, Marketing, Mathematics, Biology 1, and Biology 2) was carried out in an aggregated and course-specific manner. The course-specific models showed that the relation of the variables to the students’ performance had highly varying results. Furthermore, researchers have pointed out that single course predictive models are generally effective in modeling students’ performances, and the models are not transferable to other courses [22]. The research results showed that a significant drop in accuracy was observed when a model was used for another course. When a model was used for another course of the same degree 9% to 28% of accuracy was lost, while 22% to 25% of accuracy was lost when a model was used for courses with similar LMS usage [22,23]. In the aggregated model, student success was either underestimated or overestimated.
Most of the studies on predictive modeling in learning analytics were conducted before the COVID-19 pandemic. Researchers mainly focused on the learning analytics of Massive Online Learning Courses (MOOCs) and e-learning courses. The pandemic forced universities to transition from physical classes to online classes. This forced transition has provided an opportunity for universities to experiment with blended learning and online learning possibilities [24]. Limited research has been conducted on online learning that has transitioned from physical classes and continued to use active learning approaches. This drove us to find out what factors could possibly affect students’ academic performance during the pandemic. The adoption of learning analytics in the delivery of courses could be a measure to ensure the quality of online education. The current study was conducted on one computing course to determine the online learning behaviors of students who are more tech-literate and who were less likely to face difficulties in using technology during the COVID-19 pandemic. The main aim of this study was to further investigate whether the models from previous studies were applicable for a single course with two cohorts of students, which transitioned from physical classes to online classes and continued using an active learning approach. The current study uses trace data from a single computing course and studies the predictive power of several online behavior indicators. We map the different learning-related actions in the log files into four different categories of self-regulated learning behaviors. This was based on earlier related studies and data availability to investigate the relationships between online learning behaviors and academic performance. In addition, we also investigated the various formative assessments of a course and to what extent such assessments are responsible for the variability in the summative assessment of students. The main contribution of this study is to ascertain the significance of learning variables, such as time management, frequency of access to learning material, frequency of access to the LMS, active participation, and formative assessments, in predicting students’ academic performance.

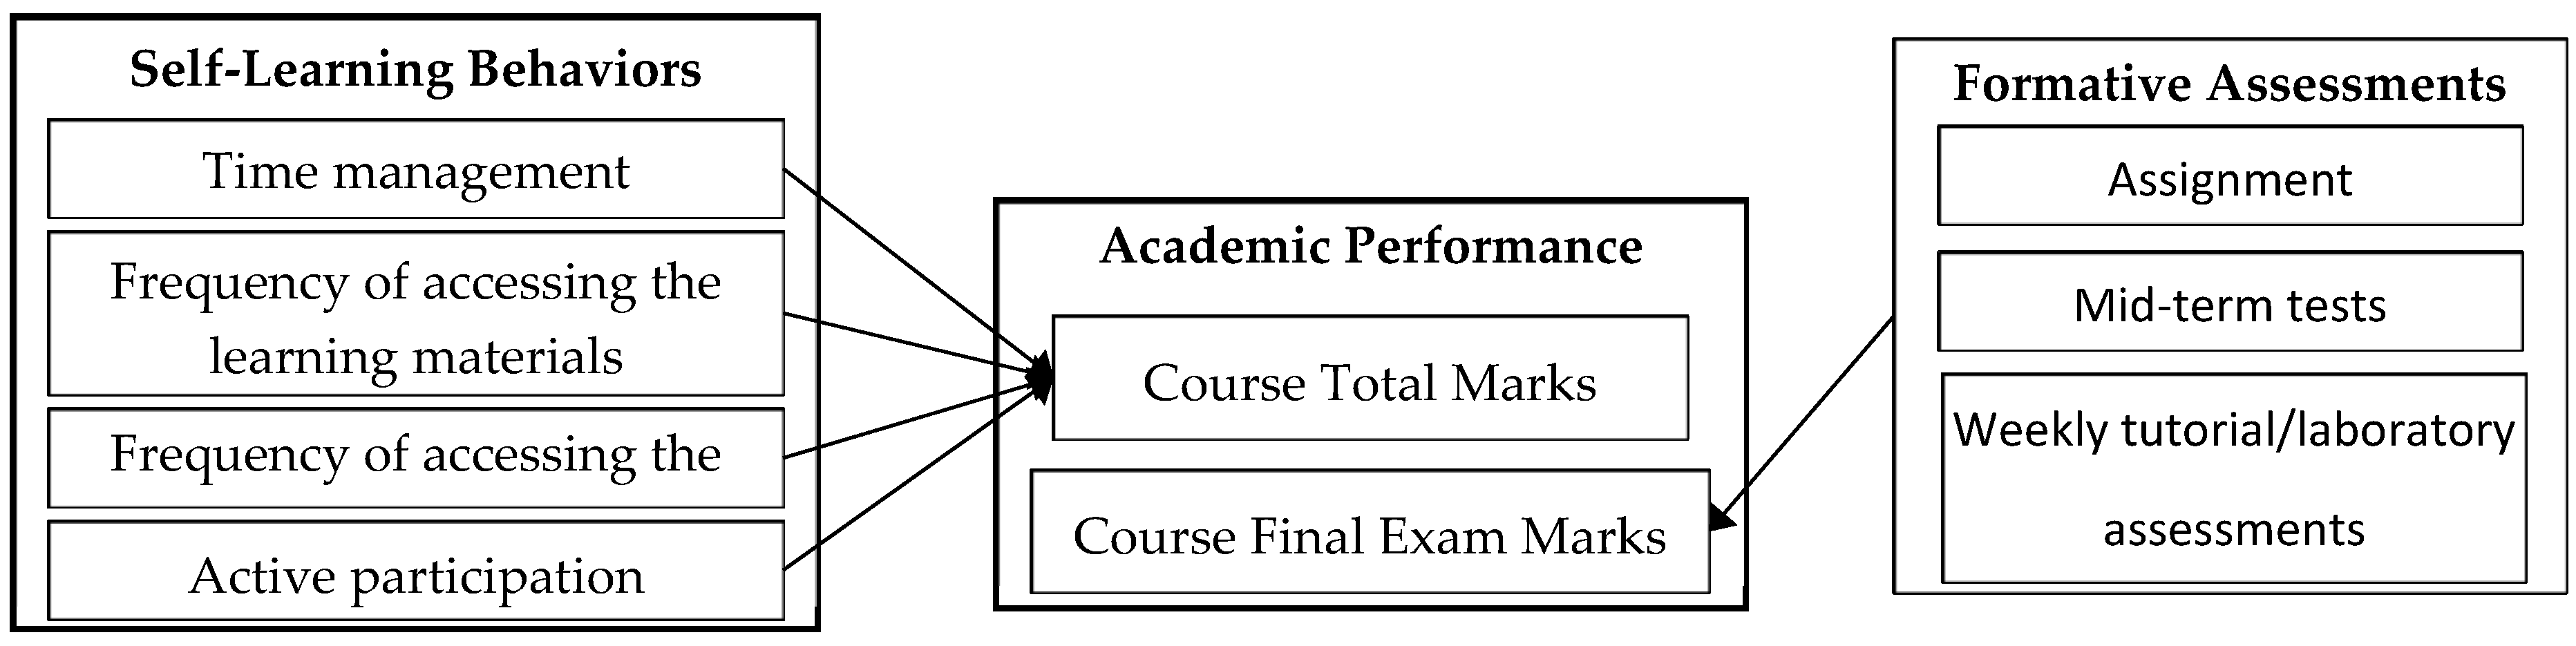
3. Research Framework

Self-regulated learning plays a vital role in online learning as the failure to self-regulate leads to negative effects on a student’s academic performance [25]. Previous researchers have pointed out that self-regulated behaviors include timely responses to course requirements, asking questions when required, regular access to course notices, diligent study and review of the course content, and engaging in communication with others [4]. Jovanovic et al. (2021) indicated that students who regularly contributed to discussion forums were likely to have better academic achievement [26]. Therefore, this study includes variables that are indicative of self-regulated learning based on the literature and data availability. The variables are divided into four categories, as shown in Figure 1. They are (1) time management, (2) frequency of accessing the learning materials, (3) frequency of accessing the LMS, and (4) active participation. The first category, time management, refers to timeliness in assessment submission, time spent on completing each assignment, and timeliness in accessing learning and assessment materials. The next category is the frequency of access to learning materials. For example, the number of lecture and workshop materials accessed by students, as well as revisiting these materials. The third category is the frequency of accessing the LMS, which measures each student’s total number of clicks in the LMS and the average clicks per week. Lastly, the variables in the active participation category reflect the students’ participation in discussions and completion of assignments. The variables in these four categories are selected as effective in indicating student self-learning behaviors as they reflect the time and effort that students invest during online learning.
A study conducted by Figueroa-Canas and Sancho-Vinuesa (2021) showed that students’ performance in formative quizzes was able to predict students’ final examination performance in an online learning course [27]. Hence, the results from the formative assessments were included in this study (Figure 1). The formative assessments include assignments, mid-term tests, and weekly tutorial/laboratory assessments.
The theoretical framework of this study is to analyze the self-regulated learning behaviors of computer science (CS) students who transitioned from physical to online learning. The objective of this study is to identify any correlation of learning behaviors that would influence student academic performance. Likewise, the correlation of the data from in-semester assessments (also called formative assessments) with the final examination performance (also called the summative assessment) was also analyzed, to measure the feasibility of using formative assessments performance to predict students’ summative assessment performance.

Research Questions

The research was conducted to study the statistical relationship between the variables extracted from the LMS with the students’ academic performance in an online learning setting during the COVID-19 pandemic. This study sample consists of a course undertaken by two different cohorts that originated from the same institution and was based on the same learning design (active learning). The course was of a small size (170 students on average) which further contributes to the reduction in variability and differentiates the course sample from those used in the literature (mostly courses with several hundred online students). The study aims to identify which of these variables are statistically significant in predicting student academic performance, and which formative assessments are early predictors of performance in the summative assessment. Therefore, the study aims to answer the following research questions:
  • RQ1. What are the independent learning behavior variables derived from the LMS logs that are statistically significant in predicting students’ academic performance?
  • RQ2. Is performance in formative assessments statistically significant in predicting performance in the summative assessment?

4. Materials and Methods

4.1. Overall Context

The data was generated from one undergraduate CS course taught at a university in the 2020/21 and 2021/22 academic year during the COVID-19 pandemic. The course was called Advanced Data Structures and Algorithms. The same instructors were involved in teaching the two student cohorts. The course was a core unit involving programming concepts and implementation where the students were required to learn the data structure concept and coding together. The course reflected both the theory and implementation of a computer science course. The course did not require any pre-requisites. Active learning was the general teaching approach for this course. The course was delivered face-to-face on campus before the COVID-19 pandemic. During the pandemic, the course had a fixed time schedule for students to attend online classes using the Zoom conferencing tool. Besides the LMS, the lecturer was also authorized to use additional platforms such as Discord, Slido, and Slack to facilitate the learning and teaching process. The characteristics of the course are summarized in Table 1.

4.2. Context of Advanced Data Structures and Algorithms Course

This course was attended by 340 students from the Australia and Malaysia campuses. A total of 12 lectures and 11 workshops were taught during the 12-week duration of the course. One lecture material document and two workshop documents would be uploaded to the LMS each week. Although the assessment criteria and learning materials were identical, the methods of class delivery varied across the two campuses. On the Australian campus, the students were required to attend one lecture and one workshop each week. However, on the Malaysia campus, the students could watch lecture and workshop recordings at their own pace and then voluntarily attend a discussion session at the end of the week to seek clarification on any doubts. Throughout the semester, the students were required to submit three individual assignments that constituted 40% of the total marks. For the assignments, the students received only the assignment specifications and not the marking rubric. Students were required to take a final examination with a weight of 60%. A total of 26 variables were derived from the LMS log files.

4.3. Data Source

The data used in this research were ethically obtained with written requests to the university human research ethics committee. The human research ethics committee of the university approved and provided ethical clearance for this research in accordance with the university regulations. The data was de-identified before processing during the study to maintain anonymity and to ensure confidentiality. The raw data for the course were collected from the LMS log files and processed individually to create the dataset. The raw data consisted of the online learning activities, actions within the LMS, and information associated with the actions, such as the timestamp, event, and components involved. Besides the log files, the different assignment marks, the final examination marks, and the total marks and grades were retrieved from the LMS grade report and from the lecturer. All the data was de-identified before further processing.
Data cleaning was carried out on PySpark to remove invalid records and duplicated values. It was followed by a data extraction process where an individual dataset of each course was created by aggregating the raw data into the set of variables presented in Table 2. The variables are defined as four categories of learning behavior indicator: 1. time-management related behavior/strategy, such as consistency of study and preparation; 2. the frequency of accessing the learning materials; 3. the frequency of accessing the LMS; and 4. active participation. Some of the self-regulated learning behaviors, such as time management-related behavior, and marks for the different formative assessments were included as new variables not previously studied.
To further elaborate on the different variables used in this research framework we describe the variables used in the study in this section (as presented in Table 2). The students completed three individual assignments for this course. Therefore, a total of 14 different variables were created as indicators for the time management category. The variables are: submitted Assignment 1 on time; submitted Assignment 2 on time; submitted Assignment 3 on time; time spent on Assignment 1; time spent on Assignment 2; time spent on Assignment 3; accessed Assignment 1 specifications within 1 week of release; accessed Assignment 2 specifications within 1 week of release; accessed Assignment 3 specifications within 1 week of release; accessed Assignment 1 specifications within 24 h of the deadline; accessed Assignment 2 specifications within 24 h of the deadline; accessed Assignment 3 specifications within 24 h of the deadline; number of lecture materials accessed on time; number of workshop materials accessed on time. For the frequency of accessing the learning materials category, four different variables were produced. They are: number of lecture materials accessed; number of workshop materials accessed; lecture material revisits; workshop material revisits. The total number of clicks in the LMS and the average number of clicks in the LMS (two variables) were formed for the frequency of accessing the LMS category. Lastly, six different variables were identified for the active participation category. Those different variables are: submitted Assignment 1; submitted Assignment 2; submitted Assignment 3; writing content in the forum; reading content in the forum; and forum access. The values allocated for each variable for all the different categories are described in Table 2. For instance, for the time management category variable “submitted Assignment 1 on time” (as shown in Table 3) a value of 1 is allocated provided the student submitted Assignment 1 before the deadline. Otherwise, the variable is allocated a value of 0.

4.4. Data Analysis

To investigate the research questions, correlation and multiple regression analyses were performed to identify the significant predictors. A significance level of 0.05 was used for the hypothesis testing.

5. Results and Discussion

5.1. Correlation and Regression Analysis between the Learning Behavior Variables and the Total Marks

Referring to Table 3, 17 (out of a total of 26) learning behavior variables were found to be weakly positively correlated with the total marks (the correlation coefficients ranged from 0.121 to 0.336). These significant learning behavior variables were further analyzed with a multiple regression analysis. The results of the multiple regression analysis are presented in Table 4. Six learning behavior variables—submitted Assignment 2 on time (regression coefficient, 7.44); submitted Assignment 3 on time (regression coefficient, 4.39); lecture materials accessed on time (regression coefficient, 1.81); submitted Assignment 1 (regression coefficient, 20.41); submitted Assignment 3 (regression coefficient, 23.56); and writing content in the forum (regression coefficient, 0.42)—were significant predictors of students’ academic performance (F = 22.57, Sig = 0.000). The results suggest that students who had good time management and actively participated in assessments and writing content on the forum tended to have higher total marks. The results reveal that some of the self-regulated learning behavior variables defined in this study adequately predict students’ academic performance for the CS course. These results confirm the research findings reported in the literature [4,26]. The predictive model explained around 29% of the variability in the students’ total marks. This may be attributed to the fact that we were not able to record the students’ interaction with other systems.

5.2. Correlation and Regression Analysis between the Formative Assessments Marks and the Final Examination Marks

The Advanced Data Structures and Algorithms course had three individual assignments as the formative assessments, and one final examination as the summative assessment. The results of the correlation analysis showed the three formative assessments marks and the final examination marks were found to be weakly or moderately positively correlated (the correlation coefficients are 0.275 to 0.435 as presented in Table 5). The results of the multiple regression analysis are presented in Table 6. Assignment 1 marks, Assignment 2 marks, and Assignment 3 marks are the significant predictors of the final examination marks (the regression coefficients are 1.16, 0.63, and 0.63, respectively, (F = 37.12, Sig = 0.000)). The results indicate that those students who scored highly in the assignments tended to have better results in the final examination. These findings suggest that the early prediction models using performance in formative assessments to predict performance in a summative assessment are applicable to the examined course. These findings are consistent with the findings reported in the literature [27]. The predictive model explained around 25% of the variability in the students’ examination marks. This may be attributed to the fact that we were not able to capture the difficulty levels of the assessments.
Comparing the statistical results for research questions 1 and 2, it was found that both models had a very close predictive power, with a variance of 29% and 25%, respectively. The results suggest that both models are strong predictors of the respective final marks and the examination marks.
The result of the analysis provides an insight into continuing research utilizing machine learning techniques to predict student academic performance. More samples are required to run the machine learning technique to produce an artificial intelligence-based predictive model in the future.

6. Conclusions

Universities were forced to transition from physical to online learning to ensure that learning could continue during the pandemic. The study focuses on ascertaining the variables affecting students’ academic performance for one computing course. The findings show that good time management and active participation are important factors for academic success. In addition, the results of formative assessments could be predictors of summative assessment. These findings suggest that lecturers could predict final course performance based on formative assessments and online learning behaviors during the course. Therefore, lecturers could provide adequate interventions and feedback to students for the duration of the course. These results support the research findings reported in the literature [4,26,27]. The present study highlights that the gap in predictive power between formative assessment results and online learning behaviors for academic success is small. These findings suggest that lecturers can monitor students’ progress easily by acquiring insights from the results of formative assessments or online learning behaviors such as time management and active participation.
The findings of this study have several implications. First, this study contributes to the identification of more relevant self-regulated learning measures from LMS log files apart from the measures given in the literature. The results confirm the benefits of analyzing LMS data during a course. Second, the present study clearly shows the significance of self-regulated learning in academic success. Accessing course material on time, submitting assessments on time, and active participation are significant indicators, which highlight the quality of learning behaviors instead of the quantity of learning. Therefore, students need to manage their time to keep up and engage in their learning. Finally, the extraction and aggregation of significant indicators from the students’ learning behavioral data and formative assessments results and the consistency of the derived prediction models are valuable for lecturers. These could allow lecturers to understand students’ learning progress and subsequently provide remedial feedback during the course. As such, the development of an informative dashboard with the required details in the LMS could make the monitoring process relatively easy.
We identified several limitations. First, the course examined was previously based on the face-to-face on-campus model. Since this study only had data from the online component of the course which resided in the LMS, the current study was unable to account for the online behavior of the students in other systems, the students’ prior knowledge of the course, the students’ perception of the course, and the interest of the students in the course. Thus, this study might have missed some important predictors. Second, a qualitative research approach could have been incorporated in the study to further explain the possible reasons for the correlation and predictors identified.
As future work, other factors can be included as new variables, such as students’ prior knowledge about the course, students’ perception of the course, and students’ interest in predicting their academic performance. A multi-group analysis could also be conducted to further investigate how the predictors differ between different students with different interests, prior knowledge, and perceptions.

Author Contributions

Conceptualization, M.C.W.; methodology, M.C.W.; software, S.L.T.; validation, T.T.T., S.L.T., and M.C.W.; formal analysis, T.T.T. and M.C.W.; investigation, S.L.T. and M.C.W.; resources, M.C.W.; data curation, S.L.T. and M.C.W.; writing—original draft preparation, S.L.T., M.C.W.; writing—review and editing, M.C.W. and T.T.T.; visualization, M.C.W. and T.T.T.; supervision, M.C.W.; project administration, M.C.W.; funding acquisition, M.C.W. All authors have read and agreed to the published version of the manuscript.

Funding

This work has been funded by the School of Information Technology Collaborative Research Seed Grants 2021: project ID 5140871-112-00, Monash University Malaysia.

Institutional Review Board Statement

The study was conducted in accordance with the Declaration of Helsinki, and approved by the Institutional Review Board of Monash University Human Research Ethics Committee (MUHREC) (2021-27497-55054 17/02/2021).

Informed Consent Statement

Informed consent was obtained from all subjects involved in the study.

Data Availability Statement

Not applicable.

Conflicts of Interest

The authors declare that they have no conflict of interest.

References

  1. Celik, I.; Dindar, M.; Muukkonen, H. Distance education: A study of social media use for k-12 education during the COVID-19 pandemic. Inf. Learn. Sci. 2022, 123, 252–275. [Google Scholar] [CrossRef]
  2. Peterson, L.; Scharber, C.; Thuesen, A.; Baskin, K. A rapid response to COVID-19: A district’s pivot from technology integration to distance learning. Inf. Learn. Sci. 2020, 121, 461–469. [Google Scholar] [CrossRef]
  3. Sahu, P. Closure of universities due to coronavirus disease 2019 (COVID-19): Impact on education and mental health of students and academic staff. Cureus 2020, 12, e7541. [Google Scholar] [CrossRef] [PubMed] [Green Version]
  4. You, J.W. Identifying significant indicators using LMS data to predict course achievement in online learning. Internet High. Educ. 2016, 29, 23–30. [Google Scholar] [CrossRef]
  5. Dhawan, S. Online learning: A panacea in the time of COVID-19 crisis. J. Educ. Technol. Syst. 2020, 49, 5–22. [Google Scholar] [CrossRef]
  6. Bao, W. COVID-19 and online teaching in higher education: A case study of Peking university. Hum. Behav. Emerg. Technol. 2020, 2, 113–115. [Google Scholar] [CrossRef] [Green Version]
  7. Aristovnik, A.; Kerzic, D.; Ravselj, D.; Tomazevic, N.; Umek, L. Impacts of the COVID-19 pandemic on life of higher education students: A global perspective. Sustainability 2020, 12, 8438. [Google Scholar] [CrossRef]
  8. Rasheed, R.A.; Kamsin, A.; Abdullah, N.A. Challenges in the online component of blended learning: A systematic review. Comput. Educ. 2020, 144, 103701. [Google Scholar] [CrossRef]
  9. Oliver, M. Online learning helps prepare pupils for university. Educ. J. 2014, 218, 12–15. [Google Scholar]
  10. Hong, J.-C.; Lee, Y.-F.; Ye, J.-H. Procrastination predicts online self-regulated learning and online learning ineffectiveness during the coronavirus lockdown. Personal. Individ. Differ. 2021, 174, 110673. [Google Scholar] [CrossRef]
  11. Li, S.; Chen, G.; Xing, W.; Zheng, J.; Xie, C. Longitudinal clustering of students’ self-regulated learning behaviors in engineering design. Comput. Educ. 2020, 153, 103899. [Google Scholar] [CrossRef]
  12. Mwalumbwe, I.; Mtebe, J.S. Using learning analytics to predict students’ performance in Moodle learning management system: A case of Mbeya University of science and technology. Electron. J. Inf. Syst. Dev. Ctries 2017, 79, 1–13. [Google Scholar] [CrossRef] [Green Version]
  13. Kim, D.; Park, Y.; Yoon, M.; Jo, I.-H. Toward evidence-based learning analytics: Using proxy variables to improve asynchronous online discussion environments. Internet High. Educ. 2016, 30, 30–43. [Google Scholar] [CrossRef]
  14. Kew, S.N.; Tasir, Z. Learning analytics in online learning environment: A systematic review on the focuses and the types of student-related analytics data. Technol. Knowl. Learn. 2021, 27, 1–23. [Google Scholar] [CrossRef]
  15. Montgomery, A.P.; Mousavi, A.; Carbonaro, M.; Hayward, D.V.; Dunn, W. Using learning analytics to explore self-regulated learning in flipped blended learning music teacher education. Br. J. Educ. Technol. 2019, 50, 114–127. [Google Scholar] [CrossRef] [Green Version]
  16. Gašević, D.; Dawson, S.; Rogers, T.; Gasevic, D. Learning analytics should not promote one size fits all: The effects of instructional conditions in predicting academic success. Internet High. Educ. 2016, 28, 68–84. [Google Scholar] [CrossRef] [Green Version]
  17. Saqr, M.; Fors, U.; Tedre, M. How learning analytics can early predict under-achieving students in a blended medical education course. Med. Teach. 2017, 39, 757–767. [Google Scholar] [CrossRef]
  18. Bos, N.; Brand-Gruwel, S. Student differences in regulation strategies and their use of learning resources: Implications for educational design. In Proceedings of the Sixth international Conference on learning Analytics & knowledge, Edinburgh, UK, 25–29 April 2016; pp. 344–353. [Google Scholar]
  19. Ma, J.; Han, X.; Yang, J.; Cheng, J. Examining the necessary condition for engagement in an online learning environment based on learning analytics approach: The role of the instructor. Internet High. Educ. 2015, 24, 26–34. [Google Scholar] [CrossRef]
  20. Soffer, T.; Cohen, A. Students’ engagement characteristics predict success and completion of online courses. J. Comput. Assist. Learn. 2019, 35, 378–389. [Google Scholar] [CrossRef]
  21. Conijn, R.; Snijders, C.; Kleingeld, A.; Matzat, U. Predicting student performance from lms data: A comparison of 17 blended courses using Moodle LMS. IEEE Trans. Learn. Technol. 2016, 10, 17–29. [Google Scholar] [CrossRef]
  22. Riestra-González, M.; del Puerto Paule-Ruíz, M.; Ortin, F. Massive LMS log data analysis for the early prediction of course-agnostic student performance. Comput. Educ. 2021, 163, 104108. [Google Scholar] [CrossRef]
  23. López-Zambrano, J.; Lara, J.A.; Romero, C. Towards portability of models for predicting students’ final performance in university courses starting from moodle logs. Appl. Sci. 2020, 10, 354. [Google Scholar] [CrossRef] [Green Version]
  24. Marinoni, G.; Vant Land, H.; Jensen, T. The impact of COVID-19 on higher education around the world. IAU Glob. Surv. Rep. 2020, 23. [Google Scholar]
  25. Dabbagh, N.; Kitsantas, A. Supporting self-regulation in student centered web-based learning environments. Int. J. E-Learn. 2004, 3, 40–47. [Google Scholar]
  26. Jovanovic, J.; Saqr, M.; Joksimovic, S.; Gasevic, D. Students matter the most in learning analytics: The effects of internal and instructional conditions in predicting academic success. Comput. Educ. 2021, 172, 104251. [Google Scholar] [CrossRef]
  27. Figueroa-Canas, J.; Sancho-Vinuesa, T. Investigating the relationship between optional quizzes and final exam performance in a fully asynchronous online calculus module. Interact. Learn. Environ. 2021, 29, 33–43. [Google Scholar] [CrossRef]
Figure 1. Research conceptual framework—predictors of students’ academic performance.
Education 12 00935 g001
Table 1. A summary of the characteristics of the CS course for the two cohorts.
CharacteristicsAdvanced Data Structures and Algorithms
Course duration12 weeks
Year of studyThird year
Enrolled students340
No. of lectures12
No. of workshops11
Assignment marking rubric provided to studentsNo
Assessment typeIn-semester assessments (40%)
Final examination (60%)
In-semester assessments (formative assessments)3 individual assignments
(10% + 20% + 10%)
Table 2. Overview of the learning behavior variables used in the study.
CategoryVariable NameDescriptionExample
Time managementOn time submission of each assignmentRecorded as 1 if the student submitted the assignment before the deadline. Else, it will be recorded as 0If a student submits the assignment 2 h before the deadline, the entry will be recorded as 1.
If a student submits the assignment immediately after the deadline, the entry will be recorded as 0.
Time spent on assignmentThe duration between the student’s first access to the assignment specifications and the assignment submission, which provides a rough estimate of the time used by the student to complete the assignment.The duration will be expressed in minutes. If a student spent 4 days between his/her first access to the assignment specifications and the time of submission, the entry will be recorded as 5760 min.
Accessed assignment specifications within 1 week of releaseRecorded as 1 if the student accessed the assignment specifications at least once within 1 week of release. If not, it will be recorded as 0.If a student accessed Assignment 1 specifications on the 2nd day after release, the entry will be recorded as 1.
If the student does not access the materials at all, the entry will be 0.
Accessed assignment specifications within 24 h of the deadlineRecorded as 1 if the student accessed the assignment specifications at least once within 24 h of the due date. If not, it will be recorded as 0.If a student accessed the assignment specifications 1 day before the assignment deadline, the entry will be 1.
If the student does not access the material at all by 24 h before the deadline, the entry will be 0.
Number of lecture materials accessed on timeThe total number of weeks before the lecture began that a student accessed the lecture materials.If a student accessed the lecture materials for 5 weeks prior to the lecture, the entry will be recorded as 5.
For n number of on-time access to the lecture materials, the entry will be n.
Number of workshop materials accessed on timeThe total number of weeks before the workshops/tutorial commenced that a student accessed the workshop or tutorial materials.If a student accessed workshop materials for 3 weeks prior to the workshop, the entry will be recorded as 3.
For n number of on-time access to the workshop materials, the entry will be n.
Frequency of accessing the learning materialsNumber of lecture materials accessed The total number of lecture materials accessed, according to the lecture materials uploaded.If a student accessed 5 out of the 12 lecture materials uploaded, the entry will be 5.
For n number of access to the lecture materials, the entry will be n.
Number of workshop materials accessedThe total number of workshop materials accessed, according to the workshop materials uploaded.If a student accessed 5 out of the 12 workshop materials uploaded, the entry will be 5.
For n number of access to the workshop materials, the entry will be n.
Lecture material revisitsThe total number of times a student has re-visited the lecture material.If a student has accessed an item of lecture material 8 times, the entry will be 7.
n − 1 of total visits will be recorded, with n > 1.
Workshop material revisitsThe total number of times a student has re-visited the workshop material.If a student has accessed an item of workshop material 8 times, the entry will be 7.
n − 1 of total visits will be recorded, with n > 1.
Frequency of accessing the LMSTotal number of clicks in the LMSThe total number of clicks within the course’s LMS page, which includes content viewing, link clicks, document downloads, assignment submissions, and content posting.If a student has 280 clicks in the LMS, the entry will be 280.
For n number of clicks in the LMS, the entry will be n.
Average number of clicks in the LMSThe average number of clicks by the student in 1 week in the course LMS, which reflects active participation in the course.If a student has 280 clicks per week over a duration of 12 weeks, the entry will be 23.3.
For n number of clicks in the LMS, the entry will be n/number of weeks.
Active participationAssignment submissionRecorded as 1 or 0. If the student submits the assignment, it will be recorded as 1, regardless of being on time or late. If not, it will be recorded as 0.If a student submits Assignment 1 late by 2 days, the entry will be 1.
If a student does not submit an assignment at all, the entry will be 0.
Writing content in the forum posts or commentsThe total number of posts and comments a student has created in the forum.If 3 posts and 5 comments are created by the student, the entry will be recorded as 8.
For n posts created and m comments posted in the forum, the entry will be n + m.
Reading content in the forumThe total number of posts and comments read by the student in the forum.If a student has read 5 topics in the forum, the entry will be recorded as 5.
For n topics read in the forum, the entry will be n.
Forum accessThe total number of times the student has accessed the forum to perform read or write actions.If a student has accessed the forum 50 times, the entry will be recorded as 50.
For n number of accesses to the forum, the entry will be n.
Table 3. Correlation analysis of the learning behavior variables and the total marks for the Advanced Data Structures and Algorithms course (n = 340); only significant variables are presented.
CategoryVariable NameCorrelation (r)
Time managementNumber of lecture materials accessed on time
Number of workshop materials accessed on time
Submitted Assignment 1 on time
Submitted Assignment 2 on time
Assignment 3 submitted on time
Accessed Assignment 1 specifications within 1 week of release
Accessed Assignment 3 specifications within 1 week of release
Accessed Assignment 2 specifications within 24 h of deadline
Accessed Assignment 3 specifications within 24 h of deadline
Time spent on Assignment 2
Time spent on Assignment 3
0.322
0.153
0.182
0.336
0.273
0.180
0.189
0.218
0.133
0.216
0.254
Frequency of accessing the learning materialsNumber of workshop materials accessed0.188
Frequency of accessing the LMSTotal number of clicks in the LMS
Average number of clicks per week in the LMS
0.121
0.121
Active participationWriting content in the forum0.205
Submitted Assignment 10.238
Submitted Assignment 30.231
Table 4. Multiple regression analysis of the variables of learning behaviors with the total marks for the Advanced Data Structures and Algorithms course (n = 340); only significant variables are presented.
CategoryPredictorsUnstandardized BetaR SquareSignificance
Time managementSubmitted Assignment 2 on time7.440.290.000
Submitted Assignment 3 on time4.390.010
Lecture materials accessed on time1.810.000
Active participationSubmitted Assignment 120.410.000
Submitted Assignment 323.560.000
Writing content in the forum0.420.005
Table 5. Correlation analysis of the marks for the formative assessments and the final examination marks for the Advanced Data Structures and Algorithms course (n = 340); only significant variables are presented.
Variable NameCorrelation (r)Significance (p Value)
Assignment 1 marks0.4350.000
Assignment 2 marks0.4140.000
Assignment 3 marks0.2750.000
Table 6. Multiple regression analysis of the formative assessment marks with the final examination marks for the Advanced Data Structures and Algorithms course (n=340); only significant variables are presented.
PredictorsUnstandardized BetaR SquareSignificance
Assignment 1 marks1.16 0.000
Assignment 2 marks0.630.250.000
Assignment 3 marks0.63 0.029
Publisher’s Note: MDPI stays neutral with regard to jurisdictional claims in published maps and institutional affiliations.

