Article

Kindergarten through Grade 3 Outcomes Associated with Participation in High-Quality Early Care and Education: A RCT Follow-Up Study

Early Childhood Education Institute, University of Oklahoma-Tulsa, Tulsa, OK 74135, USA
*
Author to whom correspondence should be addressed.
Educ. Sci. 2022, 12(12), 908; https://doi.org/10.3390/educsci12120908
Submission received: 20 October 2022 / Revised: 2 December 2022 / Accepted: 3 December 2022 / Published: 12 December 2022
(This article belongs to the Section Early Childhood Education)

Abstract

:
An accepted conclusion is that children at risk for educational failure who participate in high-quality early care and education (ECE) enter kindergarten “more ready”, possessing skills comparable to their more advantaged peers. There is less consensus about longer-term outcomes with some studies finding continuation of early gains, while others report “fade out” by elementary school. This study investigated child outcomes, kindergarten through Grade 3, of 75 children randomly assigned as infants to either participate or not in an enhanced Early Head Start/Head Start program. It was hypothesized that the children who experienced this high-quality ECE would perform better than their control group peers across a range of measures. From kindergarten to Grade 3, children in the treatment group demonstrated higher skills in letter and word identification, vocabulary, oral comprehension, and math than control group children after controlling for child/family characteristics and classroom quality. Results for executive functioning were mixed with children in the treatment group showing higher skills on one of the two measures of executive function. No group differences were found for social-emotional skills. This study contributes to the scant literature of longitudinal studies spanning infancy through to Grade 3. In addition to the findings of a general pattern of continuation of positive child outcomes in early academic skills associated with earlier high-quality ECE attendance, this study also contributes information about the potential size of impacts of contemporary ECE programs starting in infancy.

1. Introduction

A growing body of literature documents the potential of high-quality early care and education (ECE) to support positive developmental outcomes for all children [1,2,3], especially those growing up in contexts known to present risks to optimal development, such as poverty with the associated challenges of lack of access to educational and health services [4]. Classic studies launched in the 1960s and 1970s, including the Perry Preschool Project [5] and the Abecedarian Study [6,7] demonstrated that high-quality ECE increases kindergarten (K) readiness, improves academic achievement in K-Grade 12, makes it less likely that a child will repeat a grade or be placed in special education, and contributes to positive social and emotional development. More recent research indicates that the positive impacts extend into adulthood enhancing a range of outcomes associated with life success [8]. This accumulating research base showing both short- and longer-term impacts of ECE has prompted federal, state, and local governments and organizations to implement a variety of ECE programs for children birth through age five [9].
However, critiques noting the limitations of past research, including the classic studies, combined with recent research findings have introduced some doubt into the conclusions drawn from earlier research. It has been noted that the Perry Preschool and Abecedarian programs were intensive model interventions delivered to a uniform sample during a time when few other ECE options were available raising questions about the applicability of the findings to current contexts [4]. Some recent high-visibility studies have found that the early gains associated with ECE attendance did not continue or sustain into later developmental phases. Instead, these studies report fade out [2], with the performance of children who did and did not attend ECE converging by early elementary grades. The present study contributes information to this current controversy focused on continuation versus fade out of gains associated with early ECE participation in a contemporary ECE program starting in infancy.

1.1. Sustained Effects versus Fade out of ECE Impacts

As noted above, a current controversy focuses on the longer-term outcomes associated with participation in ECE. Many studies have reported concurrent impacts demonstrating that young children enrolled in high-quality ECE perform better than their peers who experience lower-quality or no ECE [9]. Additionally, a commonly accepted conclusion is that children at risk for educational failure who participate in high-quality ECE enter kindergarten “more ready,” possessing skills comparable to their more advantaged peers [1,10]. There is less agreement about longer-term benefits with some studies documenting the continuation of early gains while other studies report the leveling off or fade out of initial gains (e.g., [2,11,12]).
For example, the Head Start Impact Study [12] and the Tennessee Pre-K Program [2,13] have recently reported mixed or negative longer-term results. The Head Start Impact study showed positive concurrent impacts on preschool children’s early academic development and school readiness while the children were enrolled in the preschool program, finding statistically significant differences between the Head Start group and the control group on every aspect of children’s preschool experiences measured. However, these early gains were not sustained for the whole sample by the end of Grade 1 [12]. Instead, by the end of Grade 1, only a single significant cognitive impact was found in the area of literacy.
The initial findings of the evaluation of the Tennessee Pre-K Program also reported short-term impacts associated with public pre-K attendance. As reported by Lipsey et al. [2], at the end of pre-K, pre-K participants performed better than control children on a battery of achievement tests, with non-native English speakers and children scoring lowest at baseline benefitting the most. However, during kindergarten and primary grades, the control children caught up to the pre-K participants and generally surpassed them. Similar results were found with 3rd Grade state achievement tests with pre-K participants demonstrating lower performance than the control children. Additionally, teacher ratings of classroom behavior did not favor either group overall, with some negative treatment effects reported in 1st and 2nd Grades. Pre-K participants did have lower retention rates in kindergarten, but those lower rates did not persist through later grades. Many pre-K participants received special education designations that remained through later years, creating higher rates than for control children. The Tennessee Pre-K evaluation followed the children through middle school and, based on data from state education records, found that the children randomly assigned to attend pre-K had lower state achievement test scores in 3rd through 6th Grades than control children, with the strongest negative effects demonstrated in 6th Grade. Negative effects were also found for disciplinary infractions, attendance, and receipt of special education services, with null effects on retention [13].
These two high-visibility recent studies have generated much discussion, in part because they stand in contrast to a body of literature on contemporary preschool programs reporting benefits for children’s school readiness and later outcomes. This body of literature is reviewed in two recently published meta-analyses. The first, a meta-analysis of 22 rigorous experimental and quasi-experimental studies conducted between 1960 and 2016 on medium- and long-term outcomes associated with earlier participation in birth to age five ECE, was published by McCoy and colleagues in 2017 [14]. These authors focus on special education placement, grade retention, and high school graduation rates and conclude that their analyses support ECE’s utility for promoting child wellbeing and reducing education-related costs. The second, published by Meloy and colleagues in 2019 [9], presents a comprehensive review of rigorous evaluations of 21 large-scale public preschool programs and concludes that well-implemented programs produce substantial early-learning gains and can have lasting impacts throughout later schooling. These authors, similar to McCoy et al. [14], stress the importance of sound methodologies to clarify seemly contradictory results and to inform practice and policy. Meloy et al. [9] further note that the quality of both preschool programs and primary school affect the reported outcomes of preschool before and during elementary school.
In addition to study rigor and program quality, another potentially important variable to consider is ECE dosage. ECE dosage, defined as the amount or timing of either current or cumulative ECE participation, has been found to relate to children’s developmental outcomes [15]. For example, Li et al. [16] found that children living in low-income contexts demonstrated the highest levels of school readiness when they had received high-quality ECE during both their infancy and preschool years. Similarly, Yazejian et al. [17] found both age of entry and duration of enrollment were positively associated with receptive language at age five, with stronger effect sizes for dual language learners. These findings imply that children, especially children considered educationally at-risk, should benefit the most when they experience a large dose of ECE by enrolling in high-quality programs at younger ages and remaining in high-quality ECE for longer periods of time. However, despite the findings that the ECE program starting in infancy have demonstrated some of the largest and longest impacts [18], early dosage has received little attention in discussions of fade out. Few studies have been able to document the extent to which children experience high-quality ECE longitudinally [17] and few studies span the scope of ECE, defined as birth through age eight [19], and follow children longitudinally from infancy through the elementary grades [9]. As observed by Yazejian et al. [17] (p. 24), “such research is needed in order to determine the extent to which ECE might prevent, reduce, or eliminate the achievement gap between children from low- and middle-income families”.
The current study fills this void. The purpose of this study was to investigate, using a rigorous RCT approach and longitudinal design, short- and medium-term outcomes of participation in one contemporary model of high-quality ECE-Tulsa Educare. The focus of this report is on child outcomes, kindergarten through Grade 3, for a group of children who were randomly assigned to participate or not in Tulsa Educare as infants and experienced this high-quality ECE through their preschool years.

1.2. Educare

Educare is a comprehensive early childhood program designed to facilitate development and learning of infants, toddlers, and preschool children who are growing up in poverty. Educare started as one school in Chicago in 2000 and has, as of 2022, grown to a network of 25 birth-through-age five schools in diverse communities across the US including Omaha, Tulsa, Seattle, Central Maine, Miami, Phoenix, and Washington, DC [20]. These school currently serve approximately 4000 young children and their families.
The Educare logic model identifies four core program features, including data utilization, embedded professional development, high-quality teaching practices, and intensive family engagement. The implementation of these core features is predicted to prepare children for kindergarten, as well as longer-term academic and life success and improve family outcomes [20]. Relative to the program, Educare schools meet the Head Start and Early Head Start performance standards and go beyond them by including a variety of enhancements including: year-round, full-day services; lead teachers with Bachelor’s degrees; intensive, ongoing embedded professional development; family support staff with limited caseloads and Bachelor’s-level training; a research-program partnership with local program evaluators partnering with each site’s Educare program staff to use data to tailor continuous improvement planning; and contribution of local data to an ongoing large cross-site Educare Network national evaluation.
In each Educare location, public-private partnerships develop and implement the program which is offered at no cost to families who meet eligibility criteria, including incomes at or below the federally defined poverty level. Federal funds from Early Head Start and Head Start form the base for programming and funding, with local, state, and philanthropic sources augmenting funding [20] to support the program components described above. In addition to this unique funding model, the partnership with researchers and focus on use of data to drive program improvement are distinguishing features of Educare. Researchers track program quality and child outcomes at each Educare site. Relative to classroom quality, Educare classrooms demonstrate good to high overall quality [17,21], and a growing body of research documents enhanced child outcomes associated with Educare enrollment [20,21]. A thorough description of the Educare program is available in Yazejian et al. [21]. The Educare website [20] also offers additional information about Educare, including its history and current program, research, and policy initiatives.

1.3. The Educare RCT

After demonstrating initial promising results showing that early enrollment as infants or toddlers and more time enrolled in Educare (3 years was optimal) were related to better receptive language skills in children at program exit at age five [17], the Educare Network implemented a randomized control trial (RCT) of Educare (hereafter referred to as the Educare Cross-site RCT). In 2010, five collaborating Educare schools [Chicago, Milwaukee, Omaha (two schools), and Tulsa] agreed to participate in the RCT with coordination and oversight by researchers at the Frank Porter Graham Child Development Institute (FPG). A total of 239 infants 19 months of age or younger, eligible for Early Head Start, were randomly assigned to receive Educare or not across the five participating schools. All 239 families, recruited following typical strategies used by each Educare school, wanted their child to attend Educare and provided informed consent to participate in a study that involved random assignment. Based on random assignment, half of the children were enrolled in their local Educare school and the other half were not enrolled in Educare but were provided information about other ECE programs, many at no or low cost, in their surrounding area. As noted, recruitment occurred locally at each Educare school, but random assignment of children into treatment or control groups was completed by FPG to ensure rigor and consistency across the participating Educare schools.
At the pre-randomization visit, trained research staff conducted parent interviews to collect family demographics and administered baseline assessments of children’s auditory language skills. Analyses conducted for the Cross-site Educare RCT Study confirmed that the treatment and control groups did not differ on the five child characteristics, eight family characteristics, and five prior childcare characteristics assessed, nor on their scores on the auditory comprehension measure administered prior to randomization [22].
The results of the Educare Cross-site RCT have been reported in two publications. The Year 1 results showed that compared to the control group children who did not attend Educare, after one year of treatment the Educare treatment children had higher English language skills, more positive parent-child interactions, and fewer parent reports of problem behaviors [22]. The age three results showed that Educare children had better language, math, and behavior skills than the control group children who did not attend Educare. For English language and math skills, dual language learners benefited more than children whose primary language was English. No treatment effects were found for parent-child interactions at age three [23]. Thus, the Educare Cross-site RCT documented concurrent benefits associated with attending a high-quality ECE program with the children randomly assigned to the treatment group scoring higher on measures of early academics and social-emotional development.

1.4. Current Study

The purpose of the current study was to investigate if the concurrent benefits associated with attending a high-quality ECE program demonstrated by the Educare Cross-site RCT persisted through kindergarten and early elementary school. Thus, the research question was focused on investigating if the early enhanced child outcomes found for the Educare toddlers and preschoolers were sustained versus fading out through Grade 3. The availability of local funding enabled the Tulsa-based research team to continue to follow the children in Tulsa who participated in the larger Educare Cross-site RCT through Grade 3. The primary objective was to inform local partners, including funders, and the field at large about the short- and medium-term child outcomes through Grade 3, associated with participation in a high-quality early childhood program initiated during infancy.
Given that the sample for this current study involves only graduates of the Tulsa site of Educare, a few additional details are provided about its history and program. Although Tulsa Educare currently consists of four schools serving a racially and ethnically diverse group of 656 children ranging in age from six weeks to age five, the sample of this study were all enrolled in the first site that opened in 2006. Thus, it met the RCT’s criteria of being a “mature” school because it had been in operation for 4 years prior to the start of the Educare Cross-site RCT in 2010. At that time, this Tulsa Educare school enrolled 200 children and offered 8 multiage infant/toddler rooms, each serving 8 infants/toddlers (total of 64 infants/toddlers), and 8 multiage preschool rooms serving 17 3- and 4-year-olds each (total of 136 children). Each classroom was staffed with two adults including a lead teacher with a Bachelor’s degree in ECE and an assistant teacher with specialized ECE training. Additionally, an aid who “floated” across every two adjacent classrooms on both the infant/toddler and preschool wings of the building was available. Thus, for every two classrooms, a total of five adults served as consistent staff. In addition to the classroom staff, dedicated family support staff were assigned a consistent caseload of families. The daily classroom practices and curriculum were designed to meet the standards of Educare [20,21], which are based in developmentally appropriate practices [19] as defined by the larger ECE field.

2. Materials and Methods

2.1. Participants

This longitudinal study built upon the Educare Cross-site RCT described above. Tulsa Educare contributed 75 RCT participants, 31% of the total Educare Cross-site RCT sample, at the beginning of the study in 2010. Based on the random assignment completed by FPG in 2010, the Tulsa subsample consisted of 37 treatment children who enrolled in Tulsa Educare at 19 months of age or younger and 38 control children. Information about initial recruitment and randomization of study participants was summarized in Section 1.3 above and more details can be found in Yazejian et al. [22].

2.1.1. Child and Family Characteristics

The Tulsa subsample consisted of 38 girls and 37 boys who were equally distributed across treatment and control groups. When group assignment was considered, the treatment group had 16 girls (43%) and 21 boys (57%); the control group had 22 girls (58%) and 16 boys (42%). Additional demographics are displayed on Table 1 and show that the Tulsa sample was diverse in race and home language, with the largest percentage of both treatment and control groups classified as Hispanic (74% treatment, 90% control) with a home language reported as Spanish (70% treatment, 71% control). Most children lived with both parents or only with mothers in families classified as economically disadvantaged and eligible for Early Head Start/Head Start services. Preliminary analysis showed that children in the treatment and control groups did not differ on these child and family characteristics.

2.1.2. Prior Early Childhood Experience

The children randomly assigned to the treatment group in 2010 enrolled in and attended Tulsa Educare as infants, toddlers, and preschoolers. The average length of enrollment in Tulsa Educare for the treatment group children was 37 months. The children randomly assigned to the control group did not enroll in Tulsa Educare and participated in other family-selected care arrangements available in Tulsa at the time. Children in the control group often had multiple care arrangements, simultaneously and over time. Of the 38 control group children, 22 received care by a relative or family friend, five attended a public-school preschool program, five attended a local Head Start program, three a community-based childcare center, two experienced family-based childcare, and one reported use of a babysitter.
Children in the Tulsa Educare treatment group were reported to have also experienced other forms of early care in addition to their Tulsa Educare enrollment. Based on parent report, 26 children were cared for by a relative or friend in addition to attending Tulsa Educare. A few children experienced family-based childcare (1), a babysitter (1), or a community-based childcare center (2) at the same time they attended Tulsa Educare. Parents reported that several children had also enrolled in another Head Start program (2) and public pre-K (5).

2.2. Procedure

All study procedures and collaboration agreements were reviewed and approved by the Institutional Review Board of the University of Oklahoma (#0709/12975). As reported by Yazejian et al. [23], at the initiation of the Educare Cross-site RCT, each participating Educare school’s Policy Council and each affiliated research team’s Institutional Review Board reviewed and approved all procedures, including Tulsa’s; regional and national Head Start offices were also briefed on the study.
A wide variety of data sources and perspectives were included in this longitudinal follow-up study with data collected from children, parents, and teachers. The data included information about children’s early academic skills in literacy, language, and math and executive function collected through one-on-one administration of standardized tests. Direct child assessments occurred twice per year, every fall and spring, kindergarten through Grade 3. Parents were surveyed each spring, kindergarten through Grade 3, to collect information about the home, children’s activities, relationships between children and parents, and parental stress. Teachers completed surveys in the fall and spring each year to provide information about the children’s social-emotional development, behavior, and relationships at school. Classroom quality was observed and rated annually in the winter from kindergarten through Grade 3 for both the treatment and control group children. The specific measures are described below.
Assessors were employees of a university-based early childhood research group and were trained on the ethical conduct of research with children and on the specific measures used in this study. Relative to training for the standardized child assessments, assessors first reviewed the test manuals and practiced administration with a co-worker. Next, they administered the test to a child during a practice session while being observed by a member of the research group’s training team who rated the assessor using a checklist. Based on this observation and each assessor’s performance on the checklist, the training team followed up with any required coaching to ensure proper standard administration. Classroom observers were deemed reliable using the protocols and standards outlined by the observational tool’s authors. Observers viewed five online videos and submitted their scores. To be considered reliable, observers needed to score 80% of all coded items within one point of the master codes, and to code at least 2 out of 5 items within each dimension within one point of the master codes. All observers met or exceeded this criterion. Following standard protocol for RCTs, assessors were kept blind to the group assignment of the children throughout the duration of the study.

2.3. Measures

2.3.1. Early Academics

Each fall and spring, kindergarten through Grade 3, children were administered standardized measures of early academics in their school setting. Specifically, measures of early language, literacy, and math were administered. Standard scores from these assessments of early academic skills were used in the analyses.
The Peabody Picture Vocabulary Test, Fourth Edition (PPVT-4; [24]) was used as a measure of receptive vocabulary. The PPVT-4 is widely used in research and assesses receptive vocabulary from ages 2 years 6 months to late adulthood. It is administered individually using a multiple-choice format with four pictures presented on one page and the task is to select the one picture that best illustrates the definition of a word presented by the assessor. The items include up to 20 content areas (e.g., actions, vegetables, tools) and parts of speech (nouns, verbs), spanning a broad range of difficulty. The PPVT-4 has been documented to have strong psychometric properties. Test-retest reliability has been reported between 0.92 and 0.96, and internal consistency estimates consistently at 0.95 or above [25]. Construct and convergent validity have been assessed by comparing the PPVT–4 to the Expressive Vocabulary Test, Second Edition (EVT–2; [26]). Correlations between the two were high (r = 0.80–0.84) for all ages [25].
Several subtests of the Woodcock-Johnson III Tests of Achievement (WJ-III; [27]) were used to assess children’s academic outcomes. Widely used in research, the WJ-III includes 22 tests measuring skills in reading, mathematics, and writing, as well as important oral language abilities and academic knowledge [28]. For this study, the following subtests were individually administered to assess children’s academic skills: Letter-Word Identification (Test 1) to assess recognition of letters and words and reading decoding; Applied Problems (Test 10) to assess quantitative reasoning and math knowledge and achievement; Picture Vocabulary (Test 14) to assess oral expression and language development, specifically lexical access and retrieval; and Oral Comprehension (Test 15) to assess listening ability and comprehension. The WJ-III is accepted as a valid and reliable assessment tool of both cognitive abilities and achievement among children and adults [29]. McGrew and Woodcock [30] presented comprehensive evidence of strong psychometric properties in the WJ-III Technical Manual. Content validity evidence, convergent and discriminant validity evidence, and evidence based on relations to other variables have also been published [31,32,33] with coefficients meeting professional standards.

2.3.2. Executive Function/Behavior Regulation

Each fall and spring, kindergarten through Grade 3, children were also administered two measures of executive function (EF) in their school setting. These two measures are described below.
The Head-Toes-Knees-Shoulders (HTKS; [34,35,36]), is a game-like behavioral assessment of self-regulation. The HTKS consists of three parts. First, children are taught to follow simple instructions (e.g., “Touch your head”) and then asked to do the opposite of the assessor’s instructions (e.g., touch their head when asked to touch their toes) with one pair of two body parts (head/toes). During part two, two more body parts are added (knees/shoulders) and the assessor asks the child to do the opposite on both pairs or all four body parts. In the third part, additional rules are added to increase cognitive complexity. Specifically, the instructions are switched to mix the prior pairs from head/toes and knees/shoulders to head/knees and shoulders/toes. As conceptualized by the authors, this assessment involves inhibitory control (a child must inhibit the dominant response of imitating the examiner), working memory (a child must remember the rules), and focused attention (must focus on the directions presented by the examiner).
HTKS was designed for research with children between the ages of 4 to 8 and is brief, taking about 5 min to administer. It consists of 30 items, with a range from 0 to 60. Children receive a score of 0 for an incorrect response, 1 for a self-corrected response, and 2 for a correct response [37]. For the current study, raw scores were used in the analyses. As reported by Schmitt et al. [37], the HTKS has been found to have high interrater reliability (κ > 0.90) and documented validity in assessing children’s behavioral self-regulation in culturally diverse samples [36], and has been positively and significantly correlated with teacher ratings [35,36]. Prior research has also documented other strong psychometric properties, including predictive validity for achievement outcomes [36,38] and evidence suggesting that the HTKS may be a stronger predictor of early academics than teacher report on other widely used measures [38,39].
The Digit Span Forward (DSF) and Backward (DSB) subtests of the Wechsler Intelligence Scale for Children-Fourth Edition [40] were used in this study as objective measures of different aspects of verbal working memory. DSF is a measure of the verbal storage-only component of working memory; DSB is a measure of the storage and processing components of verbal working memory [41]. The author [40] and others [41] have provided evidence of excellent psychometric properties, including high internal consistency reliability and construct validity. As the name suggests, with DSF a sequence of digits was presented to each child at a rate of one per second by the assessor and the child was asked to immediately repeat the digits in the exact order presented. The DSF subtest starts with 2 digits and becomes more difficult as the sequence of digits is lengthened to a maximum of 9 digits. The raw score for DSF is the number of correct trials with a maximum raw score of 16. With DSB, each child was asked to repeat sequences of digits in reverse order. The raw score of DSB is the number of correct trials with a maximum raw score of 14. Raw scores were used in the analyses conducted in the current study.

2.3.3. Social Emotional (SE) Development

Teachers completed the Devereux Student Strengths Assessment-Mini (DESSA-Mini; [42]) each fall and spring kindergarten through Grade 3. The DESSA-Mini was designed to be a brief 8-item, strengths-based, teacher-completed screening tool of student social-emotional competence [43]. The DESSA-Mini yields a single score: the Social-Emotional Total (SET). DESSA-Mini results are provided as T-scores, with high scores indicating strengths. The authors have presented evidence of strong reliability (internal, test-retest, inter-rater) and validity (criterion, both concurrent and predictive, and construct). More information about the development and psychometrics of the tool can be found in Naglieri et al. [42] and LeBuffe et al. [43]. The internal consistency reliability of social-emotional skill was 0.93 for the current study sample. T-scores were used in the analyses completed for this study.

2.3.4. Classroom Quality

The Classroom Assessment Scoring System (CLASS K–3; [44]) was used to observe classroom interactions among teachers and children each winter from kindergarten through Grade 3. Like other versions of the CLASS developed for various age groups, the CLASS K-3 measures three domains: Emotional Support, Classroom Organization, and Instructional Support. Each of these three domains consists of several dimensions. Specifically, Emotional Support comprises the following dimensions: positive climate, negative climate, teacher sensitivity, and regard for student perspective. Classroom Organization consists of behavior management, productivity, and instructional learning formats. The Instructional Support domain has concept development, quality of feedback, and language modeling. Each dimension is rated on a 7-point scale ranging from low (1–2) to middle (3–5) to high (6–7) based on observations occurring for 20-min over repeated cycles (see [44] for additional administration details). This study used four observation cycles.
CLASS dimension scores are calculated by averaging scores across cycles within an observation. Domain scores are calculated as the mean across the dimensions within a given domain. A total score is calculated across the three domains [44]. In this study, the average of total scores from kindergarten to Grade 3 was used for the statistical analyses.
The CLASS has been used extensively in evaluation and research in ECE [45]. The Office of Head Start uses CLASS scores to determine the accreditation of new pre-kindergarten centers around the nation [46]. The growing use and acceptance of the CLASS framework in research and practice has prompted studies of the psychometric properties of the CLASS, as well as evaluation of the relationship between CLASS scores and a variety of academic and behavioral outcomes [44]. Current psychometric evidence provides support for continued use of the CLASS to guide intervention, instruction, professional development [47] and research.

2.3.5. Demographics and Home Environment

Information about child and family characteristics and the home environment were obtained through two sources: an annual parent survey and school administrative records. Each spring parents completed a survey that collected basic demographic information, including family employment status, family structure, education level of primary caregiver, and home language. This survey also included items adapted from existing scales to gather information about home activities the parent engaged in with the child (adapted from the National Household Education Survey [48]) and parent stress (adapted with permission from the Parenting Stress Index Short Form [49]. School administrative records were accessed annually to collect and confirm variables, including child language status (if the child was a dual language learner or DLL), economic disadvantage, and child sex.
Specifically, this study included child sex (0 = girl, 1 = boy), DLL status (0 = English monolingual, 1 = dual language learner) and economic disadvantage (0 = no, 1 = yes) collected in kindergarten as time-invariant variables. As time-variant controls, this study includes primary caregiver education level (1 = 8th Grade or less, 2 = some high school, no diploma, 3 = high school diploma or GED, 4 = some college, no degree, 5 = high school/GED and tech training certification, 6 = AA, AS, or 2-year degree, 7 = Bachelor’s degree, 8 = Master’s degree, 9 = Doctoral degree), home activities (e.g., reading to child, teaching letters, sounds, or words to child, working on writing; 1 = 1–2 times a week, 2 = 3–5 times a week, 3 = 6–7 times a week), parent stress levels (e.g., feeling cannot handle things well, feel trapped, feeling alone; 1 = strongly disagree to 5 strongly agree), and parent expectation (parent prediction of how far child will go in education; 1 = some high school, 2 = finish high school or obtain GED, 3 = tech school or college, 4 = college, AA degree, 5 = college, BA degree, 6 = graduate or professional school). Multiple scores for the time-variant controls were aggregated for each child and the aggregated scores were used in the final analysis.

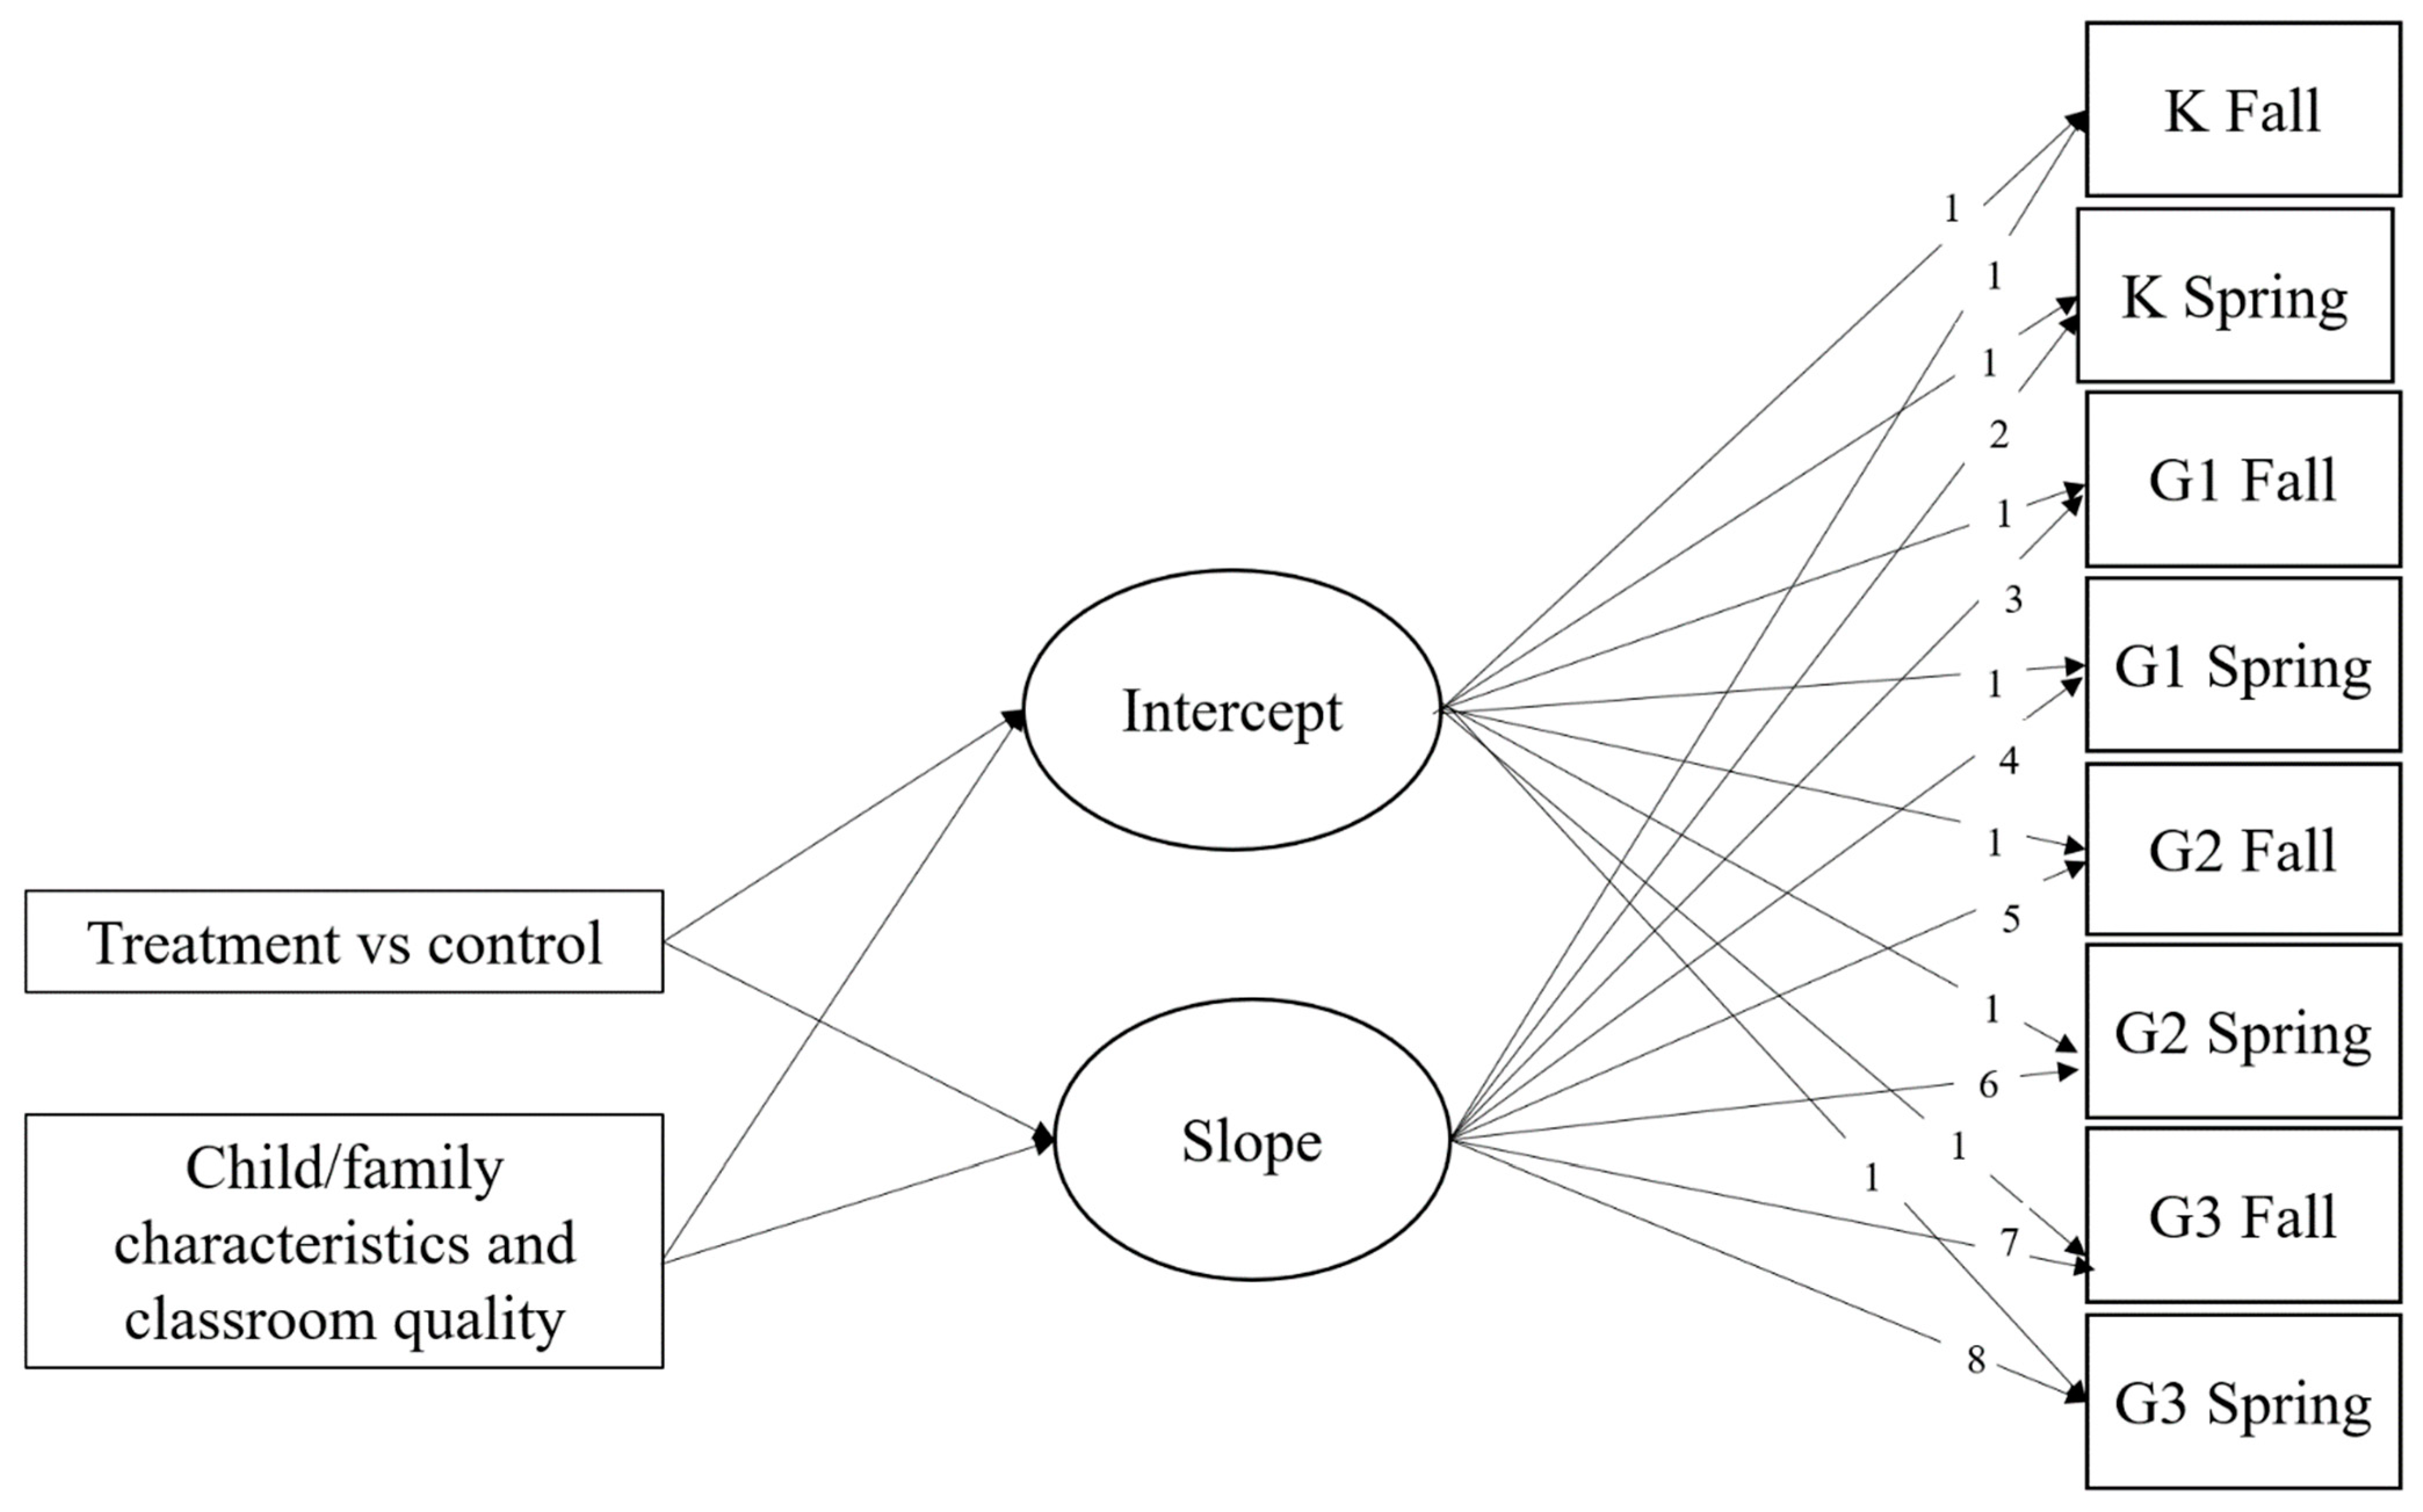
2.4. Analytical Process

Recognizing that attrition is a significant challenge in longitudinal research, we conducted additional analyses to explore if differential attrition occurred and, thus, compromised the assumptions of randomization. We found that 11 children did not have any data from K to G3 indicating that they permanently dropped out of the data collection for this project. Although this local evaluation project was successful in retaining 82% of the sample through fall of Grade 2, after COVID-19 stuck in March of 2020, many children in both the treatment and control groups were lost. We explored if children who participated in this study after 2020 differed in their group assignment and earlier developmental outcomes from the children who did not participate in this study after COVID-19. We confirmed regardless of their group assignment (i.e., treatment and control groups), participants and non-participants in this study after spring 2020 were not different in earlier developmental outcomes and demographics.
Descriptive statistics, including means and standard deviations for the developmental outcomes were computed for the two groups, Tulsa Educare treatment and control groups, using IBM SPSS Statistics (version 27). In the descriptive data-checking process, two outliers showing extremely low scores (2 SD below mean) across all assessments consistently from K to Grade 3 were identified. The research team consulted with the assessors, who had been with this study for its duration, and confirmed that these two children were often unable to be assessed due to significant disabilities. Thus, to increase the validity of the results, the data of these two children (one from treatment group and one from the control group) were excluded from the analyses.
We do not have any available data for inputting the missing scores of the 11 children who dropped out of this study before K and, with the two extreme outliers we confirmed and excluded, a total of 13 children were not included in the final analyses. In addition, although the final sample includes 62 children (treatment = 31 and control = 31), at each time point different numbers of children participated due to a variety of reasons, including their absence from school during data collection. Table 2 shows the number of treatment and control group children who participated in data collection at each grade. We further examined how many times each child participated in the direct child assessments from K to Grade 3. Most of the children (n = 55) participated in data collection for more than 5 of the 8 possible time points (6 times: 20, 7 times: 24, and 8 times: 11), with 7 children participating less than 6 time points (5 times: 5 and 4 times: 2). Given the available scores for each child, we confirmed that their missingness occurred randomly.
After making this decision resulting in the final analytic sample, we conducted descriptive statistics and t-tests to identify potential differences in developmental outcomes from kindergarten through Grade 3 between the two groups. The results are presented in Table 3.
Before conducting longitudinal latent growth curve (LGC) models, we imputed missing data based on the assumption of missing at random in this study sample [50]. All the study variables were included in the multiple imputation model and 20 imputed data sets were generated. The 20 datasets were used for the final LGC models. To answer the research questions, LGC models were conducted using Mplus [51]. In the LGC models, the intercept and slope were set to identify potential group differences in each outcome from kindergarten through Grade 3. In the models, we created two latent constructs for the intercept and slope. The latent constructs include children’s scores of each outcome across 8 time points as indicators. The indicators were loaded with time specifications. Specifically, time was constrained as 1 through 8 (kindergarten fall (1) and spring (2) through 3rd Grade fall (7) and spring (8)) to represent the time points from kindergarten to Grade 3 with a linear developmental concept. Thus, the intercept reflects the overall differences (an average from K to G3) between two groups in each child outcome, and the slope reflects the linear growth pattern from kindergarten to Grade 3 for each developmental outcome. As the main predictor, a binary variable indicating whether children participated in Educare or not (0 or 1) regressed on the intercept and slope. In addition, child/family characteristics and classroom quality scores were used as control variables for both intercept and slope in the analytical models. The conceptual model is displayed in Figure 1.
As noted in the Measures section, standard scores were used for the early academic measures (WJ-III and PPVT-4), while raw scores were used for both executive function measures (HTKS and Digit Span). For the social-emotional measure (DESSA-Mini), T-scores were used in the LGC model. The linear growth of HTKS and Digit Span reflects whether children have shown more correct answers from kindergarten to Grade 3, while the linear growth of other measures reflects whether children showed developmental growth relative to same-age peers.

3. Results

3.1. Descriptive

As displayed on Table 3, descriptive results showed, overall, that Tulsa Educare children scored higher on academic outcomes at most time points from kindergarten through Grade 3. In fact, for 19/20 contrasts the Tulsa Educare children scored higher on the measures of early academics, with several significant differences emerging between the Educare treatment and control children. Although Tulsa Educare children scored higher on the two measures of EF from kindergarten through Grade 3, with 7/8 of the contrasts favoring the Tulsa Educare children, no differences were statistically significant. The two groups of children were rated similarly in their SE skills over time with no significant differences evident in the average teacher ratings. These results are described in more detail below.
As noted, in early academics, Educare attendees generally scored higher on the five measures of early academic achievement than their control group peers across K through Grade 3. Specifically, language scores (receptive vocabulary, letter word identification, picture vocabulary, and oral comprehension,) were higher for the Tulsa Educare group than those attained by the control group at the end of K through Grade 3. Four comparisons were statically significant: picture vocabulary at both Grade 1 (MT = 91.47, MC = 82.71, p < 0.05, d = 0.60) and Grade 3 (MT = 97.37, MC = 86.06, p < 0.01, d = 1.04) and oral comprehension at both Grade 1 (MT = 101.63, MC = 91.23, p < 0.01, d = 0.75) and Grade 3 (MT = 103.37, MC = 87.17, p < 0.01, d = 1.20), with the children who attended Tulsa Educare achieving statistically significantly higher scores that were near national averages. Math scores (applied problems) for the Tulsa Educare treatment group were higher than the control group across K to Grade 3. Two timepoints were statistically significant–the Tulsa Educare group scored significantly higher than their control group peers in math at the end of K and Grade 3 (K: MT = 101.41, MC = 90.48, p < 0.01, d = 0.85; G3: MT = 95.16, MC = 83.72, p < 0.05, d = 0.68).
Relative to EF, although children who attended Tulsa Educare generally performed slightly better across kindergarten through Grade 3 on both measures of EF, no statistically significant differences were attained. Raw scores were used for both HTKS and Digit Span, so interpretation is challenging. However, the HTKS scores attained by the kindergarten age children in this study are similar to the means reported by other authors [52,53] for kindergarteners drawn from mixed-income samples. The Digit Span means reported for children in this study are higher than those reported for 6- and 7-year-olds in a 2000 study conducted with children eligible for free lunches, a proxy for low-income status [54]. Teachers rated children in the control group either equal to or slightly higher in social-emotional development than children in the Tulsa Educare treatment group each spring kindergarten through Grade 3. This is the one developmental domain where the control group was rated higher in K through Grade 3 than the treatment group. However, these group differences did not reach the level of statistical significance and were minimal in magnitude.

3.2. Development of Children in Treatment and Control Groups

Table 4 presents results from LGC models, including intercept (the average score of each outcome K through G3) and slope (the linear growth of each outcome from K to G3) as outcomes with the group assignment (1 = Educare/Treatment group, 0 = control group) as the main predictor, and child and family characteristics and classroom quality as controls. For academic skills, Educare children’s average receptive vocabulary, letter word, picture vocabulary, oral comprehension, and math skills from kindergarten through Grade 3 were higher than children in the control group. However, the linear growth in these academic skills was not significantly different between the two groups. That is, the two groups were not significantly different in the growth rates of academic skills over time.
Inconsistent findings occurred for the two EF measures. We found Tulsa Educare children’s average EF skills measured by Digit Span from K through G3 were significantly higher than children in the control group, while we did not find a significant difference in EF skills measured by HTKS between the two groups. In addition, the linear growth of the EF skills was not significantly different between the two groups. There was not a significant difference in the average and development of social skills from K to G3 between the two groups.
Results for the control variables from growth curve models are presented in Appendix A.

4. Discussion

This longitudinal study investigated child outcomes, kindergarten through Grade 3, of 75 children randomly assigned as infants to either participate or not in Tulsa Educare, an enhanced Early Head Start/Head Start program. It was hypothesized that the children who experienced this high-quality ECE program as infants, toddlers, and preschoolers would perform better than their control group peers across a range of measures from kindergarten through Grade 3. Specifically, we investigated two research questions–if any differences persisted from K through Grade 3, and if rates of growth differed for the two randomly assigned groups from kindergarten through Grade 3.
Relative to the first research question, random intercept models computed to investigate group differences in each outcome from kindergarten through Grade 3 showed children in the treatment group demonstrated significantly higher skills in vocabulary (WJ-III Picture Vocabulary, PPVT-4 Receptive Vocabulary), oral comprehension (WJ-III Oral Comprehension), and math (WJ-III Applied Problems) than children in the control group. Mixed results were found for EF with one measure (Digit Span) showing significant differences in favor of the Educare treatment group, while the second measure (HTKS) was not different between the two groups. No significant differences were found for social-emotional development. To address the second research question, linear slopes were added to the models to identify potential group differences in the growth (slope) of each outcome from kindergarten through Grade 3. There was not a group difference in the growth of developmental skills. Thus, children’s rate of growth for language, math, EF and social-emotional skills were not different between control and treatment groups from kindergarten to Grade 3. Taken together, these results suggest the high-quality ECE prompted early academic gains that persisted through Grade 3. The two groups did not demonstrate differential growth from K to Grade 3—the treatment children’s growth did not slow, or fade and the control group did not catch up. Instead, the Educare treatment children entered K better positioned in academic skills and that boost maintained over the elementary grades.
Our discussion will focus on how these findings align with the results reported for the larger Cross-Site Educare RCT Study [22,23] and the broader contemporary early childhood literature. However, to adequately demonstrate continuation versus fade out of ECE impacts for this Tulsa Educare sample, additional details about how the Tulsa subsample performed in the Educare Cross-site RCT are needed. Overall, results obtained for the Tulsa subsample mirror those reported for the larger Cross-site Study. As reported by Horm et al. [55], after 1 year of Tulsa Educare, the toddlers randomly assigned to the treatment group demonstrated significantly higher auditory comprehension skills in English (T = 90.35, C = 79.48, p < 0.05, d = 0.66) and Spanish (T = 95.03, C = 82.29, p < 0.01, d = 0.79) and fewer parent-reported behavior problems (T = 10.71, C = 16.23, p < 0.01, d = −0.81). At age three, the significantly better English auditory comprehension (T = 87.39, C = 74.40, p < 0.01 d = 0.70) and significantly fewer parent-reported problem behaviors continued for the Tulsa Educare treatment children versus their control group peers (T = 9.82, C = 14.10, p < 0.05, d = −0.66). At age five and kindergarten entry, the Tulsa-only RCT findings showed that the Tulsa Educare treatment children showed better K readiness overall with significantly better performance in math (math at age 5: T = 100.32, C = 91.20, p < 0.01, d = 0.80; at K entry: T = 101.74, C = 92.71, p < 0.01, d = 0.99) with scores at the national average. These results combined with the results of the current study make the case for continuation of ECE gains through Grade 3 in early academics. Each disciplinary area will be discussed in more detail below.
As reported by Yazejian et al. [22] for the Educare Cross-site RCT Study, after one year of Educare the children who attended Educare demonstrated significantly higher English language skills in both expressive (PLS-4 Expressive Communication; d = 0.35) and receptive (PLS-4 Auditory Comprehension; d = 0.56) domains compared to their control group peers. These authors note this magnitude of effects, as indicated by effect sizes, for receptive and expressive language were larger than effects reported for investigations of other early interventions designed for infants and toddlers, including Early Head Start, Baby FACES, and NICHD ECCRN [22]. The age three results of the Educare Cross-site RCT study [23] found that compared to children in the control group, children who received the expected dose of Educare scored significantly higher on receptive language (PLS-4 Auditory Comprehension; d = 0.25). Thus, the effect on language was shown to continue through age three, although not as strong as indicated by effect sizes as the previously reported RCT findings for the younger children after just one year of Educare [23]. This same pattern of significantly better language outcomes for the Educare treatment children was also evident in the Tulsa-only sample of the Educare RCT study after one year of Tulsa Educare and at age three (PLS-4 English Auditory Comprehension; d = 0.70). Thus, the results of this study showing significantly enhanced language outcomes for Tulsa Educare children over their control peers through Grade 3 are consistent with earlier findings and support the view that high-quality early care and education experiences provide an initial and ongoing boost, through Grade 3, for language outcomes. As noted by Meloy et al. [9], persisting gains in language and literacy are commonly reported in the studies investigating effects through elementary school. Again, the effect sizes at the end of Grade 3 found for our Tulsa sample (d = 1.04 for Picture Vocabulary; d = 1.20 for Oral Comprehension) indicate strong sustained effects.
Relative to math, the Educare treatment children showed significantly better performance compared to their control group peers at age three in the Educare Cross-site RCT Study ([23]; d = 0.28) and at age five (d = 0.80) and kindergarten entry (d = 0.99) in our Tulsa-only sample [55]. This finding is consistent with the published literature on continuing math gains associated with preschool attendance. As noted by Meloy et al. [9], several robust studies have reported continuing gains in math through elementary school. The effect sizes demonstrated by our Tulsa-only sample at age five (d = 0.80), k entry (d = 0.99), and at the end of kindergarten (d = 0.85), and Grade 3 (d = 0.68) demonstrate moderate to strong persisting effects.
Although investigated, no differences were found in rated social-emotional development of the Tulsa-only sample from kindergarten through Grade 3. This finding is inconsistent with results found at younger ages with this Tulsa sample and with differences found in the larger Educare Cross-site RCT Study when the children were younger. For the Tulsa-only sample, results showed differences between the Tulsa Educare treatment and control groups on behavior problems reported by parents. At both the toddler period and at age three, parents of children enrolled in Tulsa Educare reported fewer behavior problems than parents of control group children [55]. In the larger Cross-site Educare RCT, Yazejian et al. [22] found that compared to the control group the Educare infants and toddlers had significantly fewer parent reports of problem behaviors (BITSEA Problems, d = 0.28) and more positive parent-child interactions (d = 0.42). Similarly, at age three, Yazejian et al. [23] reported that compared to children in the control group, children who received the expected dose of Educare continued to show significantly fewer parent-reported behavior problems (BITSEA Problems, d = 0.28). Relative to the lack of consistency with no continuation of the earlier group differences found with the Tulsa sample, it is challenging to draw conclusions. However, it is important to consider the measurement of social-emotional development at the various timepoints. As with most research, we did not have direct assessments of children’s social-emotional behavior and relied instead on ratings provided by others who have extended contact with the children and are, thus, better positioned to rate their behavior. The raters differed as the children grew older with parents rating their infant, toddler, and preschooler, and teachers rating the children from kindergarten through Grade 3. While this is one possible explanation for the lack of consistent findings over time, the ratings provided by teachers suggest no differences between the Tulsa Educare treatment and control groups in negative or positive social-emotional development over the kindergarten-to-Grade-3 period.
Relatively few studies have evaluated social-emotional skills and EF in elementary years and the findings have been mixed [9]. Meloy and her colleagues [9] note that the mixed results are not surprising for at least three reasons. One challenge they identify is the issue described above–studies vary in their approaches and measures used to capture social-emotional skills and executive function. As noted above, the Educare Cross-site RCT findings are based on parent ratings and observed parent-child interactions, while the Tulsa Educare Follow-Up Study relied on teacher ratings of behavior when the children were older. Second, they [9] note that measures of social-emotional development are less developed than measures of language or early academics. Last, there is “limited research on the specific dimensions of social-emotional learning that are most important for later well-being or the ways in which elementary experiences may influence the social-emotional skills and executive function of children who previously participated in preschool” ([9], p. 21). In essence, existing measures may not assess the critical variables or capture them accurately at different ages.
This study also examined classroom quality because children’s early learning and developmental trajectories are assumed to depend on the quality of their experiences not only before and during preschool, but also following [56]. Overall classroom quality as measured by the CLASS was in the mid-range (overall CLASS scores of 3.9–4.6) for both the Educare treatment and control groups across all years from K through Grade 3. Relative to the CLASS domains, emotional support and classroom organization scores were in the mid-range and instructional support scores in the low range across all years. This level and pattern of observed quality is consistent with other published research documenting classroom quality in primary grades using the CLASS K-3. Sandilos et al. [47] examined CLASS K-3 data from 141 Grade 1 and 2 classrooms from both urban and rural districts and reported that average emotional support and classroom organization scores were within the middle-to-high ranges, while instructional support scores fell in the low range. Although typical of primary school classrooms, this level of observed quality is lower than that experienced by the Tulsa treatment group children when they were younger. Classroom observations conducted when the treatment group children participating in this follow-up study attended Tulsa Educare documented higher quality in the Tulsa Educare classrooms than that evident in the elementary classrooms these children later experienced. When the Educare treatment children were enrolled in infant-toddler classrooms at Tulsa Educare, the observed quality, reported as part of another ongoing evaluation study [55], was recorded to be in the good-to-high range. Specifically, average ITERS-R scores ranged from 5.3 to 5.8, CLASS Toddler scores averaged 6.0 to 6.3 for emotional support, and 4.6 to 5.0 for engaged support for learning. The Tulsa Educare treatment children also experienced good-to-high quality in the Tulsa Educare preschool classrooms they attended. The measured quality for these preschool classrooms during the years of their enrollment averaged 6.0 on the ECERS-R, with average CLASS Pre-K scores recorded as 6.7 for emotional support, 6.2 for classroom organization, and 4.3 for instructional support.
The levels of classroom quality observed K though Grade 3 in concert with the EF and academic child outcomes do not support the common assumption that later classroom quality was responsible for the continuation of the preschool gains—known as the sustaining environments hypothesis [57]. As discussed above, overall classroom quality as measured by the CLASS was in the mid-range across all years, K through Grade 3, for classrooms serving both Tulsa Educare treatment and control group children. The classrooms experienced by both groups did not differ on the CLASS domains of emotional support or classroom organization, which were both classified as the middle range of quality, or in instructional support, which was observed to be classified as low quality across years. Thus, the findings of this study do not align with the sustaining environments hypothesis [57] that has been commonly accepted [56] as a potential explanation for the continuation or fade out of early childhood gains. Instead, an argument can be made, based on these findings, that it is likely that the classroom quality the children experienced prior to K and prolonged exposure to the high-quality infant/toddler and preschool environments through continued enrollment in the Tulsa Educare program are responsible for the documented earlier gains being sustained through Grade 3. As reported, the children in the Tulsa Educare treatment group had an average of 37 months of enrollment spanning infant/toddler and preschool classroom participation [55]. This is consistent with other studies finding that ECE dosage is important. As mentioned in the Introduction, past research has found that kindergarten readiness is enhanced for children living in low-income contexts when they enroll in high-quality ECE early and stay enrolled during their infant, toddler, and preschool years [16,17]. The current study reinforces this small body of literature by adding evidence that children, especially children considered educationally at-risk, benefit when they experience a large dose of ECE by starting early. Importantly, the findings of this study extend the current literature by showing that the impact of the early high-quality ECE dose extends through Grade 3 in the important areas of early academic skills of literacy, math, and perhaps EF. It has been noted that few studies follow children longitudinally through elementary school [9], especially studies that start in infancy and document program quality [17]. This study adds to the small but growing literature documenting that ECE programs starting in infancy have some of the largest and longest impacts (e.g., [18]).
It is important to acknowledge the limitations of this study including a small sample size and attrition, especially that related to COVID-19. Another threat to the study was the documented fact that approximately a third of the control group took advantage of the rich ECE options available in Tulsa at the time by enrolling in other group ECE programs [55]. These threats should have attenuated the results. However, as reported above, this study found a consistent pattern of significant academic outcomes, with medium-to-large effect sizes, favoring the children who had been randomly assigned to the high-quality ECE Educare treatment group. The pattern of results was also consistent across time, starting with our earliest assessment of skills when the children were infants, toddlers, and preschoolers and persisting through Grade 3.
Despite the limitations, this study offers unique contributions to the literature. Although many studies examine concurrent impacts of early childhood programs or focus on impacts at kindergarten entry, fewer studies follow early childhood program participants into the early elementary grades [9]. Another unique feature of this study is its RCT design and the age at which it started with random assignment to attend Tulsa Educare or not at 19 months of age or younger. Thus, although locally focused, this follow-up study contributes to the relatively scant literature of robust longitudinal studies spanning infancy through Grade 3 to examine longer-term impacts of high-quality ECE. In addition to the findings through Grade 3 of a general pattern of continuation of positive child outcomes in early academic skills associated with earlier high-quality ECE attendance, this study also contributes information about the expected size of impacts current ECE programs that start in infancy can have. Our findings align with contemporary expectations [56] showing consistent and continuing advantages in early academic skills for the group of children randomly assigned to attend the Tulsa Educare program over similar children who experienced a range of early care and education services available at the time. However, our findings are much stronger and enduring than what some have suggested as reasonable estimates or expectations for longer-term impacts of ECE programs. For example, Brookes-Gunn and Lazzeroni [56] suggest reasonable estimates of effectiveness should be expected to fall in the small-to-medium range, not large. Specifically, they suggest a reasonable expectation is one-third of a standard deviation or more based on their review of current ECE evaluation results. They [56] also note that preschool impacts are expected to diminish over time, especially if high-quality educational services offered at sufficient intensity (i.e., full-day programs, wrap-around services) are not continued through elementary and later levels of education. Specifically, they predict a preschool effect size of one-half will become one-quarter, and a preschool effect size of one-third will become one-sixth over time. Our results do not align with these predictions and expectations. Instead, our study demonstrated medium-to-large effect sizes that persisted over the preschool-to-Grade-3 period. An open question in the current literature is how past results obtained with small-scale model programs, such as the Perry Preschool and Abecedarian studies translate to today’s contexts. This study contributes information to this discussion. In essence, medium-to-large effects that are not only positive, but consistent and enduring, are possible in contemporary high-quality programs.
Relative to policy and practice, the implications of these results suggest that high-quality center-based ECE starting prior to age two can produce robust, sustained academic benefits through Grade 3. Although our results were obtained in one city, Tulsa, the program model enacted, Educare, is currently operational in 25 sites across the country (see [20]). Given that these Educare schools operate as a network with common goals, adopt the same logic model, and share professional development and practices, it is expected that these results could be replicated across these programs and similar group programs implementing a contemporary research-based approach. In this context, it is worth repeating that Educare schools use Early Head Start and Head Start standards and funding as their foundations [58].
Although our findings document the power of starting early with a substantial dose of high-quality ECE to boost children’s academic performance in the short- and longer-term, this study does not offer insights into what mechanisms or processes occurring in classrooms or programs might explain the results, beyond the global explanation of “high-quality early care and education”. This study reinforces the need identified in the larger ECE literature to study the mechanisms supporting the continuation of earlier gains or fade out that has been inconsistently reported in the extant literature. The implication for research is that future studies should examine the dynamics and processes enacted in classrooms to better understand and explain the inconsistent findings of continuation of earlier gains in some studies and fade out in other studies [1,9]. Such research would shed light on this current controversy, but more importantly, would offer programs information on how to design and implement programs that support children in reaching their developmental potentials, and deliver on the promise of ECE.

Author Contributions

Conceptualization, D.M.H. and S.J.; Methodology, D.M.H. and S.J.; Validation, S.J.; Formal analysis, S.J.; Investigation, D.M.H. and M.A.; Resources, D.M.H.; Data curation, S.J. and M.V.C.; Writing–original draft, D.M.H. and S.J.; Writing–review & editing, D.M.H. and S.J.; Visualization, S.J. and M.V.C.; Supervision, D.M.H., S.J. and M.A.; Project administration, D.M.H. and M.A.; Funding acquisition, D.M.H. All authors have read and agreed to the published version of the manuscript.

Funding

This research was funded by the George Kaiser Family Foundation, Buffett Early Childhood Fund, and Brady Education Foundation: no grant or project numbers assigned.

Institutional Review Board Statement

The study was conducted in accordance with the Declaration of Helsinki, and approved by the Institutional Review Board of the University of Oklahoma (IRB Number 12975; approval 5 June 2012 through 28 February 2023).

Informed Consent Statement

Informed consent was obtained from all subjects involved in the study.

Data Availability Statement

The data are not publicly available.

Acknowledgments

We thank the children, families, and early childhood professionals who, over multiple years, supplied the data and made this study possible. Many thanks are also extended to several staff, including Anne Perrine and Ashley Gallagher, who served as data collectors for this project. We also thank several colleagues who reviewed earlier drafts of this manuscript prior to its finalization.

Conflicts of Interest

The authors declare no conflict of interest. The funders had no role in the design of the study; in the collection, analyses, or interpretation of data; or in the writing of the manuscript. The funders did encourage the authors’ decision to publish these results.

Appendix A

Table A1. Results for control variables from growth curve models (n = 62, E/T = 31, C = 31).
Language PPVT
Receptive
Vocabulary
Language WJ
Letter Word
Language WJ
Picture
Vocabulary
Language WJ
Oral
Comprehension
Math WJ
Applied
Problems
Executive Function
HTKS
Executive Function
Digit Span
Social Emotional
DESSA
Intercept
β (SE)
Slope
β (SE)
Intercept
β (SE)
Slope
β (SE)
Intercept
β (SE)
Slope
β (SE)
Intercept
β (SE)
Slope
β (SE)
Intercept
β (SE)
Slope
β (SE)
Intercept
β (SE)
Slope
β (SE)
Intercept
β (SE)
Slope
β (SE)
Intercept
β (SE)
Slope
β (SE)
Sex (Boy)0.36 **
(0.13)
−0.03
(0.18)
0.17
(0.16)
0.37 *
(0.15)
0.29 **
(0.10)
−0.02 (0.13)0.36 *
(0.14)
−0.05 (0.27)0.13
(0.17)
0.28 (0.16)0.13
(0.17)
−0.15 (0.19)0.23
(0.17)
0.15 (0.21)−0.28
(0.15)
0.10 (0.21)
DLL status−0.47 **
(0.18)
0.27
(0.24)
−0.39 **
(0.14)
0.37 *
(0.17)
−0.38
(0.23)
0.39 (0.23)−0.29
(0.20)
0.53 (0.33)−0.29
(0.20)
0.28 (0.16)−0.71 *** (0.15)0.69 ** (0.22)−0.48 * (0.19)0.57 * (0.23)−0.29
(0.17)
0.52 ** (0.19)
Economic
disadvantage
−0.12
(0.15)
0.16
(0.17)
0.15
(0.14)
0.01
(0.12)
−0.03
(0.15)
0.07 (0.17)0.14
(0.15)
−0.03 (0.24)−0.12
(0.15)
0.17 (0.14)−0.17
(0.14)
0.23
(0.15)
0.10
(0.14)
0.13 (0.20)0.27
(0.16)
−0.19 (0.20)
Parent education−0.31
(0.27)
0.56 *
(0.26)
−0.40
(0.21)
0.07
(0.23)
−0.35
(0.33)
0.54 (0.31)−0.37
(0.26)
0.92 (0.47)−0.22
(0.27)
0.16 (0.17)−0.24
(0.23)
0.31
(0.26)
−0.33
(0.23)
0.27 (0.27)−0.19
(0.30)
0.04 (0.31)
Family structure−0.11
(0.17)
−0.08
(0.17)
0.04
(0.15)
−0.07
(0.13)
−0.18
(0.17)
−0.04 (0.22)−0.25
(0.18)
0.21 (0.32)0.21
(0.19)
−0.02 (0.16)0.12
(0.16)
−0.02 (0.18)−0.34 * (0.14)0.06 (0.22)0.54 **
(0.18)
−0.22 (0.25)
Home activities0.00
(0.14)
−0.21
(0.21)
0.10
(0.14)
0.14
(0.15)
0.04
(0.13)
−0.07 (0.14)0.16
(0.12)
−0.41 (0.25)0.06
(0.14)
0.04 (0.17)−0.10
(0.14)
0.16
(0.17)
0.12
(0.13)
−0.11 (0.18)0.40 **
(0.14)
−0.19 (0.21)
Parent stress0.09
(0.10)
0.11
(0.15)
0.28 *
(0.13)
−0.14
(0.14)
0.25 *
(0.11)
0.04 (0.16)0.34 **
(0.12)
−0.28 (0.25)0.16
(0.09)
0.12 (0.13)0.05
(0.14)
−0.07 (0.16)0.13
(0.15)
0.15 (0.15)−0.17
(0.14)
0.18 (0.21)
Parent expectation−0.19
(0.13)
0.23
(0.22)
0.06
(0.15)
0.21
(0.15)
−0.07
(0.12)
0.11 (0.19)−0.11
(0.13)
0.63 (0.33)−0.04
(0.15)
0.26 (0.15)−0.18
(0.14)
0.16
(0.17)
−0.07
(0.16)
0.36 (0.24)−0.28
(0.16)
0.51 ** (0.17)
Note: * p < 0.05, ** p < 0.01, *** p < 0.001.

References

  1. Phillips, D.A.; Lipsey, A.W.; Dodge, K.A.; Haskins, R.; Bassok, D.; Burchinal, M.R.; Duncan, G.J.; Dynarski, M.; Magnuson, K.A.; Weiland, C. Puzzling It Out: The Current State of Scientific Knowledge on Pre-Kindergarten Effects—A Consensus Statement; Brookings: Washington, DC, USA, 2017; Available online: https://www.brookings.edu/research/puzzling-it-out-the-current-state-of-scientific-knowledge-on-pre-kindergarten-effects/ (accessed on 6 March 2021).
  2. Lipsey, M.W.; Farran, D.C.; Durkin, K. Effects of the Tennessee Prekindergarten Program on children’s achievement and behavior through third grade. Early Child. Res. Q. 2018, 45, 155–176. [Google Scholar] [CrossRef]
  3. Barnett, W.S.; Frede, E. The promise of preschool: Why we need early education for all. Am. Educ. 2010, 34, 21–40. Available online: https://files.eric.ed.gov/fulltext/EJ889144.pdf (accessed on 1 April 2022).
  4. Getting It Right: Using Implementation Research to Improve Outcomes in Early Care and Education. Available online: https://www.fcd-us.org/assets/2020/06/GettingitRight_UsingImplementationResearchtoImproveOutcomesinECE_2020.pdf (accessed on 13 August 2021).
  5. Schweinhart, L.J. Lifetime Effects: The High/Scope Perry Preschool Study through Age 40 (No. 14); High Scope Foundation: Ypsilanti, MI, USA, 2005. [Google Scholar]
  6. Campbell, F.A.; Ramey, C.T. The Abecedarian project. In Cost Effective Programs in Children’s First Decade: A Human Capital Integration; Reynolds, A.J., Rolnick, A., Englund, M.M., Temple, J., Eds.; Cambridge University Press: New York, USA, 2010; pp. 76–95. [Google Scholar]
  7. Campbell, F.A.; Ramey, C.T.; Pungello, E.; Sparling, J.; Miller-Johnson, S. Early childhood education: Young adult outcomes from the Abecedarian Project. Appl. Dev. Sci. 2002, 6, 42–57. [Google Scholar] [CrossRef]
  8. Campbell, F.A.; Pungello, E.P.; Burchinal, M.; Kainz, K.; Pan, Y.; Wasik, B.H.; Barbarn, O.A.; Sparling, J.; Ramey, C.T. Adult outcomes as a function of an early childhood educational program: An Abecedarian Project follow-up. Dev. Psy. 2012, 48, 1033–1043. [Google Scholar] [CrossRef] [Green Version]
  9. Meloy, B.; Gardner, M.; Darling-Hammond, L. Untangling the Evidence on Preschool Effectiveness: Insights for Policymakers; Learning Policy Institute: Palo Alto, CA, USA, 2019; Available online: https://tpcref.org/wp-content/uploads/Untangling_Evidence_Preschool_Effectiveness_BRIEF_2019.pdf (accessed on 12 February 2019).
  10. Mathers, S.J.; Ereky-Stevens, K. Quality of early childhood education and care for children under three: Sound foundations. In SAGE Handbook of Early Childhood Policy; Miller, L., Cameron, C., Dalli, C., Barbour, N., Eds.; SAGE Publications: Thousand Oaks, CA, USA, 2018; pp. 504–521. [Google Scholar]
  11. Magnuson, K.A.; Ruhm, C.; Waldfogel, J. Does prekindergarten improve school preparation and performance? Eco. Edu. Rev. 2007, 26, 33–51. [Google Scholar] [CrossRef] [Green Version]
  12. U. S. Department of Health and Human Services. Head Start Impact Study: Final Report; U.S. Department of Health and Human Services: Washington, DC, USA, 2010. Available online: https://www.acf.hhs.gov/sites/default/files/documents/opre/hs_impact_study_final.pdf (accessed on 30 August 2022).
  13. Durkin, K.; Lipsey, M.W.; Farran, D.C.; Wiesen, S.E. Effects of a statewide pre-kindergarten program on children’s achievement and behavior through sixth grade. Dev. Psy. 2022, 58, 470–484. [Google Scholar] [CrossRef]
  14. McCoy, D.C.; Yoshikawa, H.; Ziol-Guest, K.M.; Duncan, G.J.; Schindler, H.S.; Magnuson, K.; Yang, R.; Koepp, A.; Shonkoff, J.P. Impacts of early childhood education on medium-and long-term educational outcomes. Edu. Res. 2017, 46, 474–487. [Google Scholar] [CrossRef]
  15. Zaslow, M.; Anderson, R.; Redd, Z.; Wessel, J.; Tarullo, L.; Burchinal, M. Quality Dosage, Thresholds, and Features in Early Childhood Settings: A Review of the Literature. Mathematica Policy Research Reports 2010. Available online: https://files.eric.ed.gov/fulltext/ED579878.pdf (accessed on 27 July 2018).
  16. Li, W.; Farkas, G.; Duncan, G.J.; Burchinal, M.R.; Vandell, D.L. Timing of high-quality childcare and cognitive, language, and preacademic development. Dev. Psy. 2013, 49, 1440–1451. [Google Scholar] [CrossRef] [Green Version]
  17. Yazejian, N.; Bryant, D.; Freel, K.; Burchinal, M. High-quality early education: Age of entry and time in care differences in student outcomes for English-only and dual language learners. Early Child. Res. Q. 2015, 32, 23–39. [Google Scholar] [CrossRef]
  18. Campbell, F.A.; Pungello, E.P.; Miller-Johnson, S.; Burchinal, M.; Ramey, C.T. The development of cognitive and academic abilities: Growth curves from an early childhood educational experiment. Dev. Psy. 2001, 37, 231–242. [Google Scholar] [CrossRef]
  19. National Association for the Education of Young Children [NAEYC]. Developmentally Appropriate Practice: A Position Statement; National Association for the Education of Young Children [NAEYC]: Washington, DC, USA, 2020; Available online: https://www.naeyc.org/resources/position-statements/dap/contents (accessed on 10 July 2022).
  20. Educare: Our Approach. Available online: https://www.educareschools.org/our-approach/ (accessed on 16 July 2022).
  21. Yazejian, N.; Bryant, D.; Kennel, P. Implementation and replication of the Educare model of early childhood education. In Applying Implementation Science in Early Childhood Programs and Systems; Halle, T.J., Metz, A.H., Martinez-Beck, I., Eds.; Brookes: Baltimore, MD, USA, 2013; pp. 209–225. [Google Scholar]
  22. Yazejian, N.; Bryant, D.M.; Hans, S.; Horm, D.; Clair, L.; File, N.; Burchinal, M. Child and parenting outcomes after 1 year of Educare. Child Dev. 2017, 88, 1671–1688. [Google Scholar] [CrossRef] [PubMed]
  23. Yazejian, N.; Bryant, D.M.; Kuhn, L.J.; Burchinal, M.; Horm, D.; Hans, S.; File, N.; Jackson, B. The Educare intervention: Outcomes at age 3. Early Child Res. Q. 2020, 53, 425–440. [Google Scholar] [CrossRef] [PubMed]
  24. Dunn, L.M.; Dunn, D.M. Peabody Picture Vocabulary Test, 4th ed.; Pearson: Minneapolis, MN, USA, 2007. [Google Scholar]
  25. Kush, J.C. Review of the Peabody Picture Vocabulary Test, 4th Edition. In The Eighteenth Mental Measurements Yearbook; Buros Center for Testing: Lincoln, NE, USA, 2010; Volume 18, Available online: https://web-s-ebscohost-com.ezproxy.lib.ou.edu/ehost/detail/detail?vid=5&sid=4dd558c8-2afc-4811-ac84-7a4525f52416%40redis&bdata=JnNpdGU9ZWhvc3QtbGl2ZQ%3d%3d#AN=test.3030&db=mmt (accessed on 9 October 2022).
  26. Williams, K.T. Expressive Vocabulary Test (EVT-2), 2nd ed.; Pearson Assessments: San Antonio, TX, USA, 2007. [Google Scholar]
  27. Woodcock, R.W.; McGrew, K.S.; Mather, N. Woodcock-Johnson III Tests of Achievement; Riverside: Rolling Meadow, IL, USA, 2001. [Google Scholar]
  28. Wendling, B.J.; Schrank, F.A.; Schmitt, A.J. Educational Interventions Related to the Woodcock-Johnson III Tests of Achievement (Assessment Service Bulletin No. 8); Riverside: Rolling Meadows, IL, USA, 2007. [Google Scholar]
  29. Abu-Hamour, B.; Al Hmouz, H.; Mattar, J.; Muhaidat, M. The use of Woodcock-Johnson tests for identifying students with special needs-a comprehensive literature review. Pro. Soc. Beh. Sci. 2012, 47, 665–673. [Google Scholar] [CrossRef] [Green Version]
  30. McGrew, K.S. Technical manual: Woodcock-Johnson III; Riverside: Itasca, IL, USA, 2001. [Google Scholar]
  31. Braden, J.P.; Alfonso, V.C. The Woodcock-Johnson III tests of cognitive abilities in cognitive assessment courses. In WJ III Clinical Use and Interpretation; Academic Press: Cambridge, MA, USA, 2003; pp. 377–401. [Google Scholar] [CrossRef]
  32. Floyd, R.G.; Shaver, R.B.; McGrew, K.S. Interpretation of the Woodcock-Johnson III tests of cognitive abilities: Acting on evidence. In WJ III Clinical Use and Interpretation; Academic Press: Cambridge, MA, USA, 2003; pp. 1–46. [Google Scholar] [CrossRef]
  33. Schrank, F.A. Woodcock-Johnson III Tests of Cognitive Abilities. In Handbook of Pediatric Neuropsychology; Davis, A.S., Ed.; Springer Publishing Company: New York, NY, USA, 2011; pp. 415–434. [Google Scholar]
  34. Ponitz, C.C.; McClelland, M.M.; Jewkes, A.M.; Connor, C.M.; Farris, C.L.; Morrison, F.J. Touch your toes! Developing a direct measure of behavioral regulation in early childhood. Early Child Res. Q. 2008, 23, 141–158. [Google Scholar] [CrossRef]
  35. Ponitz, C.C.; McClelland, M.M.; Matthews, J.S.; Morrison, F.J. A structured observation of behavioral self-regulation and its contribution to kindergarten outcomes. Dev. Psy. 2009, 45, 605–619. [Google Scholar] [CrossRef] [Green Version]
  36. McClelland, M.M.; Cameron, C.E.; Connor, C.M.; Farris, C.L.; Jewkes, A.M.; Morrison, F.J. Links between behavioral regulation and preschoolers’ literacy, vocabulary, and math skills. Dev. Psy. 2007, 43, 947–959. [Google Scholar] [CrossRef] [Green Version]
  37. Schmitt, S.A.; Pratt, M.E.; McClelland, M.M. Examining the validity of behavioral self-regulation tools in predicting preschoolers’ academic achievement. Early Educ. Dev. 2014, 25, 641–660. [Google Scholar] [CrossRef]
  38. Matthews, J.S.; Ponitz, C.C.; Morrison, F.J. Early gender differences in self-regulation and academic achievement. J. Ed. Psy. 2009, 101, 689–704. [Google Scholar] [CrossRef]
  39. Wanless, S.B.; McClelland, M.M.; Acock, A.C.; Chen, F.M.; Chen, J.L. Behavioral regulation and early academic achievement in Taiwan. Early Educ Dev. 2011, 22, 1–28. [Google Scholar] [CrossRef]
  40. Wechsler, D. Wechsler, D. Wechsler Intelligence Scale for children, 4th edition. In Administration and Scoring Manual; Harcourt Assessment: San Antonio, TX, USA, 2003. [Google Scholar]
  41. Gathercole, S.E.; Pickering, S.J.; Ambridge, B.; Wearing, H. The structure of working memory from 4 to 15 years of age. Dev. Psy. 2004, 40, 177–190. [Google Scholar] [CrossRef] [Green Version]
  42. Naglieri, J.A.; LeBuffe, P.A.; Shapiro, V.B. The Devereux Student Strengths Assessment—Mini (DESSA-Mini): Assessment, Technical Manual, and User’s Guide; Apperson: Charlotte, NC, USA, 2011/2014.
  43. LeBuffe, P.A.; Shapiro, V.B.; Robitaille, J.L. The Devereux Student Strengths Assessment (DESSA) comprehensive system: Screening, assessing, planning, and monitoring. J. App. Dev. Psy. 2018, 55, 62–70. [Google Scholar] [CrossRef] [Green Version]
  44. Pianta, R.C.; La Paro, K.M.; Hamre, B.K. Classroom Assessment Scoring System™: Manual K-3; Paul, H., Ed.; Brookes Publishing: Baltimore, MD, USA, 2008. [Google Scholar]
  45. Classroom Assessment Scoring System Implementation Guide: Measuring and Improving Classroom Interactions in Early Classroom Settings. Retrieved from the Center for Advanced Study of Teaching and Learning. Available online: https://www.boldgoals.org/wpcontent/uploads/CLASSImplementationGuide.pdf (accessed on 25 August 2022).
  46. Hamre, B.; Hatfield, B.; Pianta, R.; Jamil, F. Evidence for general and domain-specific elements of teacher–child interactions: Associations with preschool children’s development. Child Dev. 2014, 85, 1257–1274. [Google Scholar] [CrossRef] [PubMed]
  47. Sandilos, L.E.; DiPerna, J.C. Family Life Project Key Investigators. Measuring quality in kindergarten classrooms: Structural analysis of the classroom assessment scoring system (CLASS K–3). Ear. Educ. Dev. 2014, 25, 894–914. [Google Scholar] [CrossRef]
  48. McPhee, C.; Bielick, S.; Masterton, M.; Flores, L.; Parmer, R.; Amchin, S.; Stern, S.; McGowan, H. National Household Education Surveys Program of 2012: Data File User’s Manual. Parent and Family Involvement in Education Survey. Early Childhood Program Participation Survey; NCES 2015-030; National Center for Education Statistics: Washington, DC, USA, 2015. [Google Scholar]
  49. Abidin, R. Parenting Stress Index Short Form; Psychological Assessment Resources: Lutz, FL, USA, 1995. [Google Scholar]
  50. Rubin, D.; Rubin, D.B. Multiple Imputation for Nonresponse in Surveys; Wiley: New York, NY, USA, 1987. [Google Scholar]
  51. Muthén, L.K.; Muthén, B.O. Mplus User’s Guide, 7th ed.; Muthén & Muthén: Los Angeles, CA, USA, 1998–2017.
  52. Burrage, M.S.; Ponitz, C.C.; McCready, E.A.; Shah, P.; Sims, B.C.; Jewkes, A.M.; Morrison, F.J. Age- and schooling-related effects on executive functions in young children: A natural experiment. Child Neu. 2008, 14, 510–524. [Google Scholar] [CrossRef] [PubMed]
  53. Wanless, S.B.; McClelland, M.M.; Acock, A.C.; Ponitz, C.C.; Son, S.H.; Lan, X.; Morrison, F.J.; Chen, J.L.; Lee, K.; Sung, M.; et al. Measuring behavioral regulation in four societies. Psy. Assmt. 2011, 23, 364–378. [Google Scholar] [CrossRef] [PubMed] [Green Version]
  54. Gathercole, S.E.; Pickering, S.J. Assessment of working memory in six-and seven-year-old children. J. Educ. Psy. 2000, 92, 377–390. [Google Scholar] [CrossRef]
  55. Horm, D.M.; Jeon, S.; Acton, M.; Clavijo, M. Tulsa Educare RCT Follow-Up Study; Early Childhood Education Institute, University of Oklahoma: Tulsa, OK, USA, 2022. [Google Scholar]
  56. Brookes-Gunn, J.; Lazzeroni, S. What are reasonable expectations for ECE program effectiveness? In Getting it Right: Using Implementation Research to Improve Outcomes in Early Care and Education; Foundation for Child Development: New York, NY, USA, 2020. [Google Scholar]
  57. Bailey, D.; Duncan, G.J.; Odgers, C.L.; Yu, W. Persistence and fadeout in the impacts of child and adolescent interventions. J. Res. Edu. Eff. 2017, 10, 7–39. [Google Scholar] [CrossRef]
  58. Horm, D.M.; Yazejian, N.; Kennel, P.; Jackson, C. Educare: A model for U.S. early childhood. In Sage Handbook of Early Childhood Policy; Miller, L., Cameron, C., Dalli, C., Barbour, N., Eds.; Sage: Thousand Oaks, CA, USA, 2018; pp. 303–319. [Google Scholar]
Figure 1. Conceptual model. Note. Time indicators for the linear slope reflect 6-month intervals between fall and spring. The intercept was loaded 1 by 8 indicators which indicate the mean of scores across 8-time points. The slope was loaded 1 through 8 (kindergarten fall (1) and spring (2) through Grade 3 fall (7) and spring (8)) to represent the time points from kindergarten to Grade 3 with a linear developmental concept.
Education 12 00908 g001
Table 1. Child and family characteristics of treatment and control groups at randomization.
Child/Family CharacteristicsEducare/Treatment
(n = 37)
Control
(n = 38)
Gender: Boy56.76%42.11%
Race/Ethnicity: White8.57%3.33%
Race/Ethnicity: Black2.86%3.33%
Race/Ethnicity: Hispanic74.29%90.00%
Race/Ethnicity: Multiracial14.29%3.34%
Home language: English27.03%23.32%
Home language: Spanish70.27%71.05%
Home language: Both English and Spanish2.70%2.00%
Family Structure: Both parents51.43%50.00%
Family structure: Only mother45.71%50.00%
Family structure: Others2.86%0.00%
Mother age (years)25.9726.58
Parent education (years)10.7010.63
Economic disadvantage (1 = yes)91.43%86.67%
Table 2. Sample size by grade and group.
K FallK SpringG1 FallG1 SpringG2 FallG2 SpringG3 FallG3 Spring
Treatment1922303030293018
Control2123303131232319
Table 3. Average scores of developmental outcomes at the spring of each grade for the two groups (n = 62, E/T = 31, C = 31).
Grade KGrade 1Grade 2Grade 3
Educare/
Treatment
ControlEducare/
Treatment
ControlEducare/
Treatment
ControlEducare/
Treatment
Control
Language PPVT_Receptive Vocabulary93.4585.2696.57 +90.61 +107.3898.04117.21 +100.94 +
Language WJ_Letter Word102.23 +93.78 +102.6 +92.81 +99.4599.6198.32 +87.89 +
Language WJ_ Picture Vocabulary90.1482.0491.47 *82.71 *92.1786.3997.37 **86.06 **
Language WJ_Oral Comprehension93.5987.65101.63 **91.23 **93.5591.57103.37 **87.17 **
Math WJ_Applied Problems101.41 **90.48 **96.290.6595.1790.5795.16 **83.72 **
Excutive function_HTKS27.8624.6544.0338.8446.5547.8754.2151.41
Excutive function_Digit Span7.456.279.278.1910.4110.2611.9511.39
Social emotional- DESSA54.3256.2252.0352.0652.9354.4849.2850.58
Note: + p < 0.10, * p < 0.05, ** p < 0.01.
Table 4. Results from growth curve models (n = 62, E/T = 31, C = 31).
Language PPVT
Receptive
Vocabulary
Language WJ
Letter Word
Language WJ
Picture
Vocabulary
Language WJ
Oral
Comprehension
Math WJ
Applied Problems
Executive Function
HTKS
Executive Function
Digit Span
Social
Emotional
DESSA
Intercept
β (SE)
Slope
β (SE)
Intercept
β (SE)
Slope
β (SE)
Intercept
β (SE)
Slope
β (SE)
Intercept
β (SE)
Slope
β (SE)
Intercept
β (SE)
Slope
β (SE)
Intercept
β (SE)
Slope
β (SE)
Intercept
β (SE)
Slope
β (SE)
Intercept
β (SE)
Slope
β (SE)
Group
Control (0) vs. Treatment (1)
0.28 *
(0.13)
0.04
(0.20)
0.45 ***
(0.13)
−0.23
(0.12)
0.35 **
(0.11)
−0.19
(0.17)
0.34 *
(0.13)
−0.15
(0.25)
0.45 **
(0.12)
−0.18
(0.16)
0.07
(0.15)
0.05
(0.16)
0.34 *
(0.14)
−0.15
(0.20)
0.25
(0.14)
−0.28
(0.18)
CLASS average−0.03
(0.14)
0.01
(0.17)
−0.30 *
(0.13)
0.15
(0.14)
−0.19
(0.13)
0.20
(0.16)
−0.12
(0.15)
−0.01
(0.26)
−0.17
(0.16)
0.14
(0.15)
−0.07
(0.14)
0.19
(0.18)
0.19
(0.15)
−0.27
(0.20)
0.05
(0.18)
−0.14
(0.22)
Note: * p < 0.05, ** p < 0.01, *** p < 0.001.
Publisher’s Note: MDPI stays neutral with regard to jurisdictional claims in published maps and institutional affiliations.

