Influence of Real Exchange Rate on the Finance-Growth Nexus in the West African Region


1
School of Finance and Economics, Taylor’s University, Selangor 47500, Malaysia
2
Economics Program, School of Social Sciences, Universiti Sains Malaysia, Penang 11800, Malaysia
*
Author to whom correspondence should be addressed.
Economies 2019, 7(1), 23; https://doi.org/10.3390/economies7010023
Submission received: 10 January 2019
/
Revised: 15 March 2019
/
Accepted: 18 March 2019
/
Published: 25 March 2019
(This article belongs to the Special Issue Efficiency and Anomalies in Stock Markets)
Abstract
:This study examines the moderating effects of the real exchange rate and its volatility on the finance-growth nexus in the West African region. It also determines the marginal effects of financial development on economic growth at various levels of the real exchange rates and its volatility. The findings show that financial development has a long-term positive impact on economic growth, but this impact is weakened by real exchange rate and its volatility. The marginal effects of financial development on economic growth vary with the levels of the real exchange rate and its volatility. The higher the real exchange rate and its volatility, the less finance spurs growth. We also provide evidence of this scenario in individual specific countries in the region. The implication of this study is that the development of the financial sector would not provide the desirable economic benefits except it is accompanied by a reduction and stability in the real exchange rates. Based on the findings, the study makes some policy recommendations.
JEL Classification:
G20; F31; O471. Introduction
Some empirical studies have emphasized the fundamental role of institutional quality, level of financial development, per capita income and inflation in moderating the impact of financial development on economic growth in developed and developing countries (e.g., Arcand et al. 2015; Ehigiamusoe et al. 2018; Law et al. 2018; Law and Singh 2014). However, the role of the real exchange rate or its volatility on the finance-growth nexus has not been thoroughly explored. The economic benefits of financial development could vary with the level of the real exchange rate. This is because real exchange rate has the capacity to influence economic growth. For instance, some studies reported that real exchange rate has a positive impact on economic growth (e.g., Razmi et al. 2012; Rodrik 2008; Tarawalie 2010), whereas other studies documented a negative linkage (e.g., Bleaney and Greenaway 2001; Conrad and Jagessar 2018; Elbadawi et al. 2012) or insignificant relationship (e.g., Tang 2015). Moreover, Aghion et al. (2009) showed that real exchange rate volatility has a negative impact on productivity growth, while Vieira et al. (2013) revealed that high real exchange rate volatility has a negative impact on economic growth, albeit the impact of low volatility is positive. However, Comunale (2017) noted that exchange rate volatility does not have any robust effect on GDP growth.
Besides its direct effect on economic growth, studies have shown that real exchange rate and financial development could have a dynamic relationship. Lin and Ye (2011) posited that financial development has a significant effect on the choice of exchange rate regime, whereas Katusiime (2018) reported that exchange rate has a significant effect on the growth of private sector credit. Thus, countries with less developed financial markets are more likely to adopt a fixed exchange rate, while countries with higher levels of financial development are more likely to adopt a flexible system, which in turn determines the exchange rate. Moreover, Fujiwara and Teranishi (2011) reported that financial market friction replicates persistent, volatile and realistic hump-shaped responses of the real exchange rates. They concluded that financial market development is a strategic component to understand real exchange rate dynamics. Specifically, Tang and Yao (2018) showed that financial structure, which reflects the proportion of direct financing and indirect financing, plays a crucial role in the relationship between exchange rates and stock prices.
Furthermore, Jayashankar and Rath (2017) argued that there is a significant relationship among the stock market, foreign exchange market and money market in emerging economies to the extent that positive or negative shocks that affect one market could be quickly transmitted to another market via contagious effect. However, they concluded that the empirical connection among these markets is insignificant at lower scales, but robust at higher scales. Moreover, it had been argued that financial development has the capacity to alleviate the adverse effects of the real exchange rate and its volatility on productivity growth. Uncertainty in the real exchange rate worsens the negative effect of domestic credit market constraints (see Aghion et al. 2009). Particularly, Elbadawi et al. (2012) showed that financial development has the capacity to alleviate the negative effects of the real exchange rate overvaluation on economic growth.
Therefore, the specific objective of this paper is to examine the effects of the real exchange rate and its volatility on the finance-growth nexus in the West Africa region. Fundamentally, it seeks to determine the marginal effects of financial development on economic growth at various levels of the real exchange rate and its volatility. In this regard, this paper differs from previous studies and makes a significant contribution to the existing literature. Unlike Levine et al. (2000) that focused mainly on the finance-growth nexus in some selected developed and developing countries, our paper focuses on the finance-growth nexus in developing economies (i.e., West African region). In addition, we augment the finance-growth nexus with real exchange rate (or its volatility) as well as the interaction term between financial development and real exchange rate (or its volatility). This enables us to determine whether the finance-growth nexus varies with the level of the real exchange rate (or its volatility), an issue that was not explored in Levine et al. (2000). To the best of our knowledge, the only paper that used an interaction term between real exchange rate and financial development is Aghion et al. (2009), but they focused on whether the effects of the real exchange rate on productivity growth vary with the level of financial development in some selected countries. However, our paper focuses on whether the impact of financial development on economic growth varies with the level of the real exchange rate (or its volatility) in the West African region. Moreover, we determine the marginal effects of financial development on economic growth at various levels of the real exchange rate (or its volatility), an issue that was not explored in Aghion et al. (2009). This is fundamental because the marginal effect enables us to determine the changes in economic growth caused by simultaneous changes in both financial development and real exchange rate (or its volatility), which is essential for policy formulation (see Brambor et al. 2006; Law et al. 2018; Ehigiamusoe et al. 2018).
Hence, the motivation of this paper is that previous studies have neglected the moderating role of the real exchange rate or its volatility on the finance-growth nexus. Although some studies have shown that financial development has a positive impact on economic growth in the West African region (see Ehigiamusoe and Lean 2018; Ratsimalahelo and Barry 2010), it remains unclear whether this impact varies with the level of the real exchange rate or its volatility. Moreover, most past studies on real exchange rate and its volatility focused mainly on their direct effects on economic growth (see Elbadawi et al. 2012; Iyke 2018; Rodrik 2008; Vieira et al. 2013), while their indirect effects via the financial sector have not been thoroughly explored. To capture the indirect effects, we employ multiplicative interaction model where we interact real exchange rate (or its volatility) with financial development. Brambor et al. (2006) recommended the use of multiplicative interaction model whenever there is a conditional hypothesis (when the relationship between two variables depends on the value of another variable).
The scope of this study is limited to the West African region because several West African countries have employed financial sectors reforms and policies to stimulate greater depth and breadth of the financial markets, create better access to financial resources, and provide efficient supervisory and regulatory frameworks. In recent decades, there have been privatization of commercial banks, liberalization of interest rates, recapitalization of financial institutions and technological innovations aimed at repositioning the sector with a view to enhancing economic growth. The recent reforms notwithstanding, the financial system in the West African region is still largely bank-based, small and undiversified compared to the financial systems in advanced and emerging economies. For instance, during the 1980–2014 period, the average level of financial development (measured by credit to the private sector relative to GDP) in the region was 15.43% compared to 29.85%, 36.32%, 86.06% and 124.28% in South Asia, Middle East and North African region, European Union and high income countries, respectively.
Secondly, in the past three decades, many West African countries have attained significant improvements in their economic growth compared to the 1960s and 1970s. The region has experienced average annual GDP growth of 5 percent, which is higher than the average GDP growth rate in several advanced and emerging economies (see IMF 2014). Therefore, the financial sector could probably be one of the sectors that contribute to this impressive growth.
Moreover, this paper is further motivated by the high and volatile real exchange rate in the West African region. For instance, the real exchange rate has plummeted significantly in the past three decades averaging 1639.9 in 2015 compared to 41.3 in 1980. On a country-by-county basis, the real exchange rate deteriorated from 9.7 to 99.3 in Cape Verde; from 83.5 to 597.8 in Benin; from 124.5 to 600 in Mali; and from 78.7 to 7834 in Sierra Leone in 1980 and 2015, respectively. In addition, most of these countries experienced substantial volatility in their real exchange rates during the period. Hence, this study seeks to provide insights into the influence of the real exchange rate on the finance-growth nexus in the West African region, an issue that has not received adequate attention in the extant literature.
Finally, since West Africa is the largest region in Sub-Sahara Africa in terms of population, it is fundamental to study this region since anything that adversely affects it could have negative effects on the African continent or the larger international community. Hence, the findings on West African countries could be invaluable to other developing or emerging economies that want to accelerate economic growth via financial sector development and the real exchange rate.
Besides this introduction, the remaining parts of the paper are divided into four sections. The methodology is contained in Section 2, while the empirical results are presented in Section 3. The discussion and policy implications of the findings are presented in Section 4, while Section 5 concludes the study with some policy recommendations.
2. Data and Methodology
2.1. Data Description
The study uses annual data1 of West African countries for the 1980–2014 period. The countries include Benin, Burkina Faso, Cape Verde, Cote D’ Ivoire, Gambia, Ghana, Liberia, Guinea, Guinea Bissau, Mali, Mauritania, Niger, Nigeria, Sierra Leone, Senegal and Togo. The estimation period is limited because of the unavailability of data for some West African countries prior to this period. The data on economic growth, credit to the private sector, government consumption expenditure and trade openness were sourced from the World Development Indicators (2016) of the World Bank, while the data for the inflation rate were obtained from the World Economic Outlook (2015) of the International Monetary Fund. In addition, the data for the liquid liabilities were sourced from the Economic Data (2016) of the Federal Reserve Bank of St Louis, USA, while the data on human capital were taken from the Human Development Reports (2015) of the United Nations Development Programme. Data on the real exchange rate were computed from an official nominal exchange rate and consumer price index drawn from World Development Indicators (2016), while real exchange rate volatility was computed as the standard deviation of the 5-year moving average of the logarithm of the real exchange rate.
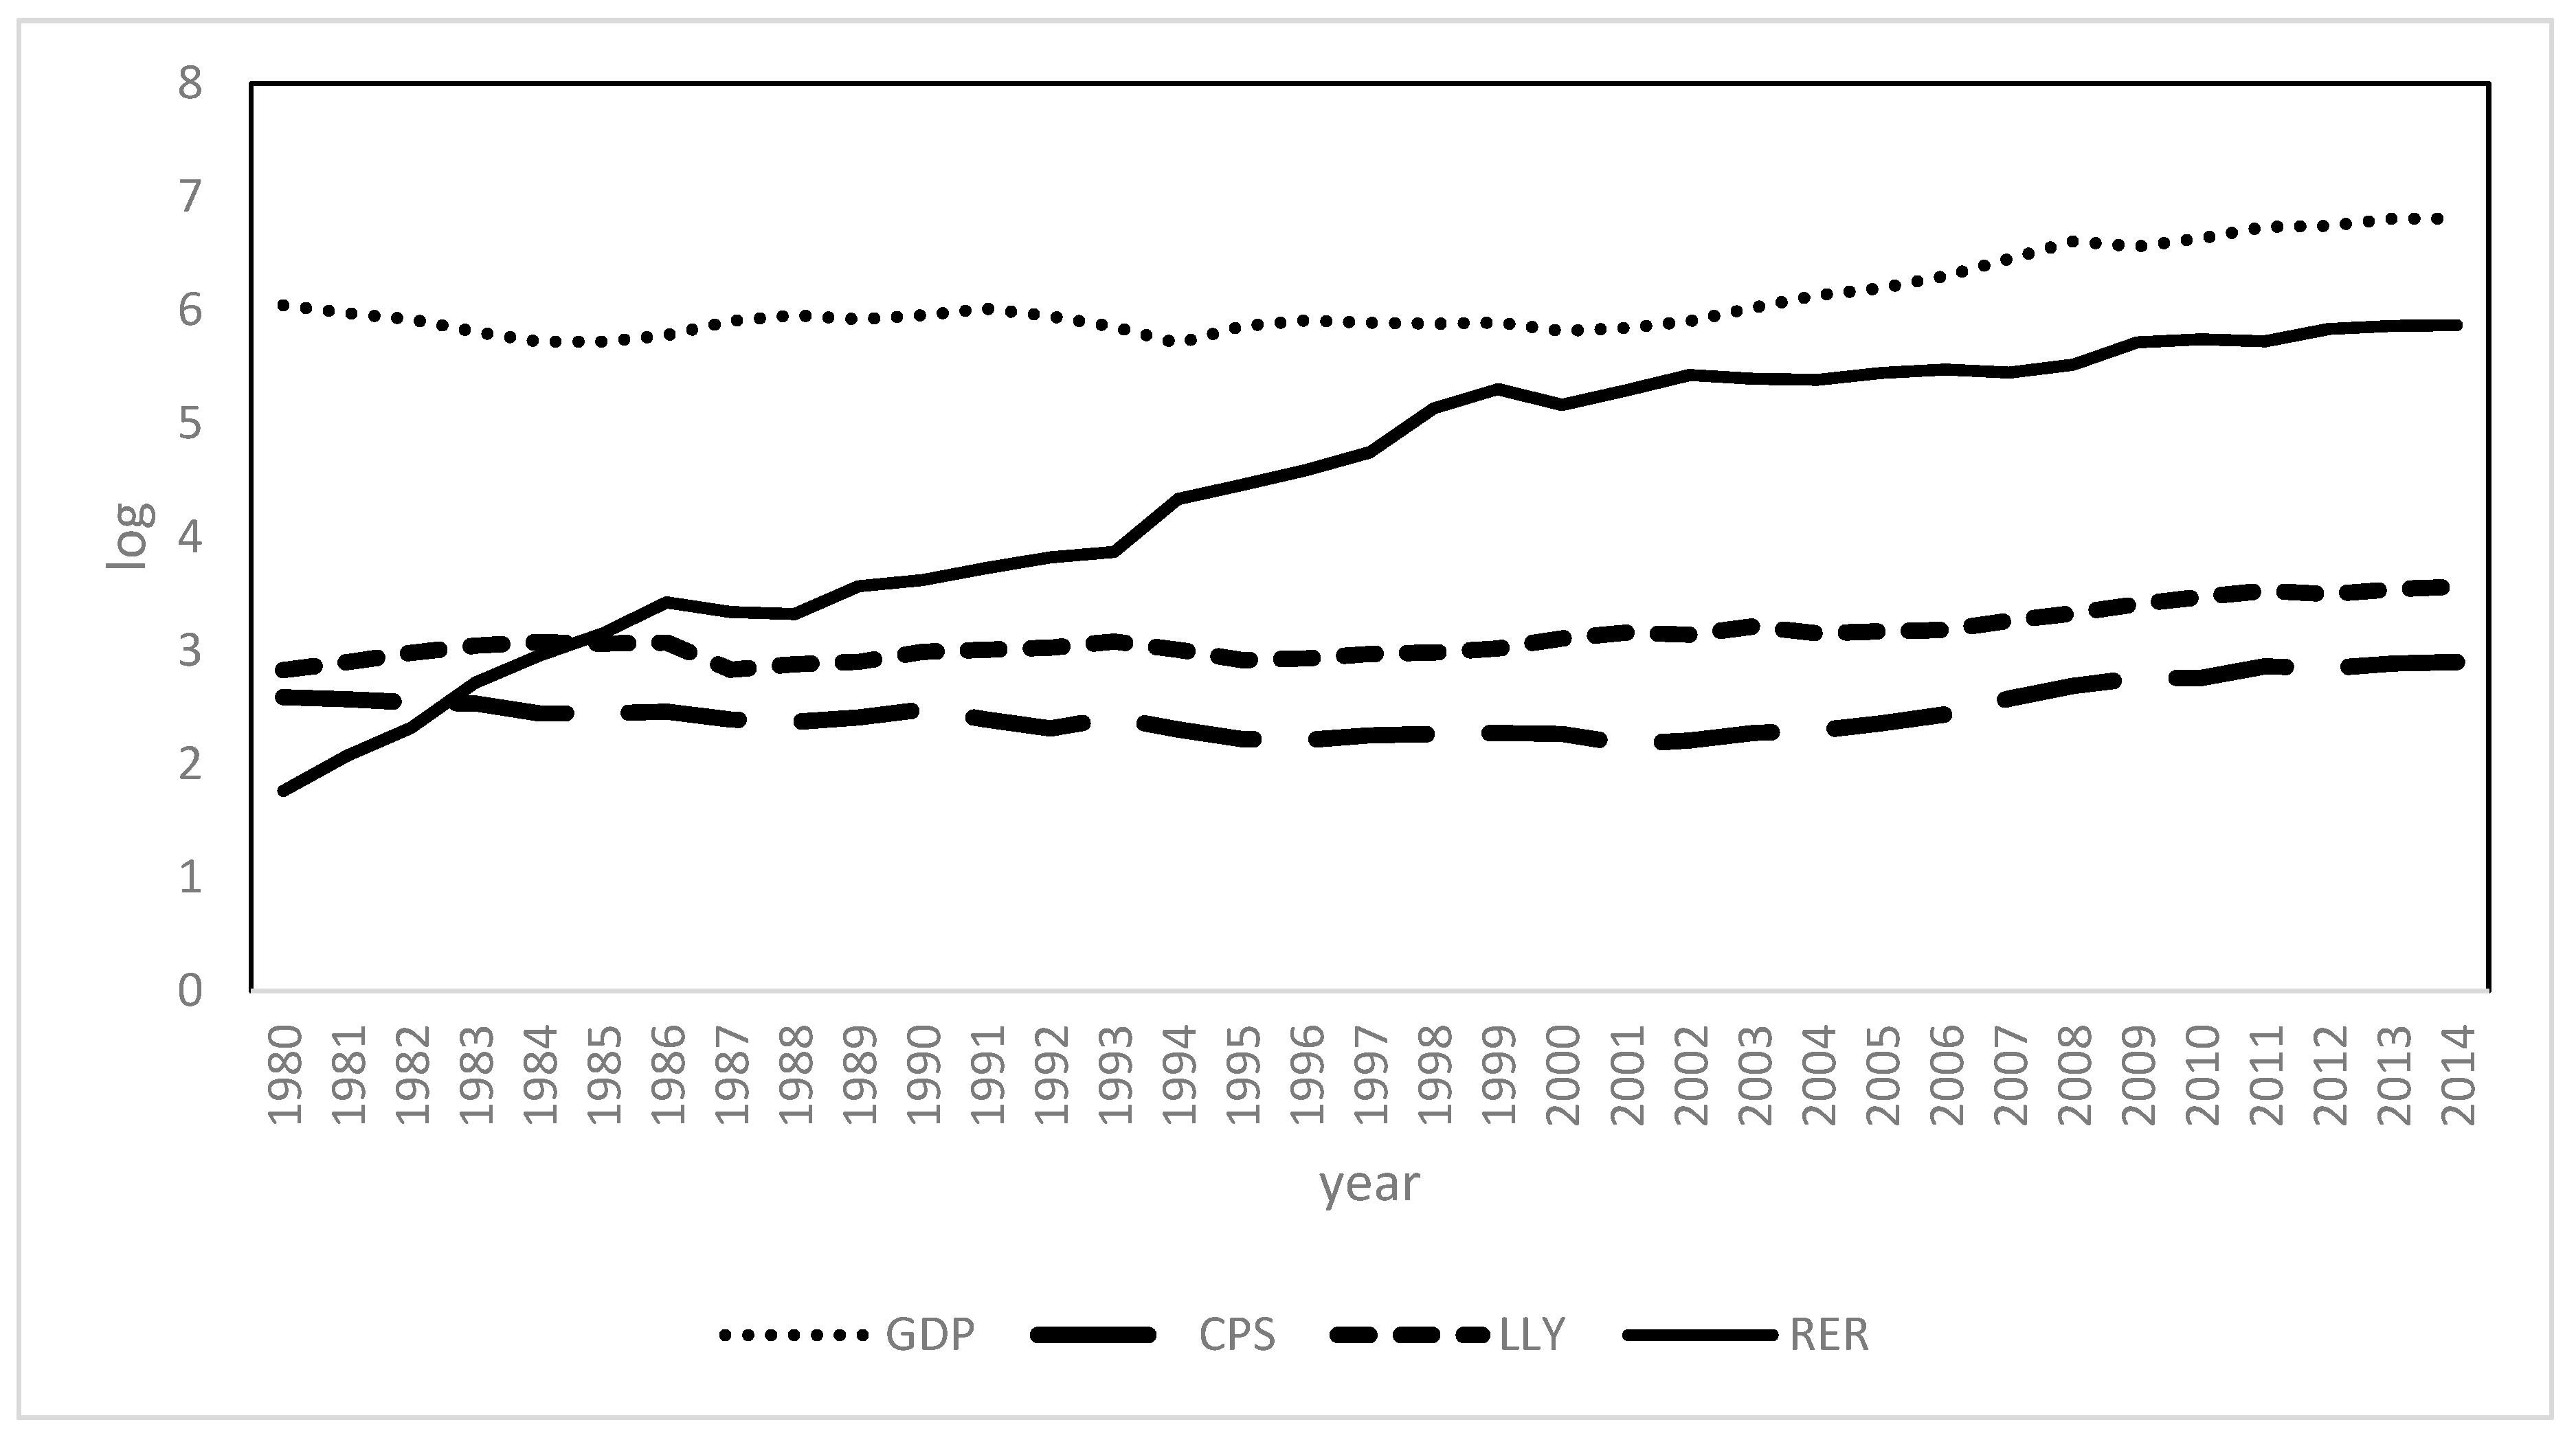
Figure 1 shows the trend analysis of average GDP per capita, financial development indicators and the real exchange rate of the West African region during the 1980–2014 period. It is obvious that financial development indicators were low and experienced no remarkable increase during the period. Although the level of GDP was high relative to the levels of both financial development and real exchange rate, but there was only a marginal increase in the level of GDP during the period. Conversely, the graph shows a significant increase in the real exchange rate in the West African region during the period. These remarkable changes in the real exchange rate could have both direct and indirect effects on economic growth via the financial sector.
2.2. Model Specification
This study employs the finance-growth model in extant literature (e.g., Levine et al. 2000; Beck et al. 2000) as the baseline model to examine the impact of financial development on economic growth in the West African region given as follows:
where Y = real GDP per capita, FD = financial development (proxy by credit to the private sector relative to GDP, and alternatively by liquid liabilities relative to GDP), Z = a set of control variables (namely government consumption expenditure relative to GDP, trade openness relative to GDP, human capital, and inflation rate), = unobserved country-specific effect; = time specific-effect, and = independent and identically distributed error term. All the variables except inflation are transformed into natural logarithm before analysis.
Moreover, we augment the finance-growth model with real exchange rate (or its volatility) as well as the interaction term between financial development and real exchange rate or its volatility (see Aghion et al. 2009) given as follows:
where RER = real exchange rate2 (alternatively as real exchange rate volatility), and = interaction term between financial development and real exchange rate (alternatively as real exchange rate volatility).
The interaction term enables us to ascertain whether the growth effect of financial development varies with the levels of the real exchange rate or its volatility. Hence, the study seeks to test the hypothesis that financial development has a larger impact on economic growth in the environment of lower real exchange rate or its volatility compared to the environment of high real exchange rate or its volatility. The interaction term between the two variables captures the marginal effects via the partial derivatives of the economic growth equation (Equation (2)) with respect to financial development given as follows:
Our conditional hypothesis focuses on the sign of the coefficients of and . If and , it implies that financial development has a positive impact on economic growth, and real exchange rate favourably influences that positive impact. If and , it suggests that financial development has a positive impact on economic growth, and real exchange rate adversely influences that positive impact. If and , it denotes that financial development has a negative impact on economic growth, and real exchange rate mitigates that negative impact. If and , it implies that financial development has a negative impact on economic growth, and real exchange rate aggravates that negative impact. However, if the entire marginal effect () is positive, it implies that more financial development and real exchange rate or its volatility enhance economic growth, but the opposite holds if the marginal effect is negative. To determine the statistical significance of the marginal effects, Brambor et al. (2006) suggested that the corresponding standard errors and t-statistics should be computed for inferences.
To compute the corresponding t-statistics of the marginal effects, we first employ the following formula to compute the variance from the coefficient covariance matrix:
The square root of the variance gives the standard error, and the marginal effect divided by the standard error gives the t-statistics. A large t-statistic suggests that the marginal effect is statistically significant.
2.3. Justification of the Variables in the Model
The model follows the finance-growth nexus but augmented with real exchange rate or its volatility. The dependent variable is economic growth (proxy by real GDP per capita) following some previous studies (e.g., Demetriades and Law 2006; Ehigiamusoe et al. 2018; Gries et al. 2009; Kar et al. 2011; Law et al. 2018). This study uses the preferred and commonly used proxy of financial development in the finance literature, namely domestic credit to the private sector as a ratio of GDP3 (see Arcand et al. 2015; Beck et al. 2000; Demetriades and Law 2006; Ehigiamusoe and Lean 2018; Ehigiamusoe et al. 2018; King and Levine 1993; Law and Singh 2014; Law et al. 2018; Levine et al. 2000; Rioja and Valev 2004; Samargandi et al. 2015). It measures the credits issued by the banking institutions to the private sector and excludes credits issued to governments, its agencies, public enterprises as well as credits issued by the central bank (Beck et al. 2000; Levine et al. 2000). In order to check the robustness of the results, liquid liabilities relative to GDP is used as alternative proxy of financial development (see Hassan et al. 2011; Loayza and Ranciere 2006). Liquid liabilities are commonly referred to as M3/GDP. It is a measure of financial depth and the overall size of the financial intermediary sector4. It is the addition of currency, demand and interest-bearing liabilities of both banks and non-bank financial institutions. It consists of broad money supply (M2) plus commercial paper, travelers’ checks, foreign currency time deposits and shares of mutual funds or market funds held by residents as a ratio of GDP (see World Development Indicators 2016). It is a better measure of financial depth because M2 may be a poor proxy of financial development in countries with underdeveloped financial system. M3/GDP is more concerned with the capacity of the financial system to provide transaction services rather than the capacity to channel funds from savers to borrowers (see Khan and Senhadji 2003).
First, theoretical literature on the finance-growth nexus posited that financial development accelerates economic growth by enhancing the sources of growth such as capital accumulation and productivity growth (see King and Levine 1993; Levine and Zervos 1998; Beck et al. 2000; Rioja and Valev 2004). Specifically, Levine and Zervos (1998) noted that a financial system is considered as developed when it can efficiently and effectively perform the resource mobilization and allocation functions aimed at promoting capital accumulation, productivity improvement and, ultimately, economic growth. Beck et al. (2000) reported that financial development has a positive impact on productivity growth and physical capital growth, which feeds through to economic growth (albeit the impact of the latter is tenuous). Rioja and Valev (2004) also revealed that financial development has a positive impact on economic growth; and the channel is primarily through capital accumulation in developing countries but mainly through productivity growth in more developed countries. The capital accumulation channel suggests that an efficient financial system mobilizes savings and allocates resources to domestic and foreign capital investments thereby boosting capital accumulation. Through saving mobilization, the financial sector overcomes the indivisibilities’ problems. Conversely, the productivity channel stresses the importance of innovative financial technologies, which decrease the problem of information asymmetry that hinders efficient allocation of financial resources and investment project monitoring (see King and Levine 1993). This channel suggests that a well-developed financial system provides efficient credit facilities and other financial services that promote the adoption of modern technology to boost knowledge- and technology-intensive industries.
Second, theoretical literature has also underscored the influence of the real exchange rate on economic growth. Accordingly, an increase in the real exchange rate could have a negative effect on economic growth, while a decrease in the real exchange rate could have a positive effect (Habib et al. 2017). This present study employs the level of the real exchange rate in line with extant literature (e.g., Gala 2008; Habib et al. 2017; Rautava 2004; Tang 2015), and real exchange rate volatility that is consistent with previous studies (e.g., Aghion et al. 2009; Bleaney and Greenaway 2001; Rapetti et al. 2012; Vieira et al. 2013). The level of the real exchange rate has the capacity to reduce both capital accumulation and productivity growth, thereby weakening the channels through which financial development enhances economic growth. It also affects saving, investment, private consumption and trade balance. For instance, a high and volatile real exchange rate has the potential to diminish international trade, weaken macroeconomic stability, distort price transparency and inhibit international financial integration (see Bleaney and Greenaway 2001; Razmi et al. 2012; Rodriguez 2017). Thus, real shocks and financial shocks are related, since the latter are significantly amplified in countries with high exchange rate fluctuations. In turn, exchange rate fluctuation is the outcome of both real and financial aggregate shocks. It affects the growth performance of credit-constrained firms.
Third, extant literature has posited that financial development and real exchange rate have a dynamic relationship. For instance, Aghion et al. (2009) posited that the growth interaction between financial development and real exchange rate stems from the fact that an increase in exchange rate causes a reduction in the firms’ current earnings, their ability to borrow in order to survive liquidity shocks, and long-term investments in innovation. They argued that although a decline in the real exchange rate has the opposite effect, but the existence of credit constraint suggests that the positive effects which a decline in the real exchange rate have on innovation may not be adequately compensated for by the negative effect of an increase in the real exchange rate. In other words, a greater anticipation of exchange rate fluctuation has the capacity to discourage investments in R&D, which ultimately decreases the level of financial development and economic growth. Hence, a high exchange rate fluctuation could dampen the positive impact of financial development on economic growth, especially in countries with a low level of financial development. From the foregoing discussion, therefore, this study seeks to test the hypothesis that financial development has a larger impact on economic growth in an environment of a lower real exchange rate (or its volatility) compared to an environment of a high real exchange rate (or its volatility).
The set of control variables included in the models is government consumption expenditure relative to GDP (used as an indicator of government policy), trade openness relative to GDP (captures the degree of a country’s openness), human capital (proxy by average years of schooling), which accounts for the effect of human capital accumulation on growth, and inflation rate (captures macroeconomic instability). These control variables are generally used in finance literature (see Beck et al. 2000; Levine et al. 2000). They are expected to be positively related to economic growth except inflation rate.
2.4. Estimation Techniques
The estimation techniques employed in this study are the Mean Group (MG) proposed by Pesaran and Smith (1995), and the Pooled Mean Group (PMG) proposed by Pesaran et al. (1999). The latter estimator assumes homogeneous long-term coefficients across countries but allows for variations in the short-term coefficients, speed of adjustment and error variances. However, the MG estimator allows the long-term and short-term coefficients, the speed of adjustment and the error variances to differ across countries. After estimation, the study conducts the Hausman test of homogeneity of long-term coefficients to determine the appropriate model between MG and PMG estimators. The MG and PMG estimators are chosen for this study for three reasons: (i) the MG and PMG estimators can be applied irrespective of the order of integration of the variables in the model because they are based on Autoregressive Distributed Lag (ARDL) models. In this study, some of the variables in the model are integrated in order zero [I (0)], while some variables are integrated in order one [I (1)]. (ii) The MG and PMG estimators provide both short-term and long-term estimation results. By distinguishing between short-term and long-term impacts, these estimators provide viable options for policy making. (iii) While the PMG estimator accounts for heterogeneity in short-term coefficients, the MG estimator accounts for heterogeneity in both short-term and long-term coefficients.
To complement the MG and PMG estimators, this study also employs an Instrumental Variable (IV) approach based on Two Stage Least Squares (TSLS), which is capable of controlling for possible endogeneity. The instruments used are the legal origin of the countries as well as the initial values of financial development, inflation rate, government expenditure, trade openness and human capital (see Asongu 2014; La Porta et al. 1997; Levine et al. 2000; Rousseau and Wachtel 2002). To ensure that the IV approach satisfies the order condition for identification, we perform the tests for endogeneity and over-identifying restrictions. The former shows whether the dependent variable is endogenous in the original model, whereas the latter indicates whether the instruments are uncorrelated with the error process.
Additionally, this study also utilizes the Seemingly Unrelated Regression (SUR) estimator proposed by Zellner (1962) on the disaggregated data to examine the influence of the real exchange rate or its volatility on the finance-growth nexus for individual country. SUR estimator enables us to account for possible cross-sectional dependence. Pesaran (2006) revealed that parameters estimates could be substantially biased, and their sizes could be distorted if cross-sectional dependence is ignored. The SUR estimator is a generalization of a linear regression model, which comprises many regression equations with each having its own dependent and independent variables. Each of the regression equations is a valid linear regression that could be estimated separately, but the regression equations are assumed to be correlated with respect to the error terms (see Bittencourt 2011; Ehigiamusoe et al. 2018). After estimating the equations, the study examines the statistical significance of the Lagrange Multiplier (LM) test in order to determine the presence of cross-sectional dependence among the countries in the panel and the suitability of the SUR estimator.
3. Empirical Results
3.1. Preliminary Data Analysis
3.1.1. Summary of Descriptive Statistics and Correlations
Table 1 presents a summary of the descriptive statistics and correlations of West African region for the 1980–2014 period. It is shown that average real GDP per capita, credit to the private sector relative to GDP and liquid liabilities relative to GDP were USD566.73, 15.43% and 25.64%, respectively. It also indicates that the respective average real exchange rate and its volatility were 1144.3 and 61.67 during the period. There are wide variations among the variables as indicated by the standard deviations, which are highest in the real exchange rate, its volatility and GDP. The lower panel in Table 1 shows the correlation analysis, as financial development indicators and the control variables are positively correlated with GDP per capita, while real exchange rate, its volatility and inflation rate are negatively related to GDP per capita. Moreover, real exchange rate and its volatility are negatively related to financial development.
3.1.2. Panel Unit Root Tests
We conduct unit root tests using the traditional panel data unit root tests (that assume homogeneity or account for heterogeneity) developed by Im et al. (2003); Levin et al. (2002) and Maddala and Wu (1999) as well as the Pesaran (2007) panel data unit root test that accounts for cross-sectional dependence. The results reported in Table 2 show that all the variables in the model are I(0) except GDP per capita, credit to the private sector, liquid liabilities and human capital, which are I(1). This implies that the variables in the model are a mixture of I(0) and I(1) processes, and the appropriate technique would be the ARDL approach.
3.2. Estimation Results
3.2.1. Panel Estimation Results
The results of the impact of financial development, real exchange rate and their interaction term on economic growth are reported in Table 3. Column 1 is the baseline model without interaction term, and it shows that financial development has a positive and significant long-term impact on economic growth, suggesting that variations in financial development can explain variations in economic growth in the West African region. In the short term, however, the impact of financial development on economic growth is not statistically significant at conventional level. In Column 2, the interaction term between financial development and real exchange rate is included in the model, and we find that the interaction term enters with a negative coefficient, in both the long term and short term, while the coefficient of financial development remains positive. This suggests that real exchange rate has an adverse effect on economic growth through the financial sector. In essence, the positive sign of the coefficient of financial development and the negative sign of the coefficient of interaction term suggest that the positive impact of financial development on economic growth is adversely influenced by real exchange rate. In Column 3, the linear real exchange rate is included in the model, and the results reveal that both the linear real exchange rate and the interaction term enter with negative coefficients in both the short term and long term, while the coefficient of financial development remains positive (albeit statistically insignificant at conventional level). Thus, the inclusion of both the linear real exchange rate and the interaction term in the model weakens the positive impact of financial development on economic growth.
In Columns 4 and 5, we replace real exchange rate with real exchange rate volatility. This is necessary because volatility in the real exchange rate could have effect on various dimensions of the economy, one of which is the finance-growth nexus. Hence, we measure real exchange rate volatility as the standard deviation of the 5-year moving average of the logarithm of the real exchange rate (see Aghion et al. 2009; Serenis and Tsounis 2013; Sharifi-Renani and Mirfatah 2012), The results presented in Columns 4 and 5 indicate that the coefficient of the real exchange rate volatility is negative implying that volatility in the real exchange rate is repugnant to economic growth through the financial sector. This suggests that the impact of financial development on economic growth varies with the level of the real exchange rate volatility, the higher the level of volatility, the lower the impact of finance on growth.
In all the models, the convergence coefficients are negative and statistically significant, which suggest the presence of cointegration relationship between economic growth and the independent variables. It shows the speed of adjustment from short-term disequilibrium to long-term equilibrium. The Hausman tests of homogeneity indicate that the PMG models are the appropriate models5. In selecting the lag orders for the models, the study uses the unrestricted models based on Schwarz Information Criteria (SIC) subject to a maximum lag of 2.
The lower panel of Table 3 shows the computed marginal effects of financial development on economic growth at various levels of the real exchange rate and its volatility using Equation (2) and the estimated long-term coefficients. We find that the marginal effects diminish with higher real exchange rate and higher volatility. We also compute the corresponding standard errors and t-statistics to determine the statistical significance of the marginal effects. Thus, real exchange rate and its volatility have diminishing effects on the impact of financial development on economic growth in the West African region.
As for the control variables, there is evidence of positive growth-effect from government consumption expenditure, trade openness and human capital, which are consistent with economic theory. The endogenous growth model posited that access to global markets via international trade makes an open economy more likely to grow rapidly and efficiently than a closed economy. It also stressed the importance of human capital accumulation in the process of economic growth. Finally, the effect of inflation rate on economic growth is mixed. Theoretical and empirical literature contended that inflation rate begins to have a negative impact on economic growth when it exceeds a certain threshold level (see Rousseau and Wachtel 2002).
3.2.2. Robustness Checks
This study conducts some checks to ascertain the robustness of the regression results. First, we use alternative estimation techniques, namely an Instrumental Variable (IV) approach based on Two Stage Least Squares (TSLS) to control for possible endogeneity. The results reported in Table 4 are consistent with the PMG results, with financial development positively related to economic growth, whereas the interaction term is negatively related. It also shows that the marginal effects of financial development on economic growth diminish as real exchange rate and its volatility increase.
Second, we use an alternative proxy of financial development (namely, liquid liabilities relative to GDP) and redo the analysis. The results presented in Table 5 also provided evidence that real exchange rate volatility is deleterious to the finance-growth nexus in the West African region. It also shows that the inclusion of the real exchange rate and the interaction term in the model diminishes the positive impact of financial development on economic growth.
Thirdly, in order to account for structural breaks in the series, we conduct a structural break test using the test developed by Bai and Perron (2003), and found significant structural breaks in some countries. To account for the breaks, we include dummy variables that take the value of 1 from the years of the breaks and 0 otherwise in the model (see Wallack 2003), and redo the analysis. The estimation results6 are similar to the earlier results in terms of the sign and significant of the coefficients (albeit the magnitude somewhat differ).
3.2.3. SUR Estimation Results for Individual Country
Table 6 and Table 7 show the SUR estimation results of the influence of the real exchange rate and its volatility on the finance-growth nexus in West African countries using disaggregated data. This is necessary to control for cross sectional dependence among the countries in the panel. In essence, the LM test statistic confirms the existence of cross-sectional dependence among the countries in the panel and the suitability of SUR estimator. In Table 6, the interaction term between financial development and real exchange rate enters with a negative coefficient in 12 countries suggesting that the impact of financial development on economic growth is adversely influenced by real exchange rate in these countries7 (Benin, Burkina Faso, Cape Verde, Cote D’Ivoire, Gambia, Guinea, Mali, Mauritania, Niger, Senegal, Sierra Leone and Togo). The computed marginal effects diminish as real exchange rates increase in these countries. However, there is evidence that the real exchange rate is harmful to the finance-growth nexus in four countries (Ghana, Guinea Bissau, Liberia and Nigeria).
Similarly, Table 7 reveals that the interaction term between financial development and real exchange rate volatility enters with a negative coefficient in 13 countries (Benin, Burkina Faso, Cape Verde, Cote D’Ivoire, Ghana, Guinea, Liberia, Mauritania, Niger, Nigeria, Senegal, Sierra Leone and Togo), implying that real exchange rate volatility reduces the impact of financial development on economic growth. The computed marginal effects are lower at higher levels of volatility relative to lower levels in these West African countries.
4. Discussion and Policy Implications
The findings of this study are summarized as follows: first, financial development enhances economic growth in the West African region. This implies that variations in financial development can explain variations in economic growth in the region. This is consistent with empirical literature, which opined that financial development enhances economic growth in developing countries by accelerating the sources of growth such as capital accumulation and productivity growth (see Ehigiamusoe and Lean 2018; Ehigiamusoe et al. 2018; Karimo and Ogbonna 2017; Ratsimalahelo and Barry 2010; Rioja and Valev 2004; Sanogo and Moussa 2017). This suggests that the financial system in the West African region is capable of mobilizing savings and allocating resources to domestic and foreign capital investments, which boost capital accumulation. In recent times, the financial system in many West African countries have embarked on innovative financial technologies which decrease the problem of information asymmetry (which hinders efficient allocation of financial resources and investment project monitoring), thereby facilitating economic growth.
Second, the findings on the link between real exchange rate and economic growth are consistent with Aghion et al. (2009), Elbadawi et al. (2012) and Vieira et al. (2013) who reported a negative impact of the real exchange rate on economic growth. Specifically, Aghion et al. (2009) reported that real exchange rate volatility has deleterious effects on economic variables such as productivity growth, investment and private consumption. They argued that uncertainty in the real exchange rate worsens the negative effect of domestic credit market constraints on investments. Jayashankar and Rath (2017) also posited that the relationship between the foreign exchange market and money market in emerging economies could make positive or negative shocks that affect one market to be quickly transmitted to another market via the contagious effect.
Apart from its direct adverse effect on economic growth, this study also reveals that real exchange rate weakens the impact of financial development on economic growth in the West African region. The level of the real exchange rate has the capacity to reduce both capital accumulation and productivity growth, thereby weakening the channels through which financial development enhances economic growth. It also affects saving, investment, private consumption and trade balance (see Razmi et al. 2012; Rodriguez 2017).
Similarly, this study shows that real exchange rate volatility has a deleterious effect on the impact of financial development on economic growth in the West African region. This is consistent with the theoretical literature which contended that high and volatile real exchange rate has the potential to diminish international trade, weaken macroeconomic stability, distort price transparency and inhibit international financial integration (see Bleaney and Greenaway 2001; Katusiime 2019; Razmi et al. 2012). Thus, real shocks and financial shocks are related, since the latter are significantly amplified in countries with high exchange rate fluctuations. In turn, exchange rate fluctuation is the outcome of both real and financial aggregate shocks. It affects the growth performance of credit-constrained firms.
Unlike previous studies, this present study shows that the impact of financial development on economic growth varies with the level of the real exchange rate and its volatility. In other words, besides their direct effects, real exchange rate and its volatility have indirect effects on economic growth through the financial sector. This study represents a novel idea by showing the marginal effects of financial development on economic growth at various levels of the real exchange rate (or its volatility), an issue that was not explored in previous literature. This is fundamental because the marginal effect enables us to determine the changes in economic growth caused by simultaneous changes in both financial development and real exchange rate (or its volatility), which is essential for policy formulation.
The implication of this study is that high real exchange rate and high volatility adversely affect the finance-growth nexus in the West African region. Hence, a reduction or stability in the real exchange rate is fundamental for financial development to enhance economic growth in West African countries. This suggests that the existing policies on real exchange rate have not been able to reduce the variable to the level that it would have beneficial effects on the finance-growth nexus. Hence, West African countries need to re-evaluate the policies as well as formulate the necessary fiscal and monetary policies that would ensure reduction in the real exchange rate.
5. Conclusions
This paper focuses on the influence of the real exchange rate and its volatility on the finance-growth nexus using both panel and disaggregated data of West African countries. It employs different econometric techniques such as MG, PMG, IV and SUR estimators8. The study reveals that financial development has a positive impact on economic growth, but the impact is weakened by the real exchange rate and its volatility. Thus, the marginal effects of financial development on economic growth computed at lower levels of the real exchange rate or its volatility are larger than the marginal effects computed at higher levels. The higher the real exchange rate and its volatility, the less that finance spurs growth.
The implication of this study is that high real exchange rate and high volatility adversely affect the finance-growth nexus in the West African region. Hence, a reduction or stability in the real exchange rate is fundamental for financial development to enhance economic growth in West African countries. This study has succeeded in revealing the impact of the real exchange rate and its volatility on the finance-growth nexus within panel and disaggregated data framework. Therefore, future study may complement this study by examining the threshold levels of the real exchange rate and its volatility beyond which the marginal effects of financial development on economic growth turn negative. Apart from the level and volatility of the real exchange rate, future research could also investigate the influence of the real exchange rate misalignment, currency overvaluation (undervaluation) or real exchange rate regimes on the finance-growth nexus.
Author Contributions
Both authors contributed equally to the paper.
Funding
This research received no external funding.
Conflicts of Interest
The authors declare no conflict of interest.
References
- Aghion, Philippe, Philippe Bacchetta, Romain Ranciere, and Kenneth Rogoff. 2009. Exchange Rate Volatility and Productivity Growth: The Role of Financial Development. Journal of Monetary Economics 56: 494–513. [Google Scholar] [CrossRef]
- Arcand, Jean, Enrico Berkes, and Ugo Panizza. 2015. Too much finance? Journal of Economic Growth 20: 105–48. [Google Scholar] [CrossRef]
- Asongu, Simplice. 2014. Law, Finance and Investment: Does legal origin matter in Africa? The Review of Black Political Economy 41: 145–75. [Google Scholar] [CrossRef]
- Bai, Jushan, and Pierre Perron. 2003. Computation and analysis of multiple structural change models. Journal of Applied Econometrics 18: 1–22. [Google Scholar] [CrossRef] [Green Version]
- Beck, Thorsten, Ross Levine, and Norman Loayza. 2000. Finance and the Sources of Growth. Journal of Financial Economics 58: 261–300. [Google Scholar] [CrossRef]
- Bittencourt, Manoel. 2011. Inflation and Financial Development: Evidence from Brazil. Economic Modelling 28: 91–99. [Google Scholar] [CrossRef]
- Bleaney, Michael, and David Greenaway. 2001. The impact of terms of trade and real exchange rate volatility on investment and growth in sub-Saharan Africa. Journal of Development Economics 65: 491–500. [Google Scholar] [CrossRef]
- Brambor, Thomas, William Clark, and Matt Golder. 2006. Understanding interaction models: Improving empirical analyses. Political Analysis 14: 63–82. [Google Scholar] [CrossRef]
- Comunale, Mariarosaria. 2017. Dutch disease, real effective exchange rate misalignments and their effect on GDP growth in EU. Journal of International Money and Finance 73: 350–70. [Google Scholar] [CrossRef]
- Conrad, Daren, and Jaymieon Jagessar. 2018. Real Exchange Rate Misalignment and Economic Growth: The Case of Trinidad and Tobago. Economies 6: 52. [Google Scholar] [CrossRef]
- Demetriades, Panicos, and Hook Siong Law. 2006. Finance, institutions and economic development. International Journal of Finance and Economics 11: 245. [Google Scholar] [CrossRef]
- Economic Data. 2016. Published by the Federal Reserve Bank of St Louis, USA. Available online: https://fred.stlouisfed.org (accessed on 20 October 2016).
- Ehigiamusoe, Kizito Uyi, and Hooi Hooi Lean. 2018. Finance-growth nexus: New insights from West African Region. Emerging Markets Finance and Trade 54: 2596–613. [Google Scholar] [CrossRef]
- Ehigiamusoe, Kizito Uyi, Hooi Hooi Lean, and Chien-Chiang Lee. 2018. Moderating effect of inflation on the finance–growth nexus: Insights from West African countries. Empirical Economics, 1–24. [Google Scholar] [CrossRef]
- Elbadawi, Ibrahim, Linda Kaltani, and Raimundo Soto. 2012. Aid, Real Exchange Rate Misalignment, and Economic Growth in Sub-Saharan Africa. World Development 40: 681–700. [Google Scholar] [CrossRef]
- Fujiwara, Ippei, and Yuki Teranishi. 2011. Real exchange rate dynamics revisited: A case with financial market imperfections. Journal of International Money and Finance 30: 1562–89. [Google Scholar] [CrossRef]
- Gala, Paulo. 2008. Real exchange rate levels and economic development: Theoretical analysis and econometric evidence. Cambridge Journal of Economics 32: 273–88. [Google Scholar] [CrossRef]
- Gries, Thomas, Manfred Kraft, and Daniel Meierrieks. 2009. Linkages between financial deepening, trade openness, and economic development: causality evidence from Sub-Saharan Africa. World Development 37: 1849–60. [Google Scholar] [CrossRef]
- Habib, Maurizio, Elitza Mileva, and Livio Stracca. 2017. The real exchange rate and economic growth: Revisiting the case using external instruments. Journal of International Money and Finance 73: 386–98. [Google Scholar] [CrossRef]
- Hassan, Kabir, Benito Sanchez, and Jung Yu. 2011. Financial Development and Economic Growth: New Evidence from Panel Data. The Quarterly Review of Economics and Finance 51: 88–104. [Google Scholar] [CrossRef]
- Human Development Reports. 2015. Human Development Reports 2015 published by the United Nations Development Programme. Available online: http://hdr.undp.org/sites/default/files/2015_human_development_report.pdf (accessed on 20 October 2016).
- Im, Kyung So, Hashem Pesaran, and Yongcheol Shin. 2003. Testing for unit roots in Heterogeneous Panels. Journal of Econometrics 115: 53–74. [Google Scholar] [CrossRef]
- IMF. 2014. World Economic Outlook Database of the International Monetary Fund. Available online: http://www.imf.org/external/pubs/ft/weo/2015/02/weodata/index.aspx (accessed on 20 October 2016).
- Iyke, Bernard. 2018. The real effect of currency misalignment on productivity growth: evidence from middle-income economies. Empirical Economics 55: 1637–59. [Google Scholar] [CrossRef]
- Jayashankar, Malepati, and Badri Narayan Rath. 2017. The dynamic linkage between exchange rate, stock price and interest rate in India. Studies in Economics and Finance 34: 383–406. [Google Scholar] [CrossRef]
- Kar, Muhsin, Saban Nazlıoglu, and Huseyin Agır. 2011. Financial development and economic growth nexus in the MENA countries: Bootstrap panel granger causality analysis. Economic Modelling 28: 685–93. [Google Scholar] [CrossRef]
- Karimo, Tari, and Oliver Ogbonna. 2017. Financial deepening and economic growth nexus in Nigeria: Supply-leading or demand-following? Economies 5: 4. [Google Scholar] [CrossRef]
- Katusiime, Lorna. 2018. Private Sector Credit and Inflation Volatility. Economies 6: 1. [Google Scholar] [CrossRef]
- Katusiime, Lorna. 2019. Investigating Spillover Effects between Foreign Exchange Rate Volatility and Commodity Price Volatility in Uganda. Economies 7: 1. [Google Scholar] [CrossRef]
- Khan, Moshin, and Abdelhak Senhadji. 2003. Financial development and economic growth: A review and new evidence. Journal of African Economies 12: 89–110. [Google Scholar] [CrossRef]
- King, Robert, and Ross Levine. 1993. Finance, Entrepreneurship and Growth: Theory and Evidence. Journal of Monetary and Economics 32: 513–42. [Google Scholar] [CrossRef]
- La Porta, Rafael, Florence Lopez-de-Silanes, Andrei Shleifer, and Robert Vishny. 1997. Legal Determinants of External Finance. Journal of Finance 52: 1131–50. [Google Scholar] [CrossRef]
- Law, Siong Hook, and Nirvikar Singh. 2014. Does too much Finance Harm Economic Growth? Journal of Banking and Finance 41: 36–44. [Google Scholar] [CrossRef]
- Law, Siong Hook, Ali Kutan, and Ahmad Mohd Naseem. 2018. The role of institutions in finance curse: Evidence from international data. Journal of Comparative Economics 46: 174–91. [Google Scholar] [CrossRef]
- Levin, Andrew, Chien-Fu Lin, and Chia-Shang Chu. 2002. Unit Root Tests in Panel Data: Asymptotic and Finite-sample Properties. Journal of Econometrics 108: 1–24. [Google Scholar] [CrossRef]
- Levine, Ross, and Sara Zervos. 1998. Stock Markets, Banks and Economic Growth. American Economic Review 88: 537–58. [Google Scholar]
- Levine, Ross, Norman Loayza, and Thorsten Beck. 2000. Financial Intermediation and Growth: Causality and Causes. Journal of Monetary Economics 46: 31–77. [Google Scholar] [CrossRef]
- Lin, Shu, and Haichun Ye. 2011. The role of financial development in exchange rate regime choices. Journal of International Money and Finance 30: 641–59. [Google Scholar] [CrossRef]
- Loayza, Norman, and Romain Ranciere. 2006. Financial development, financial fragility, and growth. Journal of Money, Credit and Banking 38: 1051–76. [Google Scholar] [CrossRef]
- Maddala, Gangadharrao, and Shaowen Wu. 1999. A comparative study of unit root tests with panel data and a new simple test. Oxford Bulletin of Economics and Statistics 61: 631–52. [Google Scholar] [CrossRef]
- Pesaran, Hashem. 2006. Estimation and inference in large heterogeneous panels with a multifactor error structure. Econometrica 74: 967–1012. [Google Scholar] [CrossRef]
- Pesaran, Hashem. 2007. A simple panel unit root test in the presence of cross-section dependence. Journal of Applied Econometrics 22: 265–312. [Google Scholar] [CrossRef] [Green Version]
- Pesaran, Hashem, and Ron Smith. 1995. Estimating long-term relationships from dynamic heterogeneous panels. Journal of Econometrics 68: 79–113. [Google Scholar] [CrossRef]
- Pesaran, Hashem, Yongcheol Shin, and Ron Smith. 1999. Pooled mean group estimation of dynamic heterogeneous panels. Journal of the American Statistical Association 94: 621–34. [Google Scholar] [CrossRef]
- Rapetti, Martin, Peter Skott, and Arslan Razmi. 2012. The real exchange rate and economic growth: are developing countries different? International Review of Applied Economics 26: 735–53. [Google Scholar] [CrossRef]
- Ratsimalahelo, Zaka, and Mamadou Barry. 2010. Financial development and economic growth: Evidence from West Africa. Economics Bulletin 30: 2996–3009. [Google Scholar]
- Rautava, Jouko. 2004. The role of oil prices and the real exchange rate in Russia’s economy—A cointegration approach. Journal of Comparative Economics 32: 315–27. [Google Scholar] [CrossRef]
- Razmi, Arslan, Martin Rapetti, and Peter Skott. 2012. The real exchange rate and economic development. Structural Change and Economic Dynamics 23: 151–69. [Google Scholar] [CrossRef]
- Rioja, Felix, and Neven Valev. 2004. Finance and the sources of growth at various stages of economic development. Economic Inquiry 42: 127–40. [Google Scholar] [CrossRef]
- Rodriguez, Cesar. 2017. The growth effects of financial openness and exchange rates. International Review of Economics and Finance 48: 492–512. [Google Scholar] [CrossRef]
- Rodrik, Dani. 2008. The real exchange rate and economic growth. Brookings Papers on Economic Activity 2: 365–412. [Google Scholar] [CrossRef]
- Rousseau, Peter, and Paul Wachtel. 2002. Inflation thresholds and the finance–growth nexus. Journal of International Money and Finance 21: 777–93. [Google Scholar] [CrossRef]
- Samargandi, Nahla, Jan Fidrmuc, and Sugata Ghosh. 2015. Is the relationship between financial development and economic growth monotonic? Evidence from a sample of middle-income countries. World Development 68: 66–81. [Google Scholar] [CrossRef]
- Sanogo, Vassiki, and Richard Moussa. 2017. Financial reforms, financial development, and economic growth in the Ivory Coast. Economies 5: 1. [Google Scholar] [CrossRef]
- Serenis, Dimitrios, and Nicholas Tsounis. 2013. Exchange rate volatility and foreign trade: The case for Cyprus and Croatia. Procedia Economics and Finance 5: 677–85. [Google Scholar] [CrossRef]
- Sharifi-Renani, Hosein, and Maryam Mirfatah. 2012. The impact of exchange rate volatility on foreign direct investment in Iran. Procedia Economics and Finance 1: 365–73. [Google Scholar] [CrossRef]
- Tang, Bo. 2015. Real Exchange Rate and Economic Growth in China: A Cointegrated VAR Approach. China Economic Review 34: 293–310. [Google Scholar] [CrossRef]
- Tang, Xiaobo, and Xingyuan Yao. 2018. Do financial structures affect exchange rate and stock price interaction? Evidence from emerging markets. Emerging Markets Review 34: 64–76. [Google Scholar] [CrossRef]
- Tarawalie, Abu. 2010. Real exchange rate behaviour and economic growth: evidence from Sierra Leone. South African Journal of Economic and Management Sciences 13: 8–25. [Google Scholar] [CrossRef]
- Vieira, Flavio, Marcio Holland, Cleomar da Silva, and Luiz Bottecchia. 2013. Growth and Exchange Rate Volatility: A Panel Data Analysis. Applied Economics 45: 3733–41. [Google Scholar] [CrossRef]
- Wallack, Jessica. 2003. Structural breaks in Indian macroeconomic data. Economic and Political Weekly 38: 4312–15. [Google Scholar]
- World Development Indicators. 2016. Published by the World Bank. Available online: https://datacatalog.worldbank.org/dataset/world-development-indicators (accessed on 20 October 2016).
- World Economic Outlook. 2015. Published by the International Monetary Fund. Available online: https://www.imf.org/external/pubs/ft/weo/2016/01/weodata/index.aspx (accessed on 20 October 2016).
- Zellner, Arnold. 1962. An efficient method of estimating seemingly unrelated regressions and tests for aggregation bias. Journal of American Statistical Association 57: 348–68. [Google Scholar] [CrossRef]
| 1 | We attempt to use different frequency data such as quarterly or monthly data to check the robustness of our annual data; unfortunately, the quarterly or monthly data for all variables in our model are unavailable for the sample period. When the quarterly or monthly data become readily available in the future, further research could utilize them for comparison. |
| 2 | The real exchange rate between West Africa currencies and the United States dollar is the product of the nominal exchange rate (the units of West Africa currencies given up for one United States dollar) and the ratio of consumer price index between West Africa and United States. The core equation is RER = eP*/P, where e = the nominal West Africa currencies − US dollar exchange rate, P* = the consumer price index in West Africa, and P = the consumer price index in the United States. |
| 3 | We thank the anonymous reviewer for this comment. We are aware that, at a low level of financial development (proxy by credit to the private sector relative to GDP), an increase in credit to the private sector could suggest a higher financial development and probably greater economic growth. However, at a high level of financial development, an increase in credit to the private sector (e.g., from 150% to 200% of GDP) may not indicate a positive development in the financial sector, rather it might probably suggest that the financial sector could undermine economic growth (see Arcand et al. 2015; Law and Singh 2014; Samargandi et al. 2015; Law et al. 2018). Specifically, Arcand et al. (2015) showed that the impact of financial development on economic growth turns negative when financial development (proxy by credit to the private sector) reaches 100% of GDP. However, our study focuses on developing economies of the West African region with a relatively low level of financial development as indicated in Table 1. It shows that the average credit to the private sector relative to GDP was 15.4%, while liquid liabilities relative to GDP were 25.6% during the 1980–2014 period. Therefore, financial system development in the West African region has not reached the level of excessive financial development, which could undermine economic growth in the region. |
| 4 | Although credit to the private sector relative to GDP and liquid liabilities relative to GDP are the two most commonly used proxies of financial development in the literature, but unavailability of data on other proxies (e.g., stock market indicators, commercial-central bank assets, etc.) in the West African region limited our choice of proxies. |
| 5 | Hence, the results of the MG model are not presented to conserve space but available upon request. |
| 6 | The results are not reported to conserve space, but available upon request. |
| 7 | The results of the SUR model with the linear real exchange rate are not reported to conserve space, but available upon request. The results are similar to the ones presented in Table 6, as the interaction term enters with a negative coefficient in 12 countries. |
| 8 | The approach employed in this study is to examine the impact of real exchange rate and its volatility on the finance-growth nexus in the West African region. It is not proposed for forecasting. |
Figure 1.
Trends analysis of GDP, financial development and real exchange rate in the West African region.
Figure 1.
Trends analysis of GDP, financial development and real exchange rate in the West African region.


Table 1.
Summary of descriptive statistics and correlations.
| Variables | Y | CPS | LLY | GOV | TOP | HCA | INF | RER | RERV |
|---|---|---|---|---|---|---|---|---|---|
| Minimum | 64.810 | 0.802 | 0.416 | 3.542 | 6.320 | 0.400 | −35.525 | 0.001 | 0.535 |
| Mean | 566.729 | 15.432 | 25.642 | 14.807 | 68.979 | 2.602 | 11.858 | 1144.32 | 61.667 |
| Maximum | 3766.11 | 65.278 | 83.026 | 54.515 | 321.63 | 7.004 | 178.70 | 88103.8 | 3939.1 |
| Standard Dev. | 527.875 | 10.774 | 12.759 | 5.926 | 34.172 | 1.481 | 19.030 | 5281.9 | 412.87 |
| CPS | 0.630 *** | ||||||||
| LLY | 0.692 *** | 0.696 *** | |||||||
| GOV | 0.112 ** | 0.390 *** | 0.172 *** | ||||||
| TOP | 0.112 ** | 0.217 *** | 0.244 *** | 0.145 *** | |||||
| HCA | 0.370 *** | 0.200 *** | 0.275 *** | −0.200 *** | 0.301 *** | ||||
| INF | −0.187 *** | −0.295 *** | −0.267 *** | −0.295 *** | −0.036 | 0.074 | |||
| RER | −0.066 ** | −0.172 *** | −0.132 *** | −0.156 *** | −0.124 *** | −0.058 | 0.054 | ||
| RERV | −0.078 ** | −0.059 | −0.046 | −0.054 | 0.129 *** | −0.097 ** | 0.105 ** | −0.031 |
Notes: *** and ** indicates statistically significant at 1% and 5%, respectively. Y = real GDP per capita, CPS = credit to the private sector relative to GDP, LLY = liquid liabilities relative to GDP, GOV = government consumption expenditure relative to GDP, TOP = trade openness relative to GDP, HCA = human capital, INF = inflation rate, RER = real exchange rate, RERV = real exchange rate volatility.
Table 2.
Panel unit root tests.
| Variables | ADF–Fisher | PP–Fisher | LLC | IPS | Pesaran |
|---|---|---|---|---|---|
| Y | 12.068 | 9.606 | 2.203 | 3.183 | −1.457 * |
| CPS | 27.357 | 27.059 | −1.109 | −0.059 | −0.541 |
| LLY | 33.193 | 31.748 | 0.317 | 0.215 | −2.662 ** |
| RER | 48.882 ** | 92.522 *** | −4.376 *** | −2.224 ** | −2.549 ** |
| RERV | 55.457 *** | 44.719 * | −2.788 *** | −3.102 *** | −0.793 |
| GOV | 78.280 *** | 84.061 *** | −2.533 *** | −1.361 * | −3.235 *** |
| TOP | 54.206 *** | 55.684 *** | −1.511 * | −2.265 ** | −1.496 * |
| HCA | 9.365 | 11.915 | −0.553 | 5.817 | 4.443 |
| INF | 122.431 *** | 174.348 *** | −7.999 *** | −7.612 *** | −6.787 *** |
| ∆Y | 179.439 *** | 276.720 *** | −9.498 *** | −11.005 *** | −10.704 *** |
| ∆CPS | 180.387 *** | 363.000 *** | −10.724 *** | −10.873 *** | −9.191 *** |
| ∆LLY | 184.236 *** | 286.182 *** | −11.242 *** | −11.267 *** | −9.709 *** |
| ∆RER | 169.106 *** | 257.976 *** | −8.619 *** | −10.494 *** | −8.912 *** |
| ∆RERV | 122.787 *** | 250.541 *** | −8.368 *** | −7.903 *** | −8.647 *** |
| ∆GOV | 228.511 *** | 403.824 *** | −12.234 *** | −13.619 *** | −10.520 *** |
| ∆TOP | 213.345 *** | 366.959 *** | −10.752 *** | −12.801 *** | −9.818 *** |
| ∆HCA | 149.526 *** | 306.169 *** | −3.248 *** | −8.169 *** | −2.831 *** |
| ∆INF | 350.181 *** | 507.739 *** | −16.868 *** | −19.922 *** | −16.381 *** |
Notes: ***, ** and * indicates statistically significant at 1%, 5% and 10%, respectively, and a rejection of null hypothesis of unit root. ∆ = first differenced notation, ADF-Fisher = Augmented Dickey Fuller-Fisher test, LLC = Levin et al. (2002), IPS = Im et al. (2003), Pesaran = Pesaran (2007) test. Y = real GDP per capita, CPS = credit to the private sector relative to GDP, LLY = liquid liabilities relative to GDP, RER = real exchange rate, RERV = real exchange rate volatility, GOV = government consumption expenditure relative to GDP, TOP = trade openness relative to GDP, HCA = human capital, INF = inflation rate.
Table 3.
Pooled Mean Group (PMG) estimation results.
| Variables | (1) | (2) | (3) | (4) | (5) |
|---|---|---|---|---|---|
| Long-term coefficients | |||||
| CPS | 0.213 *** (0.047) | 0.615 *** (0.183) | 0.189 (0.436) | 0.423 *** (0.049) | 0.570 *** (0.055) |
| RER | −0.026 (0.261) | ||||
| CPS*RER | −0.049 (0.035) | −0.031 (0.070) | |||
| RERV | 0.079 (0.022) | ||||
| CPS*RERV | −0.001 (0.001) | −0.022 ** (0.009) | |||
| GOV | 0.296 *** (0.107) | −0.099 (0.144) | −0.131 (0.191) | 0.244 ** (0.123) | 0.212 ** (0.116) |
| TOP | 0.447 *** (0.118) | 0.653 *** (0.155) | 0.538 *** (0.206) | 0.829 *** (0.131) | 0.671 *** (0.116) |
| HCA | 0.586 *** (0.195) | −0.164 (0.279) | −0.267 (0.393) | 0.357 ** (0.192) | 0.664 *** (0.219) |
| INF | −0.003 (0.002) | 0.089 *** (0.018) | 0.144 *** (0.039) | 0.003 (0.003) | −0.002 (0.003) |
| Convergence coefficient | −0.224 *** (0.035) | −0.090 *** (0.019) | −0.062 *** (0.013) | −0.228 *** (0.043) | −0.227 *** (0.056) |
| Short-term coefficients | |||||
| ∆CPS | −0.086 (0.048) | 0.644 *** (0.234) | 0.694 (0.482) | −0.061 (0.048) | −0.094 ** (0.049) |
| ∆RER | −0.082 (0.189) | ||||
| ∆CPS*RER | −0.154 *** (0.030) | −0.161 ** (0.069) | |||
| RERV | −0.021 (0.026) | ||||
| ∆CPS*RERV | −0.001 (0.001) | 0.007 (0.009) | |||
| ∆GOV | 0.037 (0.049) | 0.017 (0.049) | 0.018 (0.044) | 0.055 (0.076) | 0.088 (0.073) |
| ∆TOP | −0.301 *** (0.073) | −0.184 *** (0.063) | −0.139 ** (0.067) | −0.304 *** (0.083) | −0.283 *** (0.087) |
| ∆HCA | −0.283 *** (0.108) | −0.237 *** (0.079) | −0.265 *** (0.098) | −0.344 ** (0.147) | −0.439 *** (0.122) |
| ∆INF | −0.001 (0.001) | −0.001 (0.001) | −0.002 (0.001) | −0.002 (0.001) | −0.002 (0.002) |
| Time trend | 0.005 *** (0.001) | 0.006 *** (0.001) | 0.004 *** (0.001) | 0.003 ** (0.002) | 0.002 (0.002) |
| Constant | −0.829 (0.573) | −1.854 *** (0.529) | −1.506 *** (0.376) | −0.905 (0.656) | −0.339 (0.740) |
| Hausman test | 3.47 | 5.90 | 10.41 | 5.20 | 2.07 |
| Log Likelihood | 473.64 | 625.73 | 648.89 | 467.007 | 498.619 |
| Marginal effects | |||||
| Minimum | 1.332 | 0.642 | 0.422 | 0.558 | |
| Mean | 0.397 *** | 0.051 | 0.361 | −0.787 | |
| Maximum | 0.057 | −0.164 | −3.516 | −86.089 | |
Notes: ***, ** and * indicate statistically significant at 1%, 5% and 10%, respectively. Standard errors are in parenthesis. Dependent variable = economic growth; CPS = credit to the private sector relative to GDP, RER = real exchange rate, CPS*RER = interaction term between credit to the private sector and real exchange rate, RERV = real exchange rate volatility, CPS*RERV = interaction term between credit to the private sector and real exchange rate volatility, GOV = government consumption expenditure relative to GDP, TOP = trade openness relative to GDP, HCA = human capital, INF = inflation rate.
Table 4.
Robustness checks using Instrumental Variables (IV) regressions.
| Variables | (1) | (2) | (3) | (4) | (5) |
|---|---|---|---|---|---|
| CPS | 0.339 *** (0.058) | 0.289 *** (0.067) | 0.311 ** (0.133) | 0.502 *** (0.077) | 0.481 *** (0.077) |
| RER | 0.033 (0.032) | ||||
| CPS*RER | −0.006 (0.005) | −0.002 (0.018) | |||
| RERV | −0.002 (0.003) | ||||
| CPS*RERV | −0.001 (0.001) | −0.001 (0.001) | |||
| GOV | −0.148 * (0.089) | −0.119 (0.092) | −0.087 (0.093) | −0.232 * (0.126) | −0.258 * (0.139) |
| TOP | −0.078 (0.072) | −0.072 (0.072) | −0.105 (0.094) | −0.085 (0.115) | −0.168 (0.102) |
| HCA | 0.453 *** (0.035) | 0.476 *** (0.036) | 0.518 *** (0.037) | 0.359 *** (0.067) | 0.422 *** (0.056) |
| INF | −0.006 *** (0.002) | −0.005 *** (0.001) | −0.005 ** (0.001) | −0.005 ** (0.002) | −0.006 ** (0.003) |
| Time Trend | −0.001 *** (0.001) | −0.001 *** (0.001) | −0.001 *** (0.001) | −0.001 *** (0.001) | −0.001 *** (0.001) |
| Constant | 5.963 *** (0.300) | 5.899 *** (0.306) | 5.834 *** (0.188) | 5.941 *** (0.511) | 6.341 *** (0.528) |
| F-test | 1.02 | 7.08 *** | 1.87 * | 6.502 *** | 5.536 *** |
| Eigenvalue stat. | 51.62 *** | 52.28 *** | 64.69 *** | 50.647 *** | 49.332 *** |
| Marginal effects | |||||
| Minimum | 0.377 *** | 0.340 | 0.501 *** | 0.480 *** | |
| Mean | 0.262 *** | 0.302 *** | 0.440 *** | 0.419 *** | |
| Maximum | 0.221 *** | 0.288 | −3.437 *** | −3.458 |
Notes: ***, ** and * indicates statistically significant at 1%, 5% and 10%, respectively. Heteroscedasticity–corrected standard errors are in parenthesis. The instruments used are the legal origins of the countries as well as the initial values of financial development, government expenditure, trade openness, human capita and inflation rate. Dependent variable = economic growth; CPS = credit to the private sector relative to GDP, RER = real exchange rate, CPS*RER = interaction term between credit to the private sector and real exchange rate, RERV = real exchange rate volatility, LLY*RERV = interaction term between liquid liabilities and real exchange rate volatility, GOV = government consumption expenditure relative to GDP, TOP = trade openness relative to GDP, HCA = human capital, INF = inflation rate.
Table 5.
Robustness checks using alternative proxy of financial development (liquid liabilities relative to GDP).
Table 5.
Robustness checks using alternative proxy of financial development (liquid liabilities relative to GDP).
| Variables | (1) | (2) | (3) | (4) | (5) |
|---|---|---|---|---|---|
| Long-term coefficients | |||||
| LLY | 0.566 *** (0.087) | 0.236 (0.259) | −1.735 *** (0.567) | 0.631 *** (0.081) | 0.564 *** (0.082) |
| RER | −1.090 *** (0.271) | ||||
| LLY*RER | 0.071 (0.060) | 0.395 (0.102) | |||
| RERV | −0.009 (0.016) | ||||
| LLY*RERV | −0.001 * (0.001) | 0.003 (0.005) | |||
| GOV | 0.144 (0.106) | −0.273 (0.184) | −0.356 ** (0.149) | 0.286 ** (0.135) | 0.229 ** (0.137) |
| TOP | 0.464 *** (0.117) | 0.427 *** (0.194) | 0.470 *** (0.155) | 0.658 *** (0.146) | 0.789 *** (0.155) |
| HCA | 0.688 *** (0.209) | 0.319 (0.384) | 0.460 (0.307) | 0.627 ** (0.257) | 0.606 ** (0.248) |
| INF | −0.004 (0.002) | 0.115 ** (0.026) | 0.081 *** (0.017) | 0.003 (0.003) | −0.006 ** (0.003) |
| Convergence coefficient | −0.199 *** (0.037) | −0.068 *** (0.016) | −0.093 *** (0.019) | −0.205 *** (0.039) | −0.197 *** (0.040) |
| Short-term coefficients | |||||
| ∆LLY | −0.288 *** (0.037) | 0.431 ** (0.227) | −0.237 (0.780) | −0.241 *** (0.076) | −0.236 *** (0.086) |
| ∆RER | −0.312 (0.428) | ||||
| ∆LLY*RER | −0.135 *** (0.028) | −0.034 (0.132) | |||
| ∆RERV | −0.126 (0.107) | ||||
| ∆LLY*RERV | −0.002 (0.001) | 0.038 (0.035) | |||
| ∆GOV | 0.085 (0.057) | 0.043 (0.049) | 0.051 (0.049) | 0.025 (0.076) | 0.042 (0.078) |
| ∆TOP | −0.331 *** (0.075) | −0.183 *** (0.071) | −0.199 *** (0.068) | −0.229 ** (0.091) | −0.251 *** (0.090) |
| ∆HCA | −0.288 *** (0.084) | −0.305 *** (0.088) | −0.295 ** (0.072) | −0.358 ** (0.145) | −0.327 *** (0.116) |
| ∆INF | −0.002 (0.002) | −0.001 (0.001) | −0.001 (0.001) | −0.002 (0.002) | −0.002 (0.002) |
| Time trend | 0.003 (0.002) | 0.003 *** (0.001) | 0.003 *** (0.001) | 0.002 (0.002) | 0.002 (0.002) |
| Constant | −0.686 (0.723) | −0.865 (0.445) | −0.164 (0.449) | −0.817 (0.859) | −0.491 (0.823) |
| Hausman test | 4.80 | 5.47 | 3.70 | 5.30 | 3.83 |
| Log Likelihood | 491.06 | 631.62 | 653.93 | 472.231 | 493.481 |
Notes: ***, ** and * indicate statistically significant at 1%, 5% and 10%, respectively. Standard errors in parenthesis. Dependent variable = economic growth; LLY = liquid liabilities relative to GDP, RER = real exchange rate, LLY*RER = interaction term between liquid liabilities and real exchange rate, RERV = real exchange rate volatility, LLY*RERV = interaction term between liquid liabilities and real exchange rate volatility, GOV = government consumption expenditure relative to GDP, TOP = trade openness relative to GDP, HCA = human capital, INF = inflation rate.
Table 6.
Seemingly Unrelated Regression (SUR) estimation results of interaction term between financial development and real exchange rate.
Table 6.
Seemingly Unrelated Regression (SUR) estimation results of interaction term between financial development and real exchange rate.
| Country | CPS | CPS*RER | GOV | TOP | HCA | INF | Constant | R2 | Marginal Effects | ||
|---|---|---|---|---|---|---|---|---|---|---|---|
| Minimum | Mean | Maximum | |||||||||
| Benin | 0.346 ** (0.148) | −0.017 (0.022) | −0.166 (0.122) | 0.233 * (0.129) | 0.585 *** (0.050) | −0.004 (0.003) | 4.629 *** (0.605) | 0.809 | 0.259 | 0.242 | 0.234 |
| Burkina Faso | 0.771 *** (0.183) | −0.001 (0.028) | 0.505 *** (0.110) | 0.525 *** (0.135) | −1.475 (1.979) | 0.001 (0.004) | 0.747 (0.659) | 0.790 | 0.766 | 0.765 | 0.764 |
| Cape Verde | 1.790 *** (0.289) | −0.296 *** (0.063) | 0.515 (0.464) | 0.319 (0.230) | 0.246 (0.574) | −0.022 *** (0.007) | 2.774 (1.835) | 0.905 | 0.718 | 0.520 | 0.364 |
| Cote d’Ivoire | 0.588 *** (0.103) | −0.088 *** (0.023) | −0.018 (0.117) | 0.463 *** (0.116) | 0.403 *** (0.065) | −0.002 (0.003) | 4.281 *** (0.687) | 0.659 | 0.152 | 0.067 | 0.010 |
| Gambia | −0.245 *** (0.041) | −0.046 *** (0.012) | 0.029 (0.055) | −0.583 *** (0.083) | 0.262 ** (0.106) | −0.009 *** (0.001) | 9.342 *** (0.316) | 0.871 | −0.191 | −0.332 | −0.422 |
| Ghana | 0.122(0.139) | 0.051 *** (0.014) | 0.454 *** (0.147) | −0.554 ** (0.117) | 1.128 ** (0.518) | −0.002 (0.001) | 5.534 *** (0.726) | 0.751 | −0.624 | −0.101 | 0.173 |
| Guinea | 0.306 *** (0.109) | −0.023 *** (0.008) | 0.089 (0.074) | −0.129 (0.109) | 0.558 *** (0.190) | −0.003 *** (0.001) | 5.954 *** (0.429) | 0.187 | 0.238 | 0.154 | 0.092 |
| Guinea-Bissau | −0.329 *** (0.108) | 0.051 *** (0.019) | −0.141 (0.115) | −0.086 (0.225) | 1.486 (1.392) | −0.005 *** (0.002) | 5.319 *** (1.566) | 0.494 | −0.231 | −0.069 | 0.007 |
| Liberia | 0.088 (0.116) | 0.178 *** (0.019) | −0.262 * (0.146) | 0.197 ** (0.099) | −2.811 *** (0.337) | −0.018 (0.017) | 7.065 *** (0.628) | 0.657 | 0.010 | 0.451 | 0.917 |
| Mali | 0.637 *** (0.146) | −0.096 *** (0.019) | −0.065 (0.075) | −0.339 *** (0.101) | 0.701 *** (0.032) | −0.002 (0.002) | 7.255 *** (0.476) | 0.913 | 0.124 | 0.052 | 0.004 |
| Mauritania | −0.766 *** (0.177) | −0.012 (0.018) | −0.196 *** (0.049) | 0.081 (0.073) | 0.808 *** (0.204) | −0.001 (0.005) | 8.653 *** (0.682) | 0.825 | −0.806 | −0.820 | −0.835 |
| Niger | 0.842 *** (0.143) | −0.101 *** (0.025) | 0.008 (0.113) | 0.487 *** (0.098) | 0.150 *** (0.056) | −0.003 (0.002) | 3.187 *** (0.548) | 0.789 | 0.312 | 0.228 | 0.175 |
| Nigeria | −0.018 (0.241) | 0.026 ** (0.012) | 0.342 (0.225) | −0.501 ** (0.256) | 8.809 *** (3.268) | −0.012 *** (0.004) | −6.583 (5.959) | 0.591 | −0.151 | 0.013 | 0.121 |
| Senegal | 1.333 *** (0.230) | −0.099 *** (0.030) | −1.394 *** (0.307) | −0.341 ** (0.147) | 0.585 *** (0.116) | 0.001 (0.003) | 8.739 *** (0.892) | 0.663 | 0.822 | 0.732 | 0.676 |
| Sierra Leone | 0.626 *** (0.122) | −0.025 ** (0.013) | 0.146 (0.239) | −0.301 ** (0.136) | 0.717 *** (0.229) | −0.001 (0.001) | 5.492 *** (0.632) | 0.676 | 0.625 | 0.431 | 0.341 |
| Togo | 0.697 *** (0.147) | −0.067 *** (0.022) | −0.179 (0.140) | 0.140 (0.106) | 0.421 *** (0.081) | −0.001 (0.002) | 4.304 *** (0.453) | 0.634 | 0.360 | 0.300 | 0.258 |
| LM Test | 466.287 *** | ||||||||||
Notes: ***, ** and * indicate statistically significant at 1%, 5% and 10%, respectively. Standard errors in parenthesis. Dependent variable = economic growth; CPS = credit to the private sector relative to GDP, CPS*RER = interaction term between credit to the private sector and real exchange rate, GOV = government consumption expenditure relative to GDP, TOP = trade openness relative to GDP, HCA = human capital, INF = inflation rate.
Table 7.
SUR estimation results of interaction term between financial development and real exchange rate volatility.
Table 7.
SUR estimation results of interaction term between financial development and real exchange rate volatility.
| Country | CPS | CPS*RERV | RERV | GOV | TOP | HCA | INF | Constant | R2 | Marginal Effects | ||
|---|---|---|---|---|---|---|---|---|---|---|---|---|
| Minimum | Mean | Maximum | ||||||||||
| Benin | 0.426 *** (0.069) | −0.072 *** (0.016) | 0.164 *** (0.037) | 0.049 (0.126) | 0.134 (0.092) | 0.678 *** (0.052) | −0.008 *** (0.002) | 3.919 *** (0.384) | 0.922 | 0.362 | 0.179 | −0.432 |
| Burkina Faso | 1.145 *** (0.139) | −0.152 *** (0.029) | 0.327 *** (0.073) | −0.145 (0.192) | 0.336 *** (0.106) | −3.656 *** (1.312) | 0.001 (0.003) | 3.151 *** (0.686) | 0.885 | 1.025 | 0.736 | −0.077 |
| Cape Verde | 0.529 *** (0.072) | −0.101 *** (0.027) | 0.208 *** (0.068) | −0.212 (0.315) | 0.455 ** (0.207) | 0.655 (0.581) | −0.002 (0.008) | 3.666 ** (1.507) | 0.746 | 0.424 | 0.333 | 0.144 |
| Cote d’Ivoire | 0.481 ** (0.190) | −0.025 (0.087) | 0.079 (0.238) | −0.042 (0.132) | 0.583 *** (0.193) | 0.457 *** (0.113) | −0.008 ** (0.004) | 2.552 ** (1.188) | 0.772 | 0.462 | 0.418 | 0.278 |
| Gambia | −0.132 * (0.072) | 0.001 ** (0.001) | −0.001 *** (0.001) | 0.269 *** (0.074) | −0.222 * (0.128) | −0.142 (0.103) | −0.017 *** (0.003) | 7.087 *** (0.552) | 0.900 | −0.131 | 0.548 | 3.807 |
| Ghana | 0.586 *** (0.138) | −0.009 (0.010) | 0.029 (0.028) | 0.659 *** (0.147) | −1.354 *** (0.156) | 1.904 *** (0.411) | −0.002 (0.002) | 5.747 *** (0.716) | 0.896 | 0.573 | 0.378 | −0.463 |
| Guinea | 0.216 * (0.121) | −0.039 (0.025) | 0.054 (0.035) | 0.131 (0.088) | −0.309 *** (0.113) | 0.383 ** (0.197) | 0.002 (0.002) | 6.538 *** (0.409) | 0.219 | 0.172 | −0.100 | −0.597 |
| Guinea-Bissau | 0.059 (0.056) | 0.003 (0.004) | −0.016 (0.011) | 0.695 *** (0.176) | −0.016 (0.205) | 3.449 *** (1.335) | 0.001 (0.002) | 1.171 (1.566) | 0.484 | 0.060 | 0.085 | 0.165 |
| Liberia | −0.164 (0.236) | −0.002 ** (0.001) | 0.003 ** (0.001) | 0.247 (0.269) | −0.001 (0.231) | 0.492 (0.563) | −0.059 ** (0.029) | 5.137 *** (1.119) | 0.241 | −0.165 | −0.447 | −1.669 |
| Mali | 0.249 (0.182) | 0.002 (0.037) | 0.007 (0.095) | −0.007 (0.175) | −0.803 *** (0.186) | 0.568 *** (0.070) | −0.002 (0.004) | 8.372 *** (0.861) | 0.852 | 0.250 | 0.254 | 0.264 |
| Mauritania | −0.906 ** (0.474) | −0.069 (0.296) | 0.144 (0.985) | −0.398 *** (0.071) | 0.384 *** (0.094) | 0.272 (0.184) | −0.006 (0.005) | 8.918 *** (1.722) | 0.871 | −0.942 | −1.067 | −1.241 |
| Niger | 0.427 *** (0.059) | −0.021 (0.018) | 0.049 ** (0.026) | 0.219 ** (0.109) | 0.221 ** (0.104) | 0.242 *** (0.086) | −0.007 ** (0.003) | 3.225 *** (0.522) | 0.863 | 0.410 | 0.368 | 0.236 |
| Nigeria | −0.079 (0.262) | −0.004 ** (0.002) | 0.007 (0.005) | 0.607 ** (0.303) | −0.092 (0.264) | 14.96 *** (3.156) | −0.006 (0.042) | −18.35 *** (5.631) | 0.606 | −0.081 | −0.429 | −1.931 |
| Senegal | 0.726 *** (0.130) | −0.025 (0.038) | 0.081 (0.105) | 0.409 * (0.229) | 0.689 *** (0.191) | 0.392 *** (0.102) | −0.007 ** (0.003) | −0.135 (1.054) | 0.823 | 0.711 | 0.660 | 0.516 |
| Sierra Leone | 0.468 *** (0.157) | −0.016 * (0.009) | 0.011 (0.011) | −0.132 (0.232) | −0.069 (0.132) | 0.753 *** (0.205) | −0.001 (0.001) | 5.216 *** (0.625) | 0.767 | 0.404 | 0.223 | −0.281 |
| Togo | 0.601 *** (0.136) | −0.139 * (0.081) | 0.393 * (0.232) | −0.018 (0.130) | 0.195 ** (0.103) | 0.202 * (0.111) | −0.002 (0.003) | 3.112 *** (0.535) | 0.707 | 0.476 | 0.211 | −0.679 |
| LM Test | 358.366 *** | |||||||||||
Notes: ***, ** and * indicate statistically significant at 1%, 5% and 10%, respectively. Standard errors in parenthesis. Dependent variable = economic growth; CPS = credit to the private sector relative to GDP, CPS*RERV = interaction term between credit to the private sector and real exchange rate volatility, RERV = real exchange rate volatility, GOV = government consumption expenditure relative to GDP, TOP = trade openness relative to GDP, HCA = human capital, INF = inflation rate.
© 2019 by the authors. Licensee MDPI, Basel, Switzerland. This article is an open access article distributed under the terms and conditions of the Creative Commons Attribution (CC BY) license (http://creativecommons.org/licenses/by/4.0/).
Share and Cite
MDPI and ACS Style
Ehigiamusoe, K.U.; Lean, H.H. Influence of Real Exchange Rate on the Finance-Growth Nexus in the West African Region. Economies 2019, 7, 23. https://doi.org/10.3390/economies7010023
AMA Style
Ehigiamusoe KU, Lean HH. Influence of Real Exchange Rate on the Finance-Growth Nexus in the West African Region. Economies. 2019; 7(1):23. https://doi.org/10.3390/economies7010023
Chicago/Turabian StyleEhigiamusoe, Kizito Uyi, and Hooi Hooi Lean. 2019. "Influence of Real Exchange Rate on the Finance-Growth Nexus in the West African Region" Economies 7, no. 1: 23. https://doi.org/10.3390/economies7010023
Note that from the first issue of 2016, this journal uses article numbers instead of page numbers. See further details here.