
COVID-19 Pandemic and Stock Performance: Evidence from the Sub-Saharan African Stock Markets

School of Accounting, Economics and Finance, University of KwaZulu-Natal, Glenwood, Durban 4041, South Africa
*
Author to whom correspondence should be addressed.
Economies 2023, 11(3), 95; https://doi.org/10.3390/economies11030095
Submission received: 4 January 2023
/
Revised: 16 January 2023
/
Accepted: 23 January 2023
/
Published: 17 March 2023
(This article belongs to the Special Issue New Challenges in Emerging Stock Markets)
Abstract
:Emerging stock markets provide great opportunities for investment growth and risk diversification. However, they are more vulnerable to extreme market events. This study examines the effects of the COVID-19 pandemic on stock performance in sub-Saharan African stock markets. An event study method was used to determine whether there was any significant difference in sector returns before and during the pandemic, and panel data regression was used to determine the causal relationship between COVID-19 events and the abnormal returns observed. Four stock exchanges were chosen, including the two largest and two fastest-growing markets in sub-Saharan Africa. According to the study’s findings, the information technology, consumer staples, and healthcare sectors outperformed during the pandemic, while the industrials, materials, and real estate sectors underperformed. The financial and consumer discretionary proved to be the most stable sectors during the pandemic. We also observed that the imposition of lockdown had a negative impact on the performance of most sectors in sub-Saharan African markets, whereas government assistance in the form of economic stimulus packages had no significant positive impact on stock performance except in the South African market. Furthermore, we find that increases in COVID-19 cases and deaths had no negative impact on capital markets, where stocks have responded positively to economic recovery aid. The study concludes that during the COVID-19 pandemic, stocks reacted more to government actions than the occurrence of the pandemic itself.
1. Introduction
The novel coronavirus outbreak, which started in late 2019 in Wuhan, China, and was later dubbed COVID-19, has had a significant impact on global economies and financial markets around the globe. It has been found that the COVID-19 pandemic has plunged most economies around the world into a recession and triggered one of the largest global economic crises in more than a century (Alam et al. 2021; World Bank 2020). Similarly, stock markets around the world suffered a heavy blow as stock prices plummeted at the end of the first quarter of 2020 when the pandemic hit almost all countries around the world (Shehzad et al. 2021; Zhao et al. 2022). Several studies, for example, Shehzad et al. (2021); Chaudhary et al. (2020); Shaikh (2021); Izzeldin et al. (2021); Awan et al. (2021), found that the COVID-19 epidemic has negatively impacted most stock markets around the globe, whether in developing or developed markets. As a result of limited resources to deal with the repercussions of the pandemic, stock markets in developing countries are expected to have suffered the most. However, some studies (Phan and Narayan 2020; Singh and Shaik 2021) revealed that the impact of the pandemic has been more severe in developed than in developing nations. Zhao et al. (2022) further indicate that the impact of the COVID-19 pandemic in developed countries was driven by demand and supply reduction, and economic instability, while in developing economies, it was mostly related to changes in consumption patterns and other social issues, such as expectations and confidence.
Despite the above studies on the COVID-19 pandemic and stock market performance in emerging markets, most of them have been limited to aggregate stock market performance; that is, the performance of the stock market index, rather than performance at the sector or firm level. That being the case, it can be argued that such an analysis was made with an assumption that the COVID-19 epidemic had a uniform impact across all sectors and industries.
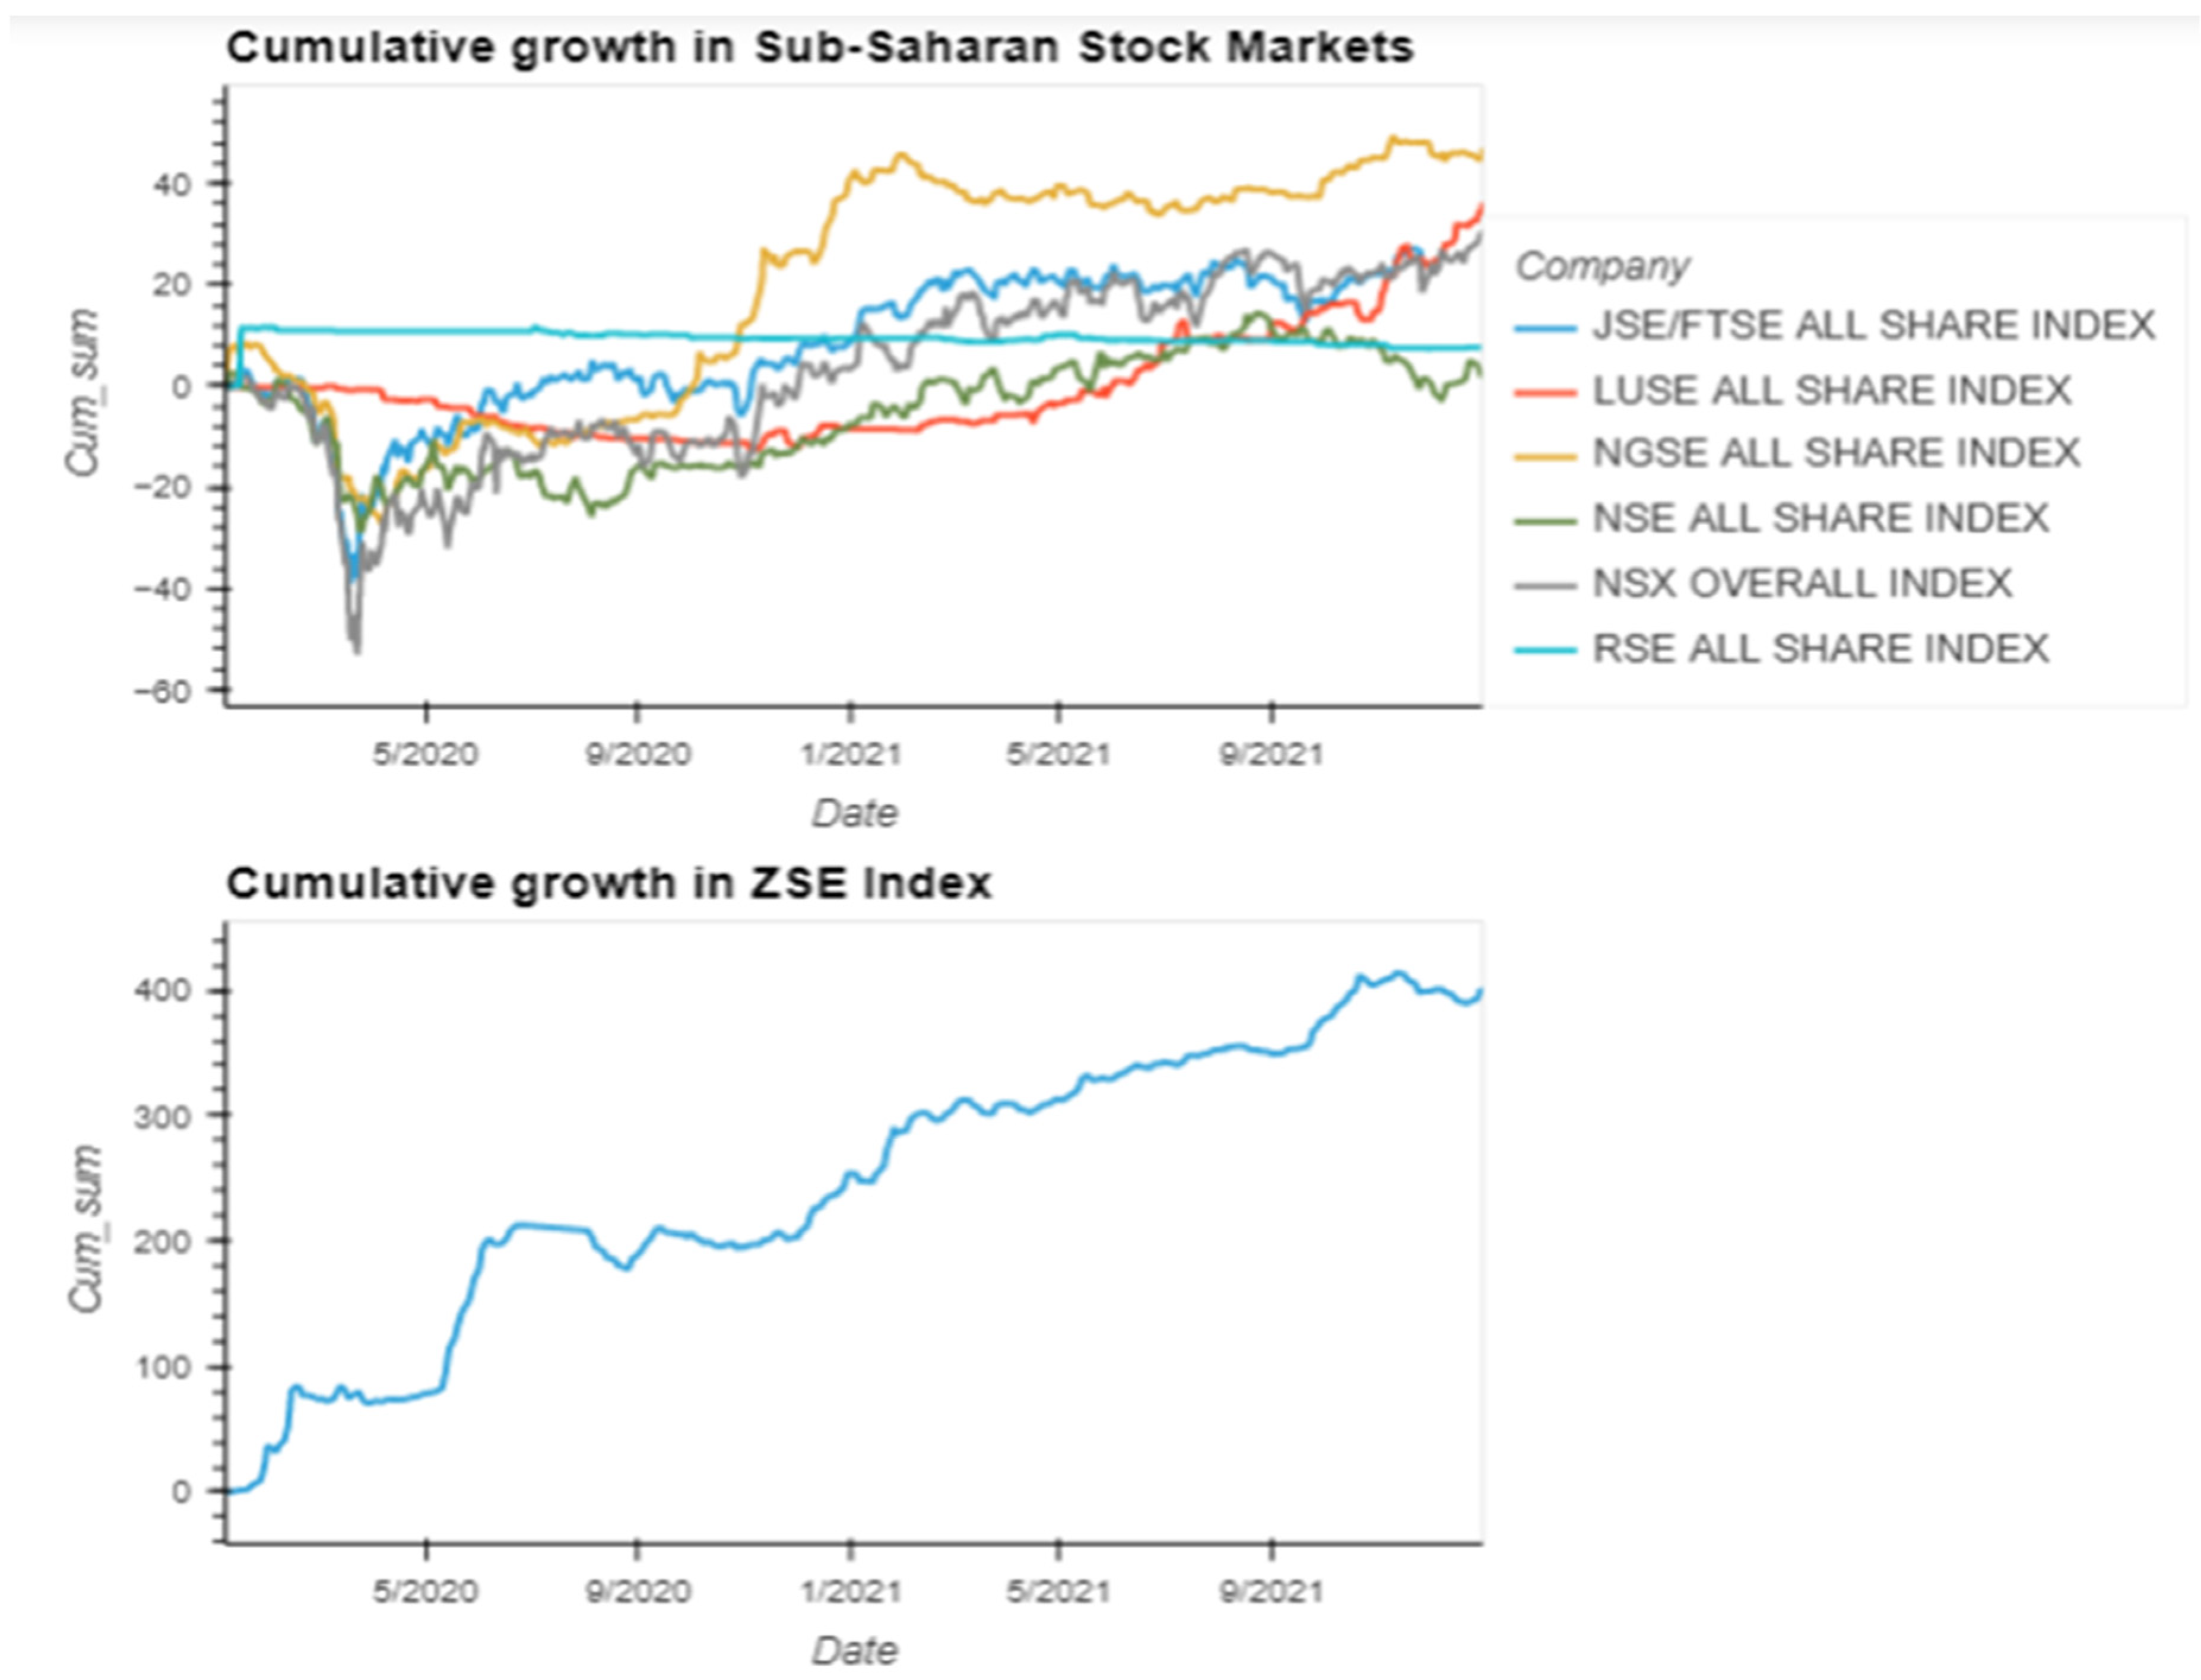
The aim of this study is to investigate the impact of the pandemic on sector performance among the sub-Saharan stock markets, as previous studies focus on the stock market as a whole and pay less attention to the sector and firm-level performance. As seen in Figure 1 below, several stock markets in sub-Saharan Africa experienced a decline in returns when the COVID-19 pandemic hit the region in March 2020, but the markets seem to have quickly recovered within a space of few months.
However, there are some stock exchanges that appear to be unaffected by the occurrence of the COVID-19 pandemic, for example, the Rwandan Stock Exchange (RSE), Lusaka Stock Exchange (LUSE), and the Zimbabwean Stock Exchange. The Zimbabwean Stock exchange emerged as the fastest-growing stock exchange during the pandemic period, recording a cumulative growth rate of about 200% in the year 2020.
Despite some evidence of a negative impact on stock market returns at the onset of the pandemic, there is a need for an investigation into how various sectors and industries in the sub-Saharan region reacted to the COVID-19 pandemic. Research from other regions, mostly from developed markets, which explored the impact of the epidemic on various sector performance, revealed that the coronavirus had varying degrees of impact on industries and sectors (Alam et al. 2021; Izzeldin et al. 2021; Mazur et al. 2021) even though it had a negative impact on the overall stock exchange. The pandemic was determined to have had a negative impact on real estate, transportation, energy, leisure, entertainment, and materials, whereas companies in technology, consumer staples, and healthcare performed well.
Given the difference in the economies of developed and developing nations, and the differences in measures that the government of these nations took to try and combat the pandemic, the findings from the developed economies cannot be generalized to these developing economies. Accordingly, this research will look into how the pandemic has affected various sectors of the sub-Saharan stock markets. To the researcher’s best knowledge, there are no studies performed that looked at the influence of the pandemic at the sector or firm level. Studies completed so far, for instance, Kumeka et al. (2021); Tetteh et al. (2022); Bayero et al. (2021), investigated the effects of the pandemic on overall stock market performance but did not consider how individual firms and sectors were impacted by the pandemic.
Severe epidemic diseases have become more recurrent and are posing to be a threat not only to human life but to the economy and financial markets as well. Identifying the impact of the pandemic on sector performance is therefore of paramount importance, especially to investors and portfolio managers, in that it will help them identify sectors and stocks that offer protection to their investment during times of extreme market events such as the current COVID-19 pandemic. This paper’s unique feature is that it explores how daily changes in COVID-19 cases and deaths, as well as government actions such as lockdowns and economic stimulus packages, were received by various stock market sectors in the sub-Saharan African region.
2. Literature Review
2.1. Black Swan Events and Stock Market Performance
A black swan is an extremely unusual occurrence that is unanticipated and can have disastrous repercussions (Taleb 2007). A black swan event can take many forms, including a natural disaster, a war, a financial crisis, or a virus outbreak. A black swan has the following three main characteristics (Taleb 2007): first, it is an unpredictable event that occurs outside of usual expectations; second, it has a significant and far-reaching impact on the economy, society, and or the entire planet. Lastly, once it occurs, it is less random and more predictable than before. According to Teitler-Regev and Tavor (2019), black swan events such as natural disasters, terrorism attacks, and man-made disasters usually have a negative impact on the stock market and the economy as a whole; however, it has been discovered that the impact on stock markets is typically short-term, with stock markets quickly returning to normal levels a few days after the event. The stock market’s reaction to black swan events is determined by the company’s level of exposure to those events (Seetharam 2017). For example, firms such as those in tourism, travel, and leisure, are associated with lower returns than the non-exposed when an environmental disaster strikes.
Black swan events frequently lead to black swan investing, in which investors seek out stocks and other safe haven assets that will hold their value if the market falls due to a catastrophic event (Kuruppu and De Zoysa 2020; Lybeck 2017). Other researchers have shown that black swan events are associated with behavioral biases such as fear, loss aversion, and hindsight bias (Bekiros et al. 2017; Nafday 2009; Yarovaya et al. 2021). Another significant revelation is made by Tastsidis Olsson and Löfberg (2014), who point out that black swan events lead to herding behavior because investors tend to take sides taken by the masses, such as buying when others are also buying or selling when others are selling, and this often leads to inefficient markets. Traditional factor models cannot be relied on in forecasting stock returns in times such as the current COVID-19 pandemic.
2.2. Respiratory Diseases and Stock Market Performance
Although the COVID-19 epidemic is regarded as a black swan event, the world did experience other related pandemics, such as severe acute respiratory syndrome (SARS), Middle East respiratory syndrome (MERS), and EBOLA, which were found to have affected stock markets around the globe (David et al. 2021). Chen et al. (2018) examined the impact of SARS on Asian financial markets and found that the epidemic weakened the stock market integration in the region. Nippani and Washer (2004), on the other hand, examined the impact of the SARS pandemic on stock market returns for all the affected countries, and the results indicated no significant negative impact except for the stock markets of China and Vietnam. However, a sector analysis by Chen et al. (2007), using an event study methodology, indicated that stocks in the hotel industry faced a decline in returns during the outbreak of the SARS. Other sectors, such as manufacturing, retail, and banking, were not significantly affected.
Choe et al. (2021) investigated the impact of the MERS on the Korean tourism industry and found that the occurrence of the pandemic negatively affected the performance of this sector and also depressed the Korean economy. The negative performance was mainly due to a reduction in the number of tourists visiting the country, which led to a loss of about 3.1 billion USD between the period of June 2015 to September 2015. Further analysis by Joo et al. (2019) shows that the MERS had a detrimental effect on other tourism-related industries, such as food and beverages, transportation, and accommodation.
Studies on the effects of Ebola on stock markets performance show that the news on the outbreak of the pandemic led to an increase in selloffs in affected stock markets, which negatively impacted the stock prices (Funck and Gutierrez 2018; Ichev and Marinč 2018). The effect was more pronounced in vulnerable and small industries such as the airline, food and beverage, and leisure industries. Ichev and Marinč (2018) further reveal that the impact of Ebola was more significant in the US, European, and West African regions and that fear and anxiety rather than real economic factors influenced the inventors’ decisions.
2.3. COVID-19 Pandemic and Stock Market Performance
Several studies have been conducted to assess the impact of the COVID-19 pandemic on stock market performance. Researchers such as Xu (2021); Alam et al. (2021); Yousfi et al. (2021); Baker et al. (2020); Haiykir and Çetenak (2022) considered the impact of the pandemic on the stock markets of developed economies and found that the occurrence of the pandemic has led to a decline in stock market returns. These studies revealed that the increase in COVID-19 cases and deaths negatively impacted the stock market performance, while the imposition of measures to revive the economy, such as economic stimulus packages, helped the stock markets to recover. Yousfi et al. (2021) further highlight that the government restrictions such as lockdowns and social distancing made the COVID-19 pandemic have a more severe negative impact on stock markets than previous pandemics.
Studies from emerging markets also had similar findings to those from developed economies (Kharbanda and Jain 2021; Sachdeva and Sivakumar 2020; Topcu and Gulal 2020). Although Kharbanda and Jain (2021) used a GARCH model while Sachdeva and Sivakumar (2020) performed an event study, they both confirm that an increase in COVID-19 cases and deaths had a significant negative impact on stock market returns. Stock markets were found to be more sensitive to the pandemic during the first wave, but later on, the markets seemed to be less responsive. Topcu and Gulal (2020) further reveal that the impact of the pandemic on stock markets of emerging economies is smaller in countries where the government responded swiftly to put measures to curb the pandemic and also where there was more government support in the form of economic stimulus packages. This is further supported by Singh and Shaik (2021), who found that, as in developed markets, stock markets of emerging markets also quickly recovered when the government put measures to revive the economy.
Other studies, for example, Topcu and Gulal (2020); Ashraf (2020); Ledwani et al. (2021); Uddin et al. (2021) compared the performance of stock markets for emerging and developed economies. Although they conclude that the stock markets were negatively affected by the occurrence of the pandemic, it was found that news on COVID-19 cases and deaths led to an increase in volatility in developed markets more than in emerging markets. However, developed economies were more successful in managing stock market volatility than their emerging counterparts, indicating the fragility of emerging market structure and lack of trust in government policies among investors in emerging stock markets. Uddin et al. (2021) further highlighted that in developed markets, economic freedom, governance, and productivity were the most important factors in managing stock market volatility during the pandemic, while for emerging markets, quality of health services, economic support, and governance quality were the most significant factors. Topcu and Gulal (2020) further reveal that the impact of the pandemic differs even among the emerging markets of different regions. Their study found that the impact of COVID-19 was more severe in emerging markets of Asia than the European counterparts.
Ashraf (2020) examined the impact of the pandemic on 77 stock markets around the globe by applying a panel regression on daily stock market returns. Their findings reveal that COVID-19 restrictions that have an adverse effect on economic activity, such as social distancing and lockdowns, negatively affect stock market returns, but over the long term they have a positive effect due reduction in COVID-19 cases. However, government support programs, such as economic stimulus packages, testing, and quarantining, were found to be having a direct positive effect on stock market returns. More related research was performed by Phan and Narayan (2020) on the stock markets of 25 countries most affected by the pandemic. Through an event study analysis, the researchers found that 24 of the 25 stock markets recorded negative returns on the day the World Health Organisation (WHO) declared COVID-19 a global pandemic on the 11th of March 2020. Furthermore, it was found that 12 of the 25 countries, mostly European countries, recorded positive returns when the travel ban was imposed by the governments of those nations, while only 8 reacted positively to the imposition of the lockdown measures. Similar to Ashraf (2020), the researchers established that the introduction of the stimulus package had positive returns in most stock markets, although the effects were more significant in those countries that had already introduced the lockdown measures.
2.4. COVID-19 Pandemic and Sector Performance
Most studies on COVID-19 and stock market performance have focused on aggregate stock market performance as measured by changes in the value of an index. However, there are a few studies in developed markets that went a step further and considered the impact of the pandemic on sector performance. For example, Elhini and Hammam (2021); Olczyk and Kuc-Czarnecka (2021) found that the pandemic had a negative impact on sectors such as communications, consumer discretionary, consumer staples, health, technology, and materials in the first three months after the occurrence of the pandemic. Other sectors, such as finance, the manufacturing industry, information technology, and utilities, demonstrated a significant positive relationship with the pandemic from the start of the pandemic, whereas the energy and real estate sectors appeared unaffected. In an event study analysis of sectors for the Australian stock exchange, Alam et al. (2021) show that the sensitivity of the sectors to the announcement of the pandemic differs among the sectors. On the day of the announcement, the retail, pharmaceutical, and healthcare sectors exhibited strong positive returns. Later on, telecommunications exhibited strong positive returns together with healthcare and pharmaceuticals, while the transportation industry continued to perform poorly.
Studies performed prior to the COVID-19 pandemic also confirm that stock market sectors react to the market crisis in different ways. For instance, a study by Ranjeeni (2014), which focused on New York Stock Exchange sectors, discovered that the global financial crisis had a positive influence on utilities, consumer staples, consumer discretionary, and health care while negatively impacting energy, information technology, and financial services. However, the materials and industrial sectors were more resilient to the crisis. On the other hand, Bekaert et al. (2014) analyzed 415 country-sector equity portfolios across 55 countries and found that the only sectors negatively impacted by the global financial crisis were materials, consumer cyclical, and financials.
3. Materials and Methods
In this section, we explain the samples, variables, data sources, and methodology adopted to examine the effects of the COVID-19 pandemic on stock performance in sub-Saharan Africa.
3.1. Samples and Variables
This study examined a sample of four stock markets, including the two largest, the Johannesburg Stock Exchange (JSE) and the Nigerian Stock Exchange (NGX), as well as the two fastest-growing during the pandemic, the Zimbabwe Stock Exchange (ZSE) and the Lusaka Stock Exchange (LSE). The study period is divided into the following two parts: the period prior to COVID-19, which is 160 days before the first COVID-19 case was recorded in each country, and the period during COVID-19, which is 150 days after the first COVID-19 case was recorded in the country.
To assess the impact of the COVID-19 pandemic on sector performance, we first conduct an event study analysis and then move on to do a regression analysis in order to check the relationship between COVID-19 cases and deaths, lockdown measures, and stimulus packages on stock returns. Our variables of interest and their sources are shown in Table 1 below.
3.2. Event Study Methodology
As highlighted by Woon (2004), an event analysis is conducted in order to investigate the effect of an event on a dependent variable. This involves first defining an estimation window that represents a normal economic environment and an event window that represents the period when the event occurred. After that, statistical methods can be used to test the hypothesis on whether the performance of a dependent variable has changed due to occurrence of an event. In this research we want to test the hypothesis that the outbreak of the COVID-19 pandemic has affected the performance of stocks in sub-Saharan stock markets.
For ease of analysis, the stocks were first grouped into sectors following the Global Industry Classification Standards (GICS). The Abnormal returns (AR) and cumulative abnormal returns (CAR) were calculated from the stock returns for each sector across the event window, and to test for the significance of the AR results. Panel data regression method was then used to assess the impact of daily COVID-19 cases and deaths as well as lockdown measures on stock performance. The python programming language, through Pandas library, was also used to align the timestamp of COVID-19 cases and deaths with the sector returns in order to measure the effects of those COVID-19 events on stock returns. The research is quantitative in nature since the analysis will be based solely on quantitative secondary data.
3.2.1. Estimation Window
The year 2019 was used to represent the pre-COVID-19 period and the estimation window consisted of 160 trading days prior to the first COVID-19 case for each stock exchange analyzed. As highlighted by Krivin et al. (2003), an estimation window of 60 days to one year is considered to be appropriate assuming that the stock market did not undergo any major structural changes. Moreover, Dang Ngoc et al. (2021) indicate that a longer estimation period helps to weather away the effects of short-term fluctuations leading to a more accurate measure of stock’s expected returns. The mean-adjusted model (MAD) was used to estimate the expected return during the estimation window.
Mean-Adjusted Model
The mean-adjusted model calculates the mean return, , for the estimation window as the average of the daily stock returns observed in the 160-day window. The mean model is used instead of the market model in order to avoid the challenges of finding the proxy for the market portfolio when estimating the market model.
3.2.2. Event Window
The event analysis was conducted for each sector in four stock markets being analyzed. The event window starts from the first day the COVID-19 case was recorded in each of the sampled countries until lockdown was eased. The event window was further subdivided into shorter periods based on major events such as the imposition of lockdown measures, economic recovery stimulus packages, and an announcement of a surge in COVID-19 cases or death rates. Daily abnormal returns were then calculated for each sector in the sampled stock markets. Since the dates on which the first case of COVID-19 was recorded in each country differ, as do the dates on which lockdown measures were implemented, the event dates will vary by country.
Abnormal Returns (AR)
The abnormal returns were calculated for each sector as the difference between the sector returns in the event window and the average return for the estimation window.
where:
is the mean return for sector i over the estimation window period, and
is the daily return for sector i over the event window period.
Cumulative Abnormal Returns (CAR)
The cumulative abnormal return is calculated for sector i over a window period in order to explore the accumulated impacts of a certain event during a specified time frame.
Test Statistic
The t-statistic is calculated in order to test for the significance of the AR results. This helps to check if the abnormal returns during the event period are significantly different from zero. If it is significant, then it implies that the COVID-19 event has an impact on sector returns. The t-statistic is calculated by dividing the ARs by the aggregate standard deviation of the daily returns for the estimation period, as shown below.
where is the aggregate estimation period standard deviation calculated as follows:
Additionally, , which is the estimation period standard deviation is calculated as follows:
where is the average abnormal return of stock i for the estimation period.
To calculate significance of the coefficient for a certain event window we use CAR and compute the t statistic as follows:
3.3. Panel Data Regression
As previously stated, panel data regression was employed to determine whether news of COVID-19 cases and deaths, as well as the implementation of lockdown measures, had a significant impact on sector abnormal returns. This work serves as a robustness check for event analysis results. Though event analysis can tell us whether an event has had an impact on stock returns, it is difficult to determine which COVID-19 events have resulted in abnormal returns, necessitating a regression analysis.
3.3.1. Analytical Model
The following panel data regression model is used to examine the effects of COVID-19 cases and deaths, as well as the imposition of lock-down measures, on abnormal sector returns. We include the volume variable to evaluate if abnormal returns are associated with market selloffs.
denotes abnormal returns for sector i at time t, represents daily COVID-19 cases, and represents daily COVID-19 deaths, and these two variables vary over time but are the same across sectors in each stock exchange. Vol denotes the daily volume of shares traded in each sector. The dummy variable was used to capture the effects of the lockdown on stock performance; = 1 when the country is under lockdown and 0 otherwise.
The fixed effects model and the random effects model are the two most common and widely used panel data models. The Hausman test is used to choose between these two regression models.
3.3.2. Hausman Test
The Hausman test is a panel data analysis tool for identifying endogenous regressors in a regression model (Amini et al. 2012). Ordinary least squares estimators fail when endogenous regressors are present in a model, as one of the assumptions of OLS is that there is no correlation between a predictor variable and the error term. The Hausman test tests the null hypothesis, that the random effects model is the most appropriate model, against the alternative hypothesis, that the fixed effects model is the most appropriate model. Failure to reject the null hypothesis indicates that there is no correlation between the error term and the independent variables in the panel data model, necessitating the use of the random effects model. Rejection of the null, on the other hand, implies that there is a correlation between the error term and the independent variables in the panel data model, and hence the fixed effect model must be employed.
3.4. Analytical Software
The Python programming language was used as the primary analysis tool. Python’s libraries provide numerous benefits, ranging from data cleansing to statistical analysis. The Pandas library allowed the researchers to cleanse their data and remove outliers that could cause erroneous results. Furthermore, with the help of the Pandas library, COVID-19 data that is recorded every day was easily mapped to stock price data that is only recorded on trading days. The eventpy Python library was used for event analysis in order to compute the abnormal and cumulative abnormal returns. The Python programming language was also used in the regression analysis and visual display of results.
4. Results
4.1. Event Analysis Results
4.1.1. Johannesburg Stock Exchange
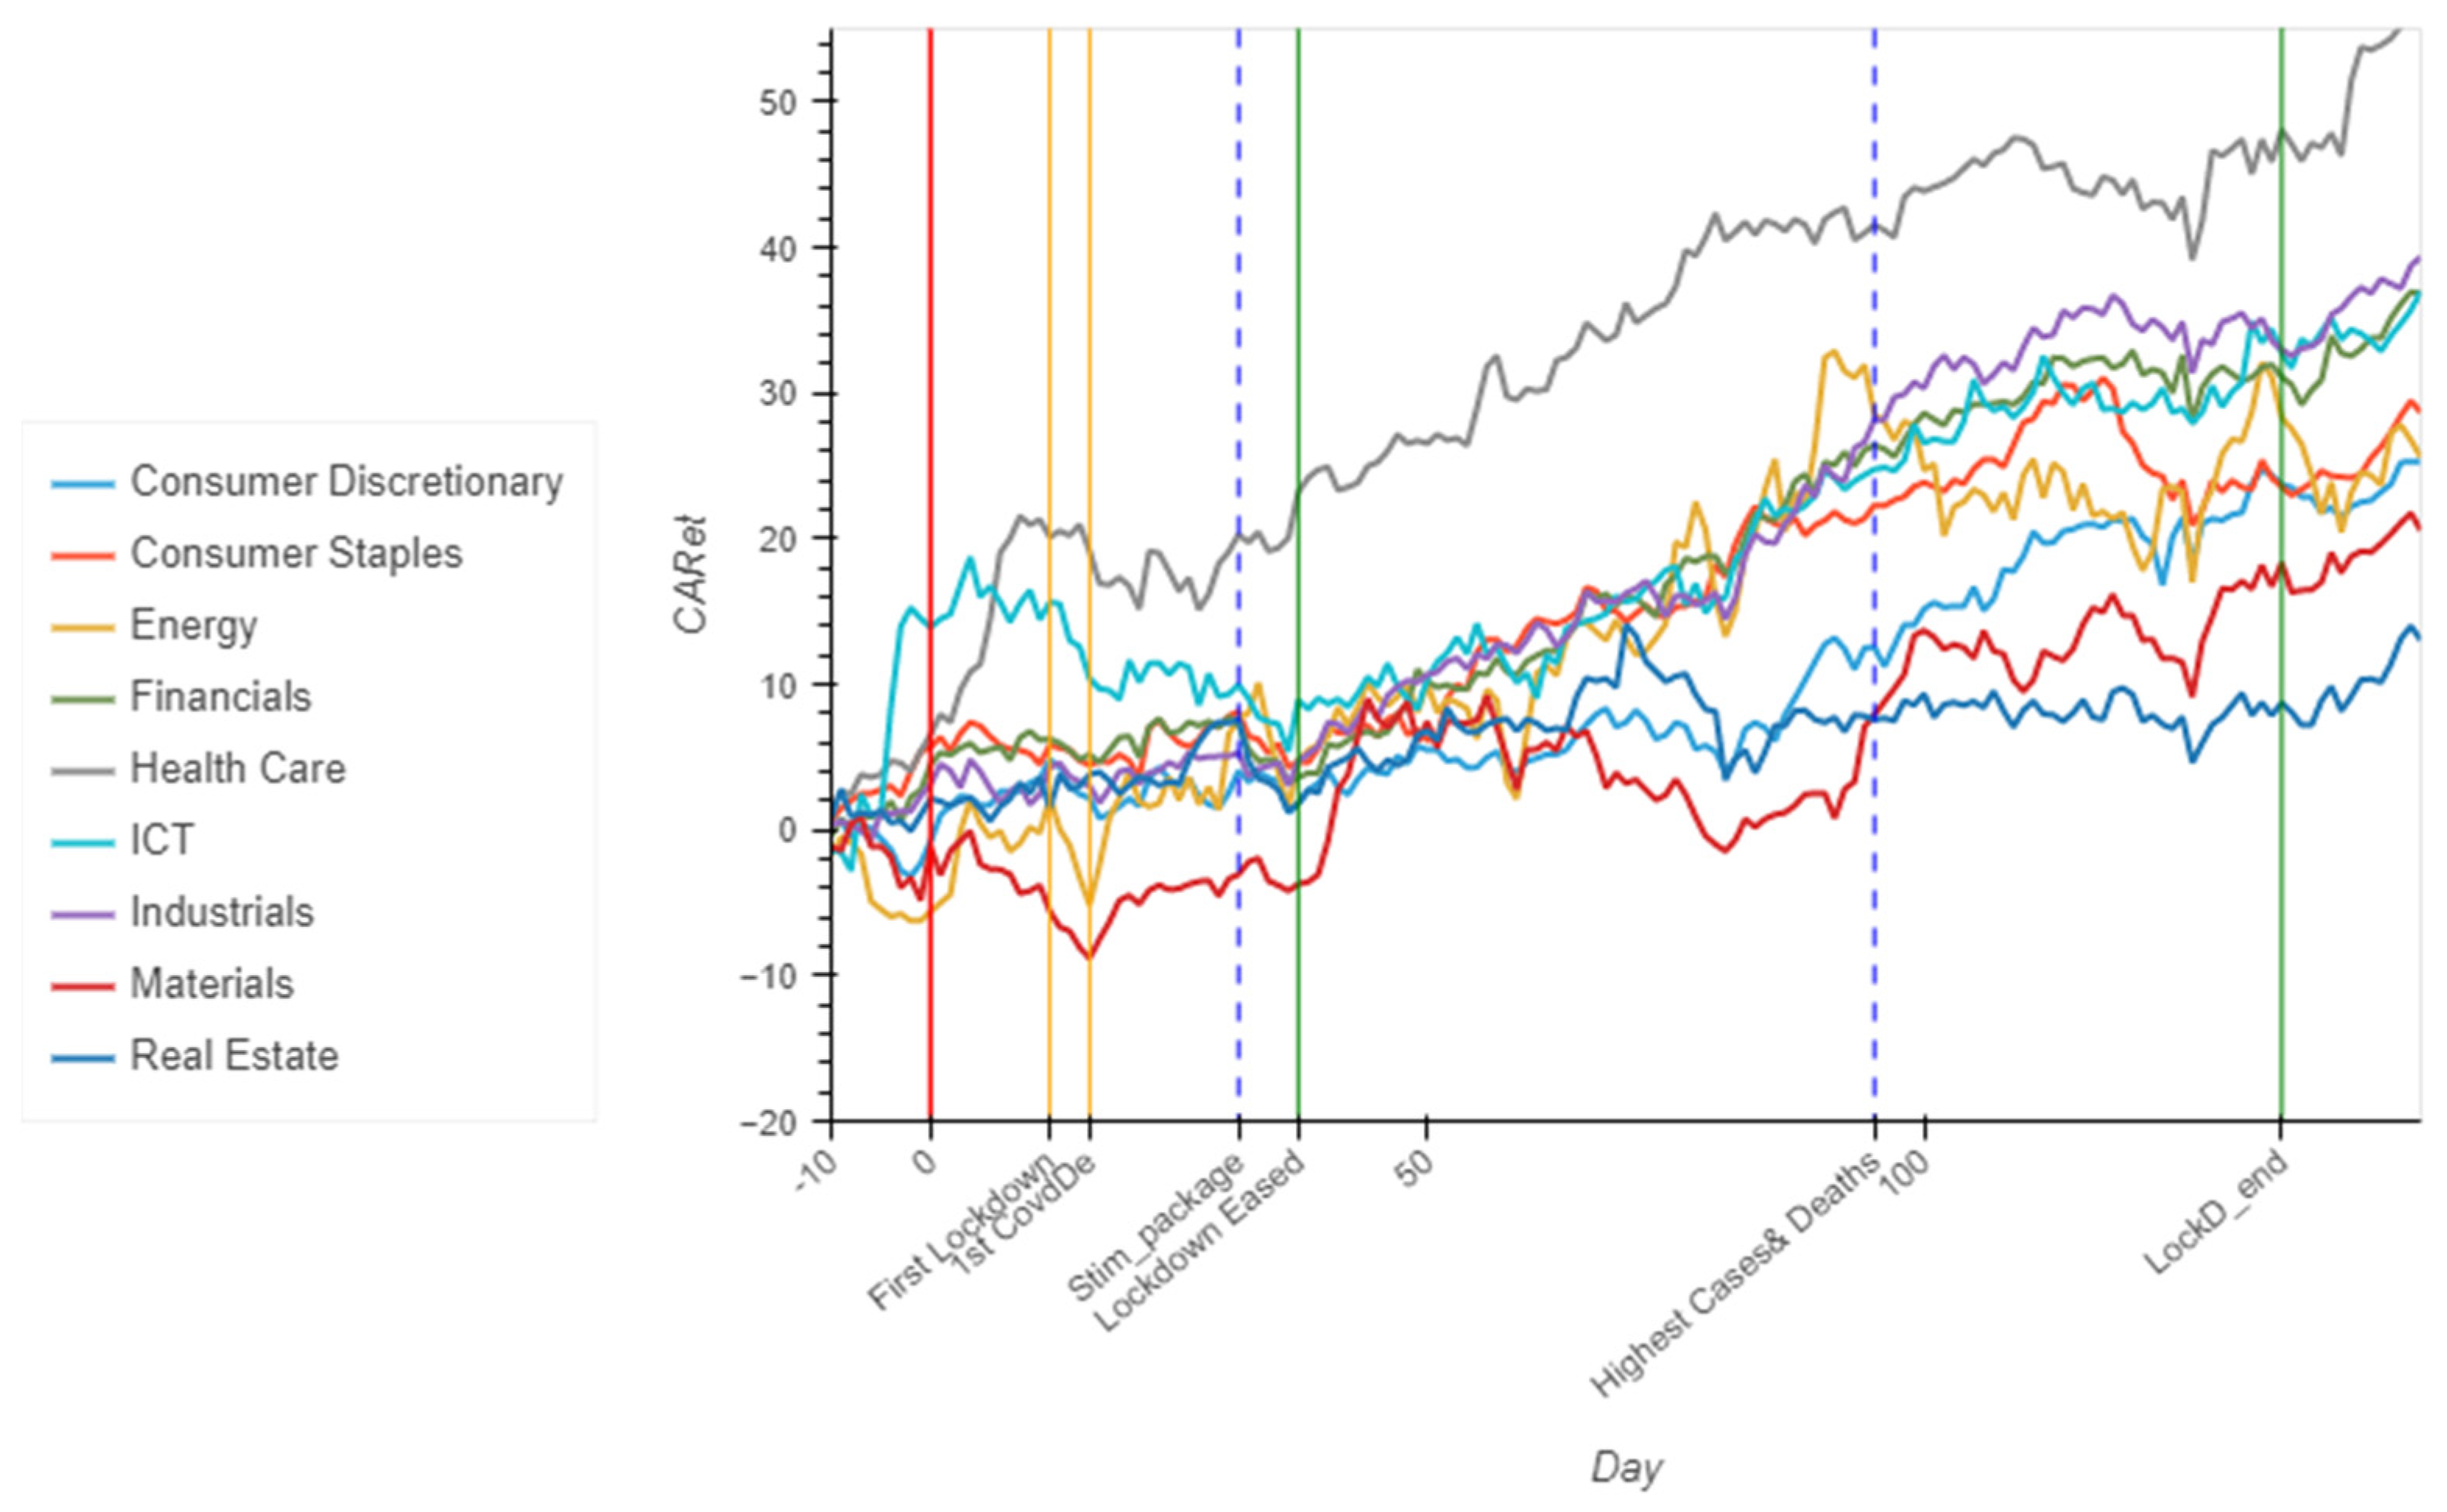
According to the cumulative abnormal return plot in Figure 2 below, most sectors at the Johannesburg Stock Exchange (JSE) experienced positive abnormal returns during the pandemic period, with ICT and health experiencing a significant positive CAR right at the start of the pandemic. Although the materials and energy sectors had negative ARs at the start of the pandemic, as results in Table 2 below show that these values were not statistically significant, implying that the pandemic may not have caused any significant change in their performance. However, we can see that most sectors, including ICT and health, experienced negative ARs when the lockdown was implemented on day 12 and then recovered 20 days later when the government announced the economic stimulus package and relaxed some lockdown measures. We also note that despite the imposition of a lockdown measure and an increase in COVID-19 cases and deaths, consumer staples, financials, and industrials continued to rise. The results in Table 2 also show that for the JSE, there were no significant CARs in the industrial, materials, real estate, and energy sectors during the pandemic period, implying that the changes in these sectors’ returns were not statistically different from the pre-COVID-19 period. After the government lifted the lockdown restrictions, almost all sectors experienced positive ARs.
4.1.2. Zimbabwe Stock Exchange
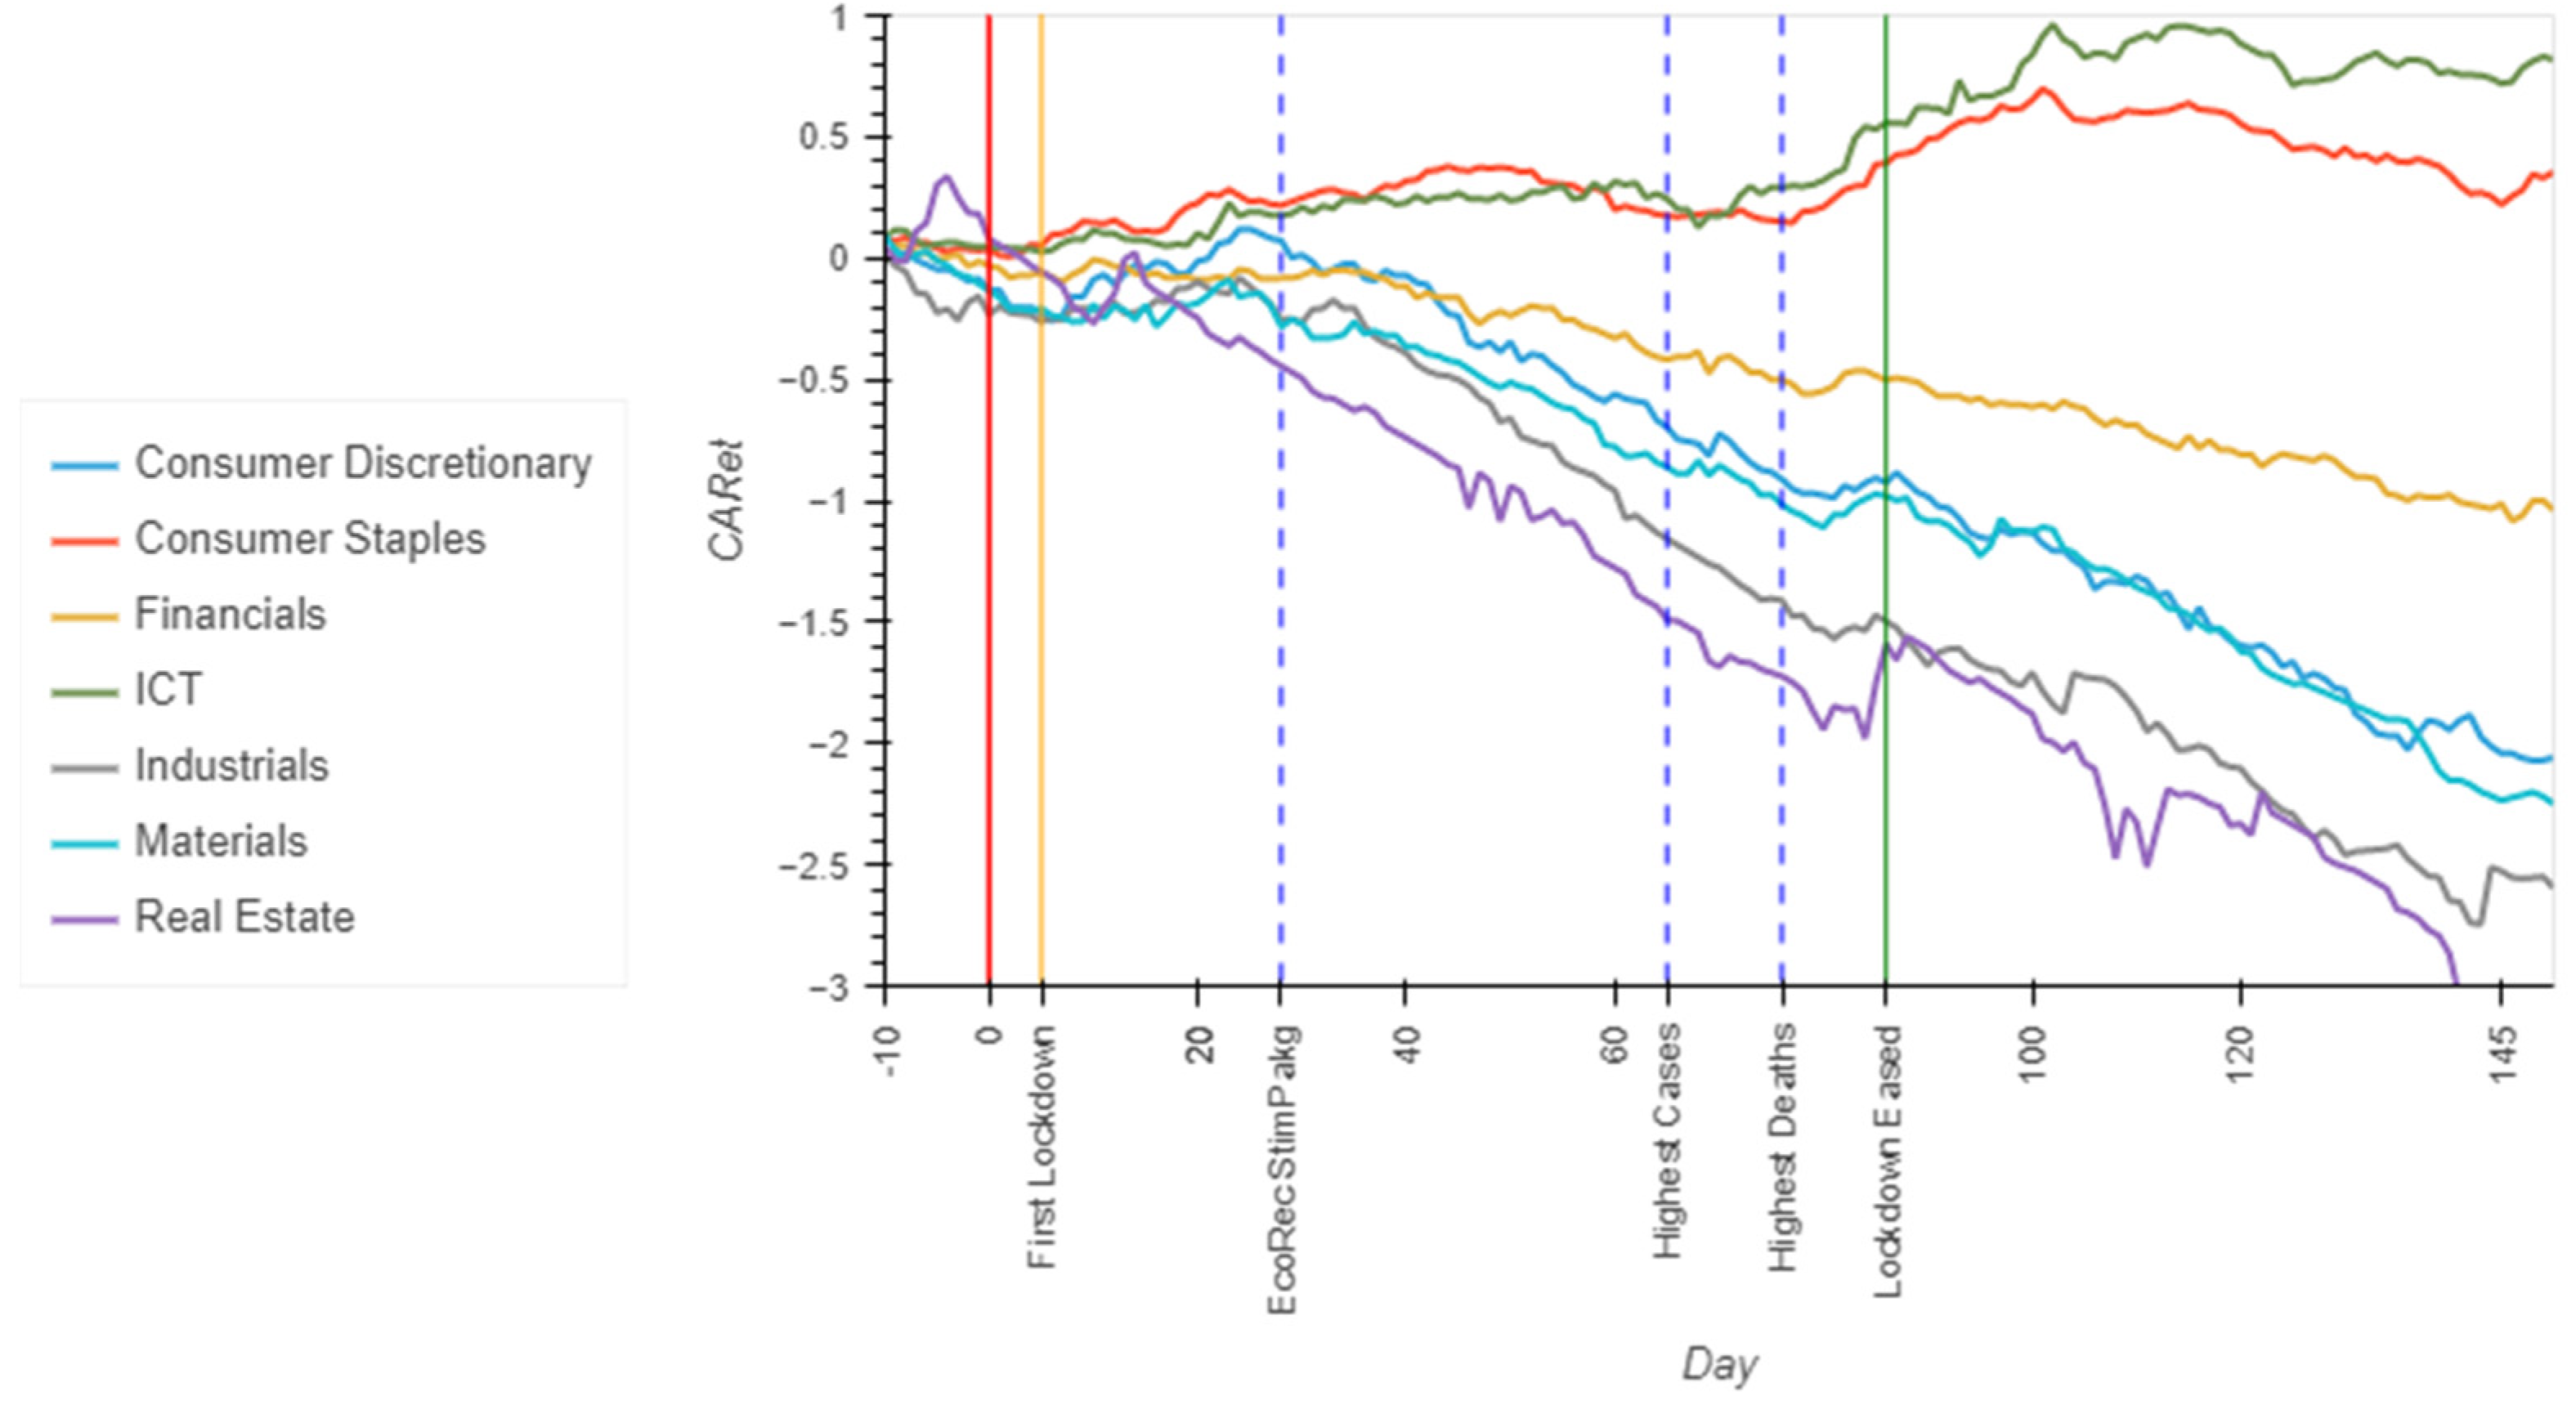
The cumulative abnormal return (CAR) plots for sectors on the Zimbabwean Stock Exchange are shown in Figure 3 below. Almost all sectors, with the exception of financials and consumer staples, experienced negative abnormal returns during the pandemic. Although financial and consumer staples had positive ARs, from Table 2, we see that significant CARs were only recorded after 90 days when lockdown measures were relaxed. Real estate and industrials were the most affected sectors, with significant negative CARs 60 days after the pandemic’s occurrence, when the country recorded the highest COVID-19 cases and deaths for the year 2020. Additionally, although the consumer discretionary, materials, and financial sectors had some negative ARs, their performance was statistically no different from the pre-COVID-19 period. Furthermore, we can see that the implementation of the economic recovery stimulus package had no significant impact on the performance of the ZSE sectors. Most sectors initially appeared to be less sensitive to the occurrence of the pandemic but reacted after the lockdown measures were imposed.
4.1.3. Nigerian Stock Exchange
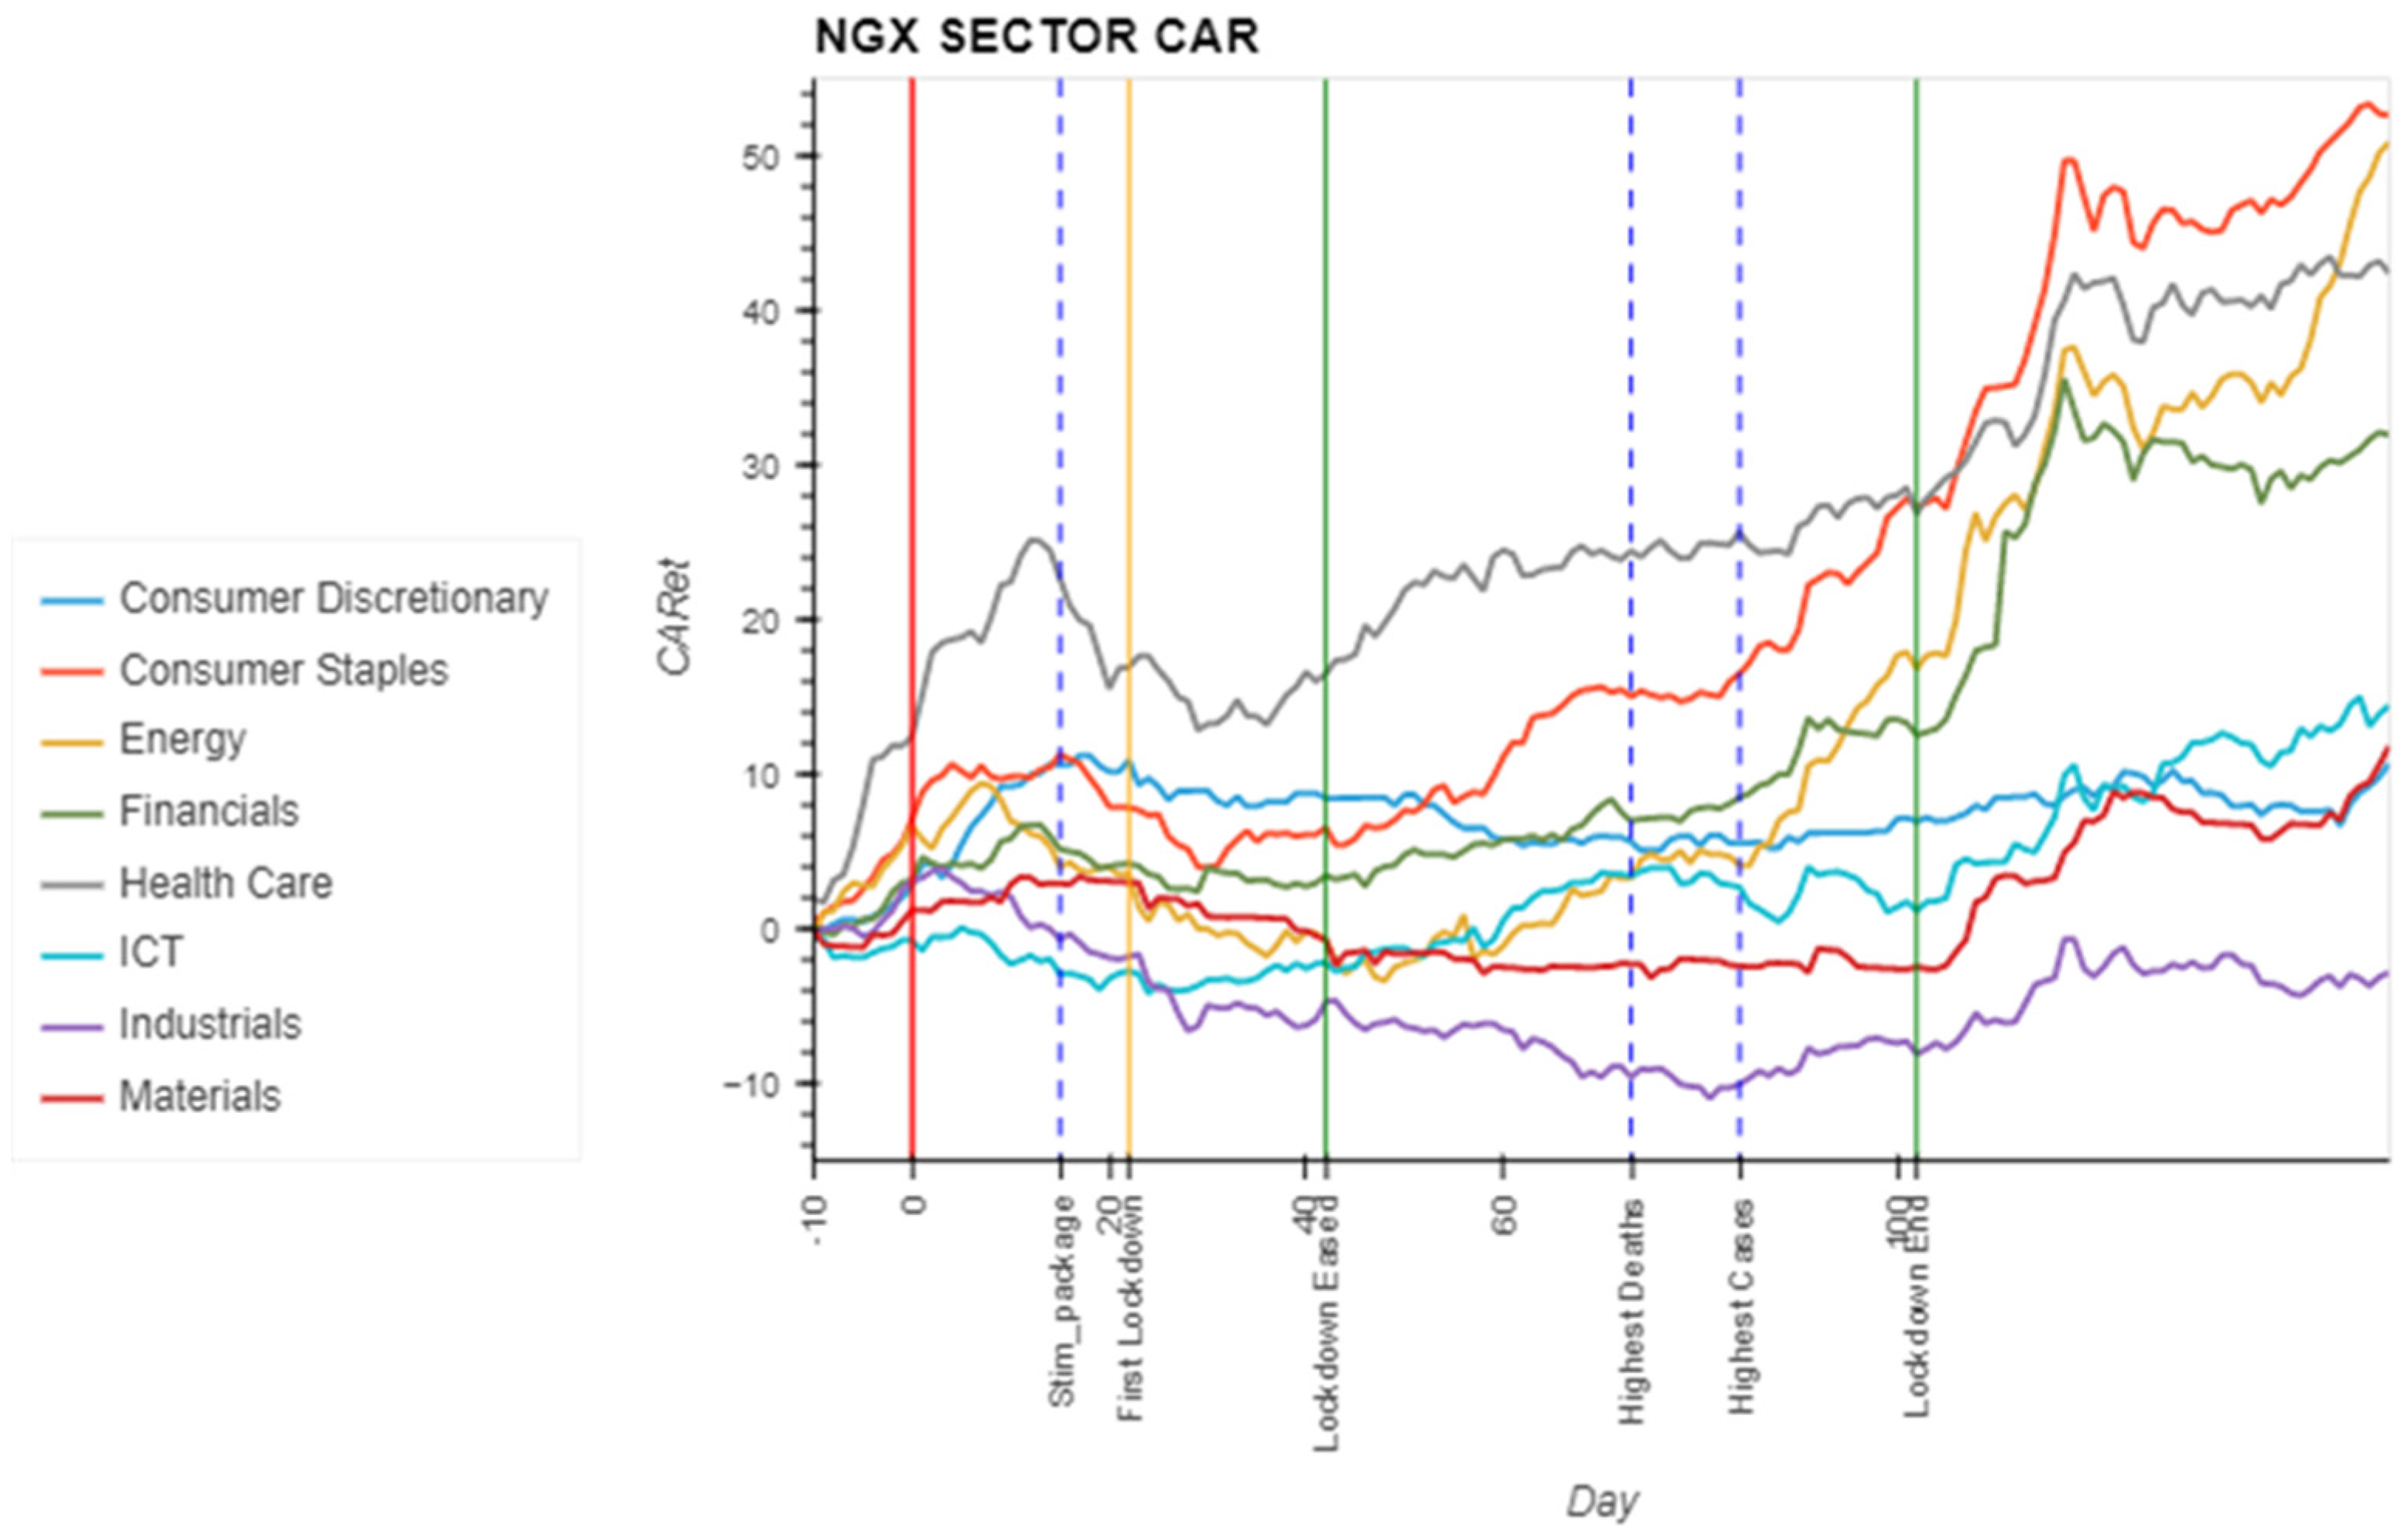
Figure 4 depicts the results of the CAR for the Nigerian Stock Exchange. Except for the industrial sector, most sectors maintained positive abnormal returns at the start of the pandemic; however, in the 10–30 days following the pandemic, almost all sectors recorded negative abnormal returns as the country announced the implementation of some lockdown measures. Consumer staples, health care, financials, and the energy sector, on the other hand, recorded positive ARs after the lockdown measures were eased. When the lockdown measures were relaxed after about 100 trading days, the performance of these four sectors improved even more. The only sector that had an accumulation of positive ARs even during the time the lockdown measures were implemented was ICT, which could be attributed to an increase in demand for ICT products as people began working from home. Despite this, we can see from Table 2 that healthcare, consumer discretionary, consumer staples, and energy all had significant positive CARs from the start of the pandemic, implying that these sectors outperformed even during the pandemic. The results for the other sectors do not differ significantly from the pre-lockdown period. Furthermore, the introduction of the economic recovery stimulus package appears to have had little impact on the Nigerian Stock Exchange sectors.
4.1.4. Lusaka Stock Exchange
According to the cumulative plots in Figure 5 below, only the ICT sector outperformed during the pandemic period. The material sector appears to have underperformed from the start of the pandemic, as evidenced by a significant negative CAR from day one of the COVID-19 event. Consumer staples recorded a significant negative CAR 13 days after the lockdown was initiated, followed by utilities, which suffered a heavy decline 33 days later, and then the industrials sector, which recorded significant negative returns 60 days after the pandemic, when the country experienced a surge in COVID-19 cases and deaths. The consumer discretionary, energy, and financial sectors appear to be unaffected by the pandemic’s occurrence.
4.2. Panel Data Regression Results
4.2.1. Johannesburg Stock Exchange
The panel regression results in Table 3 below show that the imposition of lockdowns had a negative impact on stock performance at the JSE, as evidenced by a significant negative lockdown dummy variable. Thus, stocks appear to have fared better when lockdown measures were removed. Positive coefficient for COVID-19 cumulative cases and deaths indicate that increases in COVID-19 cases and deaths had no negative impact on stock performance. The volume coefficient is not significant at the 5% level, implying that a decline in stock returns is not associated with an increase in market sell-off.
In addition to the above, in Table 4 we present regression results to assess the impact of COVID-19 cases and deaths, lockdown measures, and trade volume on individual sector performance. With the exception of the materials sector, the COVID-19 cases and deaths variables have positive and significant coefficients. This backs up previous findings (Del Lo et al. 2022; Takyi and Bentum-Ennin 2021) that higher COVID-19 cases and deaths had no significant negative effects on stock performance in South African markets. We find a negative significant relationship between COVID-19 cases and sector abnormal returns in the materials sector. This could imply that increases in COVID-19 cases harmed the performance of materials-related stocks. The lockdown variable is negative and significant for all sectors except real estate, indicating that the imposition of lockdowns had a negative impact on stock performance. The insignificant coefficient for real estate may indicate that the imposition of the lockdown had no effect on the sector’s performance. The financial sector has a significant negative coefficient for trade volume, implying that periods of poor performance in this sector are associated with huge selloffs of shares in the financial services sector.
4.2.2. Zimbabwe Stock Exchange
The panel regression results for the Zimbabwe Stock Exchange show that the COVID-19 cases, lockdown, and trading volume have no significant relationship with the Abnormal returns of stocks at the Zimbabwean Stock exchange. The death coefficient shows a negative relationship, but it is only significant at the 10% level.
However, a closer analysis in Table 5 reveals that COVID-19 deaths had a significant negative relationship with the industrial and real estate sectors, while COVID-19 cases had a significant negative relationship with all sectors except the ICT and consumer staples sectors, which had a significant positive relationship. This indicates that most sectors negatively reacted to announcements of COVID-19 cases more than to fatalities. The Lockdown dummy variable is negative and significant for the ICT and consumer staples sectors, which may indicate that stocks in these sectors underperformed during the lockdown period, whereas a positive and significant variable for all other sectors can be interpreted as an improvement in the performance of stocks in those sectors during the lockdown.
4.2.3. Nigerian Stock Exchange
For the Nigerian Stock Exchange (NGX), the results of the panel data regression in Table 6 show a significant negative relationship between cumulative death cases and CARs, indicating that an increase in COVID-19 cases is associated with a decrease in stock ARs. On the other hand, we discover a positive and statistically significant link between COVID-19 cases and CARs. The lockdown dummy variable is negative and significant, indicating that stock performance declined during the lockdown period.
Analysis of each sector as shown in Table 4 reveal that COVID-19 deaths had a significant negative impact on all NGX sectors except ICT. However, the coefficient for COVID-19 cases is positive and statistically significant, which may indicate that the sectors continued to outperform despite increases in COVID-19 cases. This affirms the results of the cumulative plot in Figure 4. A significant negative coefficient for the lockdown dummy variable for all sectors confirms the results in Table 6 above that stock performance declined during the lockdown period. Except for the energy sector, the volume coefficient is insignificant. A positive and significant coefficient for the energy sector indicates that an increase in abnormal returns for the sector is associated with an increase in trading volumes.
4.2.4. Lusaka Stock Exchange
Panel data regression results for the Lusaka Stock Exchange (Table 7 below) show that there is no significant relationship between CARs and COVID-19 deaths and cases. Furthermore, the Lockdown dummy variable and trade volumes are negligible.
Sector analysis, on the other hand, reveals a negative and significant relationship between COVID-19 deaths and CARs for utilities, industrials, financials, and consumer staples, while the coefficient for consumer discretionary, ICT, and materials is positive and significant. There is a positive and significant relationship with CARs for consumer discretionary and consumer staples and a negative and significant relationship with CARs for ICT, industrials, and utilities for the COVID-19 cases. Thus, COVID-19 deaths seem to have had a negative influence on the performance of the utilities, industrials, financials, and consumer staples at the LSE stock market, while COVID-19 cases seem to have negatively affected the performance of the industrials and utilities sectors only. We also discover that only the consumer discretionary sector has a significant negative relationship between trade volumes and CAR, implying that the decline in stock returns is associated with a massive sell-off in this sector (Table 4).
5. Discussion
The findings show that most stocks in the South African and Nigerian markets experienced significant positive abnormal returns during the COVID-19 period. However, the results from the Zimbabwean and Zambian markets were mixed, with some sectors recording positive abnormal returns while others recorded negative abnormal returns. Furthermore, it was discovered that sectors in IT, consumer staples, and healthcare outperformed during the pandemic period, while real estate, materials, and industrials underperformed, with the exception of the South African market. Financial and consumer discretionary sectors have emerged as the most resilient in sub-Saharan stock markets, with consistent performance even during the pandemic. The findings above are consistent with those of Harjoto and Rossi (2021), who discovered that in emerging stock markets, the healthcare and telecommunications sectors were positively impacted by the COVID-19 pandemic, but their findings on the worst-performing sectors differ in that the energy and financial sectors were found to be the worst performers.
Working from home and the implementation of quarantine measures may have exacerbated demand for ICT equipment, pushing the performance of ICT stocks higher. Furthermore, as the pandemic spreads and demand for medical equipment and drugs rises, so do returns on healthcare stocks. As most sub-Saharan countries have low incomes and a high proportion of employment in the informal sector, the implementation of lockdown measures would result in consumers shifting their purchases to staples and purchasing fewer non-staples. Companies in the industrial and materials sectors were also particularly hard hit by the lockdown measures, which forced most of them to close for several months. Because people were working from home, the demand for office space was low, which could explain the real estate sector’s poor performance. The findings are consistent with those of Alam et al. (2021), who found that the pandemic had a positive impact on the food, healthcare, and information and communication technology sectors while having a negative impact on the real estate, transportation, and energy sectors.
The study also revealed that news regarding increases in COVID-19 cases had a negative effect on most sectors for smaller stock markets, such as the Zimbabwe Stock Exchange (ZSE) and the Lusaka Stock Exchange (LSE), but not on larger capital markets that include the Johannesburg Stock Exchange (JSE) and the Nigerian Stock Exchange (NGX). On the other hand, the increase in COVID-19 deaths negatively affected all the NGX sectors, including the industrial and real estate sectors in Zimbabwe and the utilities, industrial, and financial sectors in Zambia. The increase in COVID-19 deaths had no effect on the JSE sectors. This could be because stocks reacted positively to the country’s economic stimulus package, which was implemented during a surge in COVID-19 cases and deaths. The above findings are consistent with those of Del Lo et al. (2022), who discovered that increases in COVID-19 cases had a significant impact on the stability of African stock markets whereas increases in death rates had an insignificant effect. Their analysis, however, was based on the aggregate stock market level rather than sector-level analysis. Furthermore (Harjoto et al. 2021) reveal that the COVID-19 COVIS-19 deaths and cases negatively affected stock markets in emerging than in developed economies.
Most importantly, we observe that the imposition of lockdowns had an adverse effect on the performance of all sectors among the four stock markets, with the exception of the real estate sector. The majority of these sectors only recorded positive ARs after the lockdown measures were relaxed. This contradicts the findings of Narayan et al. (2021), who discovered that lockdown measures had a positive effect on G7 stock market returns. On the other side, Narayan et al. (2021) had mixed results, while most stock markets were negatively affected by government policies such as lockdown and stimulus packages, some stock markets, particularly the most developed, responded positively. As a result, we can see that imposing lockdown measures has no beneficial impact on most stock markets in developing economies.
Moreover, the study’s findings show that the implementation of stimulus packages was ineffective in improving stock performance in all sub-Saharan African stock markets except the Johannesburg Stock Exchange, where it had a positive impact. According to Phan and Narayan (2020), economic recovery stimulus packages were more effective in countries where they were implemented after the lockdown was initiated. In Nigeria, for example, this package was introduced prior to the lockdown, and no sector responded positively to this event. Furthermore, Ashraf (2020) states that economic stimulus packages had no significant impact on stock market performance when they were given to households, but only when they were initiated to support firms’ businesses. According to Mikhaylov et al. (2023), companies in low-capitalization stock markets find it difficult to access credit facilities due to low innovation and poor credit risk management, which could explain why stimulus packages did not have a significant impact in smaller stock markets as credit support was limited.
The study also found no discernible pattern in trading volume and ARs, with the exception of the financial sector in the JSE and ZSE and the consumer discretionary sector in the ZSE and LSE. This is supported by Harjoto et al. (2021), who found that the occurrence of the COVID-19 pandemic had less of an impact on trading volumes in emerging markets than it did in developed markets. The insignificant influence of trading volumes on stock performance can be attributed to the low liquidity of stock markets in emerging markets, as postulated by Mikhaylov et al. (2023). If there is a low level of participation in the stock market, then the occurrence of extreme negative events will not trigger a strong reaction in the form of massive selloffs or stock purchases in cases of positive news.
6. Conclusions
This paper used an event study to investigate the effects of COVID-19 events and government policies on stock performance in sub-Saharan African stock markets. Most previous studies in the region focused on the impact of COVID-19 deaths and cases on aggregate stock market performance, ignoring sector-level performance and the influence of government policies on stock performance. According to the study’s findings, stocks in ICT, consumer staples, and health care outperformed during the pandemic period, while materials, real estate, and industrials underperformed. Furthermore, the study identifies financials and consumer discretionary as the most robust sectors. Increases in COVID-19 deaths and cases had no significant impact on large capital markets where economic stimulus support had a positive impact on sector performance; however, smaller capital markets with low government economic support were negatively affected. It was discovered that the implementation of lockdown measures had a significant negative impact on the performance of almost all sectors in the region. The study also reveals that, with the exception of the South African stock market, the introduction of stimulus packages had no positive effect on sector performance. The implications from the findings are that the performance of stocks during extreme events is not related to the event itself but to the government’s actions to contain the event.
The findings will be of benefit to equity investors and traders in identifying securities that offer better returns during times of crisis. Investors seeking more stable income can consider investing in the financial and consumer discretionary sectors, which have maintained more stable performance even during times of crisis. Diversification across sectors in various stock markets is also possible, as sector performance varied during the pandemic. We recommend that the government take the necessary steps to contain the negative consequences that threaten the survival of firms during pandemics and other periods of extreme market events rather than simply attempting to prevent the spread of such events. We recommend further research into the possibility of constructing a well-diversified portfolio using stocks and other securities that will be less volatile even during times of pandemics.
Author Contributions
Conceptualization, M.N. and F.R.M.; methodology, M.N.; software, M.N.; validation, M.S. and F.R.M.; formal analysis, M.N.; investigation, M.N., M.S. and F.R.M.; resources, M.S.; data curation, M.N.; writing—original draft preparation, M.N.; writing—review and editing, F.R.M. and M.N.; visualization, M.N.; supervision, M.S. and F.R.M.; project administration, F.R.M. and M.S.; funding acquisition, M.S. All authors have read and agreed to the published version of the manuscript.
Funding
This research received no external funding.
Informed Consent Statement
Not applicable.
Data Availability Statement
Data can be availed upon request. Email to; [email protected].
Conflicts of Interest
The funding sponsors had no role in the design of the study; in the collection, analyses, or interpretation of data; in the writing of the manuscript, and in the decision to publish the results.
References
- Alam, Md Mahmudul, Haitian Wei, and Abu NM Wahid. 2021. COVID-19 outbreak and sectoral performance of the Australian stock market: An event study analysis. Australian Economic Papers 60: 482–95. [Google Scholar] [CrossRef]
- Amini, Shahram, Michael S. Delgado, Daniel J. Henderson, and Christopher F. Parmeter. 2012. Fixed vs random: The Hausman test four decades later. In Essays in Honor of Jerry Hausman. Bradford: Emerald Group Publishing Limited, pp. 479–513. [Google Scholar]
- Ashraf, Badar Nadeem. 2020. Economic impact of government interventions during the COVID-19 pandemic: International evidence from financial markets. Journal of Behavioral and Experimental Finance 27: 100371. [Google Scholar] [CrossRef]
- Awan, Tahir Mumtaz, Muhammad Shoaib Khan, Inzamam Ul Haq, and Sarwat Kazmi. 2021. Oil and stock markets volatility during pandemic times: A review of G7 countries. Green Financ 3: 15–27. [Google Scholar] [CrossRef]
- Baker, Scott R., Nicholas Bloom, Steven J. Davis, Kyle J. Kost, Marco C. Sammon, and Tasaneeya Viratyosin. 2020. The Unprecedented Stock Market Impact of COVID-19. Cambridge, MA: National Bureau of Economic Research. [Google Scholar]
- Bayero, Saifullahi Adam, Babangida Danladi Safiyanu, and Zaitun Sanusi Bakabe. 2021. Impact of Covid-19 on Stock Market in Sub-Saharan Africa. International Journal of Entrepreneurship and Sustainability Studies 1: 42–61. [Google Scholar] [CrossRef]
- Bekaert, Geert, Michael Ehrmann, Marcel Fratzscher, and Arnaud Mehl. 2014. The global crisis and equity market contagion. The Journal of Finance 69: 2597–649. [Google Scholar] [CrossRef] [Green Version]
- Bekiros, Stelios, Sabri Boubaker, Duc Khuong Nguyen, and Gazi Salah Uddin. 2017. Black swan events and safe havens: The role of gold in globally integrated emerging markets. Journal of International Money and Finance 73: 317–34. [Google Scholar] [CrossRef] [Green Version]
- Chaudhary, Rashmi, Priti Bakhshi, and Hemendra Gupta. 2020. Volatility in international stock markets: An empirical study during COVID-19. Journal of Risk and Financial Management 13: 208. [Google Scholar] [CrossRef]
- Chen, Mei-Ping, Chien-Chiang Lee, Yu-Hui Lin, and Wen-Yi Chen. 2018. Did the SARS epidemic weaken the integration of Asian stock markets? Evidence from smooth time-varying cointegration analysis. Economic research-Ekonomska istraživanja 31: 908–26. [Google Scholar] [CrossRef] [Green Version]
- Chen, Ming-Hsiang, SooCheong Shawn Jang, and Woo Gon Kim. 2007. The impact of the SARS outbreak on Taiwanese hotel stock performance: An event-study approach. International Journal of Hospitality Management 26: 200–12. [Google Scholar] [CrossRef] [PubMed]
- Choe, Yunseon, Junhui Wang, and HakJun Song. 2021. The impact of the Middle East Respiratory Syndrome coronavirus on inbound tourism in South Korea toward sustainable tourism. Journal of Sustainable Tourism 29: 1117–33. [Google Scholar] [CrossRef]
- Dang Ngoc, Hung, Van Vu Thi Thuy, and Chi Le Van. 2021. Covid 19 pandemic and Abnormal Stock Returns of listed companies in Vietnam. Cogent Business & Management 8: 1941587. [Google Scholar]
- David, Sergio A., Cláudio MC Inácio Jr, and José A. Tenreiro Machado. 2021. The recovery of global stock markets indices after impacts due to pandemics. Research in International Business and Finance 55: 101335. [Google Scholar] [CrossRef]
- Del Lo, Gaye, Théophile Basséne, and Babacar Séne. 2022. COVID-19 And the african financial markets: Less infection, less economic impact? Finance Research Letters 45: 102148. [Google Scholar] [CrossRef] [PubMed]
- Elhini, Maha, and Rasha Hammam. 2021. The impact of COVID-19 on the standard & poor 500 index sectors: A multivariate generalized autoregressive conditional heteroscedasticity model. In Journal of Chinese Economic and Foreign Trade Studies. Bradford: Emerald Publishing Limited. [Google Scholar]
- Funck, Mary, and Jose A. Gutierrez. 2018. Has Ebola infected the market: A contagious reaction to a (media) health care crisis? Journal of Business Strategies. Available online: https://ssrn.com/abstract=2786001 (accessed on 26 August 2022).
- Haiykir, Cetenak, and Özlem Öztürk Çetenak. 2022. Monetary policy application and stock market reaction during Covid-19 Pandemic: Evidence from Turkey. Ömer Halisdemir Üniversitesi İktisadi ve İdari Bilimler Fakültesi Dergisi 15: 149–64. [Google Scholar] [CrossRef]
- Harjoto, Maretno Agus, and Fabrizio Rossi. 2021. Market reaction to the COVID-19 pandemic: Evidence from emerging markets. International Journal of Emerging Markets. ahead-of-print. [Google Scholar] [CrossRef]
- Harjoto, Maretno Agus, Fabrizio Rossi, Robert Lee, and Bruno S. Sergi. 2021. How do equity markets react to COVID-19? Evidence from emerging and developed countries. Journal of Economics and Business 115: 105966. [Google Scholar] [CrossRef]
- Ichev, Riste, and Matej Marinč. 2018. Stock prices and geographic proximity of information: Evidence from the Ebola outbreak. International Review of Financial Analysis 56: 153–66. [Google Scholar] [CrossRef]
- Izzeldin, Marwan, Yaz Gülnur Muradoğlu, Vasileios Pappas, and Sheeja Sivaprasad. 2021. The impact of COVID-19 on G7 stock markets volatility: Evidence from a ST-HAR model. International Review of Financial Analysis 74: 101671. [Google Scholar] [CrossRef]
- Joo, Heesoo, Brian A. Maskery, Andre D. Berro, Lisa D. Rotz, Yeon-Kyeng Lee, and Clive M. Brown. 2019. Economic impact of the 2015 MERS outbreak on the Republic of Korea’s tourism-related industries. Health Security 17: 100–8. [Google Scholar] [CrossRef]
- Kharbanda, Varuna, and Rachna Jain. 2021. Impact of COVID on the stock market: A study of BRIC countries. International Journal of Financial Markets and Derivatives 8: 169–84. [Google Scholar] [CrossRef]
- Krivin, Dmitry, Robert Patton, Erica Rose, and David Tabak. 2003. Determination of the appropriate event window length in individual stock event studies. Available online: https://ssrn.com/abstract=466161 (accessed on 7 November 2022).
- Kumeka, Terver, Patricia Ajayi, and Oluwatosin Adeniyi. 2021. Is stock market in Sub-Saharan Africa resilient to health shocks? Journal of Financial Economic Policy 14: 562–98. [Google Scholar] [CrossRef]
- Kuruppu, Gayithri Niluka, and Anura De Zoysa. 2020. COVID-19 and panic buying: An examination of the impact of behavioural biases. Available online: https://ssrn.com/abstract=3596101 (accessed on 11 November 2022).
- Ledwani, Sanket, Suman Chakraborty, and Sandeep S. Shenoy. 2021. Spatial tale of G-7 and Brics stock markets during COVID-19: An event study. Investment Management and Financial Innovations 18: 20–36. [Google Scholar] [CrossRef] [PubMed]
- Lybeck, Eric. 2017. An Analysis of Nassim Nicholas Tableb’s The Black Swan:: The Impact of the Highly Improbable: Macat Library. Available online: https://www.taylorfrancis.com/books/mono/10.4324/9781912281206 (accessed on 11 October 2022).
- Mazur, Mieszko, Man Dang, and Miguel Vega. 2021. COVID-19 and the march 2020 stock market crash. Evidence from S&P1500. Finance research letters 38: 101690. [Google Scholar]
- Mikhaylov, Alexey, Hasan Dinçer, and Serhat Yüksel. 2023. Analysis of financial development and open innovation oriented fintech potential for emerging economies using an integrated decision-making approach of MF-X-DMA and golden cut bipolar q-ROFSs. Financial Innovation 9: 1–34. [Google Scholar] [CrossRef]
- Nafday, Avinash M. 2009. Strategies for managing the consequences of black swan events. Leadership and Management in Engineering 9: 191–97. [Google Scholar] [CrossRef]
- Narayan, Paresh Kumar, Dinh Hoang Bach Phan, and Guangqiang Liu. 2021. COVID-19 lockdowns, stimulus packages, travel bans, and stock returns. Finance Research Letters 38: 101732. [Google Scholar] [CrossRef]
- Nippani, Srinivas, and Kenneth M. Washer. 2004. SARS: A non-event for affected countries’ stock markets? Applied Financial Economics 14: 1105–10. [Google Scholar] [CrossRef]
- Olczyk, Magdalena, and Marta Ewa Kuc-Czarnecka. 2021. Determinants of COVID-19 impact on the private sector: A multi-country analysis based on survey data. Energies 14: 4155. [Google Scholar] [CrossRef]
- Phan, Dinh Hoang Bach, and Paresh Kumar Narayan. 2020. Country responses and the reaction of the stock market to COVID-19—A preliminary exposition. Emerging Markets Finance and Trade 56: 2138–50. [Google Scholar] [CrossRef]
- Ranjeeni, Kumari. 2014. Sectoral and industrial performance during a stock market crisis. Economic Systems 38: 178–93. [Google Scholar] [CrossRef]
- Sachdeva, Kanika, and P. Sivakumar. 2020. COVID-19 and Stock Market Behavior–An Event Study of BRIC Countries. Turkish Journal of Computer and Mathematics Education (TURCOMAT) 11: 741–54. [Google Scholar]
- Seetharam, Ishuwar. 2017. Environmental Disasters and Stock Market Performance. Stanford University Working paper. Stanford: Stanford University. [Google Scholar]
- Shaikh, Imlak. 2021. Impact of COVID-19 pandemic disease outbreak on the global equity markets. Economic Research-Ekonomska Istraživanja 34: 2317–36. [Google Scholar] [CrossRef]
- Shehzad, Khurram, Umer Zaman, Xiaoxing Liu, Jarosław Górecki, and Carlo Pugnetti. 2021. Examining the asymmetric impact of COVID-19 pandemic and global financial crisis on Dow Jones and oil price shock. Sustainability 13: 4688. [Google Scholar] [CrossRef]
- Singh, Gurmeet, and Muneer Shaik. 2021. The Short-Term Impact of COVID-19 on Global Stock Market Indices. Contemporary Economics 15: 1–19. [Google Scholar] [CrossRef]
- Takyi, Paul Owusu, and Isaac Bentum-Ennin. 2021. The impact of COVID-19 on stock market performance in Africa: A Bayesian structural time series approach. Journal of Economics and Business 115: 105968. [Google Scholar] [CrossRef]
- Taleb, Nassim Nicholas. 2007. The Black Swan: The Impact of the Highly Improbable. New York: Random House, vol. 2, Available online: https://innovation.cc/book-reviews/2008_13_3_14_gow_bk-rev_taleb_black-swan (accessed on 1 October 2022).
- Tastsidis Olsson, Aleksis, and Pontus Löfberg. 2014. Black Swan Investing: An empirical study in context of efficient markets. Available online: https://lup.lub.lu.se/student-papers/search/publication/46 (accessed on 11 October 2022).
- Teitler-Regev, Sharon, and Tchai Tavor. 2019. The impact of disasters and terrorism on the stock market. Jàmbá: Journal of Disaster Risk Studies 11: 1–8. [Google Scholar]
- Tetteh, Joseph Emmanuel, Anthony Amoah, Kenneth Ofori-Boateng, and George Hughes. 2022. Stock market response to COVID-19 pandemic: A comparative evidence from two emerging markets. Scientific African 17: e01300. [Google Scholar] [CrossRef]
- Topcu, Mert, and Omer Serkan Gulal. 2020. The impact of COVID-19 on emerging stock markets. Finance Research Letters 36: 101691. [Google Scholar] [CrossRef]
- Uddin, Moshfique, Anup Chowdhury, Keith Anderson, and Kausik Chaudhuri. 2021. The effect of COVID–19 pandemic on global stock market volatility: Can economic strength help to manage the uncertainty? Journal of Business Research 128: 31–44. [Google Scholar] [CrossRef]
- Woon, Wong Shou. 2004. Introduction to the event study methodology. Singapore Management University 4: 1–12. [Google Scholar]
- World Bank. 2020. Global economic prospects, June 2020. The World Bank. Available online: https://elibrary.worldbank.org/doi/abs/10.1596/978-1-4648-1553-9 (accessed on 27 December 2022).
- Xu, Libo. 2021. Stock Return and the COVID-19 pandemic: Evidence from Canada and the US. Finance Research Letters 38: 101872. [Google Scholar] [CrossRef] [PubMed]
- Yarovaya, Larisa, Roman Matkovskyy, and Akanksha Jalan. 2021. The effects of a black swan event (COVID-19) on herding behavior in cryptocurrency markets. Journal of International Financial Markets, Institutions and Money 75: 101321. [Google Scholar] [CrossRef]
- Yousfi, Mohamed, Younes Ben Zaied, Nidhaleddine Ben Cheikh, Béchir Ben Lahouel, and Houssem Bouzgarrou. 2021. Effects of the COVID-19 pandemic on the US stock market and uncertainty: A comparative assessment between the first and second waves. Technological Forecasting and Social Change 167: 120710. [Google Scholar] [CrossRef] [PubMed]
- Zhao, Linhai, Ehsan Rasoulinezhad, Tapan Sarker, and Farhad Taghizadeh-Hesary. 2022. Effects of COVID-19 on global financial markets: Evidence from qualitative research for developed and developing economies. The European Journal of Development Research 35: 1–19. [Google Scholar] [CrossRef] [PubMed]
Figure 1.
Cumulative growth of sub-Saharan African stock markets during the pandemic. Source: Author.
Figure 1.
Cumulative growth of sub-Saharan African stock markets during the pandemic. Source: Author.

Figure 2.
Johannesburg Stock Exchange (JSE) cumulative abnormal returns.

Figure 3.
Zimbabwe Stock Exchange (ZSE) cumulative abnormal returns. Source: Author.

Figure 4.
Nigeria Stock Exchange (NGX) cumulative abnormal returns. Source: Author.

Figure 5.
Lusaka Stock Exchange (LSE) cumulative abnormal returns. Source: Author.


Table 1.
Variables.
| Variable | Description | Source |
|---|---|---|
| Stock Returns | This variable is used as a perfomance measure. The variable is calculated daily from the stock prices as the log of current stock price divided by previous day stock price. The returns for the stocks are then averaged per sector to obtain sector returns. The data is gathered per share for each stock market sampled. | Investing.com website. accesed on 23 September 2022 |
| Volumes of Trade | This variable measures the daily volumes of trade per stock. The data is gathered per share for each stock market sampled. For sector analysis, the daily change in volumes traded are averaged for all shares in each sector. | Investing.com website. accesed on 27 September 2022 |
| COVID-19 deaths | This variable measures the daily deaths from the COVID-19 pandemic. It is gathered per country. | World Health Organisation (WHO) website. accesed on 24 September 2022 |
| COVID-19 Cases | This variable measures the daily reported COVID-19 infections. It is gathered per country. | World Health Organisation (WHO) website. accesed on 24 September 2022 |
Table 2.
Days with significant cumulative abnormal returns.
| Sector | ZSE | LSE | ||
| Significant −ve AR | Significant +ve AR | Significant −ve AR | Significant +ve AR | |
| Consumer Discretionary | Day 115–150 | -- | -- | |
| Consume Staples | Day 93–115 | Day 13–100 | ||
| Financials | -- | 96–100 | ||
| ICT | 93–118 | 69–100 | ||
| Industrial | Day 61–150 | 60–100 | ||
| Materials | Day 111–150 | Day 1–10 | ||
| Real Estate | Day 69–150 | |||
| Utilities | Day 33–100 | |||
| Sector | JSE | NGX | ||
| Significant −ve AR | Significant +ve AR | Significant −ve AR | Significant +ve AR | |
| Consumer Discretionary | -- | Day 1–51 | ||
| Consume Staples | Day 110–150 | Day 0–19, 66–150 | ||
| Energy | -- | -- | Day 5–150 | |
| Financials | Day 113–150 | Day 108–150 | ||
| Health Care | Day 6–16, 63–150 | Day 0–150 | ||
| ICT | 0–13 | --- | -- | |
| Industrial | 95–150 | -- | --- | |
| Materials | -- | -- | --- | |
| Real Estate | -- | -- | -- | |
Table 3.
JSE panel regression results.
| RandomEffects Estimation Summary | ||||||
|---|---|---|---|---|---|---|
| Dep. Variable: | CARet | R-squared: | 0.7864 | |||
| Estimator: | RandomEffects | R-squared (Between): | −0.0187 | |||
| No. Observations: | 1359 | R-squared (Within): | 0.7870 | |||
| Date: | Mon, Dec 19 2022 | R-squared (Overall): | 0.4859 | |||
| Time: | 10:23:46 | Log-likelihood | −3992.7 | |||
| Cov. Estimator: | Clustered | |||||
| F-statistic: | 1246.5 | |||||
| Entities: | 9 | p-value | 0.0000 | |||
| Avg Obs: | 151.00 | Distribution: | F(4,1354) | |||
| Min Obs: | 151.00 | |||||
| Max Obs: | 151.00 | F-statistic (robust): | 29.649 | |||
| p-value | 0.0000 | |||||
| Time periods: | 151 | Distribution: | F(4,1354) | |||
| Avg Obs: | 9.0000 | |||||
| Mix Obs: | 9.0000 | |||||
| Max Obs: | 9.0000 | |||||
| Parameter Estimates | ||||||
| Parameter | Coeff | Std. Err. | T-stat | p-value | Lower CI | Upper CI |
| const | 1.5650 | 1.4833 | 1.0551 | 0.2916 | −1.3447 | 4.4748 |
| log_cumCases | 0.8630 | 0.2756 | 3.1314 | 0.0018 | 0.3224 | 1.4036 |
| log_cumDeaths | 1.6205 | 0.2517 | 6.4380 | 0.0000 | 1.1267 | 2.1142 |
| LockDm | −6.5662 | 1.1455 | −5.7324 | 0.0000 | −8.8132 | −4.3191 |
| scVolume | −0.2433 | 0.1291 | −1.8837 | 0.0598 | −0.4966 | 0.0101 |
Table 4.
Sector regression results.
| Sector | Variables | JSE | NGX | ZSE | LSE | ||||
|---|---|---|---|---|---|---|---|---|---|
| Coeff | p-Value | Coeff | p-Value | Coeff | p-Value | Coeff | p-Value | ||
| Consumer Discretionary | const Cases Deaths LocDm Volm | −0.337 1.308 1.071 −10.077 −0.747 | 0.798 0.000 0.000 0.000 0.189 | 14.398 4.852 −6.168 −3.963 0.165 | 0.000 0.000 0.000 0.000 0.371 | −0.132 −0.157 −0.000 0.596 1.196 | 0.127 0.000 0.991 0.000 0.017 | 0.189 0.181 0.539 0.149 −1261.2 | 0.024 0.000 0.000 0.014 0.001 |
| Consumer Staples | const Cases Deaths LocDm Volm | 1.931 0.509 1.927 −5.607 0.304 | 0.206 0.107 0.000 0.000 0.502 | 6.586 6.436 −4.095 −29.484 0.105 | 0.000 0.000 0.000 0.000 0.730 | 0.214 0.052 −0.037 −0.160 −0.787 | 0.000 0.000 0.054 0.000 0.547 | −7.674 1.024 −6.349 −2.882 1.854 | 0.000 0.012 0.000 0.001 0.232 |
| Energy | const Cases Deaths LocDm Volm | −5.689 0.930 1.744 −2.206 −0.290 | 0.022 0.031 0.000 0.003 0.306 | 1.762 5.584 −5.221 −26.699 0.573 | 0.285 0.000 0.000 0.000 0.003 | −1.149 0.900 −1.210 3.371 −25.364 | 0.436 0.086 0.080 0.002 0.155 | ||
| Financials | const Cases Deaths LocDm Volm | 1.780 1.298 1.634 −8.615 −0.225 | 0.262 0.000 0.000 0.000 0.000 | 2.139 3.384 −2.605 −15.348 0.043 | 0.157 0.000 0.000 0.000 0.168 | −0.041 −0.082 0.001 0.236 −0.517 | 0.282 0.000 0.937 0.000 0.001 | −6.305 0.760 −1.942 0.988 −0.010 | 0.000 0.057 0.000 0.225 0.610 |
| Health Care | const Cases Deaths LocDm Volm | 2.597 2.300 1.354 −5.269 0.606 | 0.132 0.000 0.000 0.000 0.093 | 31.874 2.694 −0.925 −18.069 −0.071 | 0.000 0.000 0.242 0.000 0.719 | ||||
| ICT | const Cases Deaths LocDm Volm | 11.370 0.914 0.819 −10.412 −0.678 | 0.000 0.024 0.059 0.000 0.168 | −3.242 0.925 0.649 −7.640 0.155 | 0.007 0.015 0.172 0.000 0.340 | 0.255 0.065 −0.008 −0.342 −0.847 | 0.000 0.000 0.661 0.000 0.026 | 5.367 −3.663 14.805 1.480 −12400.5 | 0.099 0.002 0.000 0.525 0.478 |
| Industrials | const Cases Deaths LocDm Volm | −1.360 1.033 2.689 −10.417 −0.052 | 0.420 0.004 0.000 0.000 0.925 | 4.870 −0.222 −1.271 −7.979 0.122 | 0.000 0.433 0.001 0.000 0.183 | −0.143 −0.162 −0.088 0.645 0.020 | 0.132 0.000 0.028 0.000 0.866 | 6.160 −1.504 −6.985 −1.296 31.991 | 0.001 0.021 0.000 0.330 0.525 |
| Materials | const Cases Deaths LocDm Volm | −0.185 −0.820 2.855 −6.045 0.577 | 0.916 0.025 0.000 0.000 0.499 | 1.835 4.557 −5.494 −13.215 0.010 | 0.068 0.000 0.000 0.000 0.853 | −0.225 −0.143 −0.011 0.506 −0.162 | 0.018 0.000 0.791 0.000 0.776 | −3.688 −0.004 0.313 0.314 232.645 | 0.000 0.967 0.006 0.067 0.209 |
| Real Estate | const Cases Deaths LocDm Volm | 1.127 0.031 0.866 −0.042 0.258 | 0.228 0.875 0.000 0.898 0.071 | 0.053 −0.097 −0.218 0.482 −0.236 | 0.691 0.021 0.000 0.000 0.284 | ||||
| Utilities | const Cases Deaths LocDm Volm | 6.810 −4.395 −9.943 −4.710 −0.188 | 0.073 0.001 0.000 0.088 0.097 | ||||||
Table 5.
ZSE panel regression results.
| RandomEffects Estimation Summary | ||||||
|---|---|---|---|---|---|---|
| Dep. Variable: | CARet | R-squared: | 0.4055 | |||
| Estimator: | RandomEffects | R-squared (Between): | 0.1111 | |||
| No. Observations: | 1057 | R-squared (Within): | 0.4075 | |||
| Date: | Tue, Nov 29 2022 | R-squared (Overall): | 0.2398 | |||
| Time: | 11:07:53 | Log-likelihood | −722.60 | |||
| Cov. Estimator: | Clustered | |||||
| F-statistic: | 179.35 | |||||
| Entities: | 7 | p-value | 0.0000 | |||
| Avg Obs: | 151.00 | Distribution: | F(4,1052) | |||
| Min Obs: | 151.00 | |||||
| Max Obs: | 151.00 | F-statistic (robust): | 5.8333 | |||
| p-value | 0.0001 | |||||
| Time periods: | 151 | Distribution: | F(4,1052) | |||
| Avg Obs: | 7.0000 | |||||
| Mix Obs: | 7.0000 | |||||
| Max Obs: | 7.0000 | |||||
| Parameter Estimates | ||||||
| Parameter | Coeff | Std. Err. | T-stat | p-value | Lower CI | Upper CI |
| const | −0.1227 | 0.0645 | −1.9025 | 0.0574 | −0.2493 | 0.0039 |
| log_cumCases | −0.0179 | 0.0549 | −0.3257 | 0.7447 | −0.1255 | 0.0898 |
| log_cumDeaths | −0.1284 | 0.0753 | −1.7054 | 0.0884 | −0.2762 | 0.0193 |
| LockDm | 0.2105 | 0.1465 | 1.4375 | 0.1509 | −0.0769 | 0.4980 |
| scVolume | −0.0202 | 0.1056 | −0.1912 | 0.8484 | −0.2273 | 0.1869 |
Table 6.
NGX panel regression results.
| RandomEffects Estimation Summary | ||||||
|---|---|---|---|---|---|---|
| Dep. Variable: | CARet | R-squared: | 0.5419 | |||
| Estimator: | RandomEffects | R-squared (Between): | −0.0052 | |||
| No. Observations: | 1208 | R-squared (Within): | 0.5425 | |||
| Date: | Tue, Nov 29 2022 | R-squared (Overall): | 0.2014 | |||
| Time: | 11:01:15 | Log-likelihood | −4103.3 | |||
| Cov. Estimator: | Clustered | |||||
| F-statistic: | 355.76 | |||||
| Entities: | 8 | p-value | 0.0000 | |||
| Avg Obs: | 151.00 | Distribution: | F(4,1203) | |||
| Min Obs: | 151.00 | |||||
| Max Obs: | 151.00 | F-statistic (robust): | 11.536 | |||
| p-value | 0.0000 | |||||
| Time periods: | 151 | Distribution: | F(4,1203) | |||
| Avg Obs: | 8.0000 | |||||
| Mix Obs: | 8.0000 | |||||
| Max Obs: | 8.0000 | |||||
| Parameter Estimates | ||||||
| Parameter | Coeff | Std. Err. | T-stat | p-value | Lower CI | Upper CI |
| const | 7.7462 | 3.6049 | 2.1488 | 0.0318 | 0.6737 | 14.819 |
| log_cumCases | 3.4648 | 0.7621 | 4.5464 | 0.0000 | 1.9696 | 4.9600 |
| log_cumDeaths | −3.0563 | 0.8051 | −3.7963 | 0.0002 | −4.6358 | −1.4768 |
| scVolume | 0.0520 | 0.0535 | 0.9729 | 0.3308 | −0.0529 | 0.1569 |
| LockDm | −15.286 | 3.0048 | −5.0871 | 0.0000 | −21.181 | −9.3905 |
Table 7.
LSE panel regression results.
| RandomEffects Estimation Summary | ||||||
|---|---|---|---|---|---|---|
| Dep. Variable: | AR | R-squared: | 0.0025 | |||
| Estimator: | RandomEffects | R-squared (Between): | −0.0013 | |||
| No. Observations: | 808 | R-squared (Within): | 0.0025 | |||
| Date: | Tue, Nov 29 2022 | R-squared (Overall): | 0.0024 | |||
| Time: | 11:21:41 | Log-likelihood | −1613.3 | |||
| Cov. Estimator: | Clustered | |||||
| F-statistic: | 0.4983 | |||||
| Entities: | 8 | P-value | 0.7370 | |||
| Avg Obs: | 101.00 | Distribution: | F(4,803) | |||
| Min Obs: | 101.00 | |||||
| Max Obs: | 101.00 | F-statistic (robust): | 1.1918 | |||
| p-value | 0.3129 | |||||
| Time periods: | 101 | Distribution: | F(4,803) | |||
| Avg Obs: | 8.0000 | |||||
| Mix Obs: | 8.0000 | |||||
| Max Obs: | 8.0000 | |||||
| Parameter Estimates | ||||||
| Parameter | Coeff | Std. Err. | T-stat | p-value | Lower CI | Upper CI |
| const | −0.1784 | 0.1033 | −1.7273 | 0.0845 | −0.3811 | 0.0243 |
| log_Cases | −0.0301 | 0.0186 | −1.6210 | 0.1054 | −0.0665 | 0.0063 |
| log_Deaths | 0.1403 | 0.1698 | 0.8259 | 0.4091 | −0.1931 | 0.4736 |
| LockDm | 0.0919 | 0.2236 | 0.4111 | 0.6811 | −0.3470 | 0.5308 |
| scVolume | 0.0014 | 0.0021 | 0.6810 | 0.4960 | −0.0027 | 0.0056 |
Disclaimer/Publisher’s Note: The statements, opinions and data contained in all publications are solely those of the individual author(s) and contributor(s) and not of MDPI and/or the editor(s). MDPI and/or the editor(s) disclaim responsibility for any injury to people or property resulting from any ideas, methods, instructions or products referred to in the content. |
© 2023 by the authors. Licensee MDPI, Basel, Switzerland. This article is an open access article distributed under the terms and conditions of the Creative Commons Attribution (CC BY) license (https://creativecommons.org/licenses/by/4.0/).
Share and Cite
MDPI and ACS Style
Ncube, M.; Sibanda, M.; Matenda, F.R. COVID-19 Pandemic and Stock Performance: Evidence from the Sub-Saharan African Stock Markets. Economies 2023, 11, 95. https://doi.org/10.3390/economies11030095
AMA Style
Ncube M, Sibanda M, Matenda FR. COVID-19 Pandemic and Stock Performance: Evidence from the Sub-Saharan African Stock Markets. Economies. 2023; 11(3):95. https://doi.org/10.3390/economies11030095
Chicago/Turabian StyleNcube, Mbongiseni, Mabutho Sibanda, and Frank Ranganai Matenda. 2023. "COVID-19 Pandemic and Stock Performance: Evidence from the Sub-Saharan African Stock Markets" Economies 11, no. 3: 95. https://doi.org/10.3390/economies11030095
Note that from the first issue of 2016, this journal uses article numbers instead of page numbers. See further details here.