
Comparative Research of Internal and Border Regions: Analyzing the Differences in the Cyclical Dynamics of Industries for Industrial Policy and Territorial Development
 , , ,
, , ,  and
and
Abstract
:1. Introduction
2. Literature Overview
2.1. Border Regions as an Object of Regional Analysis
2.2. Regional Cycles
3. Methodology
4. Results
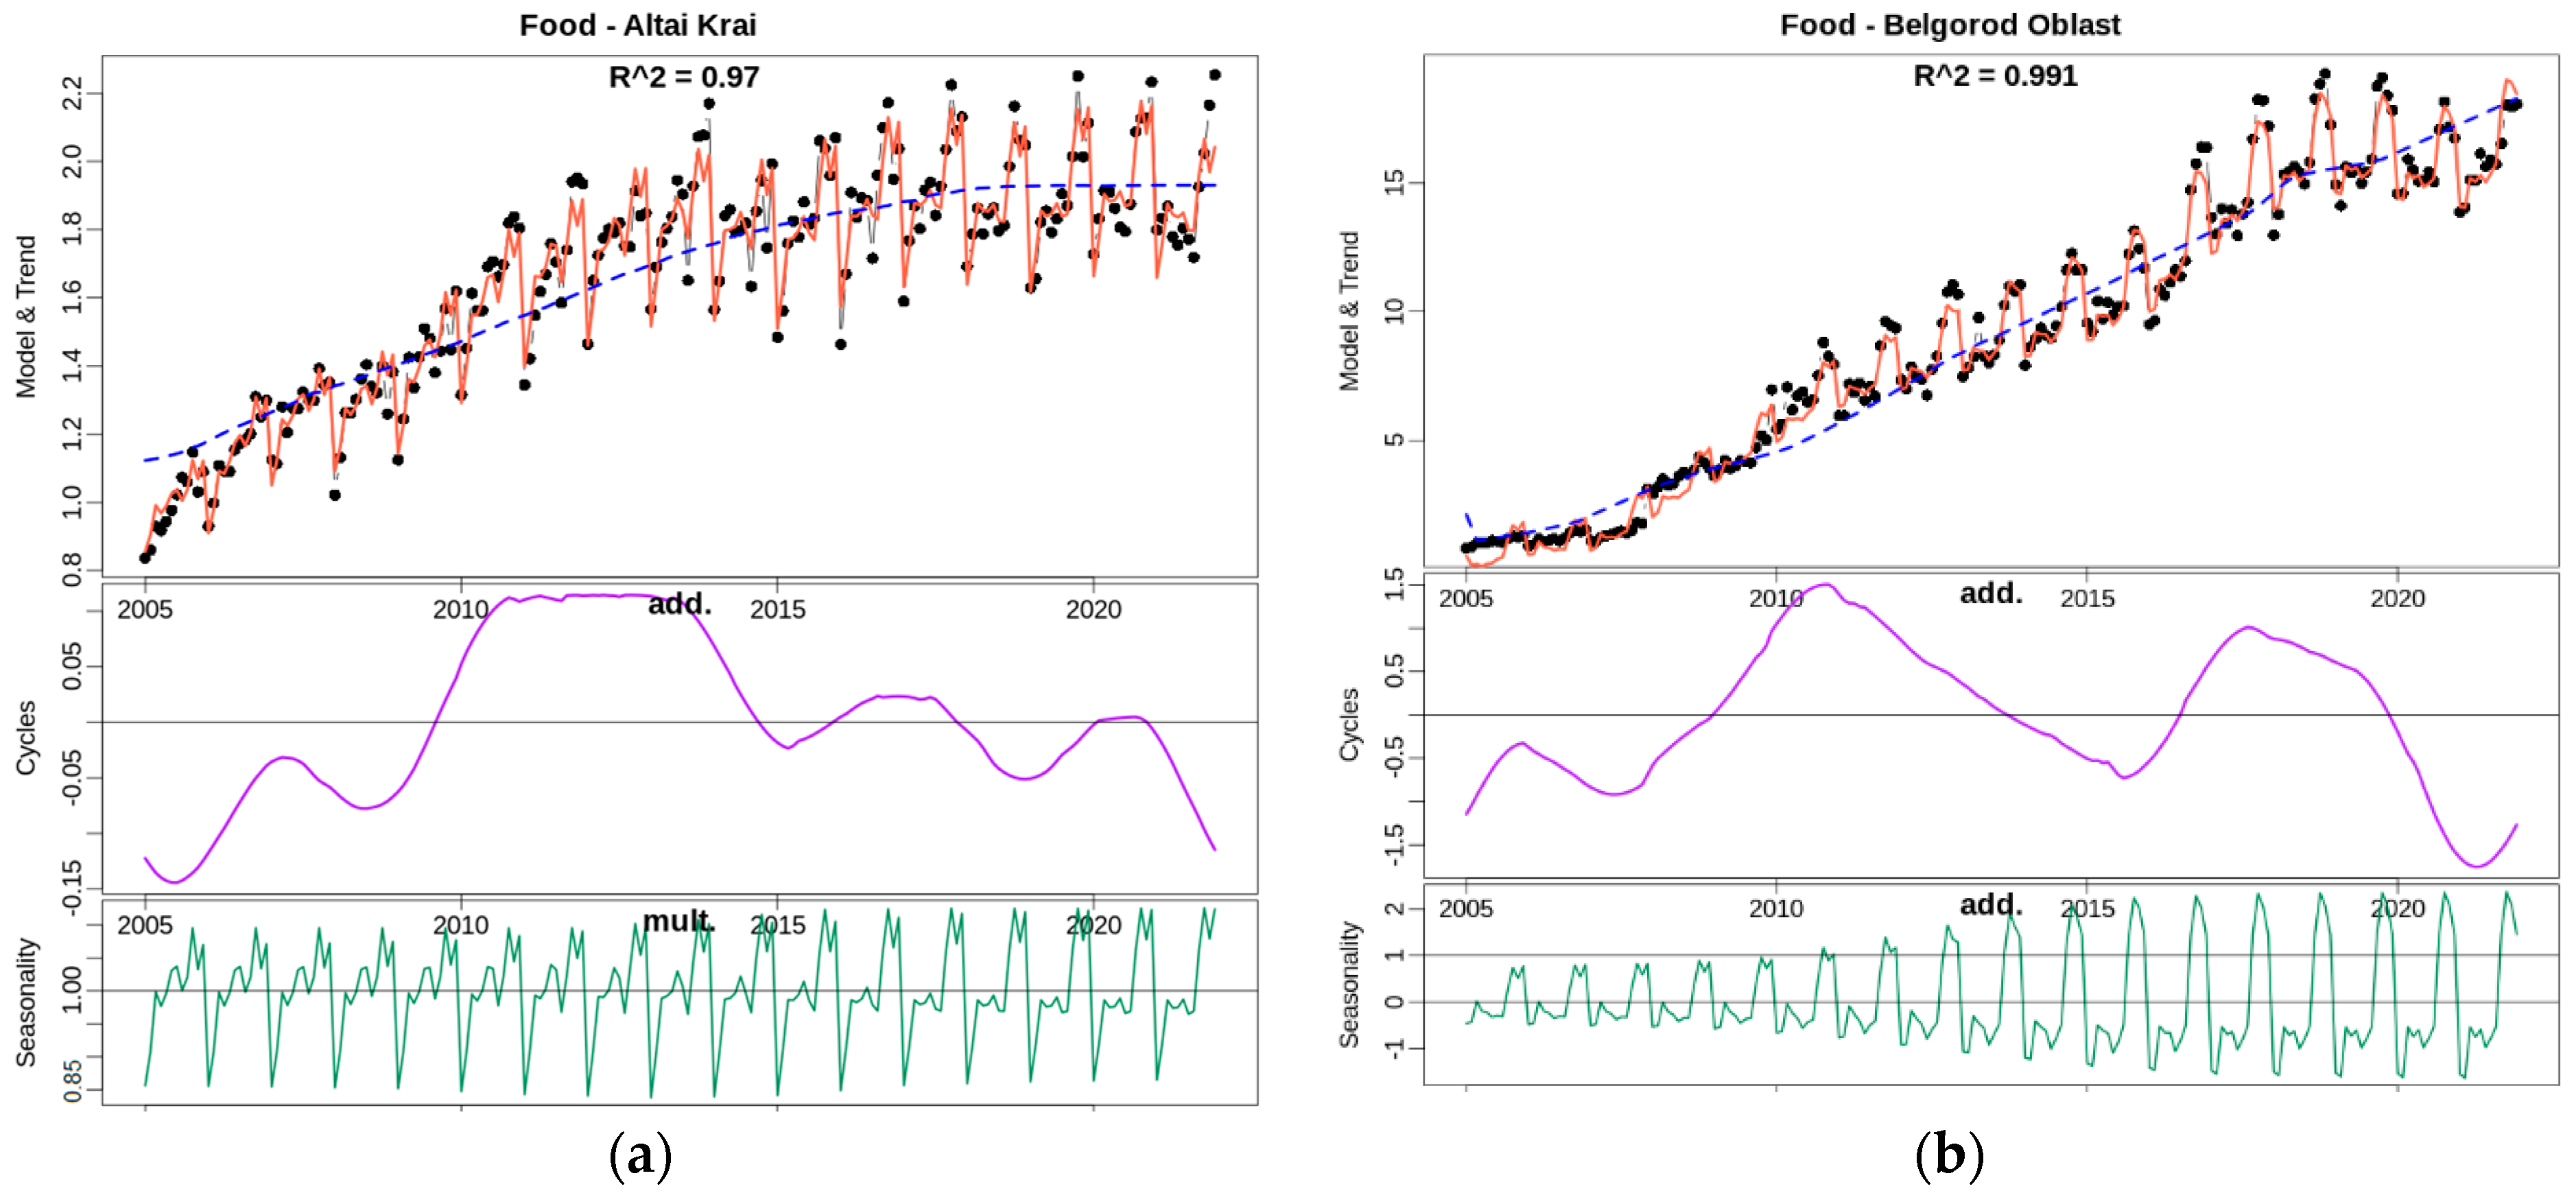
4.1. Food Industry
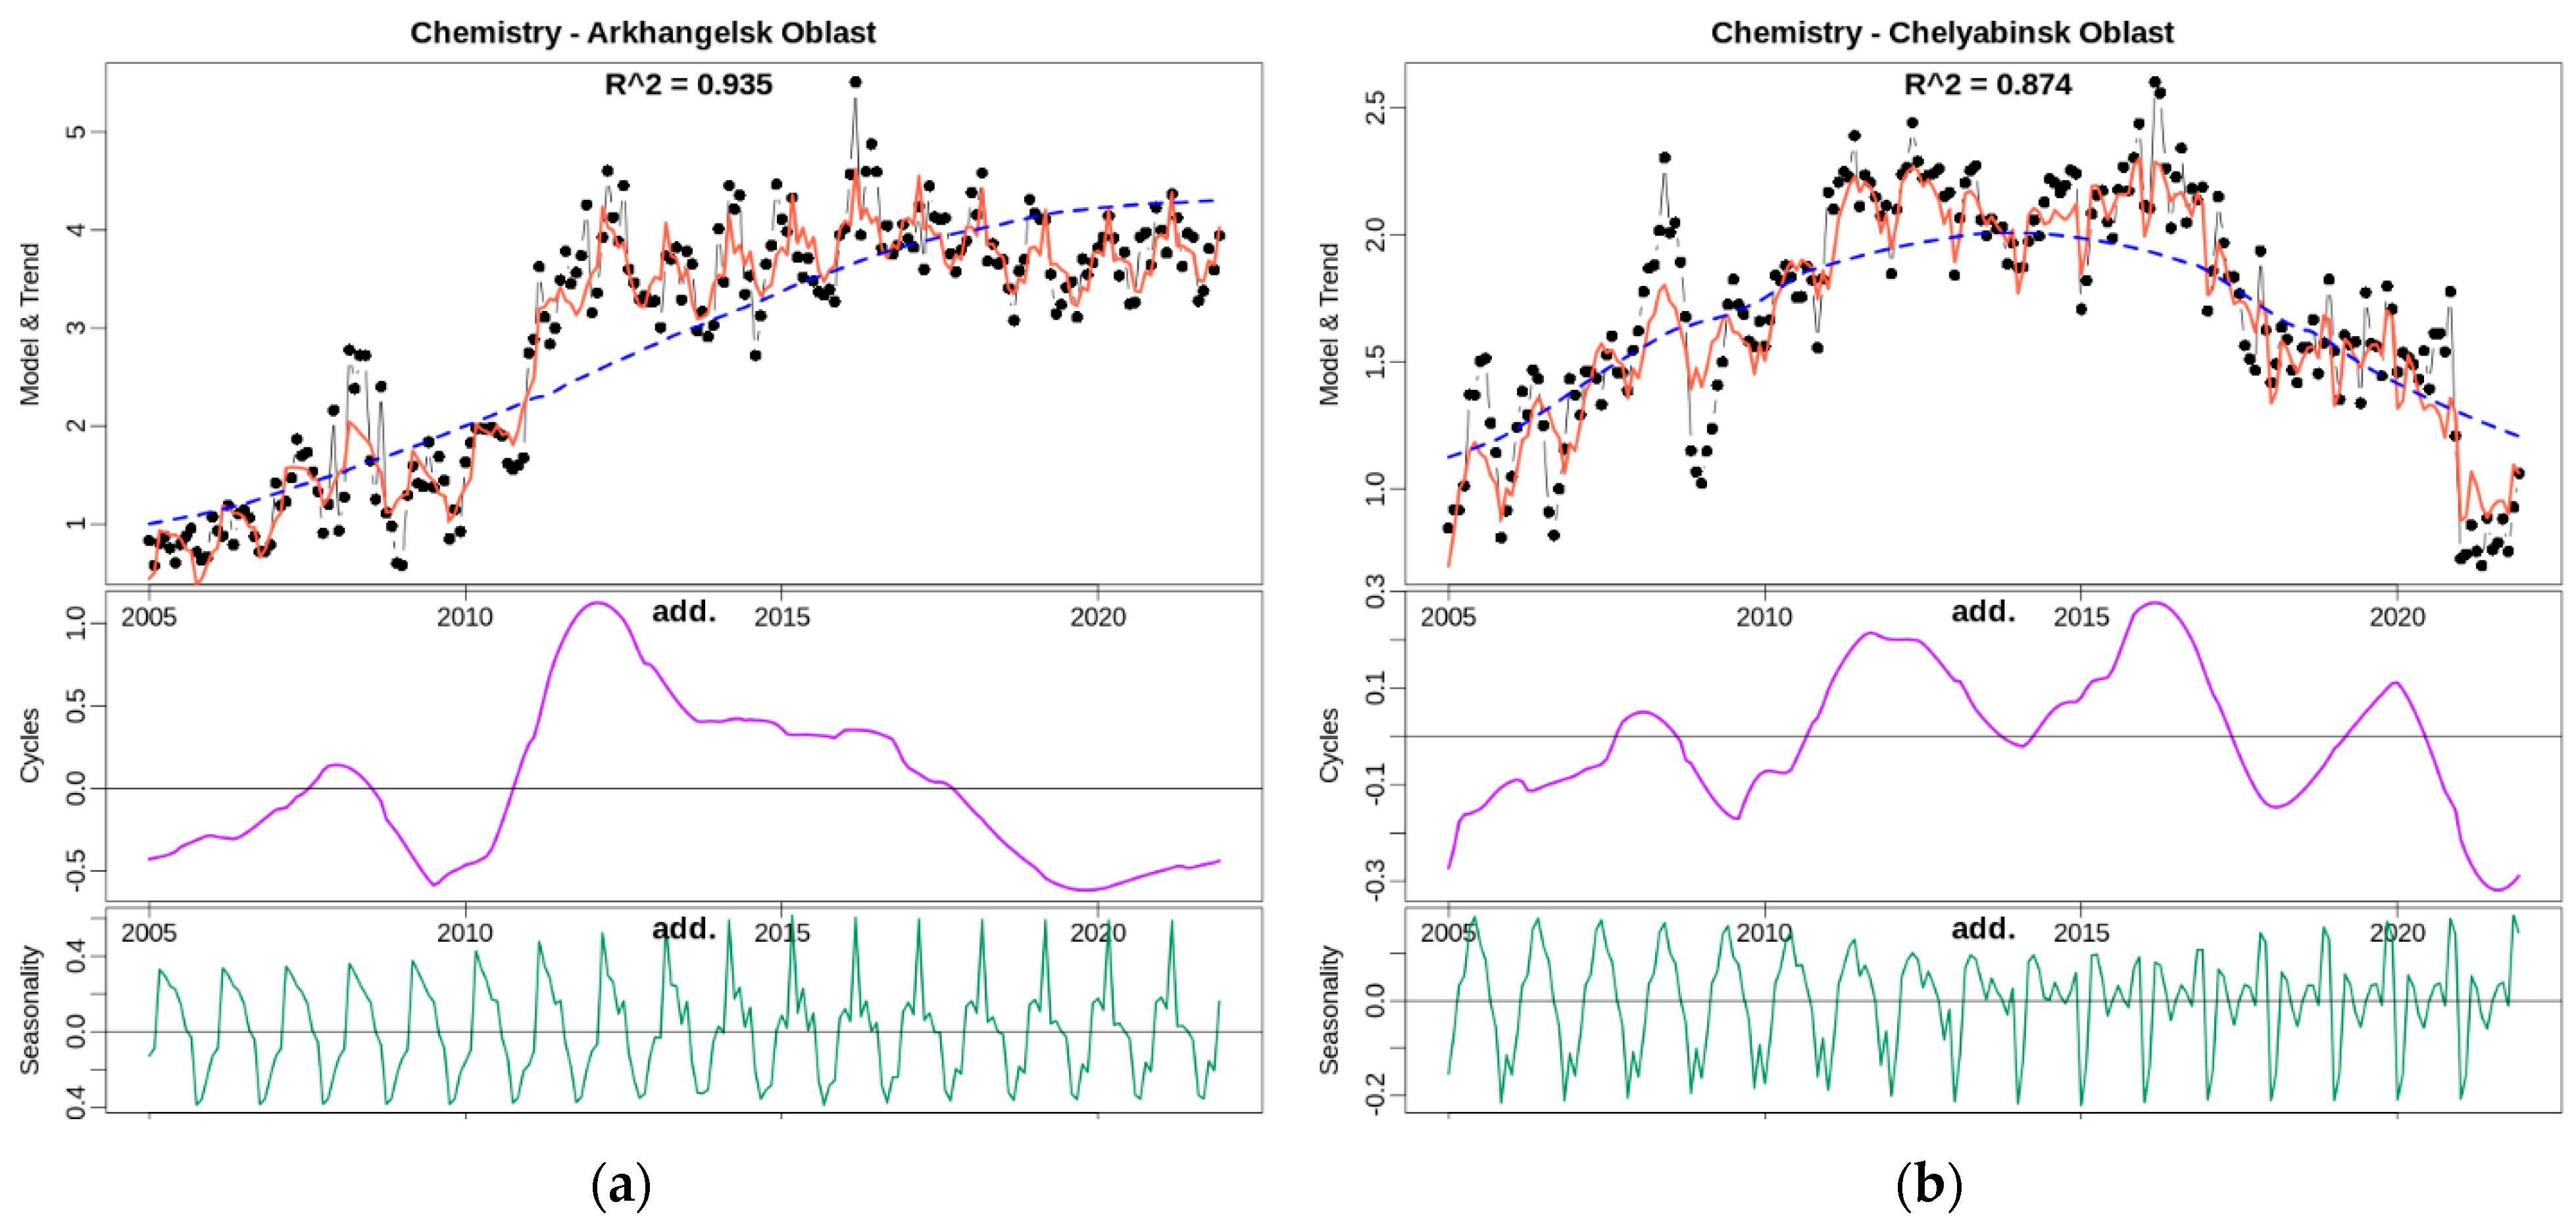
4.2. Production of Chemicals and Chemical Products
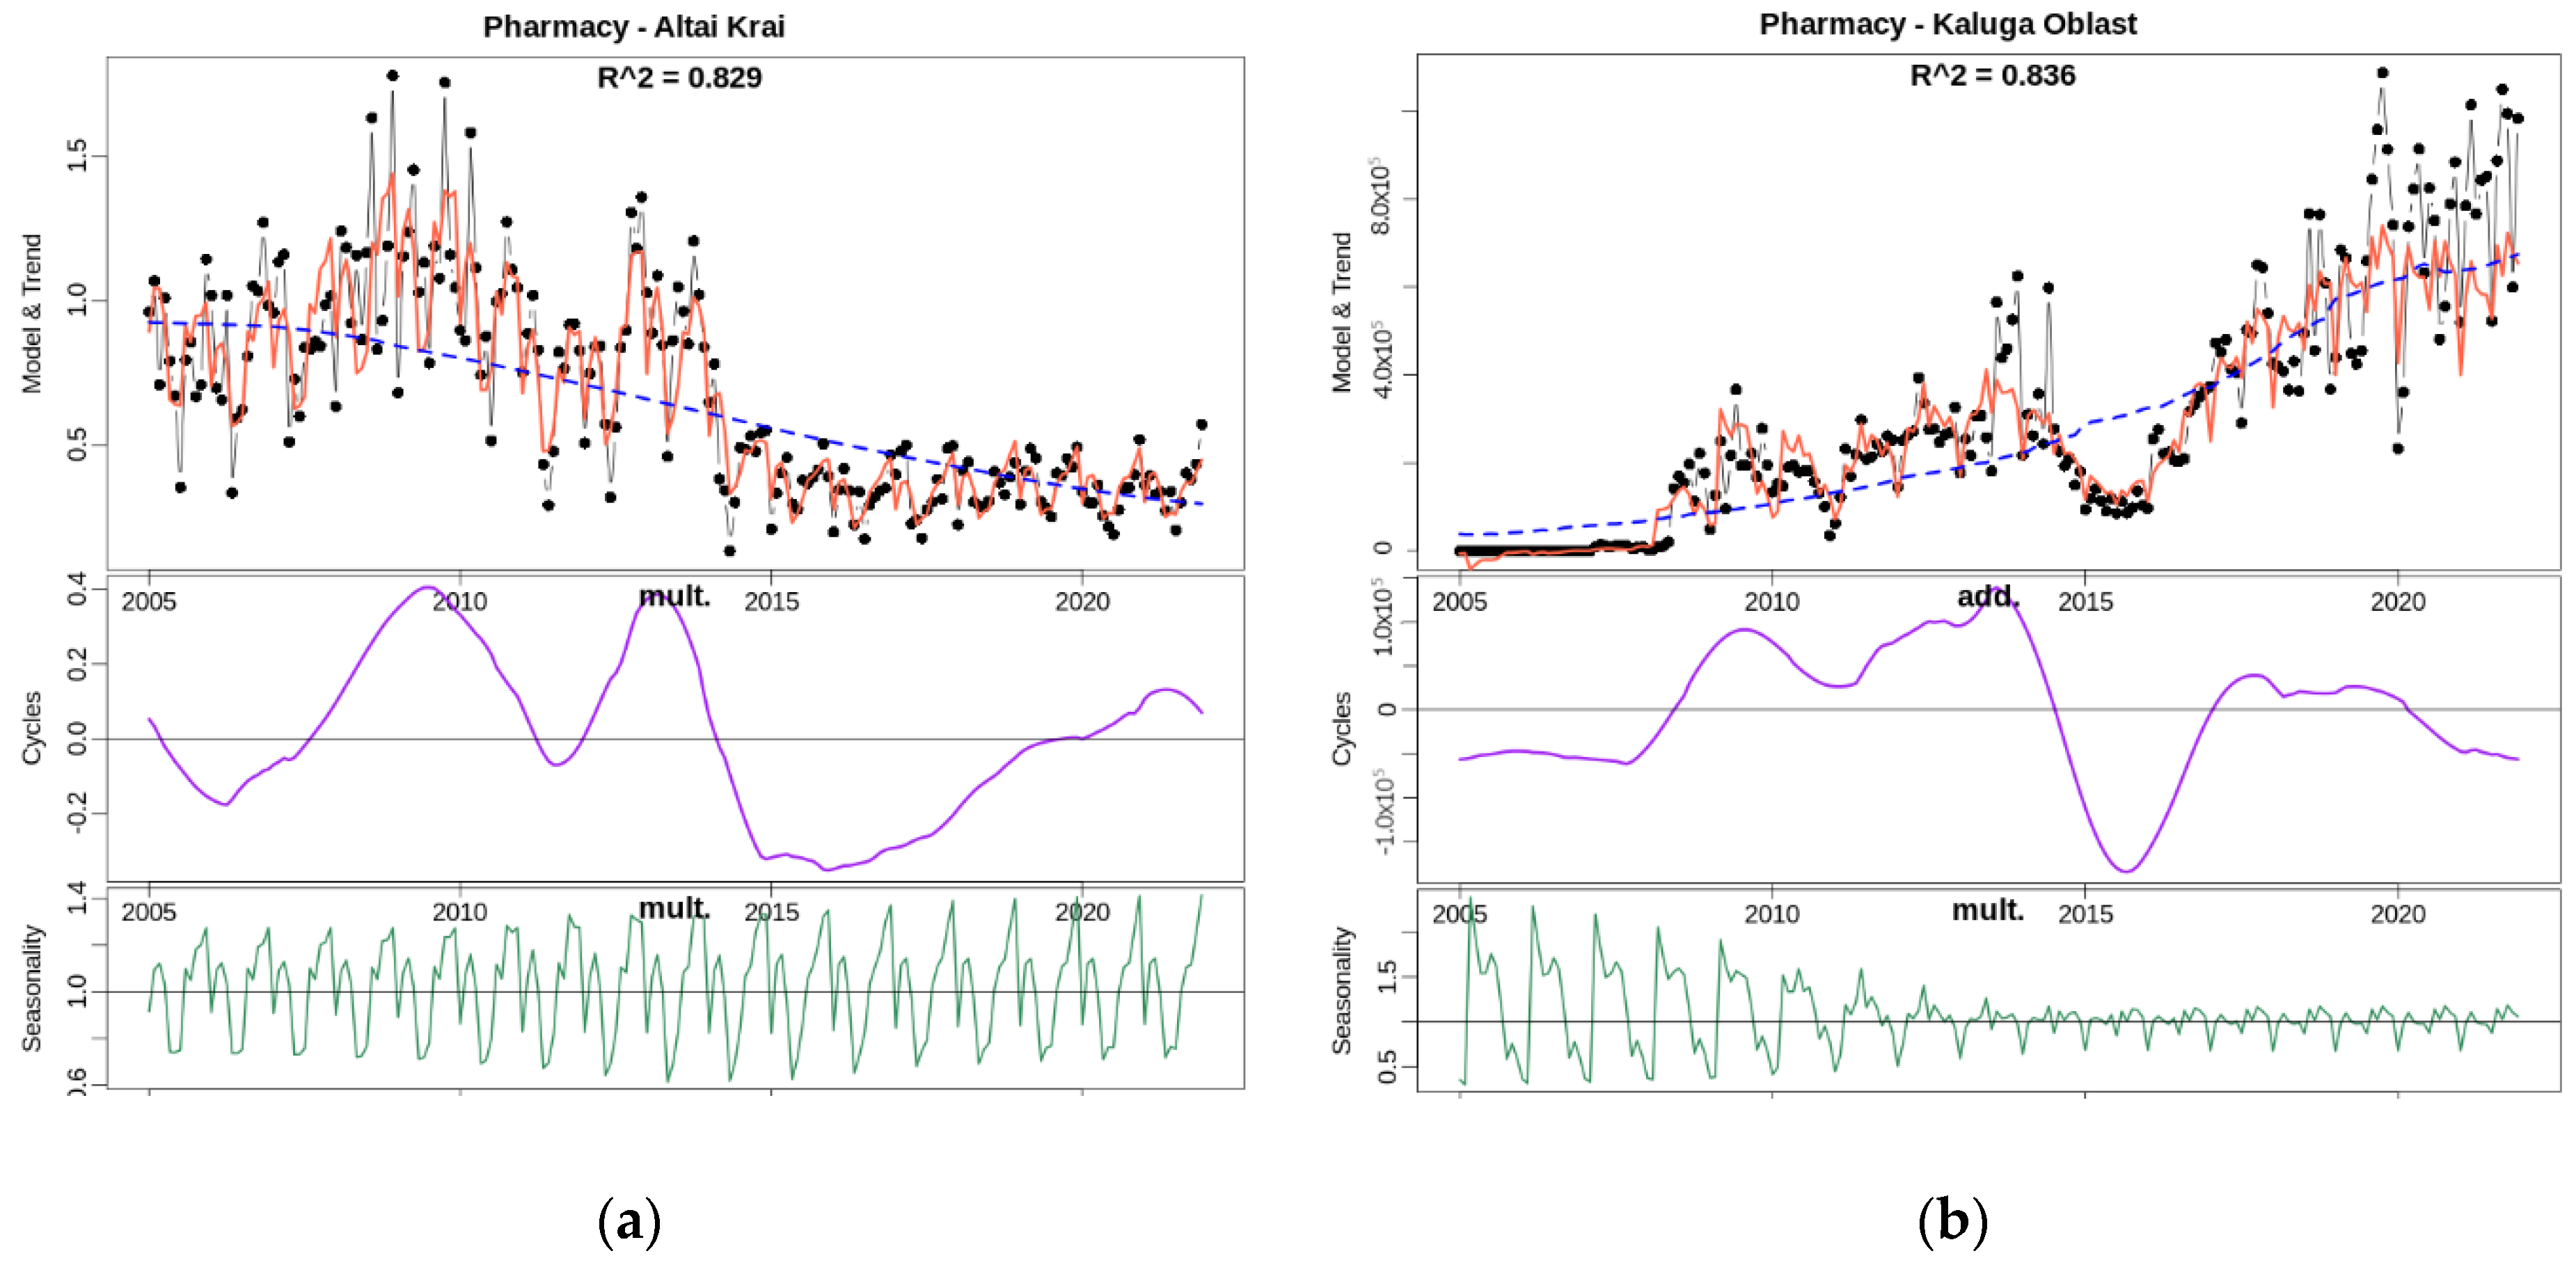
4.3. Production of Medicines and Materials for Medical Purposes
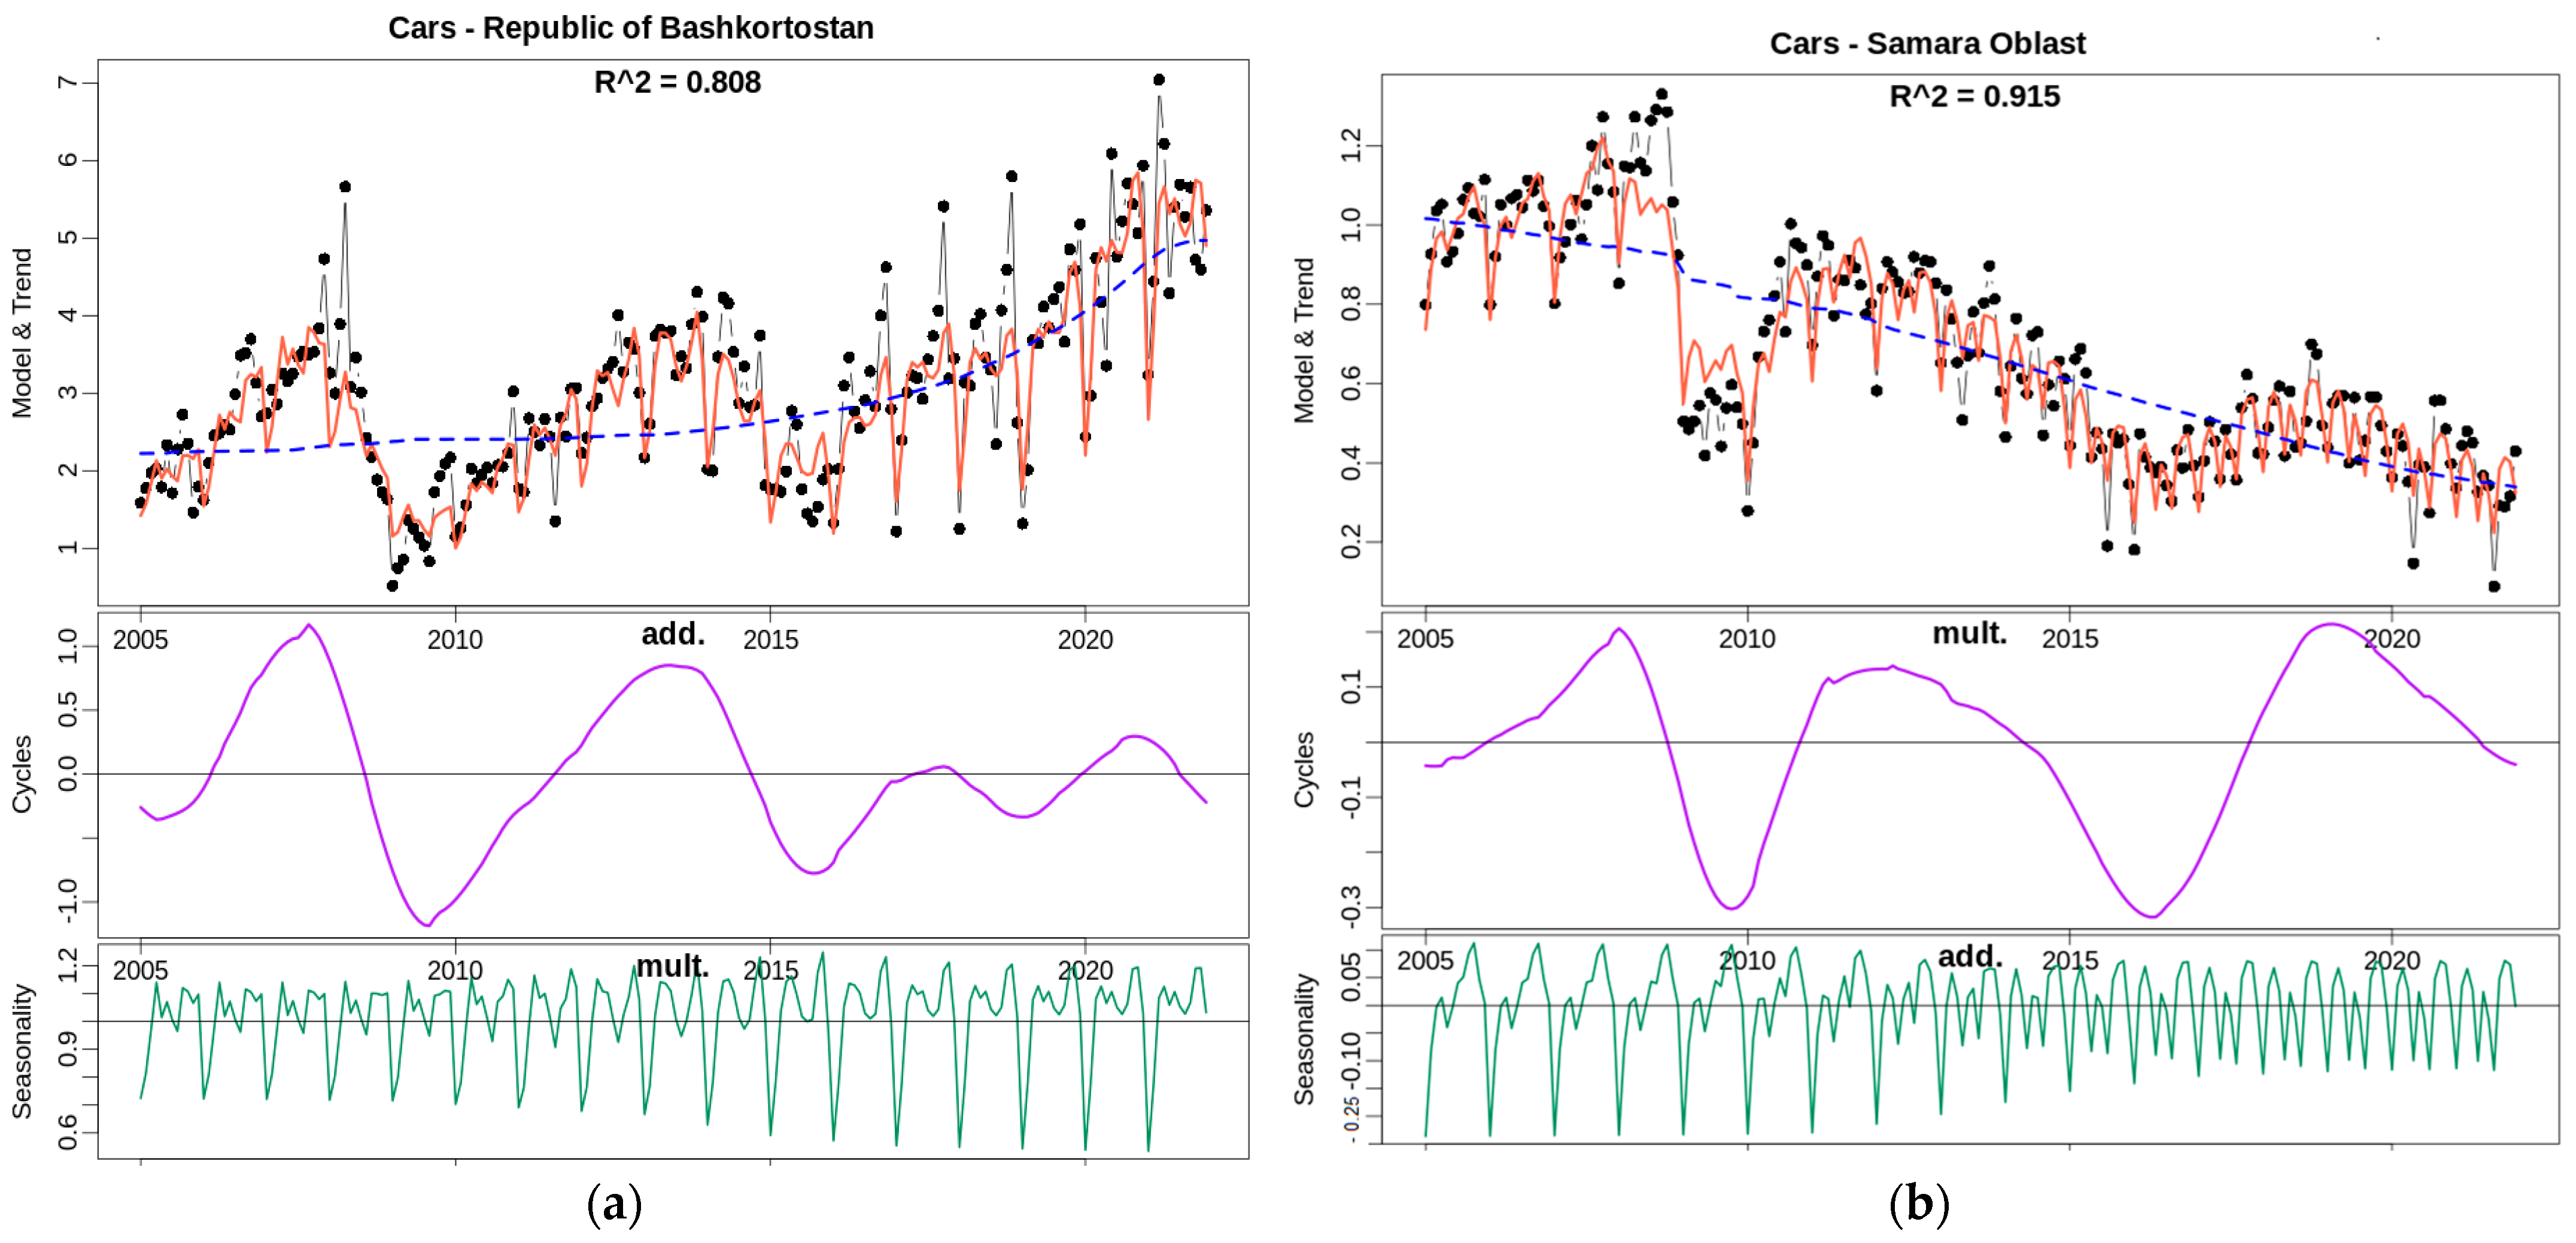
4.4. Production of Motor Vehicles, Trailers, and Semi-Trailers
5. Discussion
6. Conclusions
Author Contributions
Funding
Informed Consent Statement
Data Availability Statement
Acknowledgments
Conflicts of Interest
References
- Aganbegyan, Abel. 2010. Ekonomika Rossii na rasput’e... Vybor postkrizisnogo prostranstva [The Russian Economy is at the Crossroads... Choosing a Post-Crisis Space]. Moscow: AST, Astrel. ISBN 978-5-17-064913-6, 978-5-271-26726-0. (In Russian) [Google Scholar]
- Anderson, Joan B., and James Gerber. 2020. The US-Mexico Border Human Development Index, 1990–2015: Improvements but Still Large Gaps. Journal of Borderlands Studies 14: 1–20. [Google Scholar] [CrossRef]
- Anderson, James E., and Eric van Wincoop. 2003. Gravity with gravitas: A solution to the border puzzle. American Economic Review 93: 170–92. [Google Scholar] [CrossRef] [Green Version]
- Angapova, Olga B. 2014. Classification of Cross-Border Regions of the Russian Federation. The Buryat State University Bulletin 2: 76–80. (In Russian). [Google Scholar]
- Baklanov, Pyotr Ya. 2018. Structural Features and Potentialof Border and Transboundary Areas Development: Theoretical Aspects. Regional’nye issledovaniya = Regional Studies 3: 19–24. (In Russian). [Google Scholar]
- Baymukhametova, Liya, Divakov Alexandr, Orechov Dmitriy, Piskunov Andrey, Proklov Aleksandr, and Tayketaev Nariman. 2023. Rossiyskaya ekonomika. Analiticheskoe issledovanie reytingovogo agentstva NKR [The Russian Economy. Analytical Study of the NKR Rating Agency]. Available online: https://ratings.ru/files/research/corps/NCR_Resilience_150622.pdf (accessed on 20 January 2023). (In Russian).
- Berezhnaya, Lyubov Y. 2021. The Role of Transport Infrastructure in Development of Border Region. Vestnik of the Plekhanov Russian University of Economics 4: 109–17. (In Russian) [Google Scholar] [CrossRef]
- Bilchak, Vasiliy S., and Mikhail V. Bilchak. 2018. Border Regions: Classification, Diagnostics, Innovations. Moscow: Creative Economy, p. 324. ISBN 978-5-91292-210-7. (In Russian). [Google Scholar] [CrossRef]
- Camagni, Roberto, Capello Roberta, and Caragliu Andrea. 2019. Measuring the impact of legal and administrative international barriers on regional growth. Regional Science Policy & Practice 11: 345–66. [Google Scholar] [CrossRef]
- Capello, Roberta, Andrea Caragliu, and Ugo Fratesi. 2018. Measuring border effects in European cross-border regions. Regional Studies 52: 986–96. [Google Scholar] [CrossRef]
- Chandra, Kevin, Wang Jue, Luo Ning, and Wu Xun. 2022. Asymmetry in the distribution of benefits of cross -border regional innovation systems: The case of the Hong Kong–Shenzhen innovation system. Regional Studies. [Google Scholar] [CrossRef]
- Cleveland, Robert B., William S. Cleveland, Jean E. McRae, and Irma Terpenning. 1990. STL: A Seasonal-Trend Decomposition Procedure Based on Loess. Journal of Official Statistics 6: 3–73. [Google Scholar]
- Efron, Bradley, and Robert J. Tibshirani. 1993. An Introduction to the Bootstrap. London: Chapman and Hall. ISBN 0-412-04231-2. [Google Scholar]
- Fernandes, Gonçalo Poeta. 2019. Rural depopulation, social resilience and context costs in the border municipalities of central Portugal. Dichotomies of social reorganization vs absence of public policies. Economía Agraria y Recursos Naturales-Agricultural and Resource Economics 19: 121–49. [Google Scholar] [CrossRef] [Green Version]
- Fischer, Stanley, Dornbusch Rudiger, and Schmalensi Richard. 1998. Economics. New York: McGraw-Hill. [Google Scholar]
- Fritsch, Michael. 2011. 23 Start-ups in Innovative Industries—Causes and Effects. In Handbook of Research on Innovation and Entrepreneurship. Edited by David B. Audretsch, Oliver Falck, Stephan Heblich and Adam Lederer. Chaltenham: Elgar, pp. 365–81. [Google Scholar]
- Gartner, William. 1988. Who is an Entrepreneur? Is the Wrong Question. American Journal of Small Business 12: 11–32. [Google Scholar] [CrossRef] [Green Version]
- Geraskin, Mikhail I., and Polina V. Porubova. 2017. Differential Model of Macroeconomic Growth with Endogenic Cyclicity. Actual Problems of Economics and Law 11: 43–55. (In Russian). [Google Scholar] [CrossRef] [Green Version]
- Glazyev, Sergei Yu. 2018. Ryvok v budushchee. Rossiya v novykh tekhnologicheskom i mirokhozyaystvennom ukladakh [A Leap into the Future. Russia in the New Technological and World Economic Structures]. Moscow: Knizhnyy Mir. ISBN 978-5-6041071-1-9. (In Russian) [Google Scholar]
- Glazyrina, Irina P., Andrey A. Faleichik, and Larisa M. Faleichik. 2011. Cross-Border Cooperation in the Light of the Investment Processes: More Minuses Than Pluses So Far. ECO 9: 50–70. (In Russian). [Google Scholar] [CrossRef]
- Hansen, Alvin H. 1951. Business Cycles and National Income. New York: Norton. [Google Scholar]
- Hansen, Niles. 1977. Border regions: A critique of spatial theory and a European case study. The Annals of Regional Science 11: 1–14. [Google Scholar] [CrossRef]
- Heider, Bastian. 2019. The impact of EU Eastern enlargement on urban growth and decline: New insights from Germany’s Eastern border. Papers in Regional Science 98: 1443–68. [Google Scholar] [CrossRef]
- van Houtum, Henk. 2000. An overview of European geographical research on borders and border regions. Journal of Borderlands Studies 15: 57–83. [Google Scholar] [CrossRef]
- Igel, Christian, and Michael Huesken. 2003. Empirical evaluation of the improved Rprop learning algorithms. Neurocomputing 50: 105–23. [Google Scholar] [CrossRef]
- Jakubowski, Andrzej, Trykacz Karolina, Studzieniecki Tomasz, and Skibiński Jakub. 2022. Identifying cross-border functional areas: Conceptual background and empirical findings from Polish borderlands. European Planning Studies 30: 2433–55. [Google Scholar] [CrossRef]
- Kapkaev, Yuner Sh., and Pavel R. Kadyrov. 2017. Features of Cyclical Development of the Economy. Fundamental Research 10–13: 587–93. (In Russian). [Google Scholar]
- Khmeleva, Galina A., Valery K. Semenychev, and Anastasiya A. Korobetskaya. 2021a. Cyclical Analysis in the Search for Promising Growth Points (on the Example of the Russian Pharmaceutical Industry). Russian Journal of Innovation Economics 11: 1151–70. (In Russian) [Google Scholar] [CrossRef]
- Khmeleva, Galina A., Valery K. Semenychev, and Anastasiya A. Korobetskaya. 2021b. Percentiles and a cyclic approach for the methodology of scenario predictive planning of promising specialization of the region. Regional Economics: Theory and Practice 19: 1975–2000. (In Russian) [Google Scholar] [CrossRef]
- Kleiner, Georgy B. 2021. Sistemnaya ekonomika: Shagi razvitiya [System Economy: Development Steps]. Moscow: Nauhcnaya Biblioteka Publ. ISBN 978-5-907242-87-6. (In Russian) [Google Scholar]
- Koff, Harlan. 2015. Informal Economies in European and American Cross-border Regions. Journal of Borderlands Studies 30: 469–87. [Google Scholar] [CrossRef] [Green Version]
- Kogdenko, Vera G. 2019. Improving the methodology for industry analysis based on the Harvard paradigm. Ekonomicheskii analiz: Teoriya i praktika = Economic Analysis: Theory and Practice 18: 1847–80. (In Russian) [Google Scholar] [CrossRef]
- Kurnikova, Marina V. 2021. Transformation of the Border Factor into the Competitive Advantage of a Region (Case of the Samara Region). The Review of Economy, the Law and Sociology 2: 39–42. (In Russian). [Google Scholar]
- Lazareva, Viktoria V., Dyachenko Vladimir Nikolaevich, and Vlasova Natalya Yuryevna. 2020. Border Location and Region Sustainable Development. Regionalistica = Regionalistics 2: 24–36. (In Russian). [Google Scholar] [CrossRef]
- Leick, Birgit, Schewe Theo, and Karlsen Kivedal Bjørnar. 2021. Tourism Development and Border Asymmetries: An Exploratory Analysis of Market-Driven Cross-Border Shopping Tourism. Tourism Planning & Development 18: 673–98. [Google Scholar] [CrossRef]
- Mayevsky, Vladimir, and Svetlana Kirdina-Chandler, eds. 2020. Mesoeconomics: Elements of a New Paradigm. Moscow: IE RAS. ISBN 978-5-9940-0661-0. Available online: https://inecon.org/docs/2020/Mayevsky_Kirdina-Chandler_book_2020.pdf (accessed on 20 January 2022). (In Russian)
- McCallum, John. 1995. National borders matter: Canada–US regional trade patterns. The American Economic Review 85: 615–23. [Google Scholar]
- Mustafin, Askar Nailevich, Svetlana Nikolaevna Kotenkova, Ivana Kravčáková Vozárová, and Rastislav Kotulič. 2022. Impact of Import Substitution Policy on Economic Growth. Economies 10: 324. [Google Scholar] [CrossRef]
- Myrdal, Gunnar. 1957. Economic Theory and Underdeveloped Regions. London: Hutchinson. ISBN 978-0715600993. [Google Scholar]
- Novopashina, Alina N. 2012. Foreign Direct Investment from China in the Regions of Russia: Are They Substitutes or Compliments of Foreign Trade? Spatial Economics 4: 67–86. (In Russian) [Google Scholar] [CrossRef]
- Petrakos, George, and Yiannis Saratsis. 2000. Regional inequalities in Greece. Papers in Regional Science 79: 57–74. [Google Scholar] [CrossRef]
- Petrakos, George, and Lefteris Topaloglou. 2008. Economic geography and European integration: The effects on the EU’s external border regions. International Journal of Public Policy 3: 146. [Google Scholar] [CrossRef]
- Petrakos, George, Rodríguez-Pose Andrés, and Rovolis Antonis. 2005. Growth, integration, and regional disparities in the European Union. Environment and Planning 37: 1837–57. [Google Scholar] [CrossRef]
- Porter, Michael E. 1998. Competitive Strategy: Techniques for Analyzing Industries and Competitors. New York: Free Press. First published 1980. [Google Scholar]
- Prokop’ev, Egor A., and Anna E. Kurilo. 2016. [Assessment of border location impact on socio-economic development of the region (Russian literature review)]. Pskovskii regionologicheskii zhurnal = Pskov Regional Journal 4: 3–14. (In Russian). [Google Scholar]
- Punzo, Lionello F. 2015. Cycles, Growth and Structural Change. London and New York: Routledge. 416p. First published 2001. [Google Scholar]
- Rodríguez-Pose, Andrés, and Ugo Fratesi. 2007. Regional Business Cycles and the Emergence of Sheltered Economies in the Southern Periphery of Europe. Growth and Change 38: 621–48. [Google Scholar] [CrossRef] [Green Version]
- Russian Federation. 2019. Order “On Approval of the Strategy of Spatial Development of the Russian Federation for the Period up to 2025”. No 207-p. Moscow: Russian Federation. [Google Scholar]
- Russian Federation. 2020. Order “On Approval of the Concept of Border Cooperation in the Russian Federation”. No 2577-p. Moscow: Russian Federation. [Google Scholar]
- Schnabel, Robert Bobby, John E. Koontz, and Barry E. Weiss. 1985. A modular system of algorithms for unconstrained minimization. ACM Trans. Mathematics. Software 11: 419–40. [Google Scholar] [CrossRef]
- Semenychev, Valery K. 2004. Identifikatsiya Ekonomicheskoy Dinamiki Na Osnove Modeley Avtoregressii [Identification of Economic Dynamics Based on Autoregression Models]. Samara: SamSC RAS. (In Russian) [Google Scholar]
- Semenychev, Valery K., Evgeniy I. Kurkin, and Evgeniy V. Semenychev. 2014. Modelling and forecasting the trend of life cycle curves in the production of non-renewable resources. Energy 75: 244–51. [Google Scholar] [CrossRef]
- Semenychev, Valery K., Galina A. Khmeleva, Anastasiya A. Korobetskaya, and Maria A. Kolotolona. 2020. Strukturnaya identifikatsiya modelirovaniya dinamiki otraslevykh tsiklov dlya razvitiya regionov Rossii [Structural identification of modeling the dynamics of industry cycles for the development of Russian regions]. Paper presented at the of the International Scientific and Practical Conference Nauka o dannyhk = Science of Data, Saint-Petersburg, Russia, February 5–7; pp. 278–80. (In Russian). [Google Scholar]
- Semenychev, Valery K., Galina A. Khmeleva, Svetlana A. Asanova, and Anastasiya A. Korobetskaya. 2021. Making Decisions in Cyclical Regional Economy: Innovative Import Substitution and Export. In Engineering Economics: Decisions and Solutions from Eurasian Perspective. ENGINEERING ECONOMICS WEEK 2020. Novocherkassk, Russia, 13–17 May 2020. Edited by Svetlana I. Ashmarina, Valentina V. Mantulenko and Marek Vochozka. Lecture Notes in Networks and Systems. Cham: Springer, Volume 139, pp. 624–32. [Google Scholar] [CrossRef]
- Semenychev, Valery K., Galina A. Khmeleva, and Anastasiya A. Korobetskaya. 2022. Medologiya i tsifrovaya platforma analiza dinamiki otraslevykh tsiklov dlya sbalansirovannogo i ustoychivogo prostranstvennogo razvitiya Rossii [Methodology and Digital Platform for Analyzing the Dynamics of Industry Cycles for Balanced and Sustainable Spatial Development of Russia]. Samara: SamSC RAS. ISBN 978-5-93424-885-8. (In Russian) [Google Scholar]
- Slutsky, Evgeniy E. 1927. Slozhenie sluchajnyh prichin kak istochnik ciklicheskih processov. Voprosy kon”yunktury [Addition of Random Causes as a Source of Cyclic Processes. Market Issues 3: 34–64. (In Russian). [Google Scholar]
- Smirnov, Sergey. 2010. Factors of Cyclical Vulnerability of Russian Economy. Voprosy Ekonomik 6: 44–68. (In Russian) [Google Scholar] [CrossRef]
- Sohn, Christophe. 2014. Modelling cross-border integration: The role of borders as a resource. Geopolitics 19: 587–608. [Google Scholar] [CrossRef]
- Starikov, Konstantin S., and Tatyana N. Ponomareva. 2018. Analysis of the economic activity concentration processes in the border regions of the Russian Federation. Rossiyskoe predprinimatelstvo 19: 2865–80. (In Russian) [Google Scholar] [CrossRef]
- Suchacek, Jan. 2022. Solid as a Rock: Media Portrayals of Cross-Border Activities. Sustainability 14: 15749. [Google Scholar] [CrossRef]
- Svensson, Sara. 2022. Resistance or Acceptance? The Voice of Local Cross-Border Organizations in Times of Re-Bordering. Journal of Borderlands Studies 37: 493–512. [Google Scholar] [CrossRef]
- Tatarkin, Aleksandr I., and Denis A. Tatarkin. 2010. Teoriya ekonomicheskikh krizisov v programmakh antikrizisnykh mer: Uroki obucheniya rynochnomu povedeniyu [Theory of Economic Crises in Anti-Crisis Programs: Lessons of Teaching Market Behavior]. Finance and Credit 39: 2–15. (In Russian). [Google Scholar]
- Tikhomirova, Elena I. 2006. A Complex Approach to the Assessment of Economic Growth Stability and Competitiveness of Regions of the Russian Federation. Voprosy statistiki 2: 9–18. (In Russian). [Google Scholar]
- Tishutina, Olga I. 2008. Metodologiya obespecheniya ustoychivosti dokhodnoy bazy byudzhetov prigranichnykh sub’ektov RF [Methodology for Ensuring the Sustainability of the Revenue Base of the Budgets of the Border Subjects of the Russian Federation]. Khabarovsk: HGAEP. 256p, ISBN 978-5-7823-0386-0. (In Russian) [Google Scholar]
- Topoleva, Tatiana N. 2019. Regional Development: New Theories. Juvenis Scientia 6: 14–17. (In Russian) [Google Scholar] [CrossRef]
- Treshchevskiy, Yury I., Vladimir N. Ejtingon, and Alexey I. Shchedrov. 2010. Asynchronism as the Property of Economic Systems. Proceedings of Voronezh State University. Series: Economics and Management 2: 23–27. (In Russian). [Google Scholar]
- Xiang, Yang, Gubian Sylvian, Suomela Brian, and Hoeng Julia. 2013. Generalized Simulated Annealing for Efficient Global Optimization: The GenSA Package. The R Journal 5: 13–28. [Google Scholar] [CrossRef] [Green Version]
- Yakovets, Yuri V. 2013. Civilizational Crisis: Diagnosis, Structure, Perspectives of Overcoming. Bulletin of the Russian Academy of Natural Sciences 13: 22–28. (In Russian). [Google Scholar]


| No | Group Name | Russian Subjects | Total Area, sq. km | Population on 1 January 2022, ths. People | Average per Capita Monetary Income (per Month), rub. | Contiguous State(s) |
|---|---|---|---|---|---|---|
| 1 | Subject of the Russian Federation bordering the European Union | Leningrad Oblast | 83.9 | 1911.6 | 36,847 | Estonia, Finland |
| 2 | Subjects of the Russian Federation bordering the Eurasian Economic Union | Smolensk Oblast | 49.8 | 909.8 | 30,731 | Belarus |
| Altai Krai, Astrakhan Oblast, Volgograd Oblast, Kurgan Oblast, Novosibirsk Oblast, Omsk Oblast, Orenburg Oblast, Samara Oblast, Saratov Oblast, Tyumen Oblast, Chelyabinsk Oblast | 2551.6 | 23,365.3 | 30,708 | Kazakhstan | ||
| 3 | Subjects of the Russian Federation bordering other countries | Altai Republic | 92.9 | 221.6 | 23,798 | Mongolia, China |
| Republic of Tyva | 168.6 | 332.6 | 20,652 | Mongolia | ||
| Krasnodar Krai | 75.5 | 5687.3 | 43,217 | Republic of Abkhazia/Georgia | ||
| Belgorod region, Voronezh region, Kursk region, Rostov region | 210.3 | 9056.9 | 34,456 | Ukraine | ||
| 4 | Subjects of the Russian Federation bordering the countries of the Eurasian Economic Union as well as other countries or countries of the European Union | Pskov region | 55.4 | 613.3 | 29,332 | Belarus, Estonia, Latvia |
| Bryansk region | 34.9 | 1168.8 | 31,608 | Belarus, Ukraine |
| Indicators | Trend, Growth, % | Trend, Scope, % | Average Cycle Length, Months | Seasonal Scale, % |
|---|---|---|---|---|
| Minimum | −51.74 (Jewish Autonomous Region) | 2.53 (Kaliningrad Oblast) | 35.0 (Astrakhan Oblast) | 5.16 (Kurgan Oblast) |
| Maximum | 16,834.89 (Republic of North Ossetia-Alania) | 16,834. 89 (Republic of North Ossetia-Alania) | 104.3 (Chukotka Autonomous Okrug) | 6339.74 (Chukotka Autonomous Okrug) |
| Average | 719.25 | 743.09 | 60.6 | 304.52 |
| Standard deviation | 2787.35 | 2782.69 | 17.8 | 1055.66 |
| Median | 40.46 | 71.18 | 54.6 | 86.09 |
| Indicators | Trend, Growth, % | Trend, Scope, % | Average Cycle Length, Months | Seasonal Scale, % |
|---|---|---|---|---|
| Minimum | −76.0 (St. Petersburg) | 4.05 (Irkutsk Oblast) | 39.6 (Stavropol Krai) | 3.38 (Komi Republic) |
| Maximum | 593.01 (Moscow Oblast) | 593.01 (Moscow Oblast) | 104.3 (Kemerovo Oblast) | 333.29 (Moscow Oblast) |
| Average | 79.44 | 91.95 | 64.2 | 90.62 |
| Standard deviation | 129.66 | 121.25 | 16.6 | 81.81 |
| Median | 48.62 | 54.63 | 63.8 | 103.84 |
| Cycle Stage at the End (December 2021) | Number of Regions | |||
|---|---|---|---|---|
| Internal Regions | Border Regions | |||
| Number | Percentage | Number | Percentage | |
| G+ growth above 0 | 8 | 22 | 11 | 30 |
| D+ drop above 0 | 12 | 33 | 11 | 30 |
| G− growth below 0 | 7 | 19 | 9 | 24 |
| D− decline below 0 | 9 | 25 | 6 | 16 |
| Total | 36 | 100 | 37 | 100 |
| Indicators | Trend, Growth, % | Trend, Scope, % | Average Cycle Length, Months | Seasonal Scale, % |
|---|---|---|---|---|
| Minimum | −83.51 (Kurgan Oblast) | 7.53 (Novosibirsk Oblast) | 41 (Bryansk Oblast) | 3.55 (Volgograd Oblast) |
| Maximum | 4004.7 (Primorsky Krai) | 4006.35 (Primorsky Krai) | 144.5 (Voronezh Oblast) | 1202.09 (Primorsky Krai) |
| Average | 444.93 | 471.89 | 63.6 | 219.9 |
| Standard deviation | 914.14 | 905.8 | 22 | 311.2 |
| Median | 58.41 | 80.33 | 57.6 | 85.23 |
| Indicators | Trend, Growth, % | Trend, Scope, % | Average Cycle Length, Months | Seasonal Scale, % |
|---|---|---|---|---|
| Minimum | −24.48 (Irkutsk Oblast) | 5.2 (Kemerovo Oblast) | 36.6 (Republic of Mordovia) | 2.74 (Perm Krai) |
| Maximum | 819.92 (Vladimir oblast) | 1003.96 (Khanty-Mansiysk Autonomous Region—Ugra) | 102.7 (Arkhangelsk oblast) | 553.03 (Vladimir oblast) |
| Average | 171.33 | 218.49 | 57.6 | 114.1 |
| Standard deviation | 203.51 | 240.18 | 14.5 | 133.65 |
| Median | 104.1 | 126.35 | 54.1 | 77.15 |
| Cycle Stage at the End (December 2021) | Number of Regions | |||
|---|---|---|---|---|
| Internal Regions | Border Regions | |||
| Number | Percentage | Number | Percentage | |
| G+ growth above 0 | 10 | 28 | 7 | 32 |
| D+ drop above 0 | 15 | 42 | 7 | 32 |
| G− growth below 0 | 2 | 6 | 4 | 18 |
| D− decline below 0 | 9 | 25 | 4 | 11 |
| Total | 36 | 100 | 22 | 100 |
| Indicators | Trend, Growth, % | Trend, Scope, % | Average Cycle Length, Months | Seasonal Scale, % |
|---|---|---|---|---|
| Minimum | −47.54 (Astrakhan Oblast) | 29.91 (Kurgan Oblast) | 56.9 (Saratov Oblast) | 3.00 (Astrakhan Oblast) |
| Maximum | 6915.61 (Samara Oblast) | 7114.67 (Samara Oblast) | 72.2 (Tyumen Oblast) | 3661.17 (Samara Oblast) |
| Average | 1919.28 | 2026.28 | 65.1 | 956.84 |
| Standard deviation | 2678.97 | 2737.91 | 6.2 | 1393.00 |
| Median | 1092.99 | 1106.43 | 65.9 | 447.93 |
| Indicators | Trend, Growth, % | Trend, Scope, % | Average Cycle Length, Months | Seasonal Scale, % |
|---|---|---|---|---|
| Minimum | Trend, growth, % | Trend, scope, % | Average cycle length, months | Seasonal scale, % |
| Maximum | −168.85 (Penza Oblast) | 49.39 (Tver Oblast) | 41.5 (Stavropolsky Krai) | 14.45 (Krasnoyarsky Krai) |
| Average | 3956.03 (Irkutsk Oblast) | 59,644.00 (Republic of Bashkortostan) | 80.0 (Moscow Oblast) | 107,330.74 (Republic of Bashkortostan) |
| Standard deviation | 512.6 | 3311.98 | 58.4 | 5313.69 |
| Median | 1096.18 | 12,942.67 | 10.9 | 23,376.72 |
| Cycle Stage at the End (December 2021) | Number of Regions | |||
|---|---|---|---|---|
| Internal Regions | Border Regions | |||
| Number | Percentage | Number | Percentage | |
| G+ growth above 0 | 2 | 9.5 | 3 | 50.0 |
| D+ drop above 0 | 11 | 52.4 | 3 | 50.0 |
| G− growth below 0 | 3 | 14.3 | 0 | 0 |
| D− decline below 0 | 5 | 23.8 | 0 | 0 |
| Total | 21 | 100 | 6 | 100 |
| Indicators | Trend, Growth, % | Trend, Scope, % | Average Cycle Length, Months | Seasonal Scale, % |
|---|---|---|---|---|
| Minimum | −1359.15 (Orenburg Oblast) | 28.23 (Chelyabinsk oblast) | 37.8 (Bryansk oblast) | 3.9 (Kursk oblast) |
| Maximum | 5202.26 (Oryol Oblast) | 5220.55 (Rostov Oblast) | 119.3 (Rostov Oblast) | 2393.18 (Oryol Oblast) |
| Average | 510.06 | 812.64 | 58.9 | 424.71 |
| Standard deviation | 1812.97 | 1706.87 | 19.1 | 817.79 |
| Median | −38.01 | 91.98 | 53.1 | 53.92 |
| Indicators | Trend, Growth, % | Trend, Scope, % | Average Cycle Length, Months | Seasonal Scale, % |
|---|---|---|---|---|
| Minimum | −107.57 (Tver Oblast) | 18.56 (Nizhny Novgorod Oblast) | 39.9 (Chuvash Republic) | 4.96 (Yaroslavl Oblast) |
| Maximum | 2,898,254.14 (St. Petersburg) | 2,898,254.14 (St. Petersburg) | 94.7 (St. Petersburg) | 114,516.84 (St. Petersburg) |
| Average | 126,458.65 | 126,609.14 | 60.6 | 5208.19 |
| Standard deviation | 604,213.31 | 604,198.5 | 13.6 | 23,833.64 |
| Median | −18.53 | 107.57 | 62.5 | 88.77 |
| Cycle Stage at the End (December 2021) | Number of Regions | |||
|---|---|---|---|---|
| Internal Regions | Border Regions | |||
| Number | Percentage | Number | Percentage | |
| G+ growth above 0 | 4 | 17 | 0 | 0 |
| D+ drop above 0 | 9 | 39 | 6 | 43 |
| G− growth below 0 | 3 | 13 | 2 | 14 |
| D− decline below 0 | 7 | 31 | 6 | 43 |
| Total | 23 | 100 | 14 | 100 |
Disclaimer/Publisher’s Note: The statements, opinions and data contained in all publications are solely those of the individual author(s) and contributor(s) and not of MDPI and/or the editor(s). MDPI and/or the editor(s) disclaim responsibility for any injury to people or property resulting from any ideas, methods, instructions or products referred to in the content. |
© 2023 by the authors. Licensee MDPI, Basel, Switzerland. This article is an open access article distributed under the terms and conditions of the Creative Commons Attribution (CC BY) license (https://creativecommons.org/licenses/by/4.0/).
Share and Cite
Khmeleva, G.A.; Semenychev, V.K.; Korobetskaya, A.A.; Kurnikova, M.V.; Fedorenko, R.; Tóth, B.I. Comparative Research of Internal and Border Regions: Analyzing the Differences in the Cyclical Dynamics of Industries for Industrial Policy and Territorial Development. Economies 2023, 11, 89. https://doi.org/10.3390/economies11030089
Khmeleva GA, Semenychev VK, Korobetskaya AA, Kurnikova MV, Fedorenko R, Tóth BI. Comparative Research of Internal and Border Regions: Analyzing the Differences in the Cyclical Dynamics of Industries for Industrial Policy and Territorial Development. Economies. 2023; 11(3):89. https://doi.org/10.3390/economies11030089
Chicago/Turabian StyleKhmeleva, Galina Anatolievna, Valerii Konstantinovich Semenychev, Anastasiya Aleksandrovna Korobetskaya, Marina Viktorovna Kurnikova, Roman Fedorenko, and Balázs István Tóth. 2023. "Comparative Research of Internal and Border Regions: Analyzing the Differences in the Cyclical Dynamics of Industries for Industrial Policy and Territorial Development" Economies 11, no. 3: 89. https://doi.org/10.3390/economies11030089