Article

The Effect of Inflation Targeting (IT) Policy on the Inflation Uncertainty and Economic Growth in Selected African and European Countries

by
Shelter Thelile Nene
,
Kehinde Damilola Ilesanmi
* and
Mashapa Sekome
Department of Economics, Faculty of Commerce, Administration and Law, University of Zululand, Richards Bay 3900, South Africa
*
Author to whom correspondence should be addressed.
Economies 2022, 10(2), 37; https://doi.org/10.3390/economies10020037
Submission received: 23 September 2021 / Revised: 6 December 2021 / Accepted: 7 December 2021 / Published: 31 January 2022
(This article belongs to the Special Issue Financial Economics: Theory and Applications)

Abstract

:
The study assessed the effect of inflation targeting (IT) policy on inflation uncertainty and economic growth in African and European IT countries. This study contributes to the existing knowledge by analysing and comparing the African IT and European IT countries using two advanced approaches which include the Generalized Autoregressive Conditional Heteroscedasticity (GARCH) and Panel Vector Autoregressive (PVAR). To determine how the IT policy affects the inflation uncertainty in selected countries, time series techniques were employed. Panel data approaches were used to determine the effect of inflation targeting on economic growth in the selected countries. The results are as follows: (1) Inflation Targeting policy is insignificant in reducing inflation uncertainty in South Africa, and the effect of the policy in Ghana is inconclusive; (2) The IT policy has a significant impact in reducing inflation uncertainty in European countries (i.e., Poland and the Czech Republic); (3) Inflation targeting has a negative impact on economic growth in African Countries; (4) The policy has a positive impact on economic growth in European Countries; (5) In comparison to European countries, the strategy has a negligible impact on economic growth in Africa. Overall, the results suggest that European countries inflation targeting regimes are more credible in terms of reducing the level of inflation uncertainty and sustaining economic growth compared to African countries. In this respect, policymakers must ensure that they assess the economic condition of an individual country before implementing such a policy.

1. Introduction

The efficiency of inflation targeting (IT) has gotten a lot of coverage in the existing literature, notably among studies of developing countries (e.g., Brito and Bystedt 2010; Thornton 2016; and Ardakani et al. 2018). There are divergent opinions among different studies on the effect of inflation targeting on both inflation uncertainty and economic growth. Studies such as the ones conducted by Karahan (2012) and Ardakani et al. (2018) indicate that the effect of inflation targeting is inadequate in reducing inflation uncertainty they emphasise that it resulted in high uncertainty. While on other hand, Broto (2008) argues that inflation targeting lowers inflation and inflation uncertainty. Moreover, Gylfason and Herbertsson (2001) claim that inflation has a global negative effect on medium and long-term economic growth. Though the magnitude of the impact depends on the level of inflation (Hartmann and Roestel 2013) This is also contrary to the claim made by Sarel (1996), which is that the adoption of a monetary policy framework that focuses explicitly on inflation serves as a tool to promote economic growth.
The objective of this study is to examine the effectiveness of inflation targeting policy on inflation uncertainty and economic growth in some selected African and European economies. The selection of countries involved in the analysis is restricted by the data availability. Furthermore, because economic conditions in African and European countries differ, the study focuses on whether the benefits of implementing IT Policy are universal or whether certain economic conditions are required to make IT Policy more effective in all developing countries. Therefore, not only do the findings of this study contribute to the current literature, but they also compel policymakers’ attention. According to Ardakani et al. (2018), IT was adopted more broadly and formally in 1990 by New Zealand and later by the central banks of larger economies such as the Bank of England, Bank of Japan and other European Central Banks. In developing economies, however, the inflation targeting mechanism is less common. This is particularly evident when looking at African countries, where only two (South Africa and Ghana) have specifically implemented inflation targeting regimes as official monetary policy (Phiri 2016).
According to Nasr et al. (2015), the inflation targeting regime as a monetary policy framework was formally adopted in South Africa in February 2000. On the other hand, the bank of Ghana began the official implementation of inflation targeting in May 2007 (Kovanen 2011). Looking into European countries, the Czech Republic adopted an inflation targeting regime explicitly in early 1998; while Poland’s Monetary Council declared in September 1998 that it would reform its monetary policy by implementing an inflation targeting regime (Horská 2001). Furthermore, according to Jahan (2012) and Hammond (2012), Romania and Hungary declared inflation targets in December 2005 and June 2001, respectively, among European countries. The inflation rate pattern for South Africa, Ghana, Poland, and the Czech Republic is shown in Figure 1.
Observing Figure 1, South Africa enjoyed low rates of inflation post inflation targeting. However, there has been inflation fluctuation in recent years. This may be the results of the rand weakening, junk status and other supply-side factors such as drought. Specifically, Ghana targeted inflation in the second quarter of 2007. Ghana on the other hand experienced a high rate of inflation post inflation targeting. Yet, Poland and the Czech Republic followed the same trend as SA after implementing the IT policy. Both European countries enjoyed low rates of inflation during the years of inflation targeting.
Inflation targeting monetary policy regime emphasises transparency, credibility, independence and accountability (Phiri 2016). According to Bernanke and Woodford (2004), the prerequisite of a successful IT monetary framework is to fully understand the transmission mechanism for monetary policy. Therefore, an effective communication strategy can help the authorities better manage the trade-offs they face. The central bank will manage inflation expectations if market participants understand current policy and how future decisions can be decided (Agénor and da Silva 2019). In addition, according to Fromlet (2010), monetary policy instruments used in an inflation targeting regime would be ineffective if the requisite preconditions were not met, and they could increase output volatility. On the other hand, Meerza (2020) indicate that completing prerequisites before IT adoption ensures successful IT implementation only in the short term.
Moreover, Karahan (2012) criticised IT Policy for being inflation centred only. He argues that IT often aims at achieving price stability while ignoring unemployment and output which are equally important for the economy (Karahan 2012). Another argument against inflation targeting is that monetary policymakers are unable to completely monitor inflation due to the unpredictability of monetary policy consequences (Fromlet 2010; Sudacevschi 2011). Inflation uncertainty on the other hand is the critical state of not knowing the future direction of inflation. Under this scenario, savers prefer short-term investment; debtors prefer short-term debts, while firms prefer short-term borrowing (Erdem and Yamak 2016).
This study also aims to test Karahan’s (2012) argument that committing to inflation targeting may be detrimental to economic growth. Therefore, this study aims to examine whether Inflation Targeting Policy has a negative effect on inflation uncertainty and economic growth. In general, studies examining the success of inflation targeting rely on comparisons between inflation-targeting and non-targeting nations, or within-country comparisons throughout pre- and post-inflation-targeting eras, and some compare developing to industrialized countries. Abo-Zaid and Tuzemen (2012), Ardakani et al. (2018), and Antonakakis et al. (2021) are just a few examples. This is the first study that we are aware of that uses the GARCH and PVAR methodologies to examine and compare the impact of inflation targeting in undeveloped countries only. This analysis is conducted within the context of selected countries (South Africa, Ghana, Czech Republic, and Poland).
The rest of the paper is structured as follows: Section 2 discusses the theoretical reasoning and the recent empirical studies on inflation, inflation targeting, inflation uncertainty and economic growth; Section 3 describes the data and introduces GARCH and PVAR methods; the empirical results of the time series and panel data analyses and discussion of findings are presented in Section 4; while Section 5 concludes the paper.

2. Literature Review

2.1. The Theoretical Reasoning

The relation between inflation, inflation uncertainty and output growth was explained by several theorists including Okun (1971); Friedman (1977); Cukierman and Meltzer (1986); Pourgerami and Maskus (1987); Ungar and Zilberfarb (1993); and Holland (1995). The theorists Okun (1971) and Friedman (1977) argue that inflation uncertainty is harmful to real economic activity. The theory behind the adverse impact of inflation volatility on output growth is that uncertainty distorts allocative efficiency and investments (Friedman 1977). Regarding the relationship between inflation and inflation uncertainty, theorists have divergent views. Some theorists such as Okun (1971); Friedman (1977); and Cukierman and Meltzer (1986) claim a positive relationship while others including Ungar and Zilberfarb (1993); Pourgerami and Maskus (1987); and Holland (1995) argues that there is a negative relationship; moreover, these theories differ in causality.
Okun (1971) is one of the first to discover that countries with a high inflation rate often have a large standard deviation of inflation, implying that they have a high level of inflation uncertainty. According to Okun (1971), there is a positive relationship between inflation and inflation volatility because monetary policy becomes more unpredictable during high inflation periods. Friedman (1977) also support that, an increase in inflation raises inflation uncertainty. In contrast to Okun’s (1971) and Friedman’s (1977) view that high inflation creates uncertainty, Cukierman and Meltzer (1986) argue that increased uncertainty is the one that results in higher inflation. According to Cukierman and Meltzer (1986), an increase in inflation volatility increases the ideal average inflation rate by raising the policymaker’s incentive to generate inflation shocks. This suggests that while there is more inflation uncertainty, the monetary authority’s actions lead to more inflation (Cukierman and Meltzer 1986).
Ungar and Zilberfarb’s (1993); and Pourgerami and Maskus’s (1987) hypothesis claims that as inflation rises, economic agents can devote more energy to forecasting inflation, decreasing inflation uncertainty. Likewise, Holland (1995) suggests that inflation volatility and average inflation have a negative relationship. However, Holland (1995) shows the causality from higher inflation volatility to lower inflation. Holland (1995) argues that high inflation volatility is likely to lead to lower inflation due to the stabilization objectives of policymakers. In response to high inflation uncertainty, an independent central bank would be compelled to tighten monetary policy by raising interest rates, lowering inflation over time (Holland 1995).
IT Policy was promoted in the early 1990s owing to the perceived weakness of previous policies, such as monetary and exchange rate targets. Since 1990, many theorists have made theoretical justifications regarding the IT Policy regime. This includes Svensson (1997); Mishkin (2000); and Van der Merwe (2004). According to Svensson (1997), if the central bank selects its inflation forecast as the target, it will result in lower inflation uncertainty. Moreover, according to Mishkin (2000), IT can improve monetary discipline and reduce harmful inflation volatility. Furthermore, Van der Merwe (2004) opined that inflation targeting is a formalised approach to achieve the economic objective of sustainable high economic growth.

2.2. The Recent Empirical Studies

There are some divergent views among the recent empirical studies concerning the effect of inflation targeting (IT) on inflation uncertainty. Ardakani et al. (2018) argue that; IT policy regime does not minimise the uncertainty of expected inflation. Ardakani et al. (2018) used a semiparametric single index method, and their results manifested that IT policy has no significant effects on either inflation or inflation variability. However, studies such as Tas and Ertugrul (2013); Taş (2012); Bataa et al. (2013); Daboussi (2014); Bratsiotis et al. (2015); Valera et al. (2018); and Antonakakis et al. (2021) claim that inflation targeting reduces inflation uncertainty.
Tas and Ertugrul (2013) found that inflation variance is significantly lower after IT adoption in some countries (New Zealand, Chile, Colombia, Indonesia, Israel, Mexico, Poland, Romania, and Turkey). According to Tas and Ertugrul (2013), countries with higher transparency, economic and fiscal freedom indices are more likely to have low inflation variances after IT adoption. Moreover, Taş (2012) examines the effect of inflation targeting on inflation volatility in 19 developed and emerging economies using the PARCH and GARCH methodologies and finds evidence that inflation targeting regimes have largely helped to reduce inflation uncertainty. Futhermore, Bataa et al. (2013) examined structural breaks in short-term cross-country inflation relations for major G-7 economies using the conventional VAR system. According to Bataa et al. (2013), inflation targeting monetary policy regimes are more effective in preserving price stability while also reducing inflation uncertainty. Bratsiotis et al. (2015) add that when inflation is the main focus of policy, the persistence of inflation is lower after the adoption of inflation targeting.
In addition, Daboussi (2014) found that inflation targeting substantially reduces inflation uncertainty and improves economic efficiency. Daboussi (2014) used an expanded form of difference-in-difference estimation methodology to perform a panel analysis of inflation targeting and non-targeting developed countries. Valera et al. (2018) and Antonakakis et al. (2021) also back up the claim that most inflation-targeting countries have lower inflation variances since implementing the policy. Valera et al. (2018) employed a novel panel GARCH model to examine the relationship between inflation targeting, inflation level and inflation volatility for eight Asian countries. Meanwhile, Antonakakis et al. (2021) used the cosine-squared cepstrum methodology in 24 developed and developing countries.
Looking at the effect of IT policy on economic growth, Abo-Zaid and Tuzemen (2012) argue that after adopting an inflation-targeting regime, both developing and developed countries experience lower and more stable inflation as well as higher and more stable GDP growth. The Diffs-in-Diffs strategy and cross-country data from 1980 to 2007 were used to test this hypothesis (Abo-Zaid and Tuzemen 2012). According to Petreski (2014), during the economic crisis, inflation targeters perform better than non-targeters in terms of output growth. Moreover, Mollick et al. (2011) employed a static panel data method to examine the effects of inflation targeting (IT) on output growth for the sample period of 1986–2004. Their findings also show that adopting a full-fledged IT regime leads to higher output income per capita in both developed and developing economies (Mollick et al. 2011).
Likewise, e Souza et al. (2016) suggests that the implementation of an IT system has a positive constant impact on output growth in developed countries. e Souza et al. (2016) estimated the fixed effect models using macro panel data. In addition, Fosu (2015) investigated the effect of inflation targeting in Ghana and find it to be effective. According to Fosu (2015), Ghana experienced a significant decline in the inflation rate and an improvement in the level of economic growth after the adoption of inflation targeting. In addition, according to Ewurum et al. (2017), IT countries experienced lower inflation and higher economic growth than counties that did not adopt the policy. However, studies such as Mavikela et al. (2019); Fouejieu (2013); Kumo (2015); Puni et al. (2014); as well as Bleaney et al. (2020) claim that inflation targeting is not effective in promoting economic growth.
Mavikela et al. (2019) investigated the relationship between inflation and economic growth in African inflation-targeting countries. Using the quantile regression method, Mavikela et al. (2019) examined two SSA inflation-targeting nations, Ghana and South Africa. Their findings suggest that the existing inflation target ranges followed by the Central Banks of Ghana and South Africa are hindering economic growth (Mavikela et al. 2019). Moreover, Fouejieu (2013) argues that there is no significant difference between targeters and non-targeters regarding inflation rate and GDP growth. The study investigated the effects of the 2008/2009 financial crisis on inflation targeters and non-targeters by applying the difference in difference method (Fouejieu 2013).
Futhermore, Kumo (2015) looked at the effect of inflation targeting and inflation volatility on economic growth in South Africa during the pre-targeting and post-targeting periods. Inflation targeting, he discovered, is effective in lowering inflation rates and volatility (Kumo 2015). According to Kumo (2015), however, the decrease in inflation rate and volatility did not translate into real economic growth. Puni et al. (2014) also support Kumo (2015) on the claim that achieving a decline in inflation volatility does not translate into strong economic growth. According to Thornton (2016), as compared to the average experience with other monetary regimes, adopting an inflation-targeting regime does not help developing countries minimize inflation and growth volatility.
Bleaney et al. (2020) reveal that inflation targeting as a monetary policy is not effective. Bleaney et al. (2020) found out that the inflation rate has remained persistently high in Ghana during the inflation targeting period (2007–2017). The inflation level exceeded the inflation targeting band by four percentage points on average (Bleaney et al. 2020). This is in line with the claim made by Heintz and Ndikumana (2011), that IT is inappropriate for Sub-Saharan Africa countries. On the other hand, using a structural vector error-correction model, Krušec (2011) identified that, IT policy is effective in the European countries including Poland and the Czech Republic. Ciżkowicz and Rzońca (2015) also support that IT policy is an effective approach. According to Ciżkowicz and Rzońca (2015), the National Bank of Poland does not need to search for an alternative to inflation targeting. However, Högenauer and Howarth (2016) claim that the European Central Bank has been pushed to adopt a variety of policies as a result of the combined challenges of the sovereign debt crisis, banking crisis, and economic recession, indicating a shift in its interpretation of the Treaty on European Union’s low inflation mandate (Maastricht Treaty).

3. Methodology and Data

3.1. Methodology

The employed the Generalized Autoregressive Conditional Heteroscedasticity (GARCH) approach to measure inflation uncertainty, while a Panel Vector Autoregressive (PVAR) technique is used to determine the impact shock of Inflation Targeting (IT) on economic growth.

3.1.1. GARCH Model Approach

Rather than simply estimating a variability measure from past results, the GARCH model calculates a model of the variance of unpredictable innovations in a variable. There are several forms of GARCH modelling, the following specific form of GARCH (p,q) model from Bollerslev (1986) is used to model unanticipated uncertainty; it is in line with Kumo (2015):
y t = 0 , t + 1 , t y t 1 + ε t
ε t = H t 1 / 2 u t ,   u t ~ N ( 0 , 1 ) ,
a n d ,   ε t ~ N ( 0 , H t )
where y t is the current monthly inflation rate and y t 1 presents the previous monthly inflation rate. ε t is the conditional error term and H t represents the conditional variance at time t. To account for possible asymmetries, the exponential GARCH model is employed. In this case, the time-varying variance ( H t ) which is a proxy for inflation uncertainty can be described by the following EGARCH (1,1) model which was proposed by Nelson and Cao (1991):
log ( h t ) = ω + φ log ( h t 1 ) + α ( | ε t 1 | h t 1 2 / π ) + γ ε t 1 h t 1
Following the previous IT studies (i.e., Kontonikas 2004; Miles 2008 and Kaseeram and Contogiannis 2011), to determine the effect of IT on inflation uncertainty, an IT dummy is added into EGARCH (1,1) conditional variance equation. The specification can be stated as follows:
log ( h t ) = ω + φ log ( h t 1 ) + α ( | ε t 1 | h t 1 2 / π ) + γ ε t 1 h t 1 + σ   D t
Nelson and Cao (1991) claim that EGARCH (1,1) model does not have restrictions in the parameters. In this expression, the conditional variance depends on both the size of parameter α and the sign of parameter γ . In the case where the values of γ are negative, h t increases more rapidly as a function of | ε t 1 | when ε t 1 is negative than when it is positive. Moreover, an increase in inflation causes more uncertainty when γ is positive, while a decline in inflation causes less inflation uncertainty. Furthermore, since the EGARCH method models the log of the conditional variance, the leverage effect is exponential. In general, the news impact is asymmetric if γ 0 . Parameter φ captures persistence in the conditional variance modelling process. The closer this parameter gets to unity, the more serial correlation is present in the data (Gurgul et al. 2007). D t is a dummy variable equalling 1 during the inflation targeting period and zero otherwise. Moreover, σ represents the coefficient of the inflation targeting dummy.

3.1.2. PVAR Model Approach

Furthermore, the study utilises a balanced panel VAR approach to analyse the effect of inflation targeting on economic growth. Four variables are employed in the analysis: Consumer Price Index (CPI) representing Inflation, Gross Domestic Product (GDP) representing Economic Growth, Interest Rate as a Policy Rate, and Real Effective Exchange rate. Small open economies are vulnerable to exchange rate movements that why the Real Effective Exchange rate is added as the fourth variable. Correspondingly, the IT dummy is also added as an exogenous variable to determine the effect of IT on economic growth. The following first-order panel VAR equation represents the stated endogenous variables;
Y i t = α 0 + α 1 Y i , t 1 + α 2 Y i , t 2 + + α s Y i , t s + ε i t
i { 1 , 2 , 3 ,   ,   N } , t { 1 , 2 , 3 ,   ,   T i }
where Y i t is the (4 × 1) vector of endogenous variables for country i and year t . It includes the CPI to measure inflation rate (π), GDP per capita to measure economic growth (X), policy rate (R) and Real Effective Exchange rate (E). α 0 is a (4 × 1) vector of constants, α 1 , 2 , , s is a (4 × 4) matrix of coefficient estimates, ε i t is a vector of the white noise error term, while i is a cross-sectional identifier and s is the maximum lag length of each variable. The optimal lag length is selected by observing the value of the Akaike-Information-Criterion (AIC) and Schwarz-Bayesian Criterion (SBC). Four selected countries (i.e., South Africa, Ghana, Czech Republic and Poland) are represented by the letter i in the model. This model representation is adopted from Abrigo and Love (2016).

3.2. Sample and Data

The empirical work employs Consumer Price Index (CPI), Gross Domestic Product, Interest Rate and Real Effective Exchange rate data for respective countries. As mentioned in the introduction section, the selection of countries is restricted by the data availability, as well as the fact that only two African countries target inflation. The analysis covers the sample period 1996 to 2019. The IT is represented by the dummy variable, where equals 1 during the inflation targeting period and zero otherwise. South Africa, Ghana, Poland and the Czech Republic targeted inflation explicitly in the year 2000, 2007, 1998 and 1997, respectively. The empirical analysis is conducted using two different techniques (i.e., GARCH and PVAR model). GARCH model requires high-frequency data. Therefore, CPI monthly data from 1995M02 to 2020M01 is utilized to estimate the GARCH model. In addition, Monthly CPI is converted to Monthly Inflation Rate using the formula, π t = C P I t C P I t 1 C P I t 1 × 100 . On the other hand, the PVAR model is estimated using quarterly data for a sample period 1996Q1 to 2019Q2. Both monthly and quarterly CPI data are obtained from International financial statistics (IFS). Selection of the starting and ending period is based on data availability. However, it allows the researcher to compare the pre-IT period and post-IT period for all four countries.

4. Empirical Results and Discussion

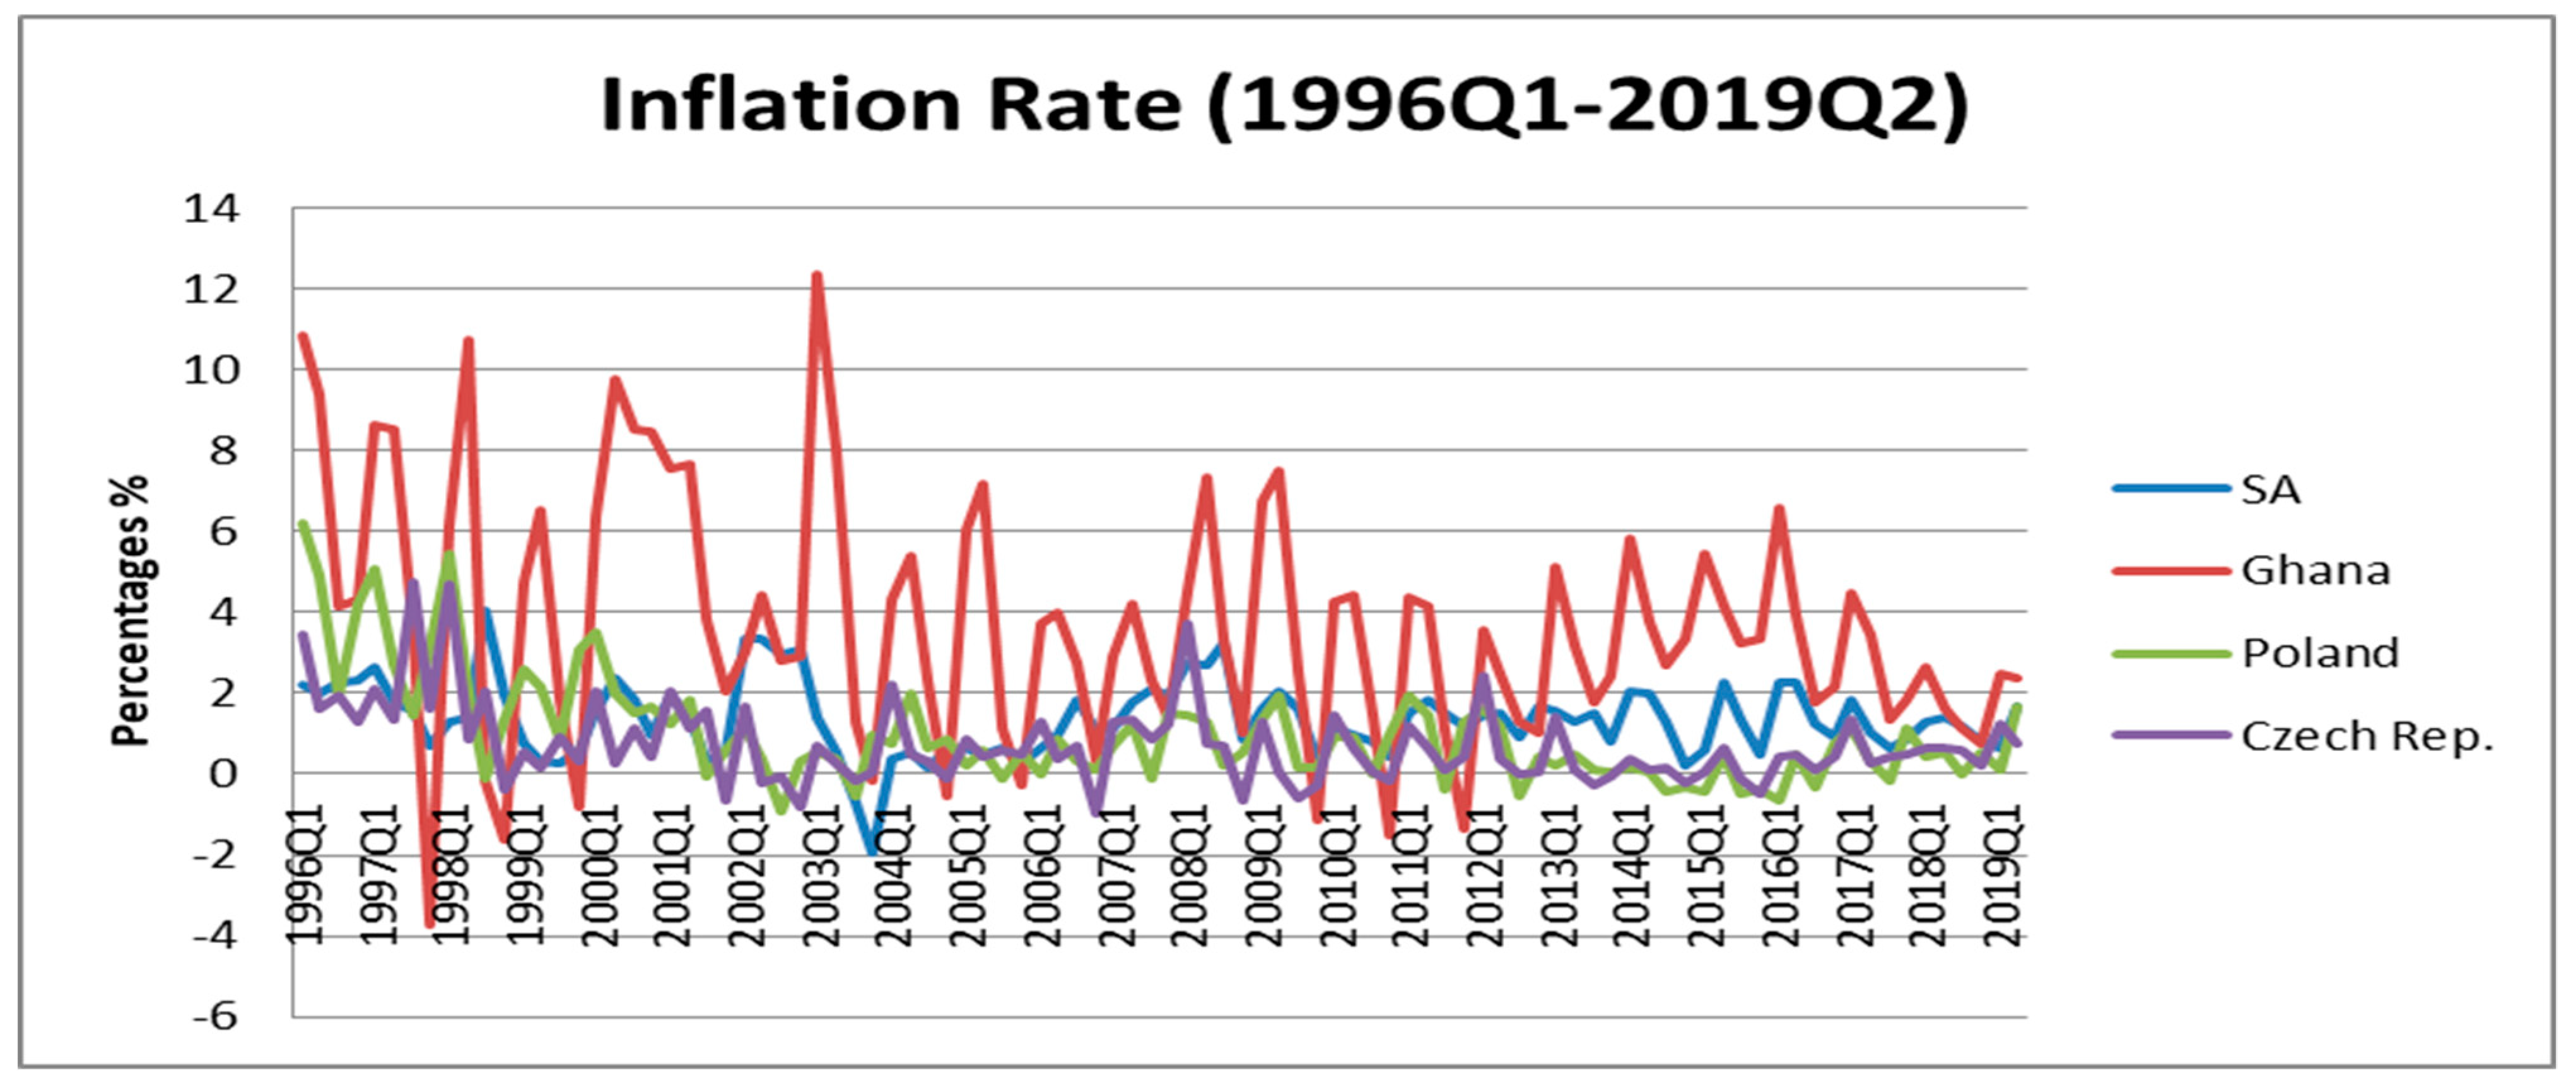
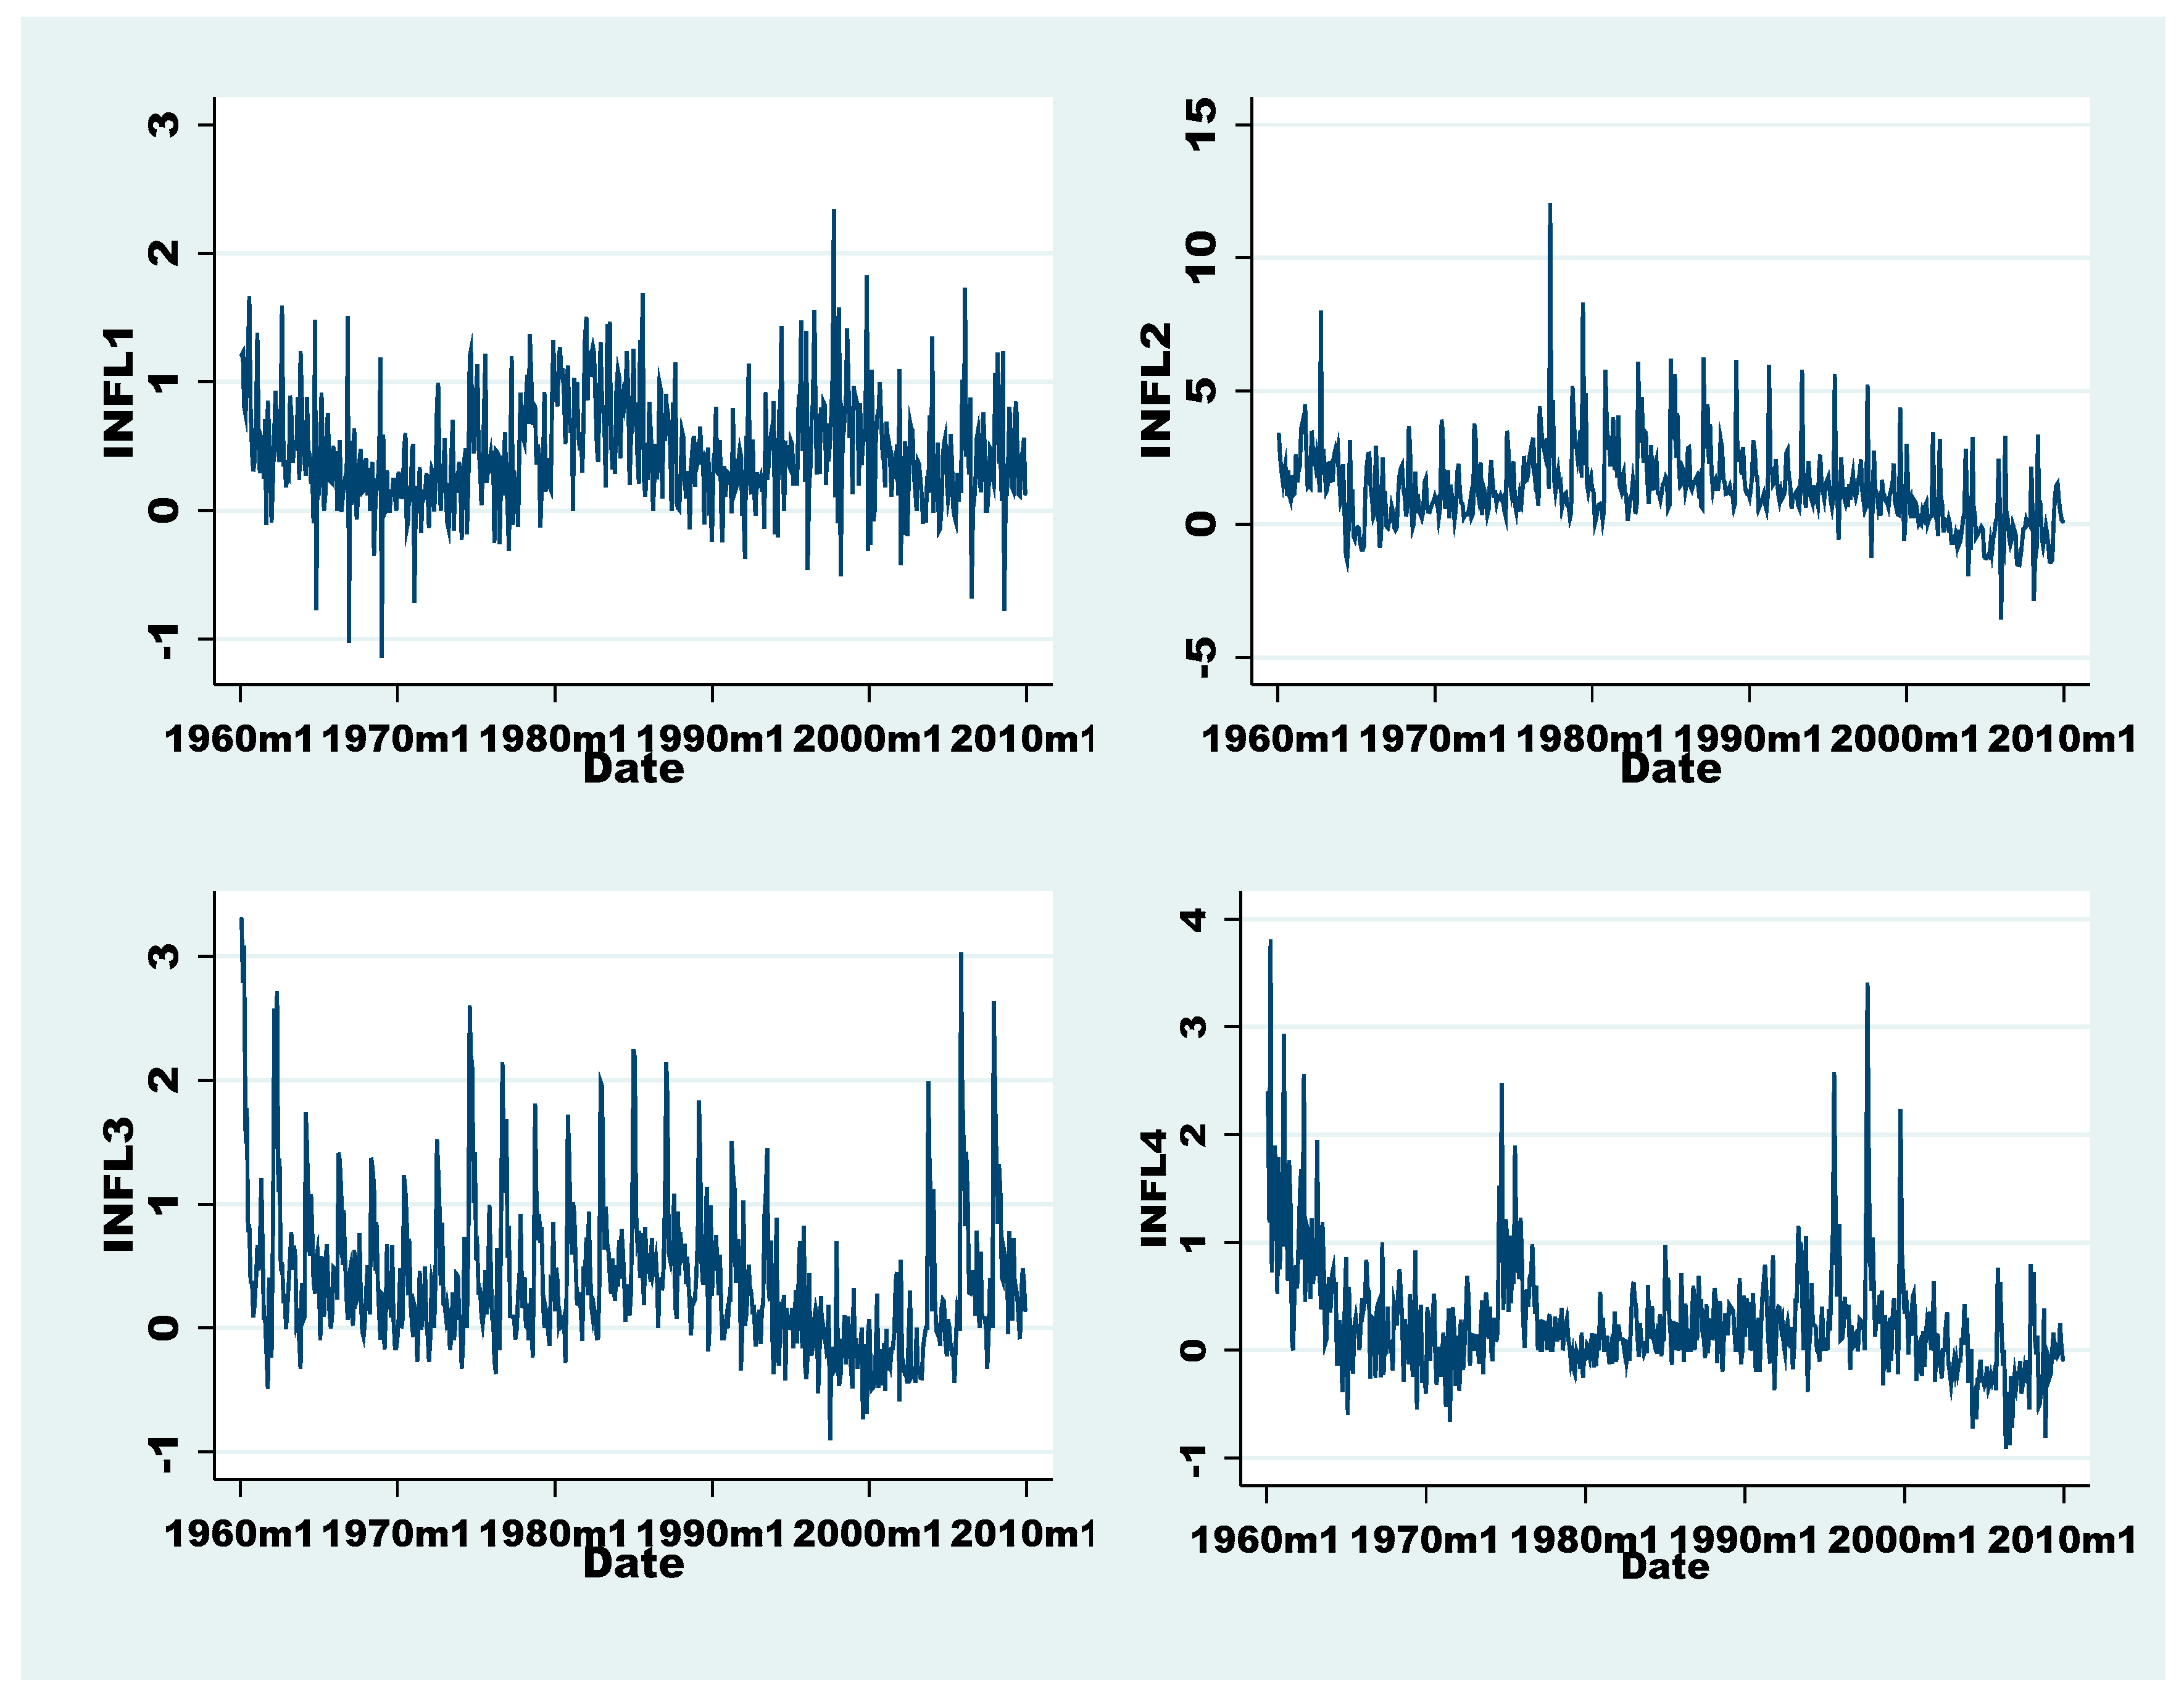
4.1. Time Series Analysis

Time Series Analysis starts with the descriptive statistics for the inflation series as presented in Table 1. INFL1, INFL2, INFL3 and INFL4 denote the inflation series for South Africa, Ghana, Poland and the Czech Republic, respectively. The average inflation rate for the four countries between 1995M02 and 2020M01 was 0.44, 1.32, 0.36, and 0.26 correspondingly. From all the inflation series, the most volatile series expressed in terms of the standard deviation is INFL2 (inflation rate for Ghana).
Based on the estimated skewness statistics, all series except INF1 are skewed to right. They have a long-run tail (positive skewness). The value of kurtosis is greater than 3.0 (the normal value for normal distribution) for all series, and this means that they are leptokurtic. Looking at the p-values of the Jarque-Bera statistics, the null hypothesis of a normal distribution is rejected at a 1 percent level of significance. This implies a deviation from normality. Values in parenthesis are p-values.
To test whether the inflation series for all four countries are stationary or not, the study employed conventional augmented Dickey-Fuller (ADF) and Phillips-Perron (PP) tests. Table 2 displays the t-test, t-critical and probability values for each test. Taking Phillips-Perron (PP) test as the benchmark test in this analysis, the null hypothesis of the presence of a unit root in the data is rejected at the one percent level of significance. This implies that all series are stationary and integrated at levels which is I(0).
Additionally, serial correlation, heteroskedasticity and volatility clustering tests on the residuals are generated. These tests help to verify whether GARCH specification is suitable to generate a conditional variance as a measure of inflation. The results are presented in Table 3 and Figure 2, respectively.
Table 3 displays the Ljung-Box Q-statistics at one lag Q(1), as well as the chi-square test statistics. Values in parenthesis are p-values. Based on the statistical insignificance of the Ljung-Box Q-statistics, it can be concluded that the residuals are free of serial correlation. In addition, given the statistical significance of the chi-square test statistics of the LM test, the existence of autoregressive conditional heteroscedasticity in the residuals is very clear. Looking at the probabilities of the chi-square test statistics, the inflation rate series for South Africa (INFL1), Ghana (INFL2), Poland (INFL3) and Czech Republic (INFL4) are significant at 5, 10, 1 and 1 percent level, respectively. This characterises the presence of ARCH effects. The graphical illustration of inflation rate residuals is depicted in Figure 2.
Figure 2 show that residuals vary over time. This implies volatility clustering, which is in line with Engle (2001, p. 158). Under these data characteristics, GARCH model results can be generated to estimate inflation uncertainty. Following the analysis of data characteristics, inflation uncertainty is estimated using EGARCH (1,1) model as described in Section 3. Table 4 shows EGARCH (1,1) model results for South Africa, Ghana, Poland and the Czech Republic without the IT dummy, and Table 5 includes the dummy.
Parameter ω represents the constant value; φ is the persistence in the conditional variance. In addition, α and γ are the coefficients of lagged residuals, and σ is the IT dummy coefficient. Looking at the results for South Africa, although the parameter σ is negative in Table 5, it is statistically insignificant. This implies that inflation targeting policy is insignificant in reducing inflation uncertainty. Likewise, the inclusion of the IT dummy in the model increased the conditional variance persistence captured by parameter φ. Parameter φ increased from 0.389 to 0.458. This is similar to the findings of Karahan (2012) and Ardakani et al. (2018) who concluded that the policy has no significant effects on inflation uncertainty. In the case of Ghana, parameter σ is negative and statistically significant. However, the corresponding standard error of the conditional variance persistence is high in the presence of the IT dummy. Therefore, the effect of inflation targeting policy in Ghana is inconclusive. This could be caused by the price dynamics of the economy.
Evidently from Table 4 and Table 5, inflation targeting policy has a significant impact in reducing inflation uncertainty in European countries. Observing the results for Poland and the Czech Republic, parameter σ is negative and statistically significant in both countries. Moreover, conditional variance persistence (parameter φ ) decreased from 0.982 to 0.937 for Poland. Together with the corresponding standard error, parameter φ also decreased in the Czech Republic case. The standard error decreased from 0.016 to 0.003. The news impact is asymmetric in all cases because γ 0 for every country. In addition, γ is positive. This implies that an increase in inflation causes more inflation uncertainty, and a decrease in inflation produces less uncertainty. EGARCH (1,1) model results indicate that inflation targeting policy is more effective in reducing inflation uncertainty in selected European Countries than in African Countries. This could be because; the price dynamics and economic conditions of European countries are more superior to African countries. This also indicates that African countries have less transparency, economic and fiscal freedom compared to European countries. The following section discusses the panel data analysis.

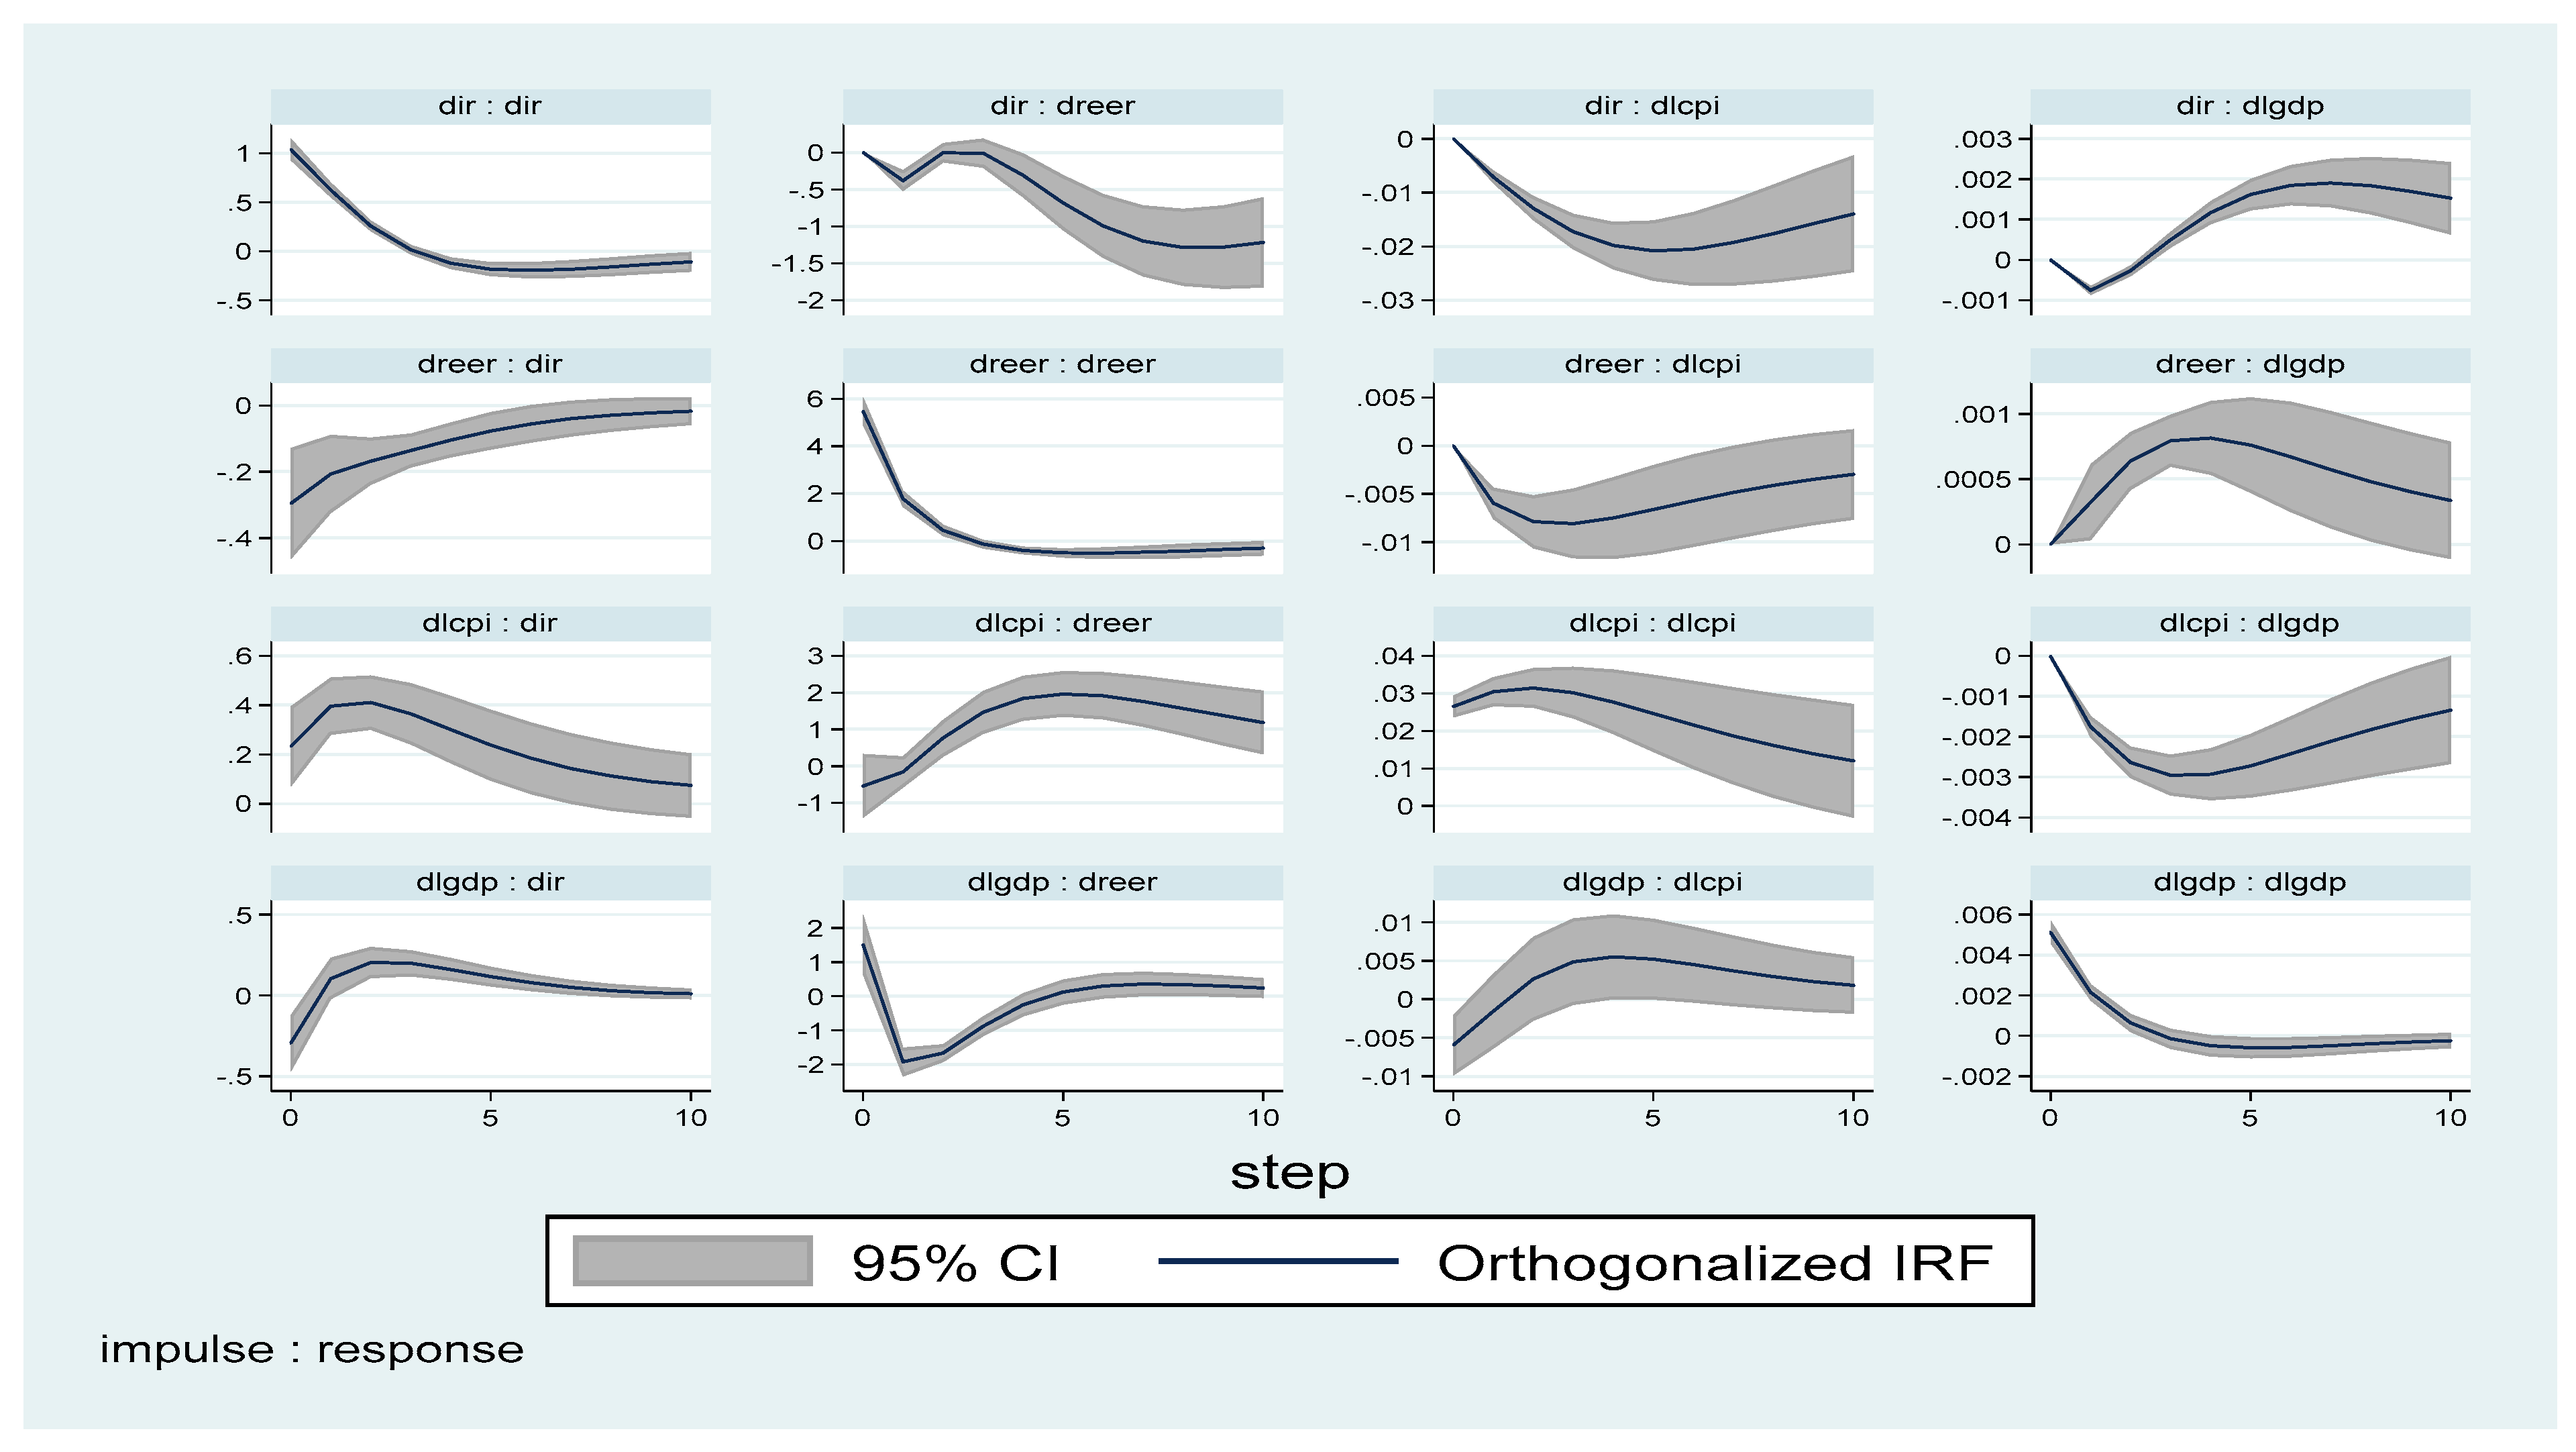
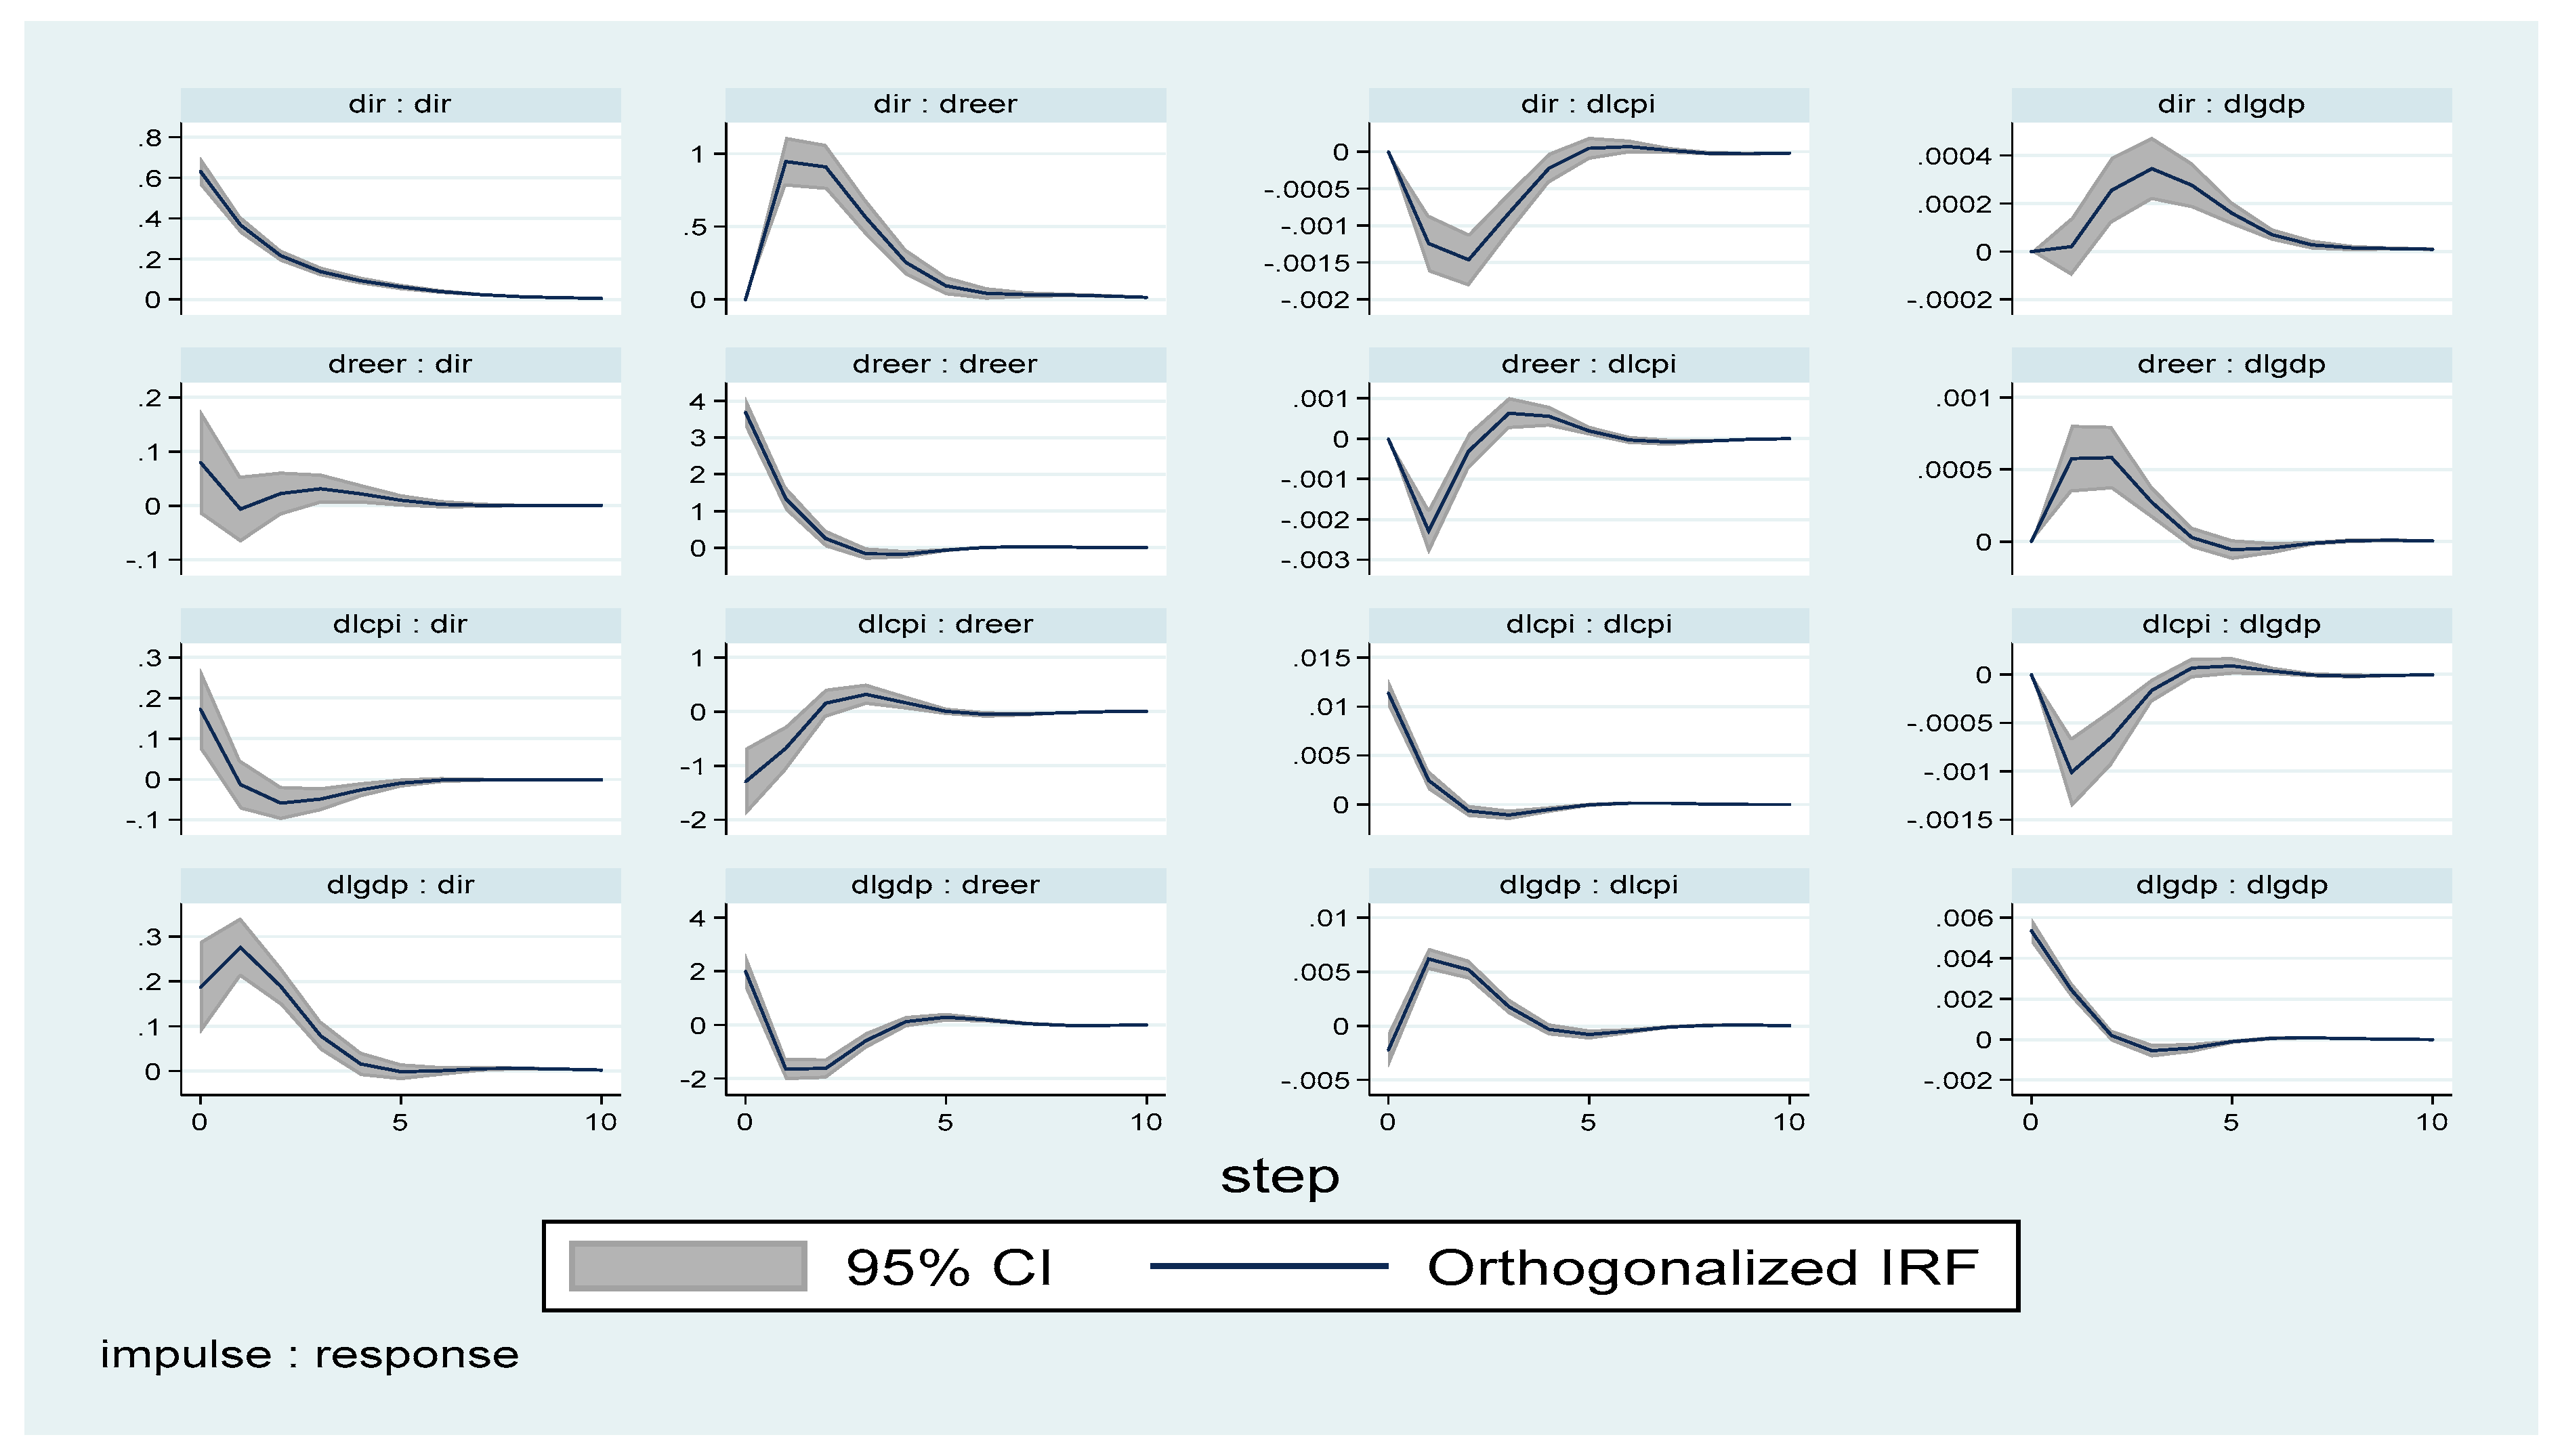
4.2. Panel Data Analysis

The PVAR is conducted to examine the effect of inflation targeting on economic growth. To check the proprieties of the variables, cross-sectional independence and cointegration tests were performed. Table 6 shows the results of Pesaran’s (2004) cross-sectional dependence (CD) test, Friedman’s (1937) statistic, Frees’ (1995) test statistic, and Pedroni cointegration test. The null hypothesis of no cross-sectional dependence is strongly rejected by the results of the three cross-sectional independence tests. Furthermore, the Pedroni test strongly rejects the null hypothesis of no cointegration.
Similar to the case of time series analysis, panel data stationarity is also conducted to avoid misleading parameter estimates. For robustness purposes, three panel unit root tests were employed in this study. Precisely, the selected tests are Im et al. (2003) Harris and Tzavalis (1999), and Breitung and Das (2005) panel stationarity tests. Table 7 presents results from the three panel stationarity tests.
As indicated in Table 7, the tests exhibit that all variables are non-stationary in levels and stationary after first differencing. The optimal number of lags to be included in the PVAR model is identified by the Akaike, Schwarz and Hannan-Quinn information criteria. After testing the properties of the data, the estimation of the models was carried out. Table 8 shows the PVAR model outputs for African and European countries are denoted by (AC) and (EC), respectively.
Looking into the case of African countries (AC), the probability values of the panel VAR output shows that all the explanatory variables except dreer, have a significant impact on the dependent variable. Their P values are significant at a one percent level. This implies that only three independent variables (i.e., dlcpi, dir and dum) play an important role in explaining economic growth (dlgdp). The coefficients of dlcpi and ir are negative; this means that inflation (dlcpi) and interest rate (ir) have a negative impact on economic growth (dlgdp). The inflation targeting (dum) coefficient is positive and statistically different from zero. Therefore, it could be claimed that IT policy had an impact on economic growth reaction to shocks.
In the European countries (EC) case, it is evident that all the explanatory variables except interest rate have a significant impact on the dependent variable economic growth measured by GDP per capita. In this case, dir does not play an important role in explaining economic growth (dlgdp). Similar to the case of African countries, the inflation targeting (dum) coefficient is positive and statistically different from zero. Economic growth response to inflation targeting shock and other variables is also demonstrated by the impulse response function. Figure 3 and Figure 4 presents the impulse response functions for African and European countries, respectively.
The IRFs present two periods, which is a short run from zero to four years and a long run from five to 10 years, therefore, the orthogonalised IRF is interpreted aligned with the short-run and long-run periods as defined. The interest of this study is on the last row of Figure 3. Looking at impact shock of inflation targeting on the behaviour of inflation (dlcpi) and economic growth (dlgdp) in the last row, it shows that a 1 percent standard deviation shock on inflation initially had a positive impact on economic growth in the short-run (from period zero to period five). This is then followed by a negative reaction in the long run. The results imply that the shock on inflation affects economic growth negatively only in the long run. Based on impulse response results, it can be concluded that Inflation Targeting Policy has a negative impact on economic growth in African countries (i.e., South Africa and Ghana). The results support Karahan (2012). According to Karahan (2012), committing to an inflation target can be harmful to economic growth.
Looking at the last row of Figure 4, one can observe the impact shock of inflation targeting and inflation (dlcpi) on economic growth (dlgdp). Similarly, in the case of European countries, at the initial stage, a 1 percent standard deviation shock on inflation had a positive impact on economic growth. However, this did not last for long as economic growth started to decline sharply and reversed back to a steady state region. In the long run, economic growth showed some nil recovery from period five to period 10. This means that, in the short-run, inflation targeting policy had a negative impact on economic growth in European countries (i.e., Poland and the Czech Republic). However, it showed some positive outcomes in the long run. Moreover, the impulse response result shows that the impact shock of inflation targeting on the behaviour of inflation (dlcpi) and economic growth (dlgdp) is much stronger among the European countries compared to African countries. This is also indicated by the inflation targeting (dum) coefficients from the PVAR outputs. In the case of European countries, the dum coefficient is 0.0184 and it is greater than the one for African countries which is about 0.0019.
As indicated by the impulse response results and the PVAR model coefficients, the Inflation targeting policy has a detrimental influence on economic growth in African countries, but a favourable impact on economic growth in European countries. This could be because the Polish economic standard and inflation dynamics are superior to those of African countries, as Heintz and Ndikumana (2011) discovered. According to Heintz and Ndikumana (2011), the structural realities of Sub-Saharan African countries do not support the adoption of strict rules-based approaches to monetary policy, such as inflation targeting.
In summary, this study examined the effectiveness of inflation targeting policy on inflation uncertainty and economic growth in some selected African and European economies. Briefly, the study derived the following results: (1) Inflation Targeting policy is insignificant in reducing inflation uncertainty in South Africa, and the effect of the policy in Ghana is inconclusive; (2) the IT policy has a significant impact in reducing inflation uncertainty in European countries (i.e., Poland and Ghana); (3) Inflation Targeting has a negative impact on economic growth in African Countries; (4) the policy has a positive impact on economic growth in European Countries; (5) In comparison to European countries, the strategy has a negligible impact on economic growth in Africa. Lee (2011); Krušec (2011); Ciżkowicz and Rzońca (2015); Heintz and Ndikumana (2011); and Bleaney et al. (2020) also reported similar findings. In European countries, Lee (2011), Krušec (2011), Ciżkowicz and Rzońca (2015) showed that IT policy is a successful method. Heintz and Ndikumana (2011) and Bleaney et al. (2020) argue that IT Policy is inappropriate for Sub-Saharan African countries. The findings, however, contradict those of studies such as Comert and Epstein (2011); Nasr et al. (2015); Fosu (2015); Mohammed et al. (2016); and Abango et al. (2019), which looked at the efficiency of IT policies in African countries.

5. Conclusions

The study confirms that the European countries benefited more after adopting the IT policy compared to African countries. A possible explanation behind this result is that African countries generally have poor economic conditions compared to European countries. Another perspective of this result is that there is a possibility that, African countries did not consider all the prerequisites of implementing the IT policy. The findings presented in this study bring insight into whether IT Policy is helpful for African or European countries given that IT Policy has been referred to as being a dull instrument that hinders economic growth. Based on the findings, the adoption of the IT policy is effective in reducing inflation uncertainty in European countries. However, the effectiveness of IT policy is questionable in African countries. In addition, the policy sustains economic growth for the European countries and dampens growth for African countries.
In conclusion, the study revealed that the effect of IT policy on inflation uncertainty and economic growth varies by country. This conclusion raises a warning for policymakers to always make sure that they assess the economic condition of an individual country before implementing any policy. In addition, to ensure that all the preconditions of the policies are met. Another noteworthy finding of the study is that, when observing the impulse response, the impact shock of inflation targeting resulted in a dramatic fall in economic growth in European countries in the near run. This raises the obvious question: What caused a sharp decline in economic growth at the early phase of inflation targeting in European countries? The possible explanation for this incident could be that the Polish inflation targeting strategy faced more complications and limitations at the initial stage. The complications could have been caused by the structural characteristics of Polish inflation. The current analysis might have some limitations; therefore, there is still a need to conduct or improve further research on the effectiveness of the IT policy. The number of countries included in this study is limited due to data availability and the fact that only two African countries actively target inflation. Future studies could therefore benefit from exploring the effectiveness of the IT policy in developing countries using a larger sample when they include other countries in the analysis.

Author Contributions

Conceptualization, S.T.N., K.D.I. and M.S.; methodology, S.T.N.; software, S.T.N.; validation, S.T.N.; formal analysis, S.T.N.; writing—original draft preparation, S.T.N.; writing—review and editing, S.T.N.; visualization, S.T.N.; supervision, K.D.I. and M.S. All authors have read and agreed to the published version of the manuscript.

Funding

This research was funded by NRF bursary scheme, unique grant no: 122953. We also wish to express our gratitude to the entire staff at the University of Zululand’s Department of Economics for language editing funding.

Data Availability Statement

Publicly available datasets were analyzed in this study. This data can be found here: [https://data.imf.org/? (accessed on 23 July 2021)], Specifically, the data can be assessable from the International Monetary Fund (IMF) data base. Further inquiries can be directed to the corresponding author.

Acknowledgments

We thank everyone who attended the Management of Business and Legal Initiatives (MBALI) (2019) conference in Richards Bay for their invaluable input during the early stages of this research. Also, we thank the University of Zululand’s Department of Economics staff, for their constructive criticism and helpful suggestions on this research.

Conflicts of Interest

The authors declare no conflict of interest. Also, the funders had no role in the design of the study; in the collection, analyses, or interpretation of data; in the writing of the manuscript, or in the decision to publish the results.

References

  1. Abango, Mohammed A., Hadrat Yusif, and Adam Issifu. 2019. Monetary aggregates targeting, inflation targeting and inflation stabilization in Ghana. African Development Review 31: 448–61. [Google Scholar] [CrossRef]
  2. Abo-Zaid, Salem, and Didem Tuzemen. 2012. Inflation Targeting: A three-decade perspective. Journal of Policy Modeling 34: 621–45. [Google Scholar] [CrossRef]
  3. Abrigo, Michael R. M., and Inessa Love. 2016. Estimation of panel vector autoregression in Stata. The Stata Journal 16: 778–804. [Google Scholar] [CrossRef] [Green Version]
  4. Agénor, Pierre-Richard, and Luiz Awazu Pereira da Silva. 2019. Integrated Inflation Targeting-Another Perspective from the Developing World. Manchester: Bank for International Settlements (BIS), University of Manchester. [Google Scholar]
  5. Antonakakis, Nikolaos, Christina Christou, Luis A. Gil-Alana, and Rangan Gupta. 2021. Inflation-targeting and inflation volatility: International evidence from the cosine-squared cepstrum. International Economics 167: 29–38. [Google Scholar] [CrossRef]
  6. Ardakani, Omid M., N. Kundan Kishor, and Suyong Song. 2018. Re-evaluating the effectiveness of inflation targeting. Journal of Economic Dynamics and Control 90: 76–97. [Google Scholar] [CrossRef]
  7. Bataa, Erdenebat, Denise R. Osborn, Marianne Sensier, and Dick van Dijk. 2013. Structural breaks in the international dynamics of inflation. Review of Economics and Statistics 95: 646–59. [Google Scholar] [CrossRef]
  8. Bernanke, Ben S., and Michael Woodford. 2004. Introduction to “The Inflation-Targeting Debate”. In The Inflation-Targeting Debate. Chicago: University of Chicago Press, pp. 1–10. [Google Scholar]
  9. Bleaney, Michael, Atsuyoshi Morozumi, and Zakari Mumuni. 2020. Inflation targeting and monetary policy in Ghana. Journal of African Economies 29: 121–45. [Google Scholar] [CrossRef]
  10. Bollerslev, Tim. 1986. Generalized autoregressive conditional heteroskedasticity. Journal of econometrics 31: 307–27. [Google Scholar] [CrossRef] [Green Version]
  11. Bratsiotis, George J., Jakob Madsen, and Christopher Martin. 2015. Inflation targeting and inflation persistence. Economic and Political Studies 3: 3–17. [Google Scholar] [CrossRef] [Green Version]
  12. Breitung, Jörg, and Samarjit Das. 2005. Panel unit root tests under cross-sectional dependence. Statistica Neerlandica 59: 414–33. [Google Scholar] [CrossRef]
  13. Brito, Ricardo D., and Brianne Bystedt. 2010. Inflation targeting in emerging economies: Panel evidence. Journal of Development Economics 91: 198–210. [Google Scholar] [CrossRef]
  14. Broto, Carmen. 2008. Inflation Targeting in Latin America: Empirical Analysis Using Garch Models. Economic Modelling 28: 1424–34. [Google Scholar] [CrossRef] [Green Version]
  15. Ciżkowicz, Piotr, and Andrzej Rzońca. 2015. Inflation targeting and its discontents: The case of Poland. Acta Oeconomica 65: 107–22. [Google Scholar] [CrossRef] [Green Version]
  16. Comert, Hasan, and Gerald Epstein. 2011. Inflation targeting in South Africa: Friend or foe of development? Economic History of Developing Regions 26: S94–S113. [Google Scholar] [CrossRef]
  17. Cukierman, Alex, and Allan H. Meltzer. 1986. A theory of ambiguity, credibility, and inflation under discretion and asymmetric information. Econometrica: Journal of the Econometric Society 54: 1099–128. [Google Scholar] [CrossRef] [Green Version]
  18. Daboussi, Olfa Manai. 2014. Economic performance and inflation targeting in developing economies. Journal of World Economic Research 3: 1–7. [Google Scholar] [CrossRef] [Green Version]
  19. e Souza, Gustavo José de Guimarães, Helder Ferreira de Mendonça, and Joaquim Pinto de Andrade. 2016. Inflation targeting on output growth: A pulse dummy analysis of dynamic macroeconomic panel data. Economic Systems 40: 145–69. [Google Scholar] [CrossRef]
  20. Engle, Robert. 2001. GARCH 101: The use of ARCH/GARCH models in applied econometrics. Journal of Economic Perspectives 15: 157–68. [Google Scholar] [CrossRef] [Green Version]
  21. Erdem, Havvanur Feyza, and Rahmi Yamak. 2016. Measuring the optimal macroeconomic uncertainty index for Turkey. Economic Annals 61: 7–22. [Google Scholar] [CrossRef]
  22. Ewurum, Ngozi C., Chris U. Kalu, and Damian J. Nwankwo. 2017. Inflation Targeting and Economic Growth Nexus in Nigeria: Implications for Monetary Policy. International Journal of Academic Research in Business and Social Sciences 7: 12–27. [Google Scholar]
  23. Fosu, Nana Kwame. 2015. Inflation Targeting: The Ghanaian Experience. Ph.D. dissertation, University of Ghana, Accra, Ghana. [Google Scholar]
  24. Fouejieu, Armand. 2013. Coping with the recent financial crisis: Did inflation targeting makes any difference. International Economics 133: 72–92. [Google Scholar] [CrossRef] [Green Version]
  25. Frees, Edward W. 1995. Assessing cross-sectional correlation in panel data. Journal of Econometrics 69: 393–414. [Google Scholar] [CrossRef]
  26. Friedman, Milton. 1937. The use of ranks to avoid the assumption of normality implicit in the analysis of variance. Journal of the American Statistical Association 32: 675–701. [Google Scholar] [CrossRef]
  27. Friedman, Milton. 1977. Nobel lecture: Inflation and unemployment. Journal of Political Economy 85: 451–72. [Google Scholar] [CrossRef]
  28. Fromlet, Pia. 2010. Do Inflation Targeting Central Banks Focus on Inflation—An Analysis for Ten Countries? Uppsala: Department of Economics, Uppsala University. [Google Scholar]
  29. Gurgul, Henryk, Paweł Majdosz, and Roland Mestel. 2007. Price–volume relations of DAX companies. Financial Markets and Portfolio Management 21: 353–79. [Google Scholar] [CrossRef]
  30. Gylfason, Thorvaldur, and Tryggvi Thor Herbertsson. 2001. Does inflation matter for growth? Japan and the World Economy 13: 405–28. [Google Scholar] [CrossRef]
  31. Hammond, Gill. 2012. State of the Art of Inflation Targeting. In Handbook No. 29, Centre for Central Banking Studies. London: Bank of England. [Google Scholar]
  32. Harris, Richard D. F., and Elias Tzavalis. 1999. Inference for unit roots in dynamic panels where the time dimension is fixed. Journal of Econometrics 91: 201–26. [Google Scholar] [CrossRef]
  33. Hartmann, Matthias, and Jan Roestel. 2013. Inflation, output and uncertainty in the era of inflation targeting—A multi-economy view on causal linkages. Journal of International Money and Finance 37: 98–112. [Google Scholar] [CrossRef]
  34. Heintz, James, and Léonce Ndikumana. 2011. Is there a case for formal inflation targeting in sub-Saharan Africa? Journal of African Economies 20: ii67–ii103. [Google Scholar] [CrossRef] [Green Version]
  35. Högenauer, Anna-Lena, and David Howarth. 2016. Unconventional monetary policies and the European Central Bank’s problematic democratic legitimacy. Zeitschrift für Öffentliches Recht 71: 1–24. [Google Scholar]
  36. Holland, A. Steven. 1995. Inflation and uncertainty: Tests for temporal ordering. Journal of Money, Credit and Banking 27: 827–37. [Google Scholar] [CrossRef]
  37. Horská, Helena. 2001. Inflation targeting in Poland-A comparison with the Czech Republic. Institute of World Economic 3: 237–54. [Google Scholar] [CrossRef] [Green Version]
  38. Im, Kyung So, M. Hashem Pesaran, and Yongcheol Shin. 2003. Testing for unit roots in heterogeneous panels. Journal of Econometrics 115: 53–74. [Google Scholar] [CrossRef]
  39. Jahan, Sarwat. 2012. Inflation targeting: Holding the line. Finance & Development 4: 72–73. [Google Scholar]
  40. Karahan, Özcan. 2012. The relationship between inflation and inflation uncertainty: Evidence from the Turkish economy. Procedia Economics and Finance 1: 219–28. [Google Scholar] [CrossRef] [Green Version]
  41. Kaseeram, Irrshad, and Eleftherios Contogiannis. 2011. The impact of inflation targeting on inflation volatility in South Africa. African Finance Journal 13: 34–52. [Google Scholar]
  42. Kontonikas, Alexandros. 2004. Inflation and inflation uncertainty in the United Kingdom, evidence from GARCH modelling. Economic Modelling 21: 525–43. [Google Scholar] [CrossRef] [Green Version]
  43. Kovanen, Arto. 2011. Does Money Matter for Inflation in Ghana? IMF Working Papers, Stage of Publication. pp. 1–23. Available online: http://www.imf.org/external/pubs/ft/wp/2011/wp11274.pdf (accessed on 23 August 2021).
  44. Krušec, Dejan. 2011. Is inflation targeting effective? Monetary transmission in Poland, the Czech Republic, Slovakia, and Hungary. Eastern European Economics 49: 52–71. [Google Scholar] [CrossRef]
  45. Kumo, Wolassa Lawisso. 2015. 216-Inflation Targeting Monetary Policy, Inflation Volatility and Economic Growth in South Africa. In African Development Bank Group, WP 216. Abidjan: African Development Bank, Available online: https://www.afdb.org/en/documents/document/working-paper-216-inflation-targeting-monetary-policy-inflation-volatility-and-economic-growth-in-south-africa-51137 (accessed on 23 August 2021).
  46. Lee, Wang-Sheng. 2011. Comparative case studies of the effects of inflation targeting in emerging economies. Oxford Economic Papers 63: 375–97. [Google Scholar] [CrossRef]
  47. Mavikela, Nomahlubi, Simba Mhaka, and Andrew Phiri. 2019. The inflation-growth relationship in SSA inflation-targeting countries. Studia Universitatis Babes-Bolyai Oeconomica 64: 84–102. [Google Scholar] [CrossRef] [Green Version]
  48. Meerza, Syed Imran Ali. 2020. Do Preconditions of Inflation Targeting Framework Matter? International Journal of Economics and Finance 12: 1–51. [Google Scholar] [CrossRef]
  49. Miles, William. 2008. Inflation targeting and monetary policy in Canada: What is the impact on inflation uncertainty? The North American Journal of Economics and Finance 19: 235–48. [Google Scholar] [CrossRef]
  50. Mishkin, Frederic S. 2000. Inflation targeting in emerging-market countries. American Economic Review 90: 105–9. [Google Scholar] [CrossRef] [Green Version]
  51. Mohammed, Alhassan, Yusif Hadrat, and Buabeng Emmanuel. 2016. Inflation targeting and economic growth in Ghana: An empirical investigation. Ghanaian Journal of Economics 4: 158–77. [Google Scholar]
  52. Mollick, André Varella, René Cabral, and Francisco G. Carneiro. 2011. Does inflation targeting matter for output growth? Evidence from industrial and emerging economies. Journal of Policy Modeling 33: 537–51. [Google Scholar] [CrossRef] [Green Version]
  53. Nasr, Adnen Ben, Mehmet Balcilar, Ahdi N. Ajmi, Goodness C. Aye, Rangan Gupta, and Renee Van Eyden. 2015. Causality between inflation and inflation uncertainty in South Africa: Evidence from a Markov-switching vector autoregressive model. Emerging Markets Review 24: 46–68. [Google Scholar] [CrossRef] [Green Version]
  54. Nelson, Daniel B., and Charles Q. Cao. 1991. Inequality constraints in the univariate GARCH model. Journal of Business & Economic Statistics 10: 229–35. [Google Scholar]
  55. Okun, Arthur M. 1971. The mirage of steady inflation. Brookings Papers on Economic Activity 1971: 485–98. [Google Scholar] [CrossRef] [Green Version]
  56. Pesaran, M. Hashem. 2004. General Diagnostic Tests for Cross-Sectional Dependence in Panels. Cambridge Working Papers in Economics No. 0435. Cambridge: The University of Cambridge, Faculty of Economics. [Google Scholar]
  57. Petreski, Marjan. 2014. Inflation targeting at the crossroads: Evidence from post-communist economies during the crisis. Communist and Post-Communist Studies 47: 247–60. [Google Scholar] [CrossRef] [Green Version]
  58. Phiri, Andrew. 2016. Inflation persistence in African countries: Does inflation targeting matter? Economics and Business Letters 5: 65–71. [Google Scholar] [CrossRef] [Green Version]
  59. Pourgerami, Abbas, and Keith E. Maskus. 1987. The effects of inflation on the predictability of price changes in Latin America: Some estimates and policy implications. World Development 15: 287–90. [Google Scholar] [CrossRef]
  60. Puni, Albert, Bright Addiyiah Osei, and Charles Barnor. 2014. Effects of inflation targeting policy on inflation rates and gross domestic product in Ghana. European Journal of Business and Management 6: 54–60. [Google Scholar]
  61. Sarel, Michael. 1996. Nonlinear effects of inflation on economic growth. Staff Papers 43: 199–215. [Google Scholar] [CrossRef]
  62. Sudacevschi, Mihaela. 2011. Pros and Cons of Inflation Targeting Strategy. LESIJ-Lex ET Scientia International Journal 18: 228–35. [Google Scholar]
  63. Svensson, Lars E. 1997. Inflation forecast targeting: Implementing and monitoring inflation targets. European Economic Review 41: 1111–46. [Google Scholar] [CrossRef] [Green Version]
  64. Tas, Bedri Kamil Onur, and Hasan Murat Ertugrul. 2013. Effect of inflation targeting on inflation uncertainty: A SWARCH analysis. Australian Economic Review 46: 444–59. [Google Scholar] [CrossRef]
  65. Taş, Bedri Kamil Onur. 2012. Inflation targeting and inflation uncertainty. Scottish Journal of Political Economy 59: 283–97. [Google Scholar] [CrossRef]
  66. Thornton, John. 2016. Inflation targeting in developing countries revisited. Finance Research Letters 16: 145–53. [Google Scholar] [CrossRef]
  67. Ungar, Meyer, and Ben-Zion Zilberfarb. 1993. Inflation and its Unpredictability—Theory and Empirical Evidence. Journal of Money, Credit and Banking 25: 709–20. [Google Scholar] [CrossRef]
  68. Valera, Harold Glenn A., Mark J. Holmes, and Gazi M. Hassan. 2018. Is inflation targeting credible in Asia? A panel GARCH approach. Empirical Economics 54: 523–46. [Google Scholar] [CrossRef]
  69. Van der Merwe, Ernie J. 2004. Inflation Targeting in South Africa. Pretoria: South African Reserve Bank. [Google Scholar]
Figure 1. Inflation Rate in African and European Countries. Source: Author’s Computation using data from IFS.
Economies 10 00037 g001
Figure 2. Inflation Rate Residuals. Source: Author’s Computation using data from IFS.
Economies 10 00037 g002
Figure 3. Impulse response (AC). Source: Computed Based on Data.
Economies 10 00037 g003
Figure 4. Impulse response (EC). Source: Computed Based on Data.
Economies 10 00037 g004
Table 1. Descriptive statistics.
MeanMaximumMinimumStd. Dev.SkewnessKurtosisJarqueBera
INFL10.4486322.342500−1.1419000.4457590.5111784.37875236.82708 (0.000)
INFL21.32506312.04190−3.5621001.5140751.61433411.555621045.286 (0.000)
INFL30.3690333.300600−0.9050000.6101421.6717397.386712380.2761 (0.000)
INFL40.2618603.808500−0.9144000.5542502.50298813.679831738.982 (0.000)
Source: Author’s Computation using data from IFS.
Table 2. Time Series Stationarity Tests.
VariableTestt-Testt-CriticalProbabilityConclusion
INFL1ADF−10.546−3.4560.000Stationary
PP−11.015−3.4560.000
INFL2ADF−3.325−3.1370.064Stationary
PP−10.028−3.9940.000
INFL3ADF−3.165−2.5730.001Stationary
PP−10.840−3.9890.000
INFL4ADF−2.208−1.9410.026Stationary
PP−15.480−3.9890.000
Source: Author’s Computation using data from IFS.
Table 3. Model Diagnostics.
SeriesQ TestLM Test
INFL10.2271 (0.634)5.314 (0.021)
INFL20.0177 (0.894)2.814 (0.093)
INFL30.3991 (0.528)34.961 (0.000)
INFL40.0002 (0.988)51.504 (0.000)
Source: Computed Based on Data.
Table 4. EGARCH (1,1) Model Results.
Countryωφαγ
SA−1.436828 **
(0.575)
0.389435
(0.271)
0.346622 **
(0.160)
0.203411 **
(0.101)
Ghana0.249890 **
(0.126)
−0.282387 **
(0.143)
−0.079897
(0.165)
0.489211 ***
(0.110)
Poland−0.058818
(0.044)
0.982473 ***
(0.009)
0.019758
(0.062)
0.016898
(0.030)
Czech Republic−0.061598 *
(0.035)
0.814978 ***
(0.016)
−0.298529***
(0.045)
0.227784 ***
(0.029)
Note: * p < 0.1, ** p < 0.05 & *** p < 0.01. Source: Computed Based on Data. The values within the parentheses are the corresponding standard errors.
Table 5. EGARCH (1,1) Model Results with IT dummy.
CountryωφAγσ
SA−1.099797 **
(0.543)
0.457902 *
(0.255)
0.347605 **
(0.164)
0.194090 *
(0.100)
−0.220864
(0.314)
Ghana0.645499 ***
(0.236)
−0.454001 **
(0.181)
0.008861
(0.162)
0.370439 ***
(0.122)
−0.748814 **
(0.346)
Poland0.027414
(0.035)
0.937796 ***
(0.016)
−0.103707 *
(0.056)
0.070724 **
(0.031)
−0.087539 ***
(0.030)
Czech Republic−1.483072 ***
(0.297)
−1.020159 ***
(0.003)
0.007889
(0.023)
0.087078 ***
(0.015)
−2.301536 ***
(0.283)
Note: * p < 0.1,** p < 0.05 & *** p < 0.01. Source: Computed Based on Data. The values within the parentheses are the corresponding standard errors.
Table 6. Cross-Sectional Independence and Cointegration Tests.
Tests of Cross-Sectional IndependencePedroni Test for Cointegration
Pesaran’s test6.579Pr = 0.0000Modified Phillips-Perron t2.9851Pr = 0.0014
Friedman’s test151.067Pr = 0.0000Phillips-Perron t3.5331Pr = 0.0002
Frees’ test0.608Pr = 0.0000Augmented Dickey-Fuller t4.3515Pr = 0.0000
Source: Computed Based on Data.
Table 7. Panel Stationarity Tests.
Im-Pesaran-ShinHarris-TzavalisBreitung
LGDPLevels
1 s t Δ
Integration
1.188
2.096   * *
I ( 1 )
2.531
3.430   * * *
I ( 1 )
5.379
5.907   * * *
I ( 1 )
LCPILevels
1 s t Δ
Integration
0.225
14.035   * * *
I ( 1 )
0.712
15.530   * * *
I ( 1 )
2.226
7.982   * * *
I ( 1 )
REERLevels
1 s t Δ
Integration
1.184
10.866   * * *
I ( 1 )
0.774
42.023   * * *
I ( 1 )
1.048
5.976   * * *
I ( 1 )
IRLevels
1 s t Δ
Integration
2.419   * * *

I ( 0 )
0.282
30.162   * * *
I ( 1 )
0.327
9.584   * * *
I ( 1 )
Note: * p < 0.1,** p < 0.05 & *** p < 0.01. Source: Computed Based on Data.
Table 8. Panel VAR model Results.
ACEC
Coef.Std. Err.zp > |z|Coef.Std. Err.zp > |z|
Dlgdpdlgdp
L1.
0.30228940.015336619.710.0000.36343320.018580419.560.000
dlcpi
L1.
−0.05947730.0032704−18.190.000−0.07174970.012326−5.820.000
dreer
L1.
0.00001950.00002230.870.3830.00015520.00003055.090.000
dir
L1.
−0.00073120.0000386−18.950.0000.00003360.00009720.350.730
dum0.00196710.00023478.380.0000.01842010.00502233.670.000
Source: Computed Based on Data.
Publisher’s Note: MDPI stays neutral with regard to jurisdictional claims in published maps and institutional affiliations.

