
An Open-Source, Low-Cost Measurement System for Collecting Hydrometeorological Data in the Open Field


1
Division of Environmental and Agricultural Engineering, Tokyo University of Agriculture and Technology, Tokyo 183-0054, Japan
2
Technical Affairs, Disaster Prevention Research Institute, Kyoto University, Uji 611-0011, Japan
3
Research Division of Atmospheric and Hydrospheric Disasters, Disaster Prevention Research Institute, Kyoto University, Uji 611-0011, Japan
*
Author to whom correspondence should be addressed.
Technologies 2021, 9(4), 78; https://doi.org/10.3390/technologies9040078
Submission received: 25 September 2021
/
Revised: 12 October 2021
/
Accepted: 15 October 2021
/
Published: 22 October 2021
(This article belongs to the Topic Smart Technologies in Food Packaging and Sensors)
Abstract
:To realize precision agriculture at multiple locations in the field, a low-cost measurement system should be developed for easy collection of hydrometeorological data, such as temperature, moisture, and light. In this study, a compact and low-cost hydrometeorological measurement system with a simplified wire code, which is customizable according to the purpose of observation, was built using a circuit board that connects Arduino to the sensors, which was then implemented and analyzed. The developed system measures air and soil temperatures, soil water content, and photosynthetic photon flux density using a sensor connected to Arduino Uno and saves the continuous, high-temporal-resolution output to an SD card. The results obtained from continuous measurement showed that the data collected using this system was significantly better than those collected using commercially available equipment. Anyone can easily measure the weather environments by using this fully open, highly versatile, portable, and user-friendly system. This system can contribute to the growth and expansion of precision agriculture, field management, development of crop models, and laborsaving. It can also provide a global solution to ongoing agricultural issues and improve the efficiency of farming operations, particularly in developing and low-income countries.
1. Introduction
The development and widespread use of sensing technologies in agriculture has increased awareness among farmers and newcomers in the market, which may further promote the growth of the precision agriculture market in the near future. For sensing technologies, such as unmanned aerial vehicles, remote-sensing devices, field servers, yield-monitoring system, and harvesting robots, the daily monitoring of external hydrometeorological conditions is one of the most fundamental aspects to be considered in integrated management and operation of crop growth because meteorological and soil conditions have significant impacts on crop growth and stress. Although optimal conditions for crops are different among species and environments, monitoring of temperature, soil, and light variables in the field is vital for automatic control, efficient big-data analysis, and construction of information and communications technology (ICT) agriculture platforms. The effects of weather conditions on crop production have been well known for quite a long time [1]. For example, water stress occurs mainly due to the low water potentials in plants. Water deficiency cause reductions in growth and stomatal closure in plants and often reduces their harvest index [2]. Temperature is also a key abiotic signal that regulates plant function throughout its development. The temperature conditions of plant growth prompt a developmental switch and is the factor that determines where and for how long each crop species can grow. Chilling and freezing due to low temperatures leads to disturbances in all physiological processes in plants, such as the water regime, mineral nutrition, photosynthesis, respiration, and metabolism [3]. However, high temperatures represent one of the most detrimental stresses, which threatens higher plant productivity and its survival throughout the planet, because it affects the shoot growth and pollen development, resulting in low yield [4]. Crop productivity metrics greatly depend on the light use efficiency, which is the plant’s efficiency in using absorbed radiation for photosynthesis [5]. Furthermore, as it can be observed in the light response curves of photosynthesis, the photosynthetic rate increases with increasing light intensity up to the light saturation point. Conversely, photosynthesis has a sensitive response, lasting from sub-seconds to minutes, to the fluctuating incident photosynthetic photon flux density (PPFD) on the leaf [6]. The incident PPFD on plant leaves often fluctuates, complicating the dynamics of the photosynthetic rate [7].
A significant amount of scientific and technical research has been conducted specifically for the development of low-cost hydrometeorological measurement and monitoring systems by individual researchers at universities and research institutes. For example, in recent years, improved sensors for precision agriculture and sensor-based hydrometeorological measurement systems using wireless sensor networks and IoT technologies are being actively developed [8,9,10,11,12]. Moreover, a low-cost weather monitoring system that connects online for logging and data visualization was designed and constructed [13]. Noordin et al. [14] devised a low-cost and reliable weather monitoring system capable of data acquisition and recording. This system had sensors for temperature, relative humidity, and pressure. The measured values were converted to digital signals, which were then processed by a microcontroller and stored in a data logger. Gouda et al. [15] proposed a microcontroller-based real-time weather monitoring device that used a global system for mobile communication (GSM) network. This system consisted of a sensor circuit, microcontroller unit, display unit, and GSM module. Its sensor circuit included sensors for temperature, pressure, and relative humidity. Moreover, these measured parameters were displayed on an LCD display. Adepoju et al. [16] developed a low-cost Arduino-based weather station. This system consisted of modules for data collection, data storage, and data communication, which were interfaced with a set of sensors that measured temperature and humidity. The temperature values, which were obtained at intervals of 5 min, led to favorable results compared with those of the reference values. However, it was found that (1) its portability was reduced because the system used an Ethernet wired connection for data transmission; (2) there were no photographs of the measurement system, and its performance evaluation method was vague; and (3) it was not clear if the system had been tested in a field environment, and the results of a comparison with a reference sensor were not explicitly stated.
Furthermore, to develop a low-cost and authentic weather measurement system, Strigaro et al. [17] devised a weather monitoring system using the open and non-conventional systems. The main priorities for the development of this system were as follows: long lifespan, precise synchronization, low data rates, relatively static topology, and moderate data delay. Moreover, they quantitatively evaluated the data quality of the non-conventional, low-cost, and fully open system. The results demonstrated and confirmed that this accessible solution produced data of appropriate quality for natural resource and risk management. Similarly, Tenzin et al. [18] designed a low-cost microclimate weather station for measuring temperature, humidity, light, wind speed and direction, precipitation, and soil temperature and moisture. This system was found to equally efficient as the commercially available measuring instruments at measuring weather parameters. Although the sensors for precipitation, temperature, humidity, and pressure were relatively inexpensive, the monitoring system consisted of a box container, which was fixed on a center pole affixed onto the ground, and was not designed to be easily portable. In addition, most previous technologies related to measurement systems were only focused on Arduino and breadboard. However, only few studies have focused on fabricating a circuit board with simplified wiring, compact design, and a customization option for observation purposes. Therefore, the measurement systems in previous studies were not designed for usage at multiple locations in the field; factors, such as work efficiency and cost effectiveness, were also not a high priority in the design of such systems [19,20,21].
Based on these insights, the measurement of temperature, soil moisture, and light can contribute to the realization of laborsaving, precision, and high-quality crop production, and management and development of crop models. However, for many developing regions, the necessary commercial instruments are expensive. Therefore, the development of a simple and low-cost yet highly accurate measurement system is desired for the full-scale expansion of precision agriculture. In recent years, open-source hardware, which is computer hardware available for public use at no charge, has been widely adopted in measurement systems in various fields (e.g., robotics, automation, aquaculture, and precision agriculture) [22,23,24]. In precision agriculture, a system for monitoring the hydrometeorological environments is necessary for analyzing the conditions required for optimum crop growth. Although, in the last few decades, the development of weather monitoring systems and informatics resulted in improvements in the variety, quality, and coverage of these datasets, systems for managing water and air conditions in the field remain expensive. Therefore, a measurement device that is as low cost and user friendly as possible, should be developed, with the goal of deployment to multiple locations in the field. This study aimed to develop a packaged hydrometeorological measurement system with the following features: low cost, improved work efficiency and wire connection reliability, and easily installable for open-field use at multiple locations.
2. Materials and Methods
The low-cost measurement system (hereinafter called LCMS) measures the hydrometeorological values, followed by saving the received data to a micro-SD card. The hardware design was based on an Arduino Uno microcontroller board including hardware and software. Arduino Uno was used because of the following reasons: good processor speed, memory availability, efficient power consumption, and multiple ports for connecting the external sensors. Furthermore, it is distinguished by its low-cost implementation and installation, high compatibility, open licenses, and multiplatform software. It only weighs 25 g, making it very light and portable. Arduino Uno is already used in various situations to build LCMS for the measurement of weather, radiation, solar power, air quality, water turbidity, and irrigation [16,25,26,27,28,29,30]. This hardware is based on the ATmega328P microcontroller and has 14 digital input/output pins (of which 6 can be used as PWM outputs), 6 analog inputs, 16-MHz ceramic resonator, USB connection, power jack, and a reset button. It is also inexpensive, and its additional hardware components make it more customizable. The LCMS was developed using the following procedure.
- 1.
- Design requirements:
Determine the specifications of the system, such as the sensor type, channel number, and data recording method, according to the purpose of measurement.
- 2.
- Device selection:
Select sensors and devices according to the specifications. Determine the power supply capacity.
- 3.
- Circuit design:
Determine the layout of the system parts, such as Arduino, devices, and connectors, on the board, and design the wiring path.
- 4.
- Board cutting:
Based on the circuit design, cut the board with an automatic milling machine.
- 5.
- Board assembly:
Solder Arduino and other components on the cut board and check its operation.
- 6.
- Housing design:
Measure the fabricated board and design the cover accordingly.
- 7.
- Modeling and manufacturing the housing:
Based on the design data, shape the cover using a 3-D printer and install the board in the housing.
- 8.
- Program coding:
Code a program for Arduino to perform the processing according to specifications.
2.1. Fabrication of the Circuit Board
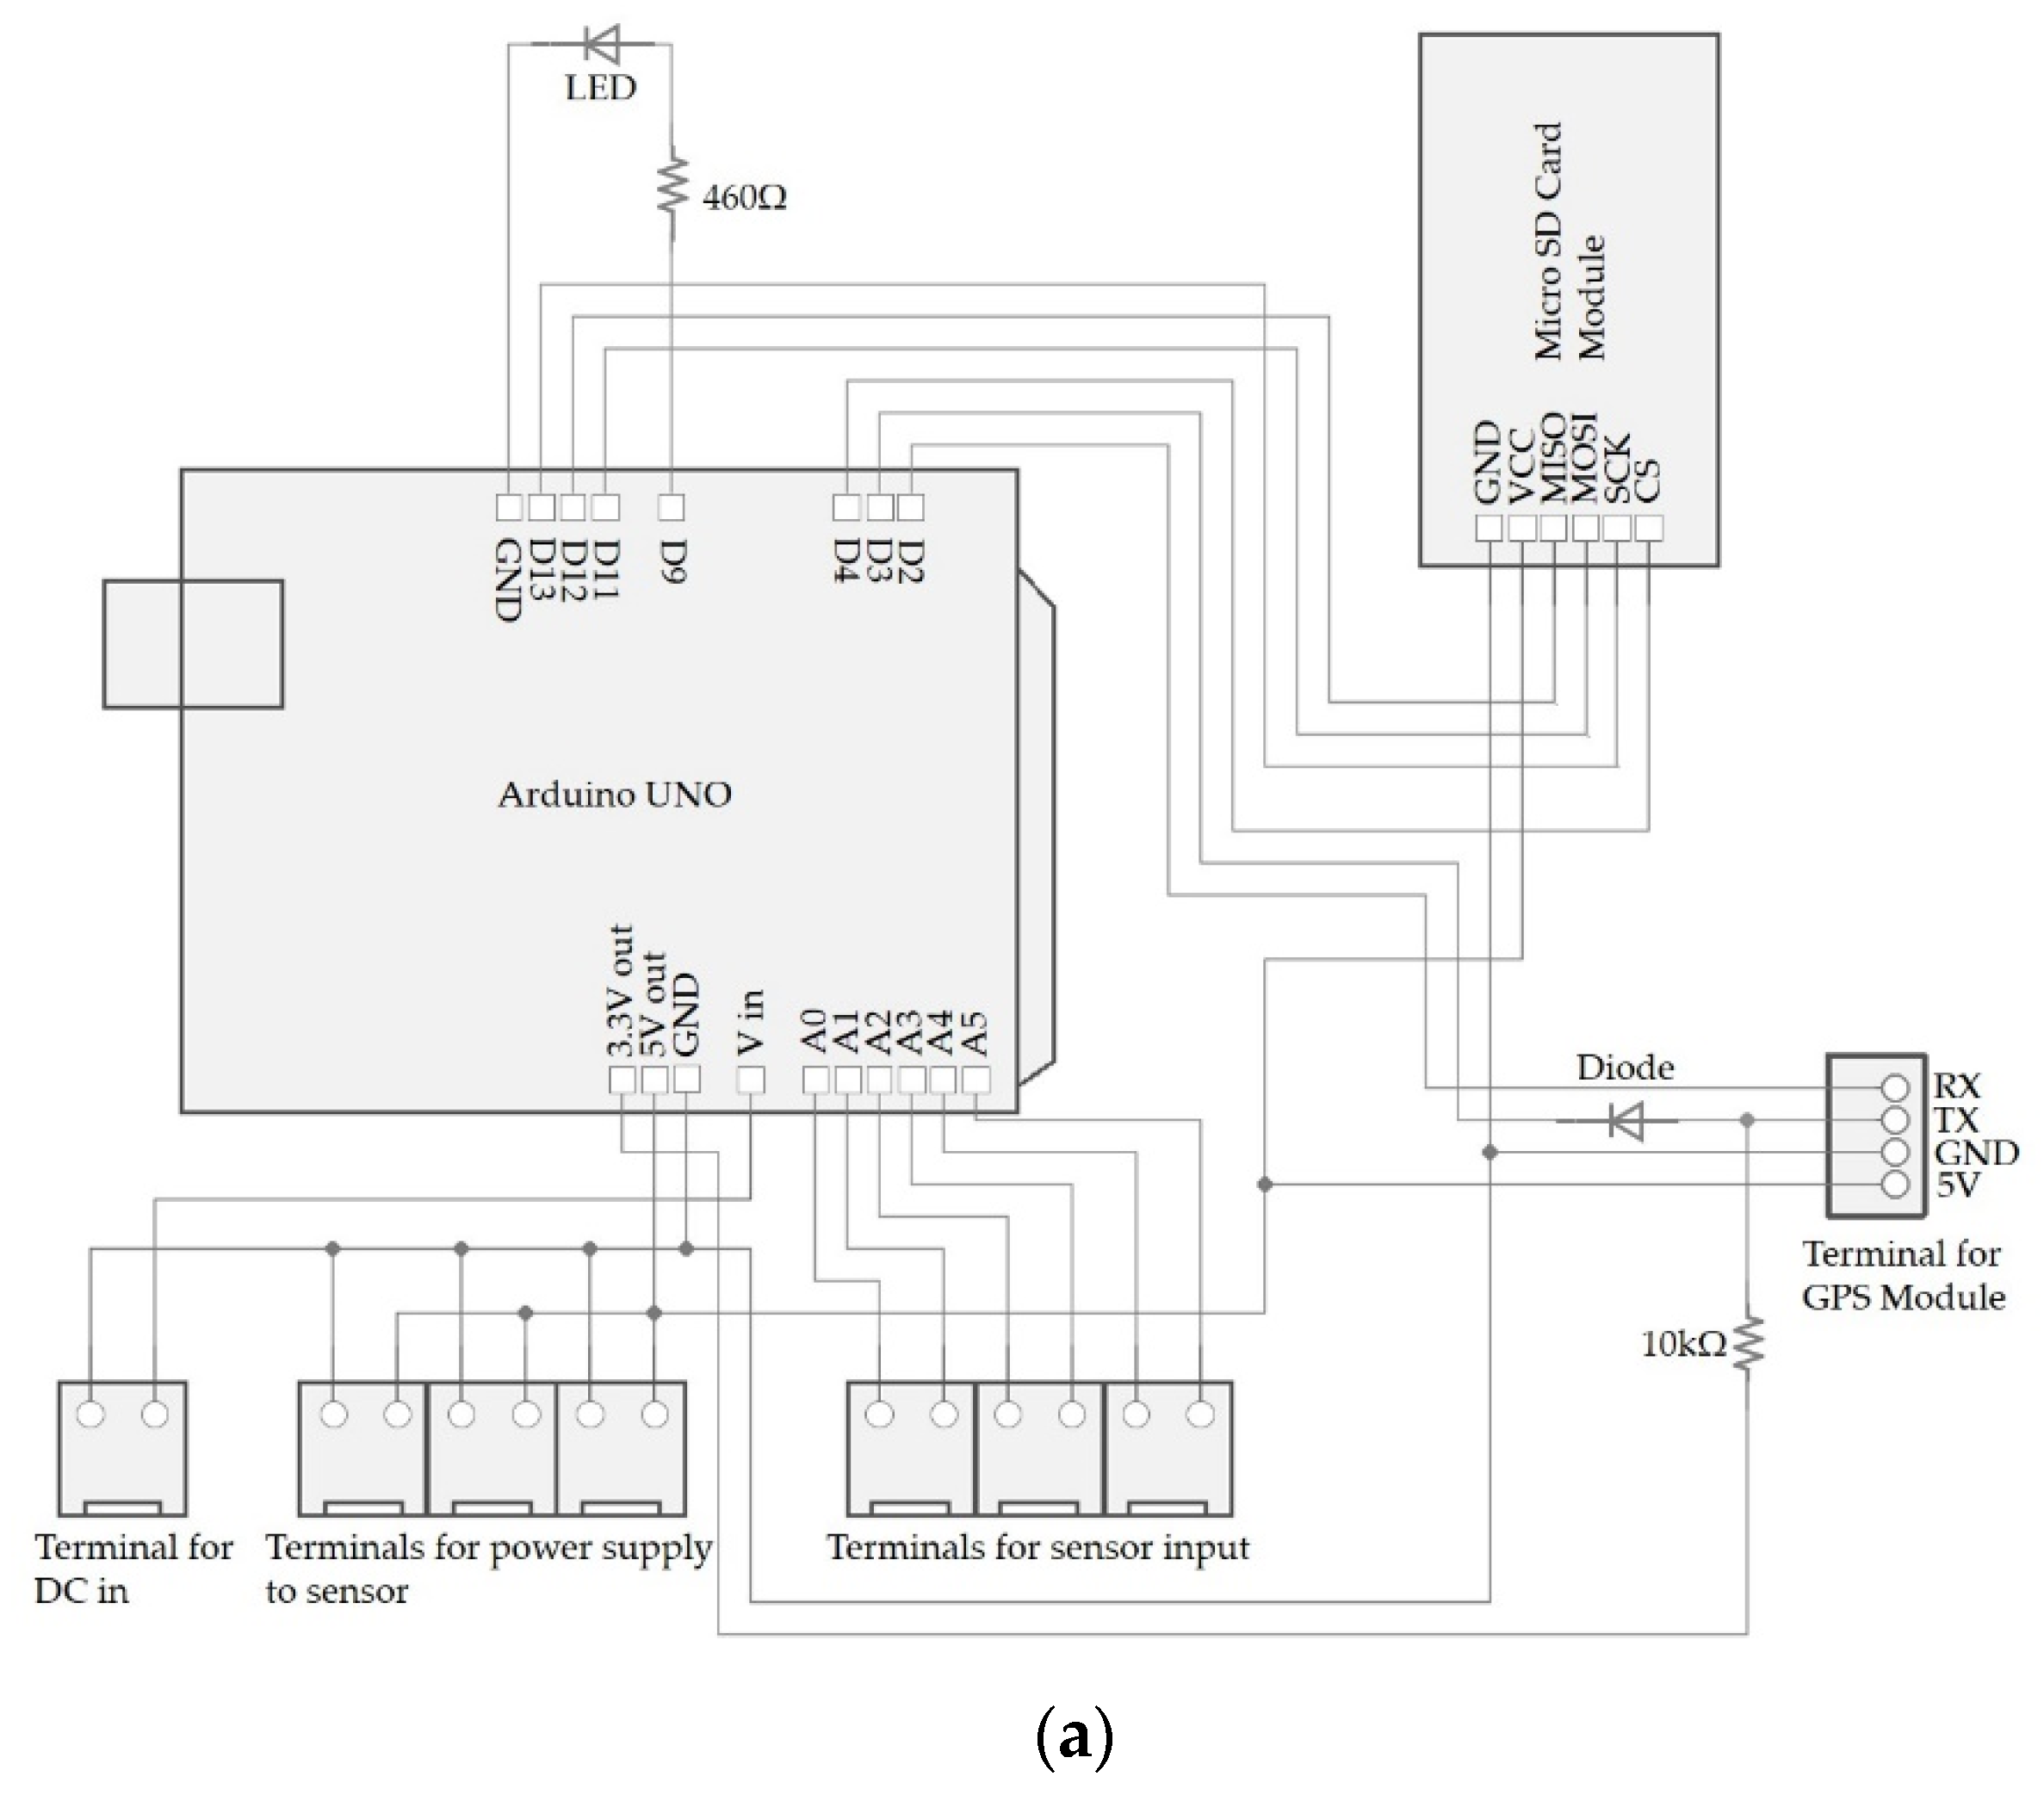
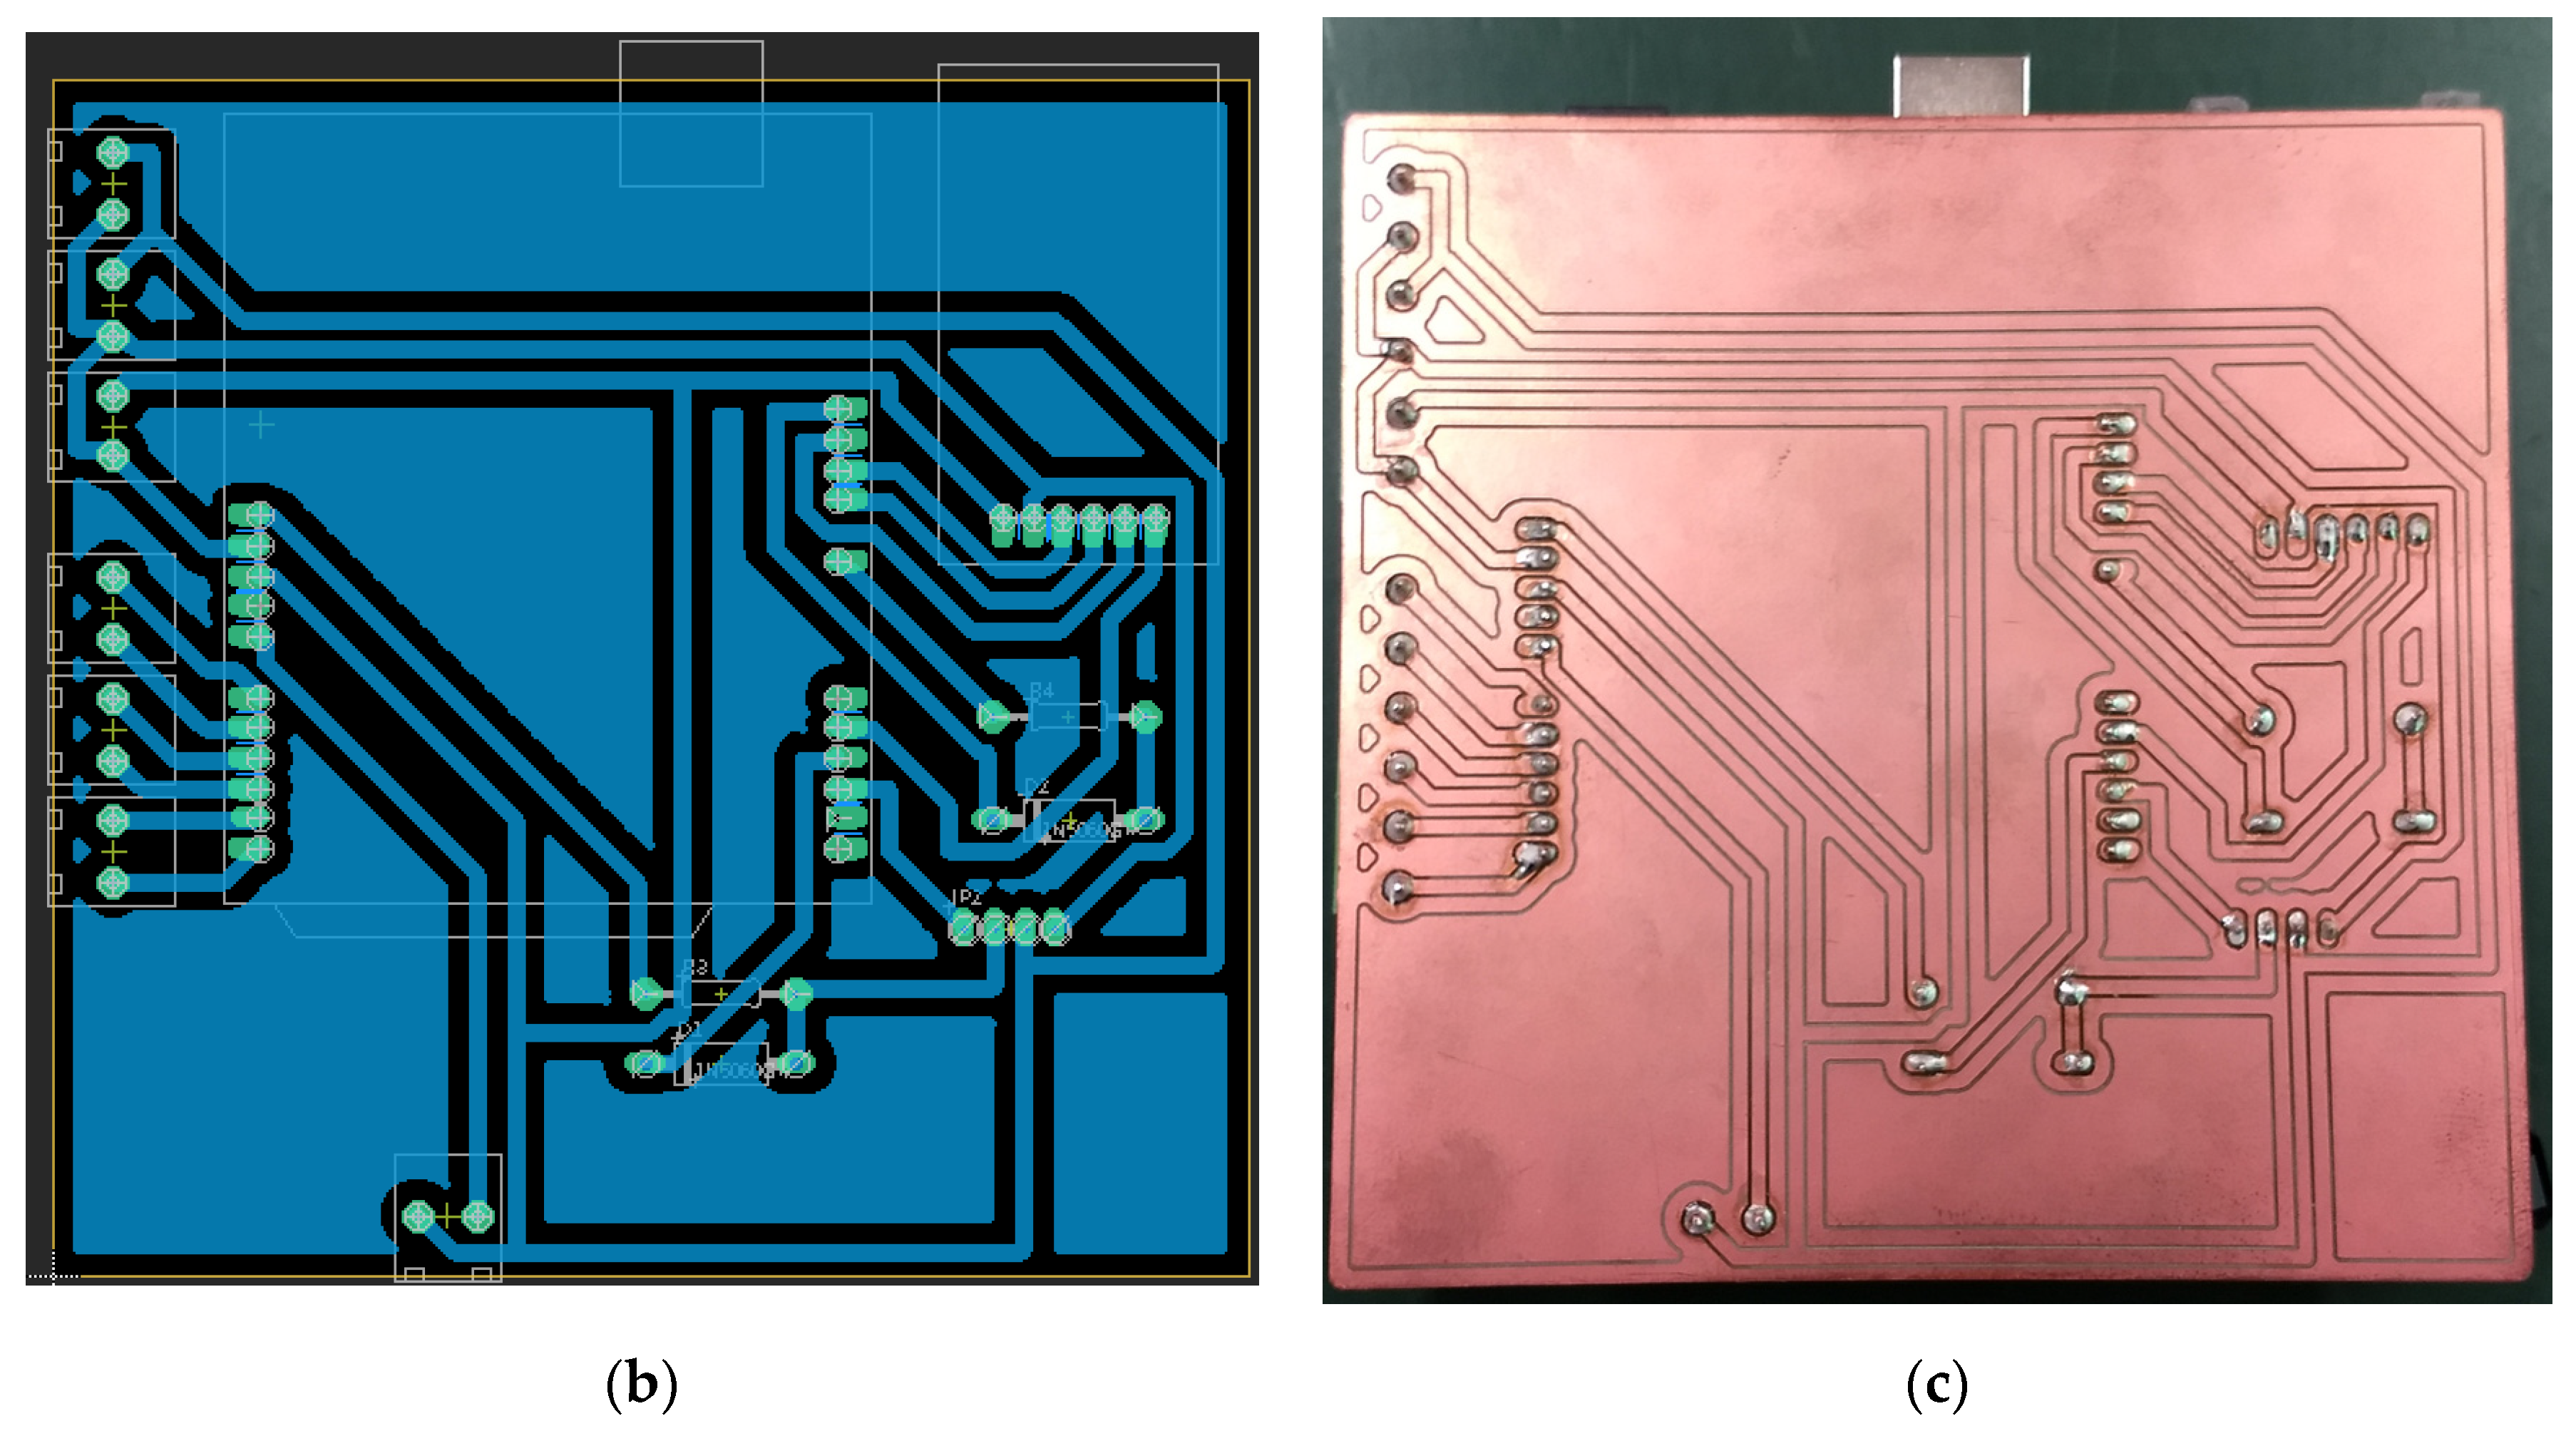
We fabricated the substrate with the objectives of miniaturizing the system, improving its productivity and versatility, increasing its affordability, and designing it with easily attachable and detachable sensors. First, we defined the wiring between the devices on the board, as shown in Figure 1a. The components on the board are Arduino (attached and detached with a pin header socket), micro-SD card module, terminal block for input/output, LEDs for status confirmation, and diodes and resistors for controlling the GPS module. The circuit board size is 100 100 mm, and the cutting pattern was created using the circuit design software, EAGLE (Autodesk, Inc., San Rafael, CA, USA) (Figure 1b,c).
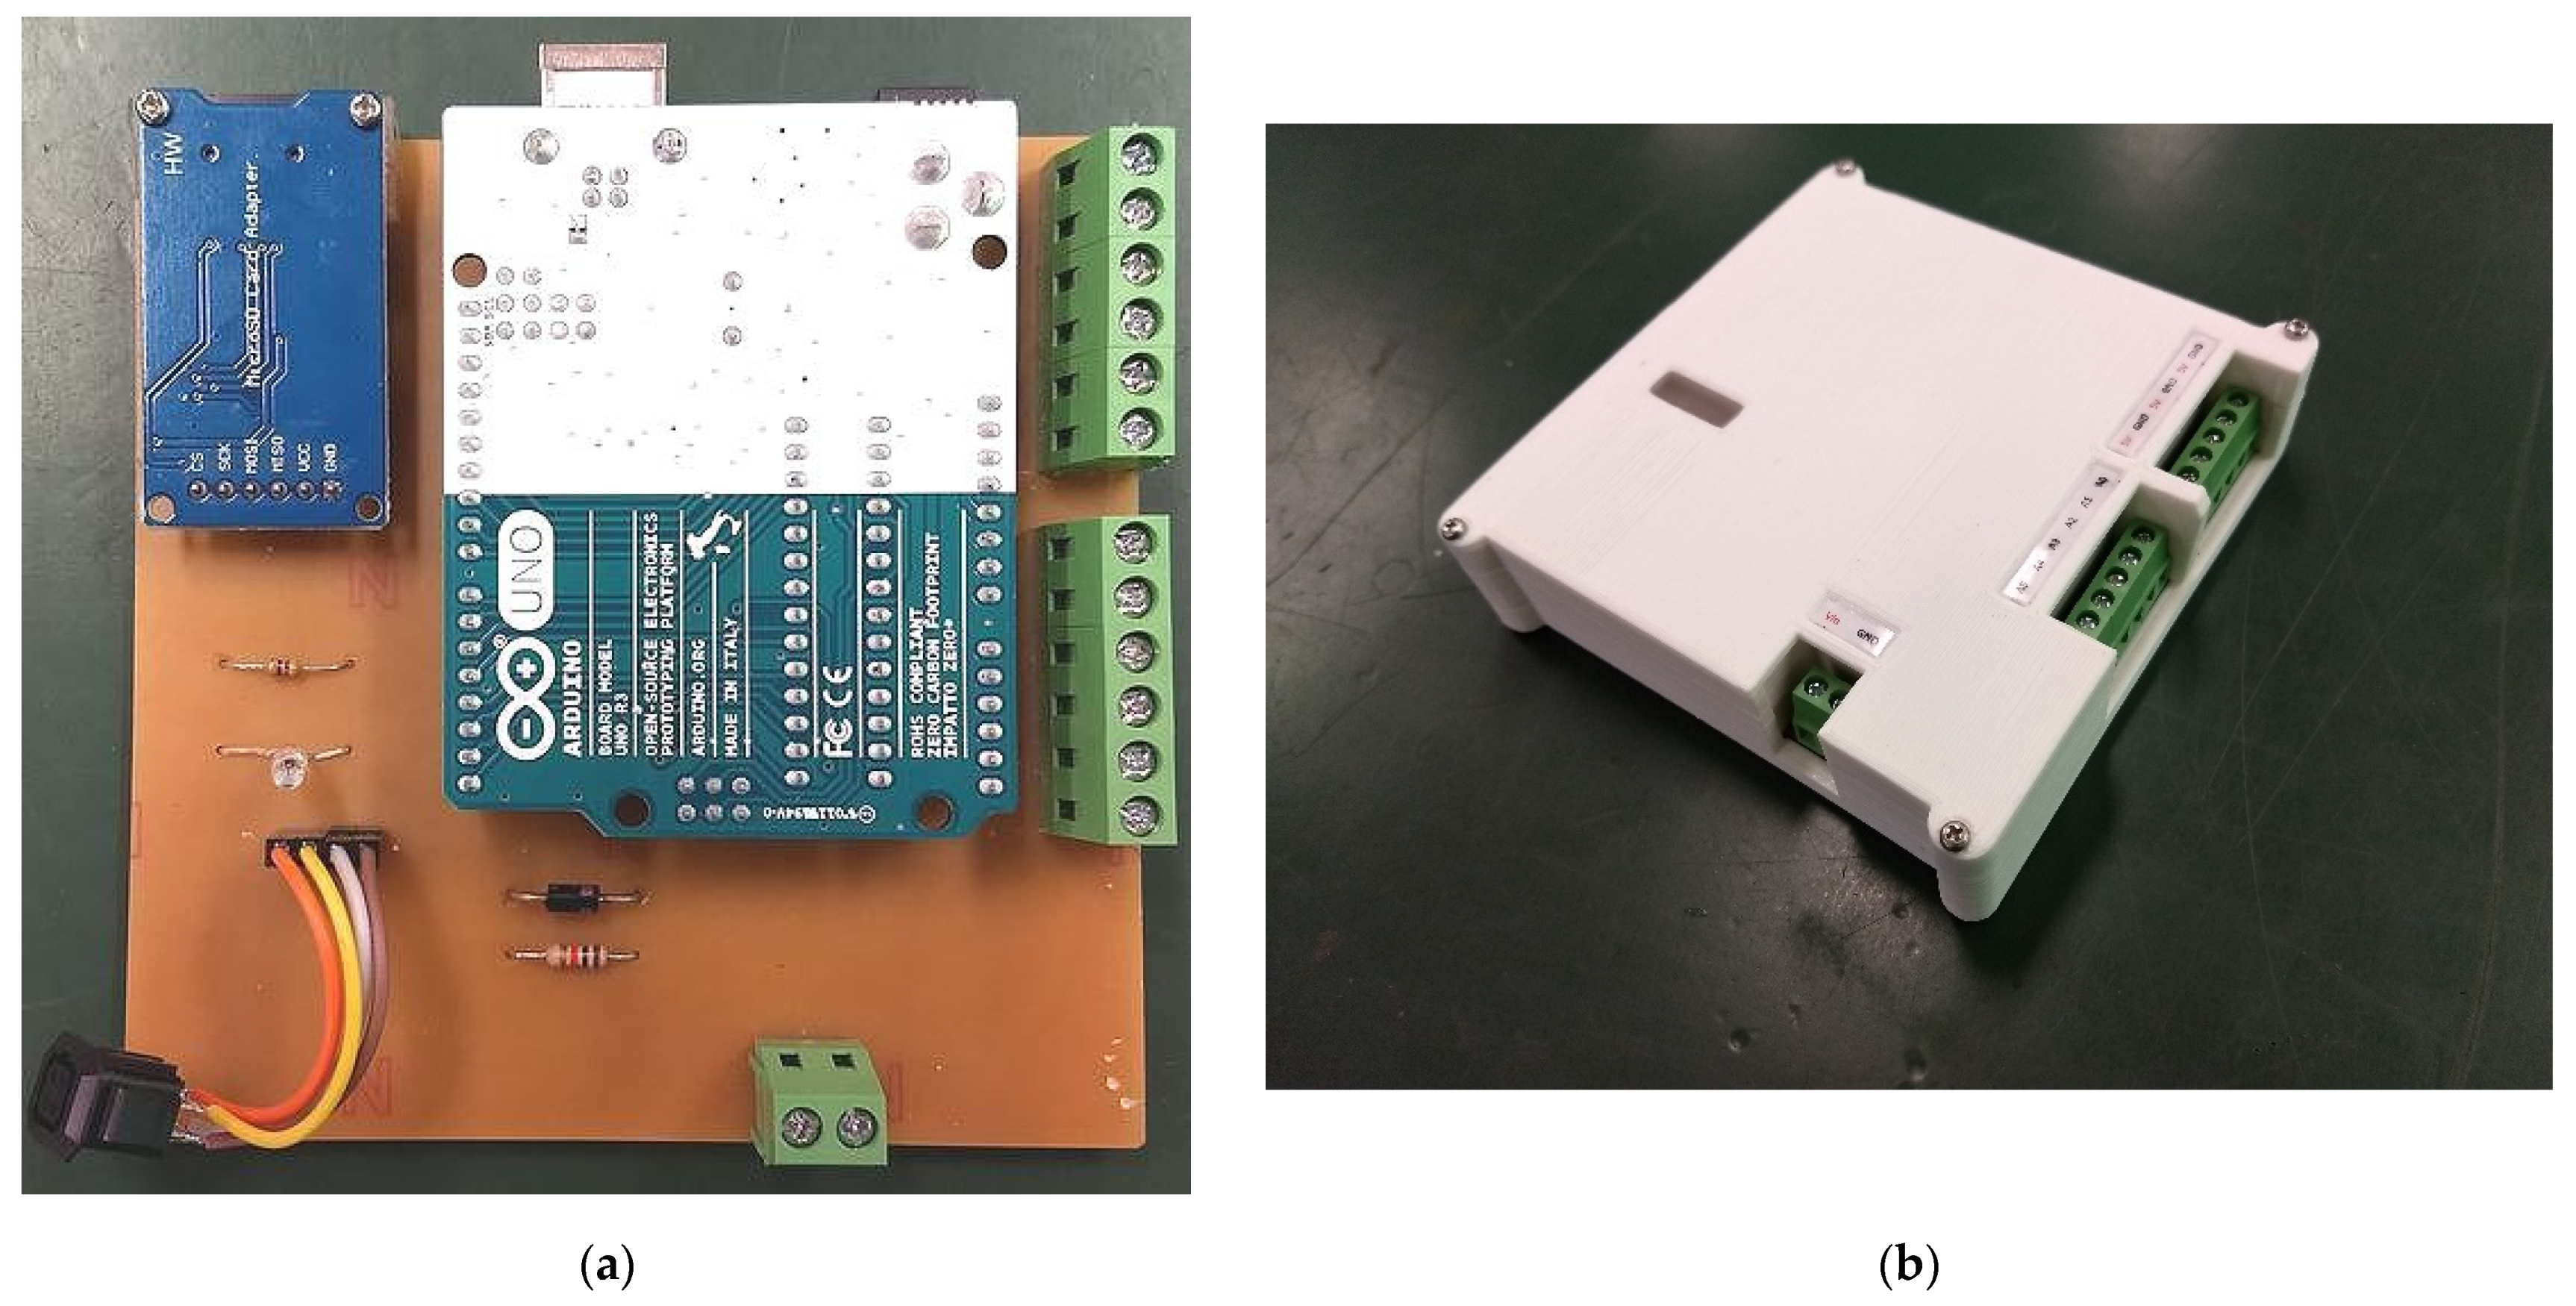
An automatic milling machine, KitMill CL420 (ORIGINALMIND, Inc., Nagano, Japan), was used for cutting the board. The wiring pattern of the completed board, cutting surface, and parts attached to the board are shown in Figure 2a. To protect and insulate the board, a silicon case (H 30 mm W 110 mm L 110 mm, weight: 170 g) was fabricated using the 3-D printer, Replicator Z18 (MakerBot Industries, LLC, NYC, New York, NY, USA) (Figure 2b). Through this procedure, we created a main component that protects the base circuit and facilitates its portability.
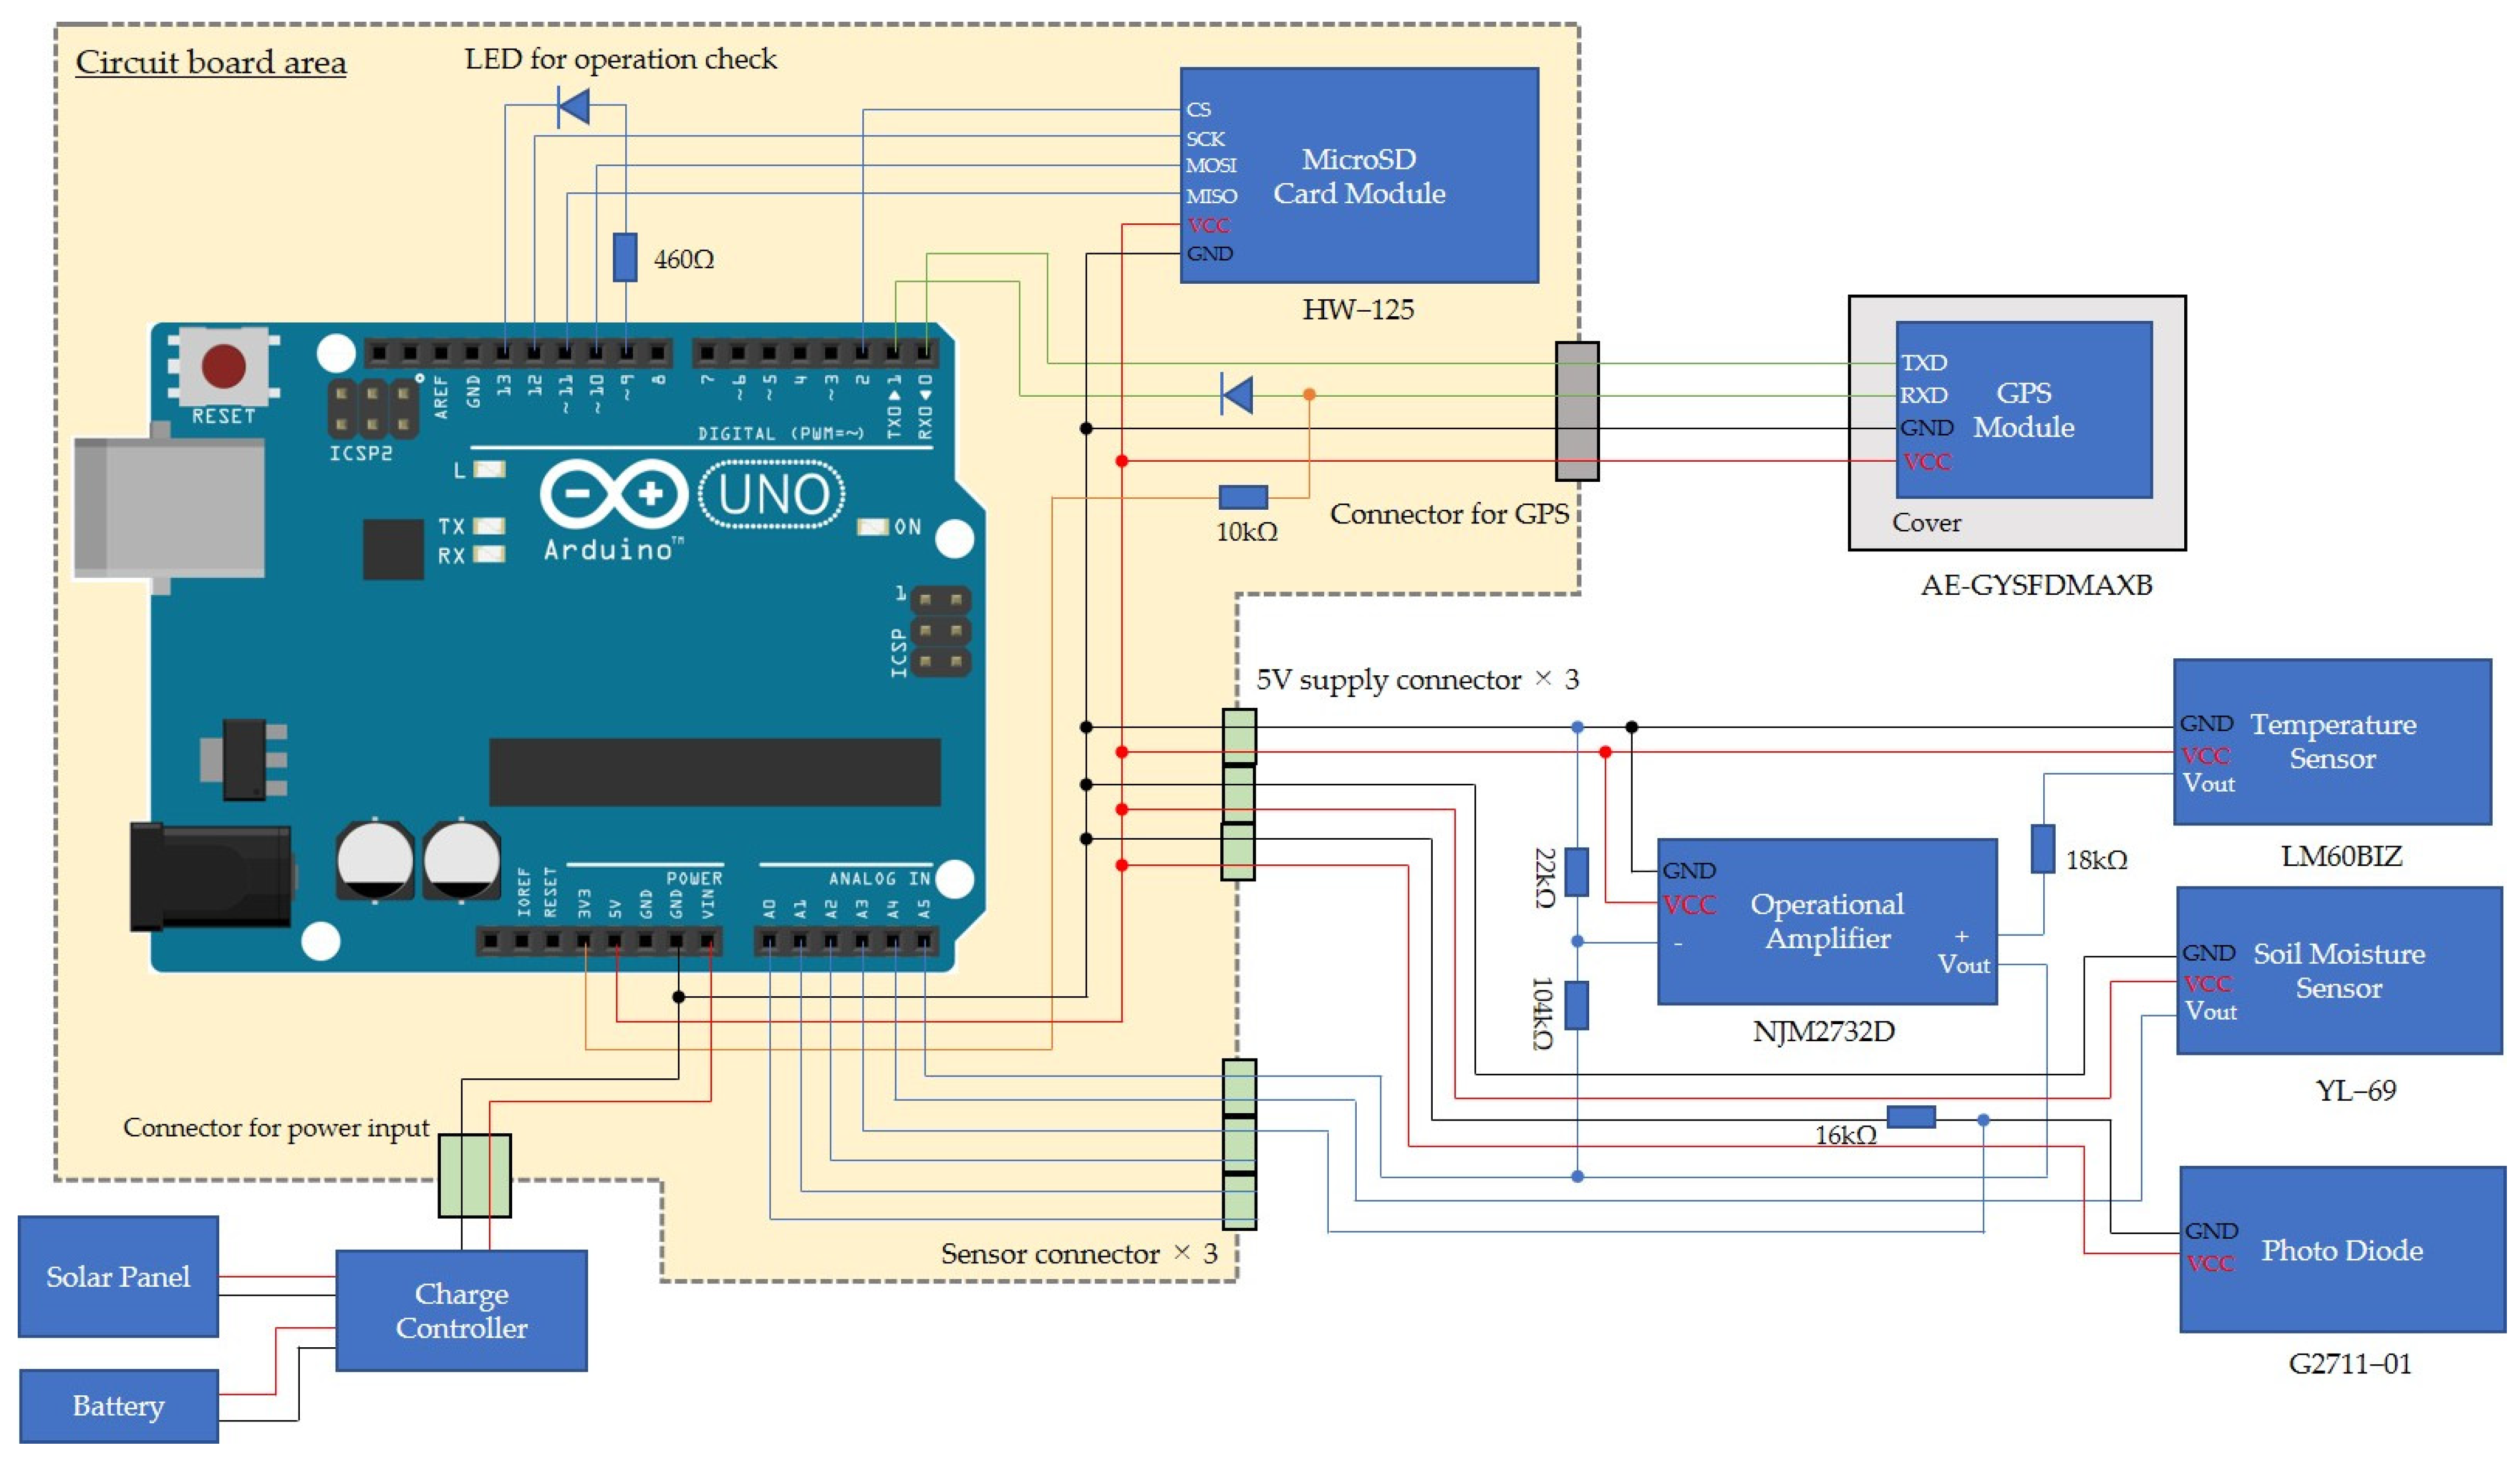
The measurement system consists of the Arduino Uno, micro-SD card, terminal block, and LED for checking the status of the module. The GPS module has an integrated antenna, such that it is extended by a cable and connected to the main unit by a plug and socket. In this study, each measurement sensor was wired to a terminal block powered by the Arduino, and its output signal was input to the analog port of the Arduino and stored in the micro-SD card (Figure 3).
2.2. Sensors
In this study, the environmental sensors (temperature, moisture, and light) were connected with the Arduino Uno boards for simplicity and cost effectiveness. Due to variable management, that is, within-field variability and between-field or regional variability application, an exceptional accuracy in the data collected by sensors is not inherently required. Therefore, general-purpose sensors were used in terms of precision to maintain a positive cost-effectiveness balance.
The air and soil temperature sensor (LM60BIZ, Texas Instruments, Inc., Dallas, TX, USA) is a simple and highly accurate integrated circuit temperature sensor from a single 2.7 V power supply and can measure temperatures ranging from −40 to +125 °C. The output voltage of the device is linearly proportional to the Celsius temperature by 6.25 mV/°C and has a DC offset of 424 mV. The nominal output voltage of the device ranges from 174 to 1205 mV for the temperature range −40 to +125 °C. The device is calibrated to provide accuracies of ±2 °C at room temperature and ±3 °C over the full −25 to +125 °C temperature range. With a quiescent current of less than 110 µA, self-heating is very low, limited to 0.1 °C in still air in the SOT−23 package. The shutdown capability for the device is intrinsic because its inherent low power consumption allows it to be powered directly from the output of many logic gates. Detailed specifications are shown in [31]. In this study, we selected this sensor because of its easy availability, wide temperature range, and simple circuitry.
To monitor the soil moisture levels, a precision integrated-circuit soil moisture sensor (YL–69, WINGONEER) was used [32]. It is a low-tech sensor, but it is ideal for monitoring the plant water level at a low cost. This sensor uses two probes to pass current through the soil. Then, the resistance is read to obtain the moisture level. The sensor is connected to Arduino using the expansion shield. Its operating voltage is from 3.3 to 5.0 V; it has both digital and analog outputs. The digital output can be connected directly to the microcontroller to detect high and low values in the soil. With the analog output through the AD converter, the system can obtain more precise values of the soil moisture. Because this sensor is very cheap, calibration at different points is necessary to ensure precise measurement using well-known standard solutions. We used this sensor to measure soil moisture, considering its price and ease of use.
A GaAsP photodiode (G2711–01, Hamamatsu Photonics K.K., Shizuoka, Japan) [33] was selected as the PPFD sensor based on existing studies using GaAsP photodiodes [34,35,36]. The GaAsP photodiode with planar diffusion type has the advantages of rapid rise-time, relatively low temperature coefficient, and spectral response close to the 400–700 nm waveband. Its spectral sensitivity over the wavelength range is from 300 to 680 nm. The maximum sensitivity wavelength is 640 nm, whereas the values of dark current are 1 (max.) and 10 pA (max.) for reverse voltages of 10 and 1 mV, respectively. Meanwhile, the values of the short circuit current are 0.15 (min.) and 0.18 μA (typ.). The primary sources of deviation from the reference are the cosine and azimuth, temperature dependence, spectral response, and signal drift errors. Data on the long-term stability of GaAsP photodiodes were not provided by the manufacturers (Fielder and Comeau 2000); however, significant errors can occur due to weather effects and failure to clean the diffusers. Fielder and Comeau provide the specific error information in their study [34]. Nevertheless, the errors in these sensors are tolerable when compared against the benefits of their availability and usage at a low cost [37]. The coefficient of determination between G2711–01 and LI–190R quantum sensors exhibited a good agreement (R2 = 0.992) [34]. Therefore, G2711–01 was chosen in this study.
2.3. Software Specification
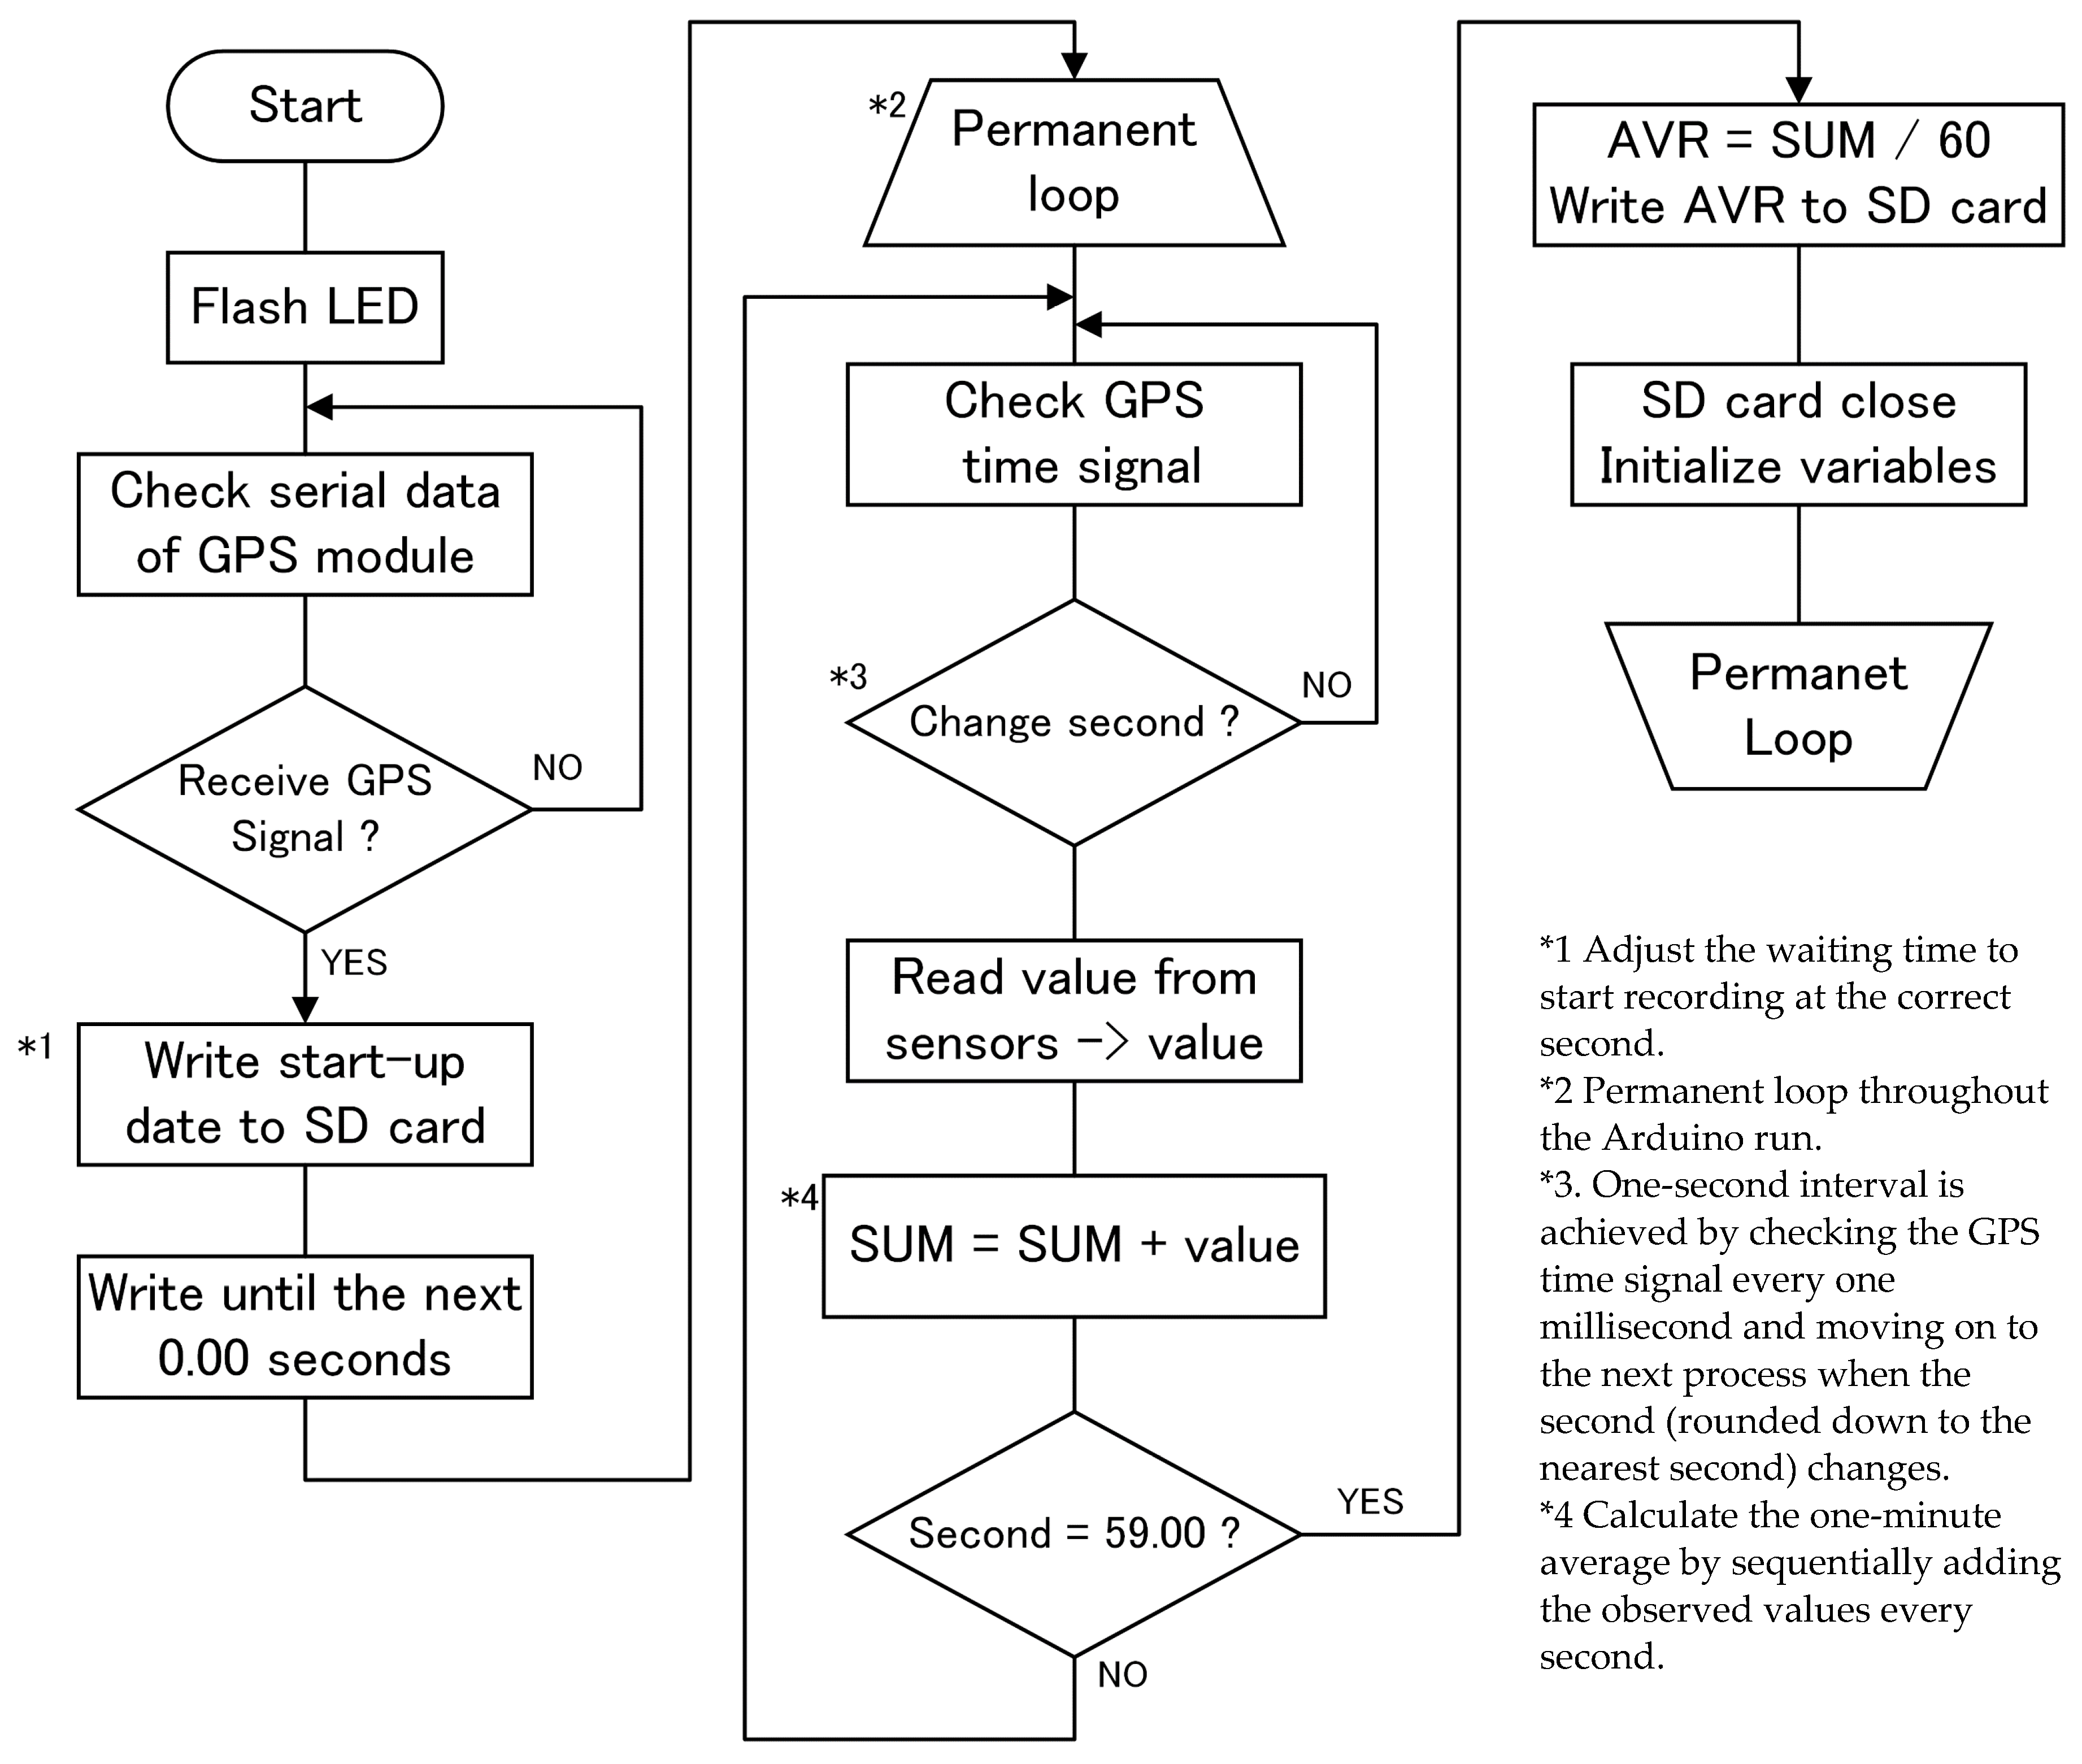
The proposed hydrometeorological measurement system should periodically read the voltage values from the sensors through a software and save the values to the SD card. This platform has the particularity of being an open-source system that works via the C++ programing language. At present, when the system starts up, Arduino checks the GPS signal reception, and then starts the data recording loop. The voltage value from the sensor is read and AD-converted by Arduino (5 V Max/10 bit) every second, which is then averaged for 1 min and recorded on an SD card. The time sequence is controlled by the GPS signal rather than the internal clock of the Arduino, to achieve higher precision. As the GPS module receives a signal every second, data acquisition was performed at 1-s intervals using the GPS signal as the trigger. In this system, the data reading and recording intervals can be set to arbitrary values. Figure 4 shows the data flow diagram of the measurement system. The user can easily set the sampling and recording intervals of the data as desired. The software that controls the set of measurement devices in this system was coded on the C++ language, and the source code is available from the corresponding author upon request.
2.4. Calibration and Measurement of Sensors in the Field
In this study, TR−72wb (T&D Corporation, Tokyo, Japan), TR−71wb (T&D Corporation, Tokyo, Japan), and LI−190R (LI-COR, Inc., Lincoln, NE, USA) were used as reference sensors for air, soil temperature, and PPFD, respectively. To calibrate the LM60BIZ sensor for air and soil temperatures, we mounted it in the air at a height of 50 cm above ground and in the soil at a 10-cm depth beside the reference sensor in the grass field and collected data under the open sky throughout the day. To calibrate the YL–69 sensor for soil moisture, the soil sample collected from the field was oven dried at 105 °C to constant weight. After weighing, the soil was wetted in the container with 5 mL of water at 25 °C and then mixed thoroughly to ensure that the water was evenly distributed. Consequently, the mass of the wet soil was measured. Thereafter, the soil was wetted with a water injection of 5 mL, and its mass was revaluated; this was repeated continuously until the soil was saturated. After saturation, the wet soil was oven dried at 105 °C to constant weight and was used for the estimation of the bulk density of the soil. These procedures of capacitive soil moisture sensor calibration were based on [38]. To calibrate the G2711–01 sensor for PPFD, we mounted it on a calibration plate beside LI–190R, and collected data for the whole day. Each sensor on the calibration plate was maintained at a certain level using the bubble level tool. The temperature and PPFD values were recorded every 1 min. Finally, analog output values from the LCMS sensor were used as the independent variable, and the values of the reference sensors were used as the dependent variable. The regression slope and intercept parameters were obtained by the regression procedure. The voltage of the LM60BIZ sensor was maintained at 424 mV at 0 °C and increased at a rate of 625 mV per degree rise in the temperature. In addition, based on the calibration constant of LI–190R, the voltage–PPFD ratio was 401. The Arduino transformed 0–1023 units of analog output to a voltage of 0–5 V via AD conversion. Therefore, with analog output as the explanatory variable, temperature and PPFD were obtained using the following equations:
where I is the return value of the analog reading; however, as the aforementioned equations are standard equations, it must be calibrated before the measurement. The LM60BIZ and YL–69 sensors were calibrated using the measurement data from the 4th and 5th of July, while the G2711–01 sensor was calibrated using the data from the 12th and 13th of May.
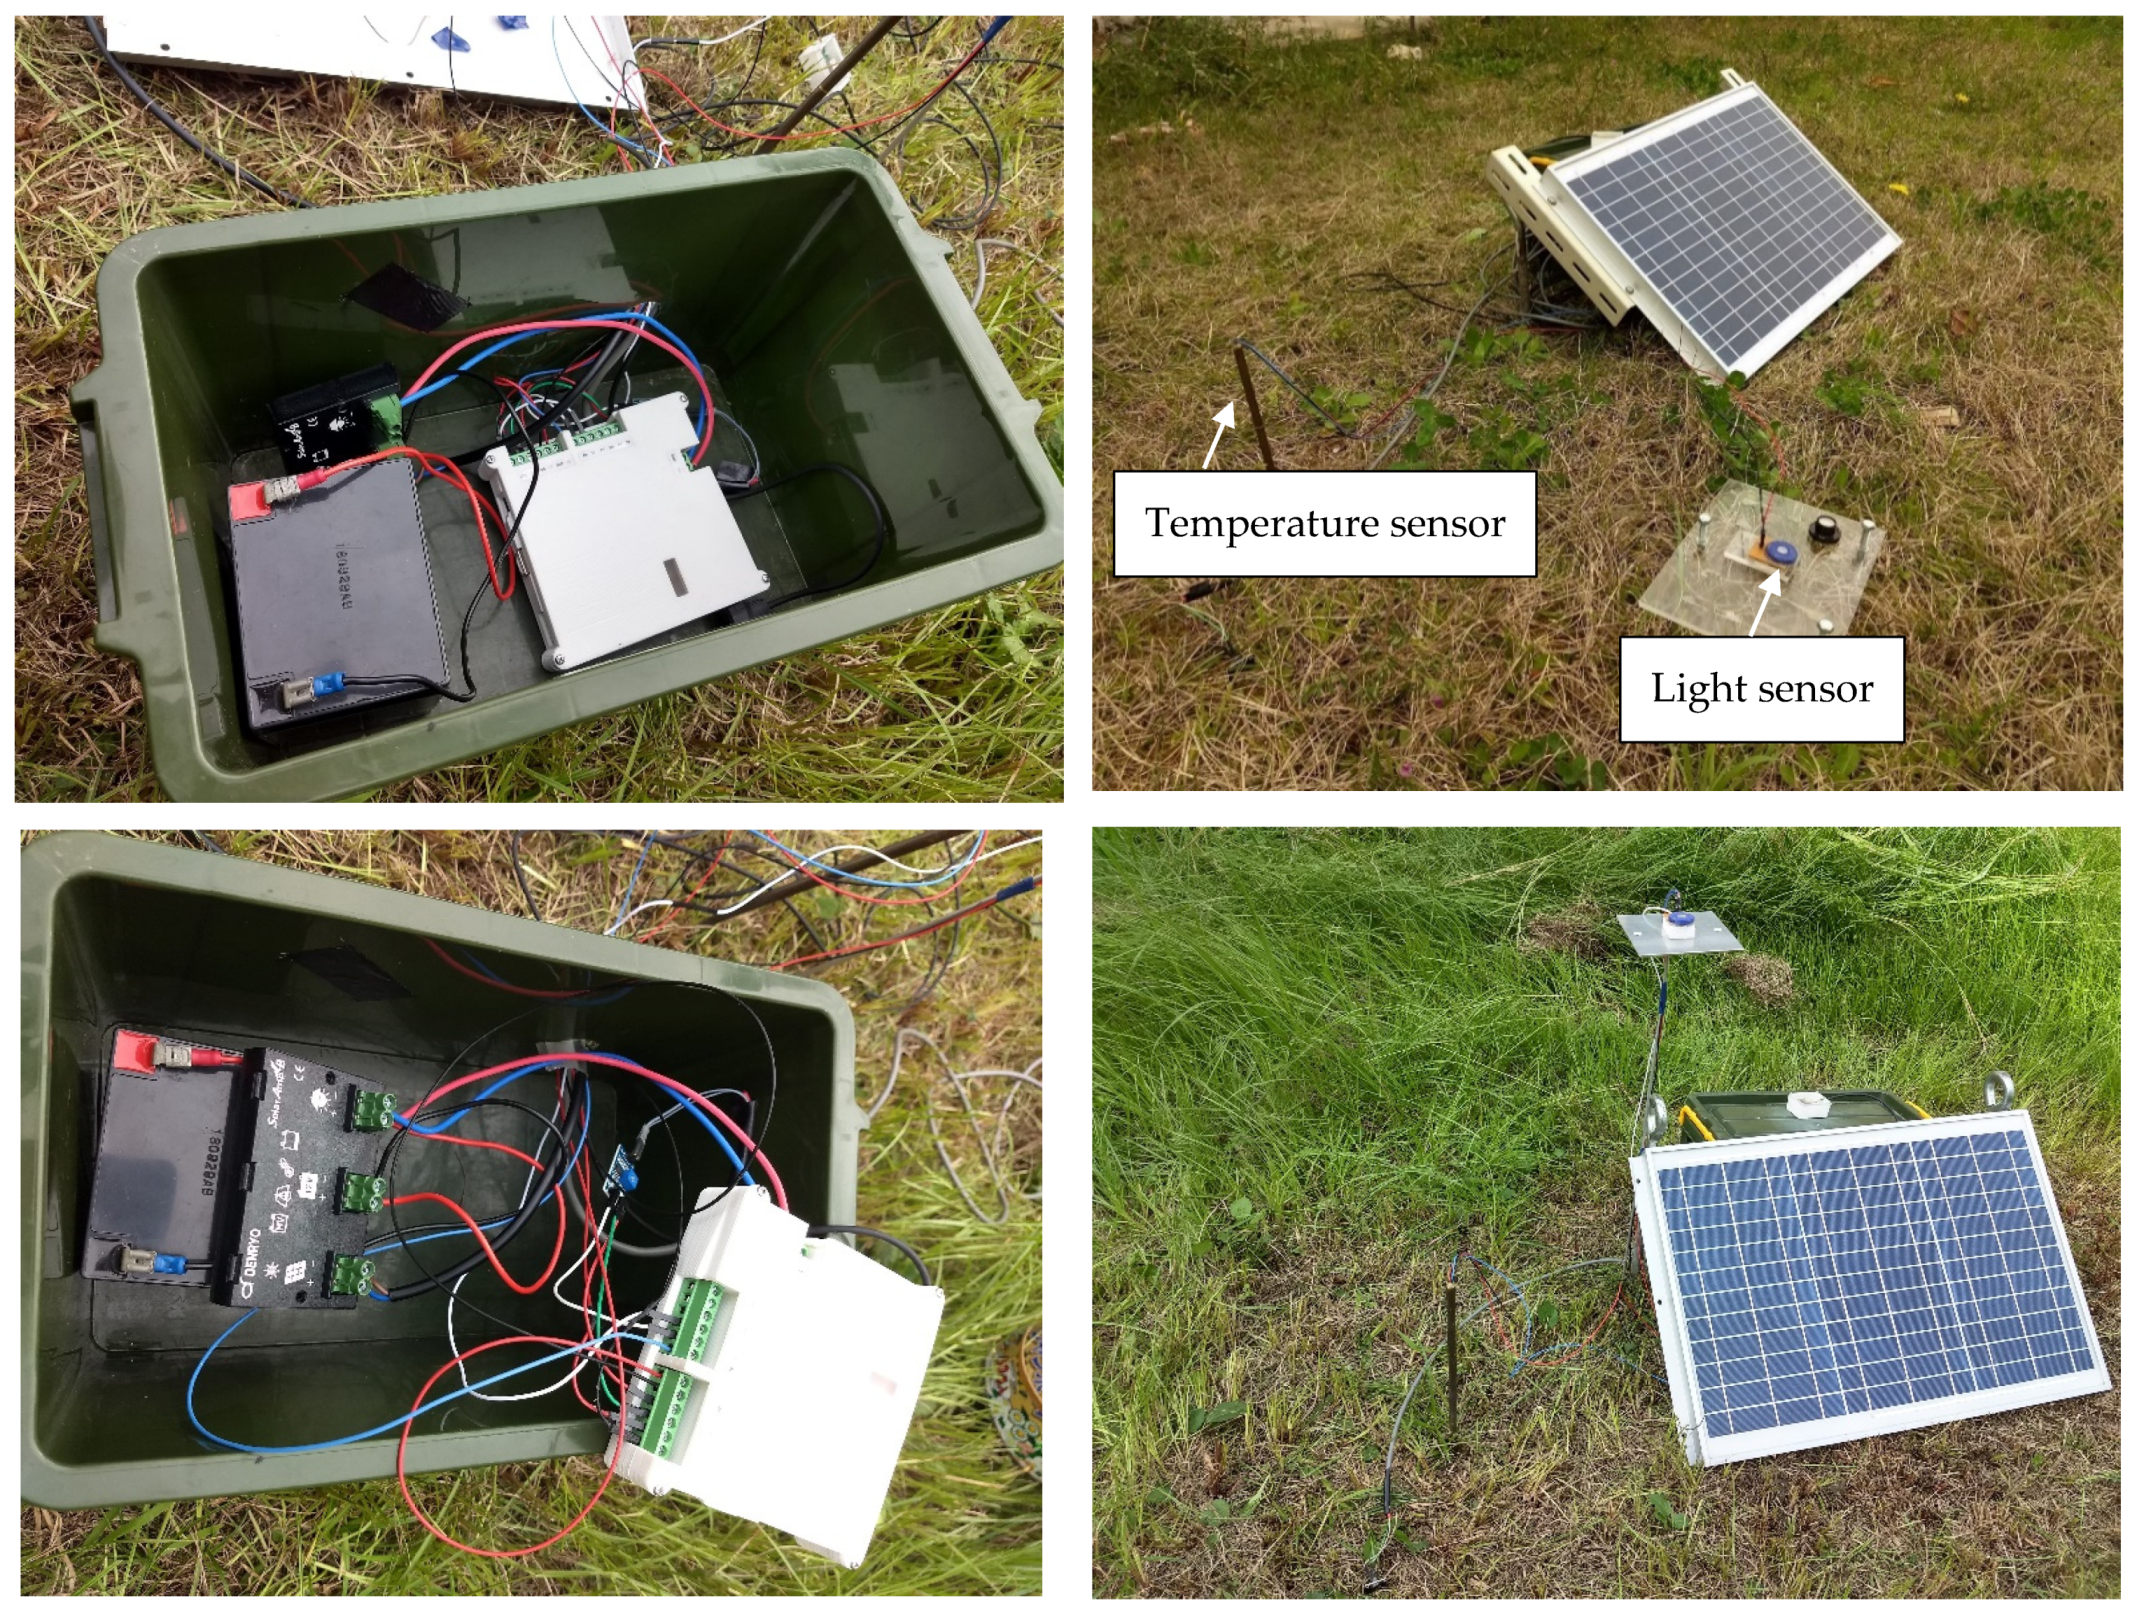
Finally, we conducted actual measurements at the grass field in the DPRI (34.91 N, 135.80 E) using the setup shown in Figure 5. Our device was powered by solar panels (GW−020H, GW Solar, Inc., Tokyo, Japan), a charger controller (SA−BA10, Denryo Co., Ltd., Tokyo, Japan), and batteries (WP5−12, Kung Long Batteries Industrial Co., Ltd., Taiwan).
3. Results
3.1. Production Costs
Table 1 lists the components, sources (e.g., vendors), and approximate cost per unit required to build an Arduino datalogger. The approximate total cost, excluding labor, to build a single datalogger is approximately $72 ($1 = 110 JPY). In addition, Table 2 outlines the price list of the sensors used in this system. Although it is difficult to perform simple comparisons because of the differences in the numbers of sensors, sensor resolutions, and functions (with or without communication module), an initial estimate suggests that the cost of the developed system was approximately one-tenth of the cost of a commercially available system (based on the commercial price listed on their website). In addition, the price of each sensor is approximately 1% more than that of the corresponding commercially available sensor. Therefore, this system meets the requirements of a low-cost system. The data sampling interval can also be configured to any desired value with a slight modification of the source code, whereas the temporal resolution and accuracy are sufficient for measuring the hydrometeorological data, as observed from comparisons with the commercially available equipment. Although no other related measurement system can be compared with the developed device, the newly developed system can be compared with recent low-cost systems built using similar hardware. Because the unit prices of these parts are lower when the parts are bought in bulk than by piece, the cost will be much lower when more copies of this system are constructed. Table 3 outlines the working time required for production of the hardware, which includes the manufacturing of the system and arrangement of all components to create the finished product. The modeling of the case by the 3-D printer consumes a considerable amount of time and is expected to become a bottleneck when many cases are manufactured. Meanwhile, if we request a vendor to manufacture the case, we can assemble the system in a shorter time. Therefore, based on the number of devices, it may be more efficient to procure inexpensive cases from the market.
3.2. Evaluation of Sensor Accuracy
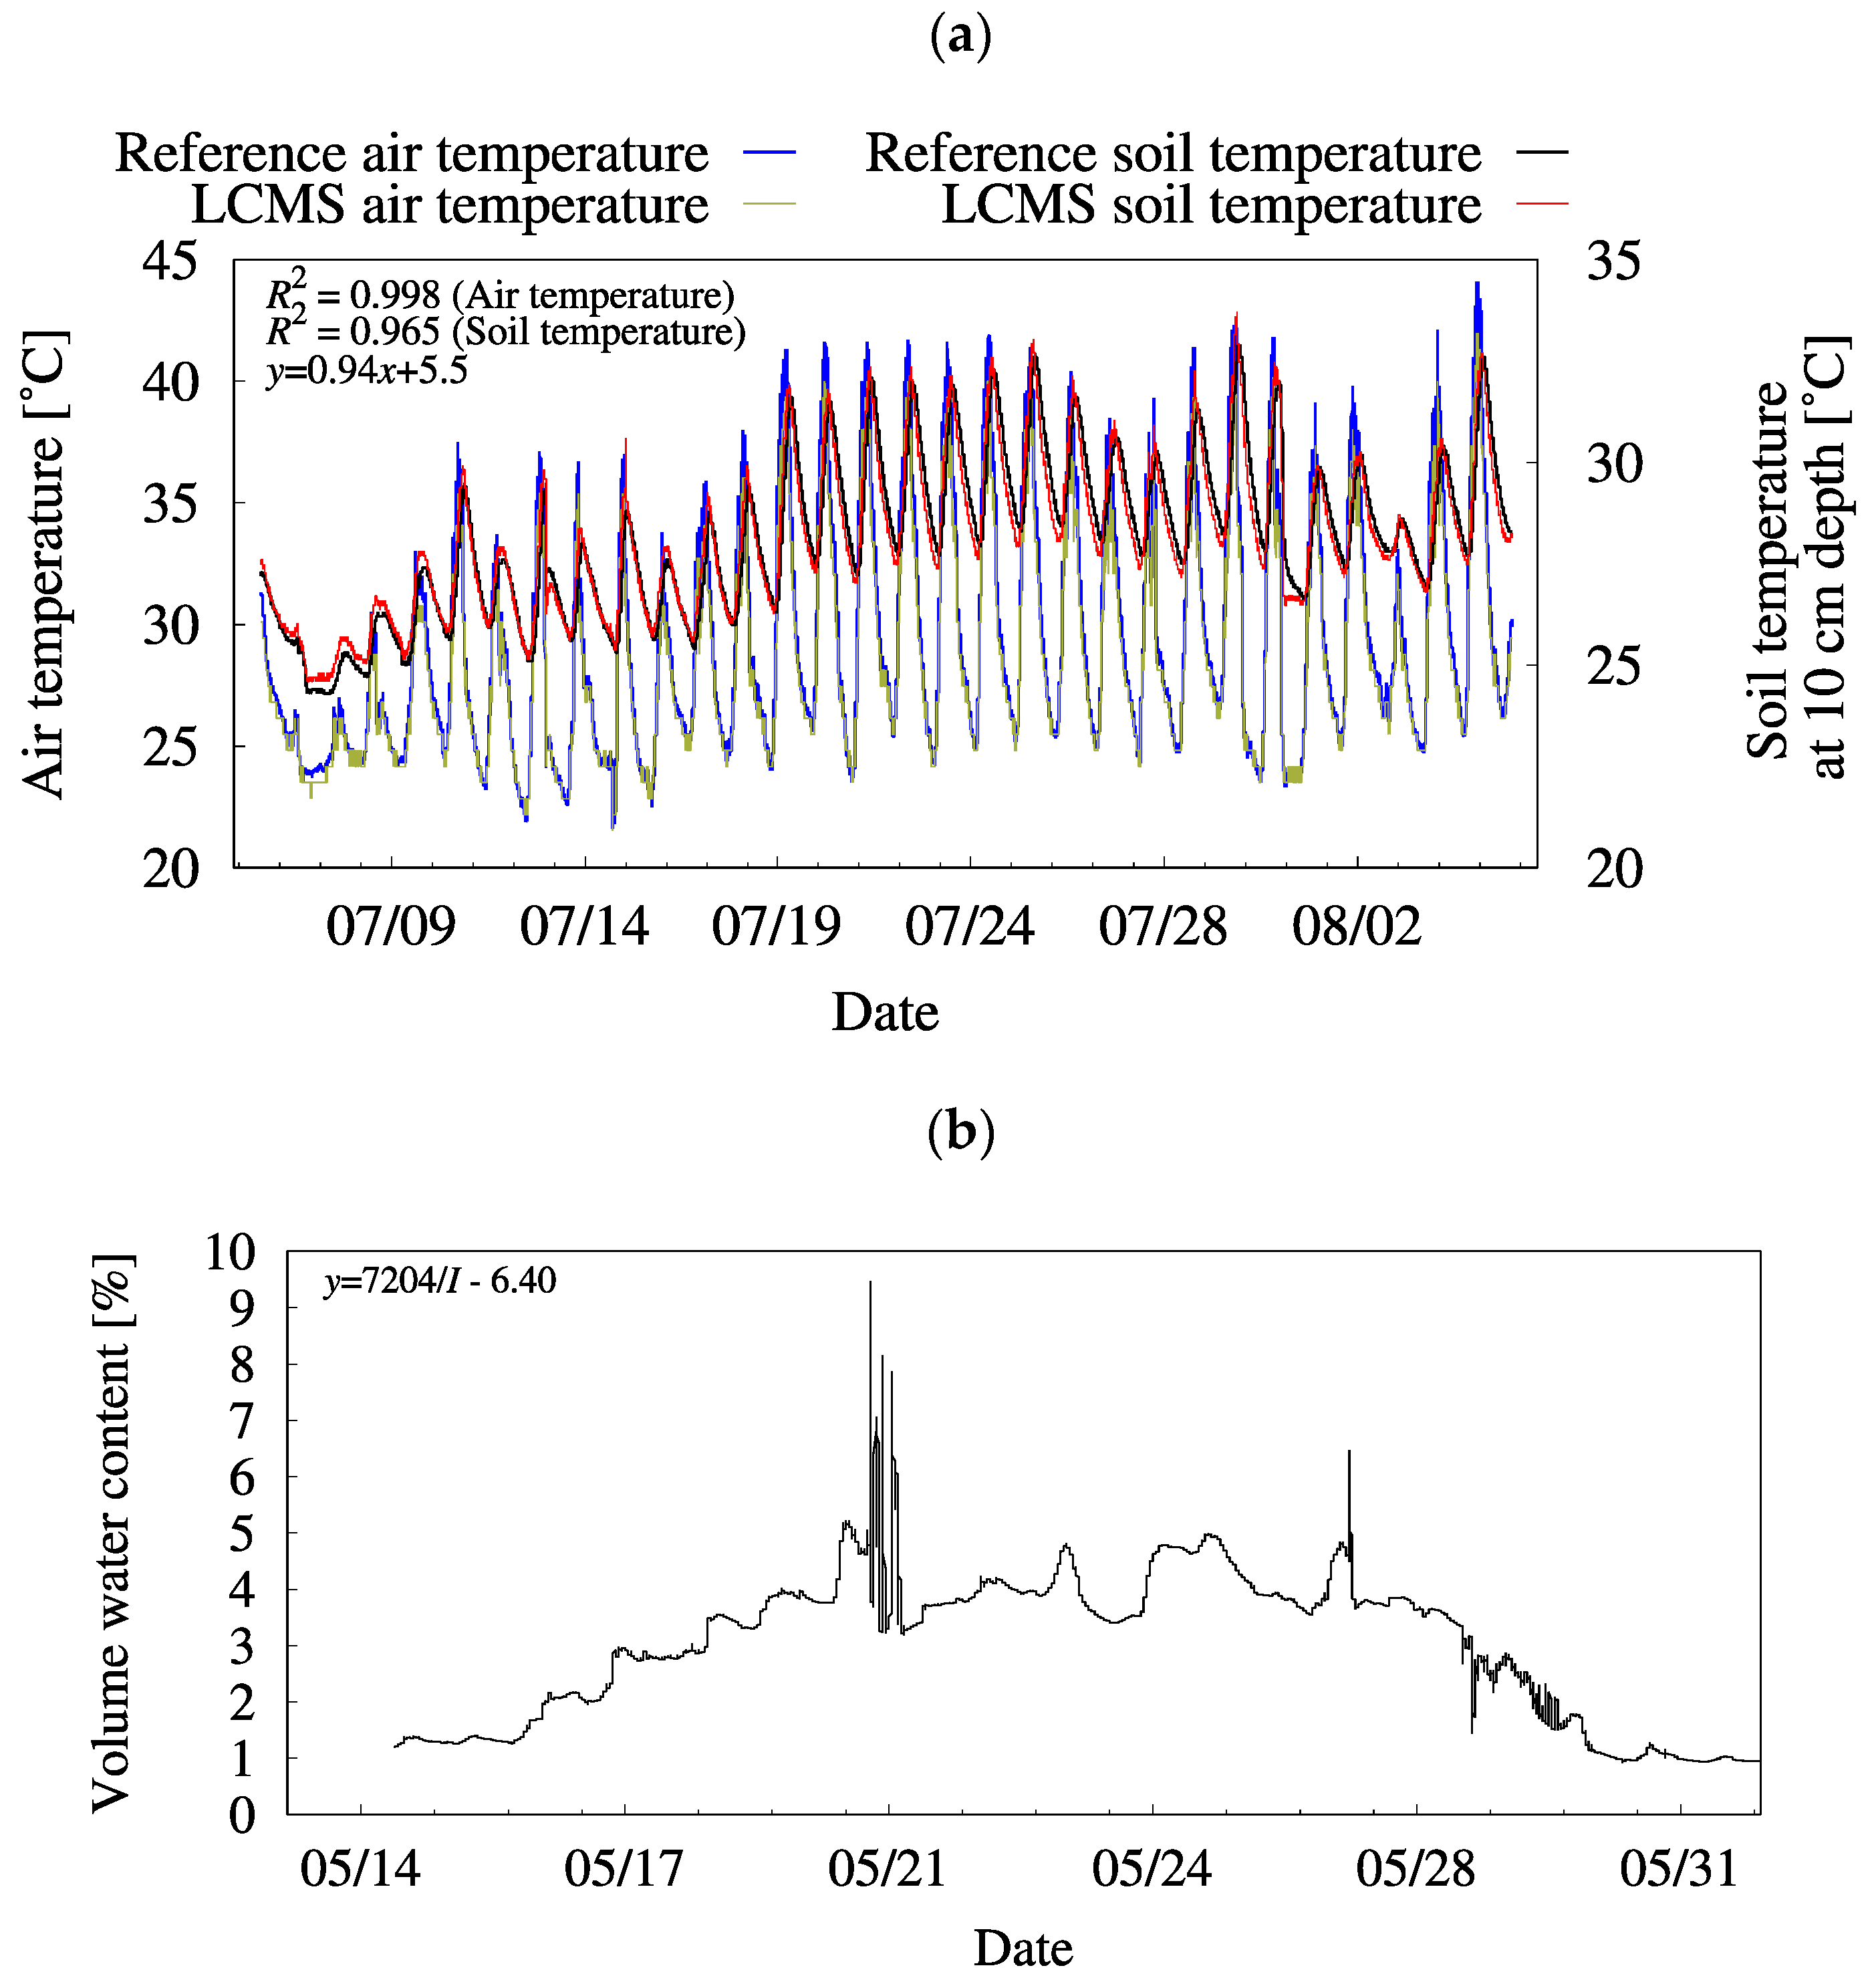
Figure 6 shows the reference and LCMS-measured values for air and soil temperature (30 days), soil moisture (only LCMS) (19 days), and PPFD (19 days). As the equipment worked continuously over 19 days without any problems, the sturdiness of the proposed system is sufficiently demonstrated.
The performance measures used for evaluation were R2, Nash–Sutcliffe efficiency (NSE), and percent bias (PBIAS). These indices are more appropriate for evaluating accuracy and trends, such as the goodness of fit and over and underestimation of measurement values. R2 is a measure of the goodness of data fit between the reference and measured values and ranges from 0 to 1, where R2 = 1 indicates a perfect correlation without error from the reference values. NSE is a normalized statistic that indicates the relative magnitude of the residual variance compared to the reference data variance. NSE ranges from −∞ to 1 and signifies how well the plot of reference versus measured data values fits the 1:1 line. NSE = 1 indicates that the reproductivity is perfect. It is calculated as follows:
where n is the total number of samples, is the reference value at i, is the value measured using the system, and is the mean of the reference value for the component being evaluated. Similarly, PBIAS measures the average tendency of the measured data to be larger or smaller than their referenced counterparts. A positive value indicates underestimation bias, whereas a negative value indicates overestimation bias of sensors. The optimal value of PBIAS is zero. PBIAS (%) is calculated as follows:
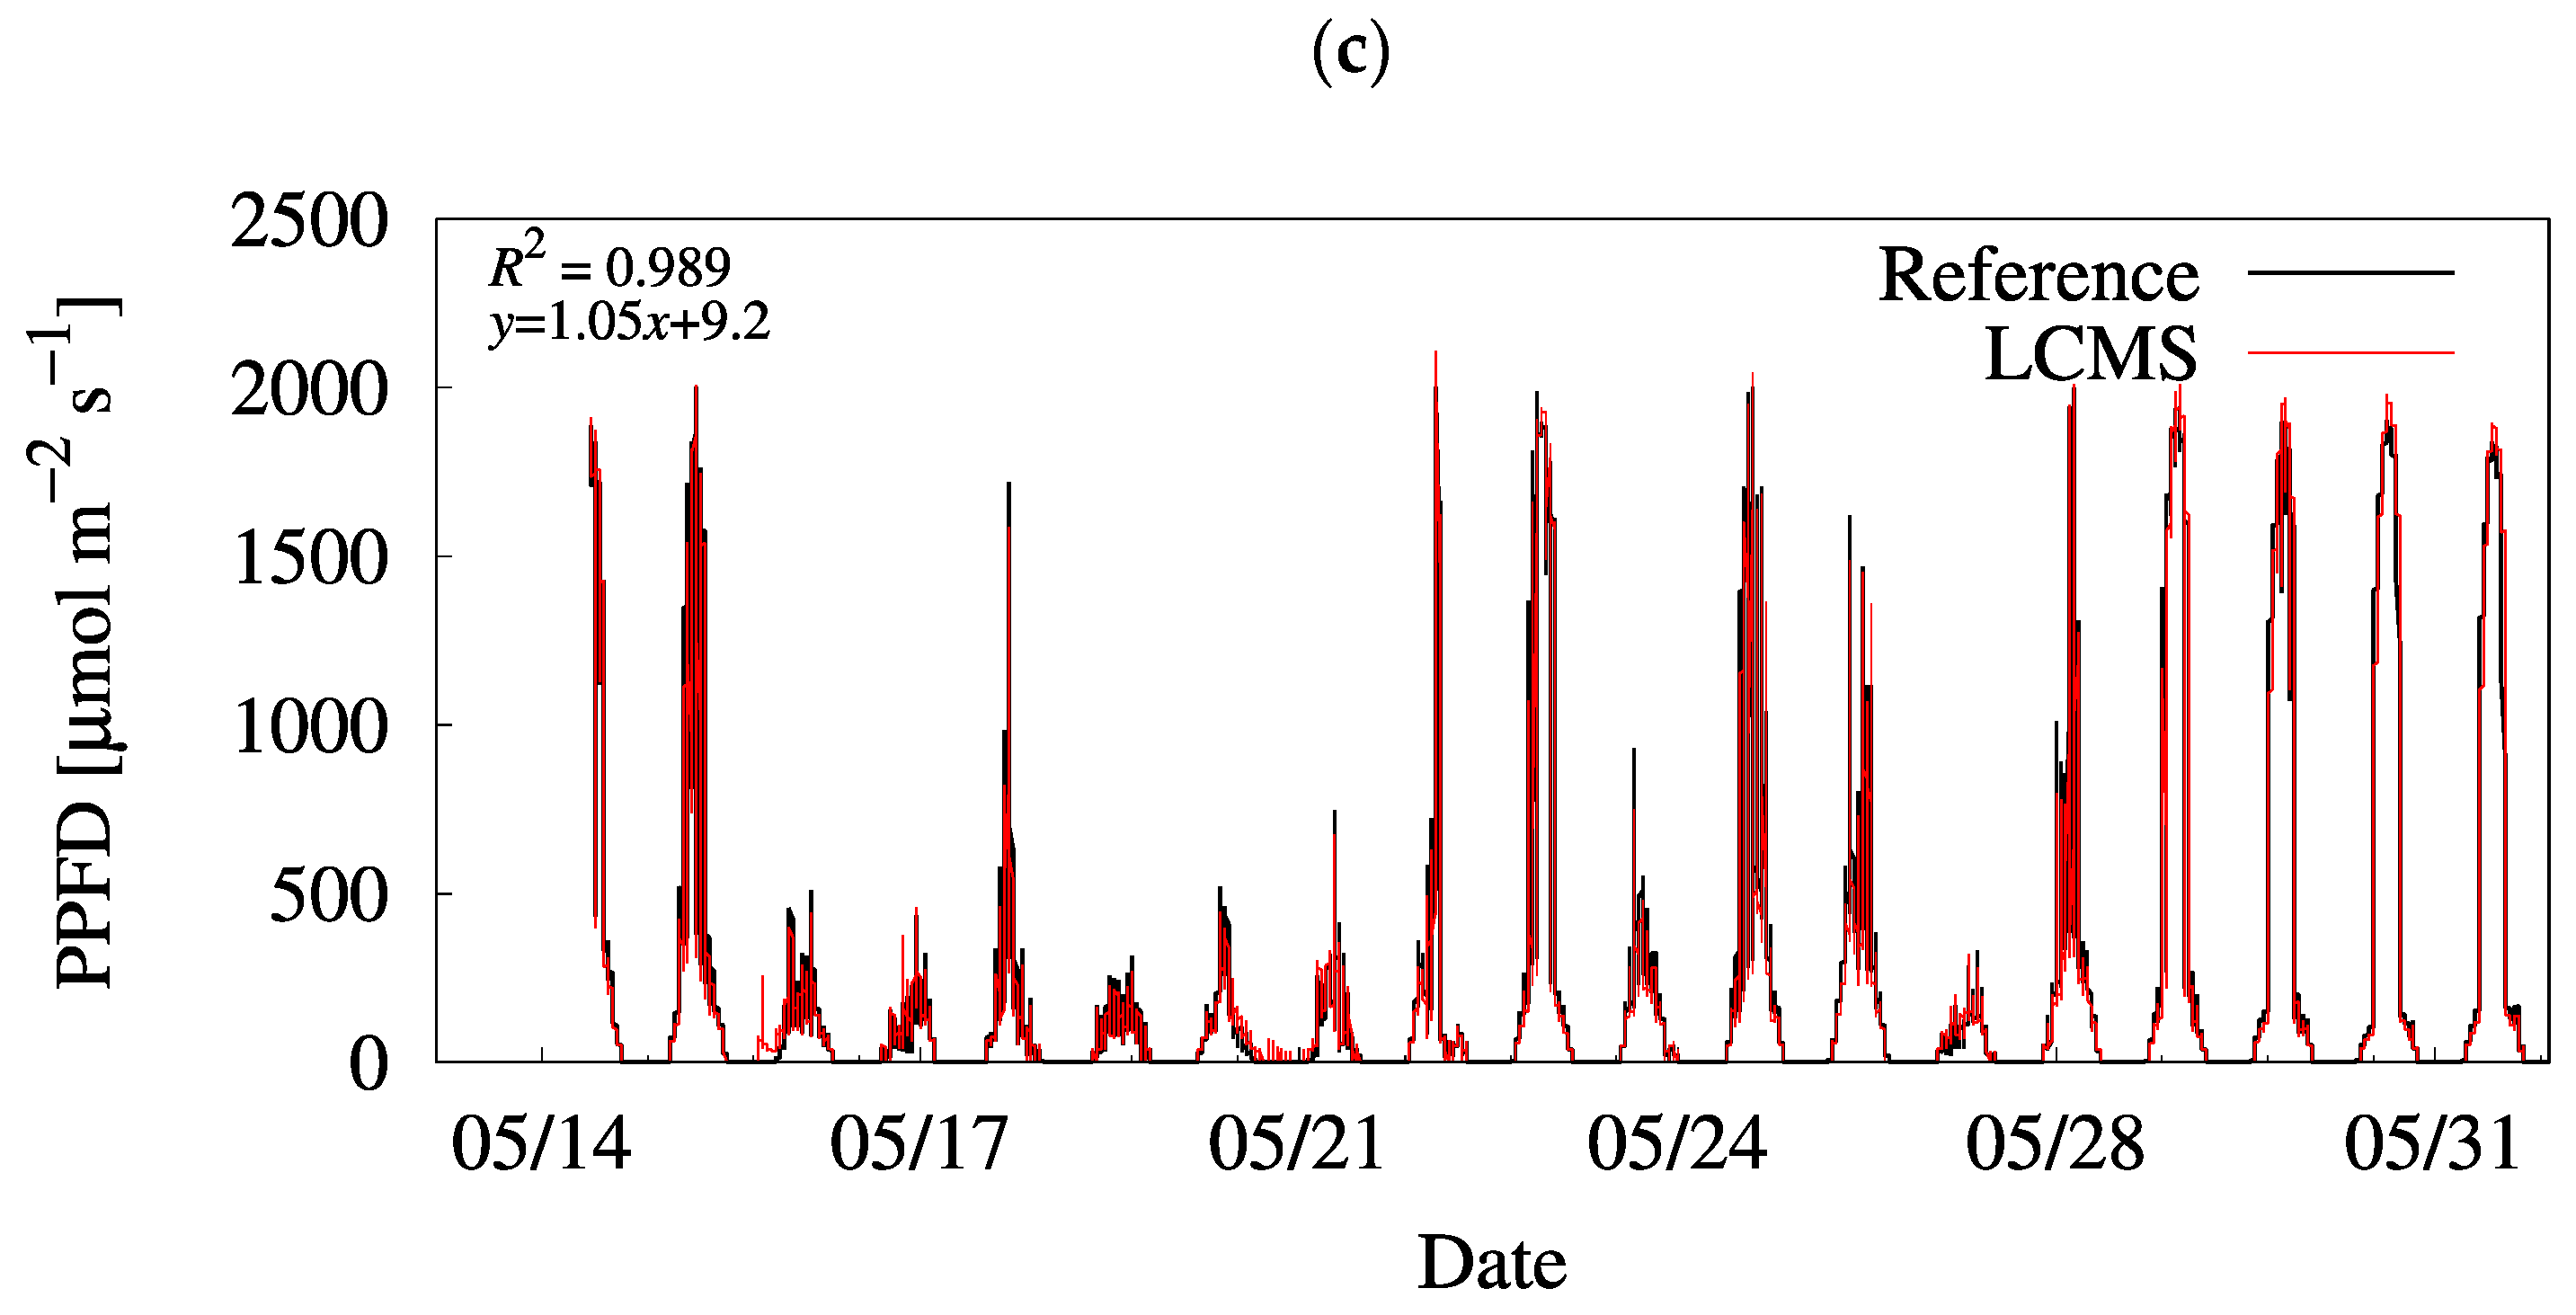
Table 4 presents the summarized error statistics for the reference and measured values over the entire period of the experiment. Air and soil temperature and PPFD, which were measured using a handmade sensor cover in use, indicated good accuracy across the range of measurement periods (Figure 7). The measured values of air temperature exhibited good compliance, resulting in R2, NSE, and PBIAS of 0.998, 0.996, and 0.00254, respectively. Similarly, for soil temperature, the values of R2, NSE, and PBIAS were 0.965, 0.889, and −1.15, respectively. These values indicate that the sensor performance was within the satisfactory range. The measured values of PPRD when the cover was in use (R2 = 0.989, NSE = 0.977, PBIAS = 0.015) were also appropriate.
4. Discussion
4.1. Accuracy of PPFD Measurement Using a Photodiode
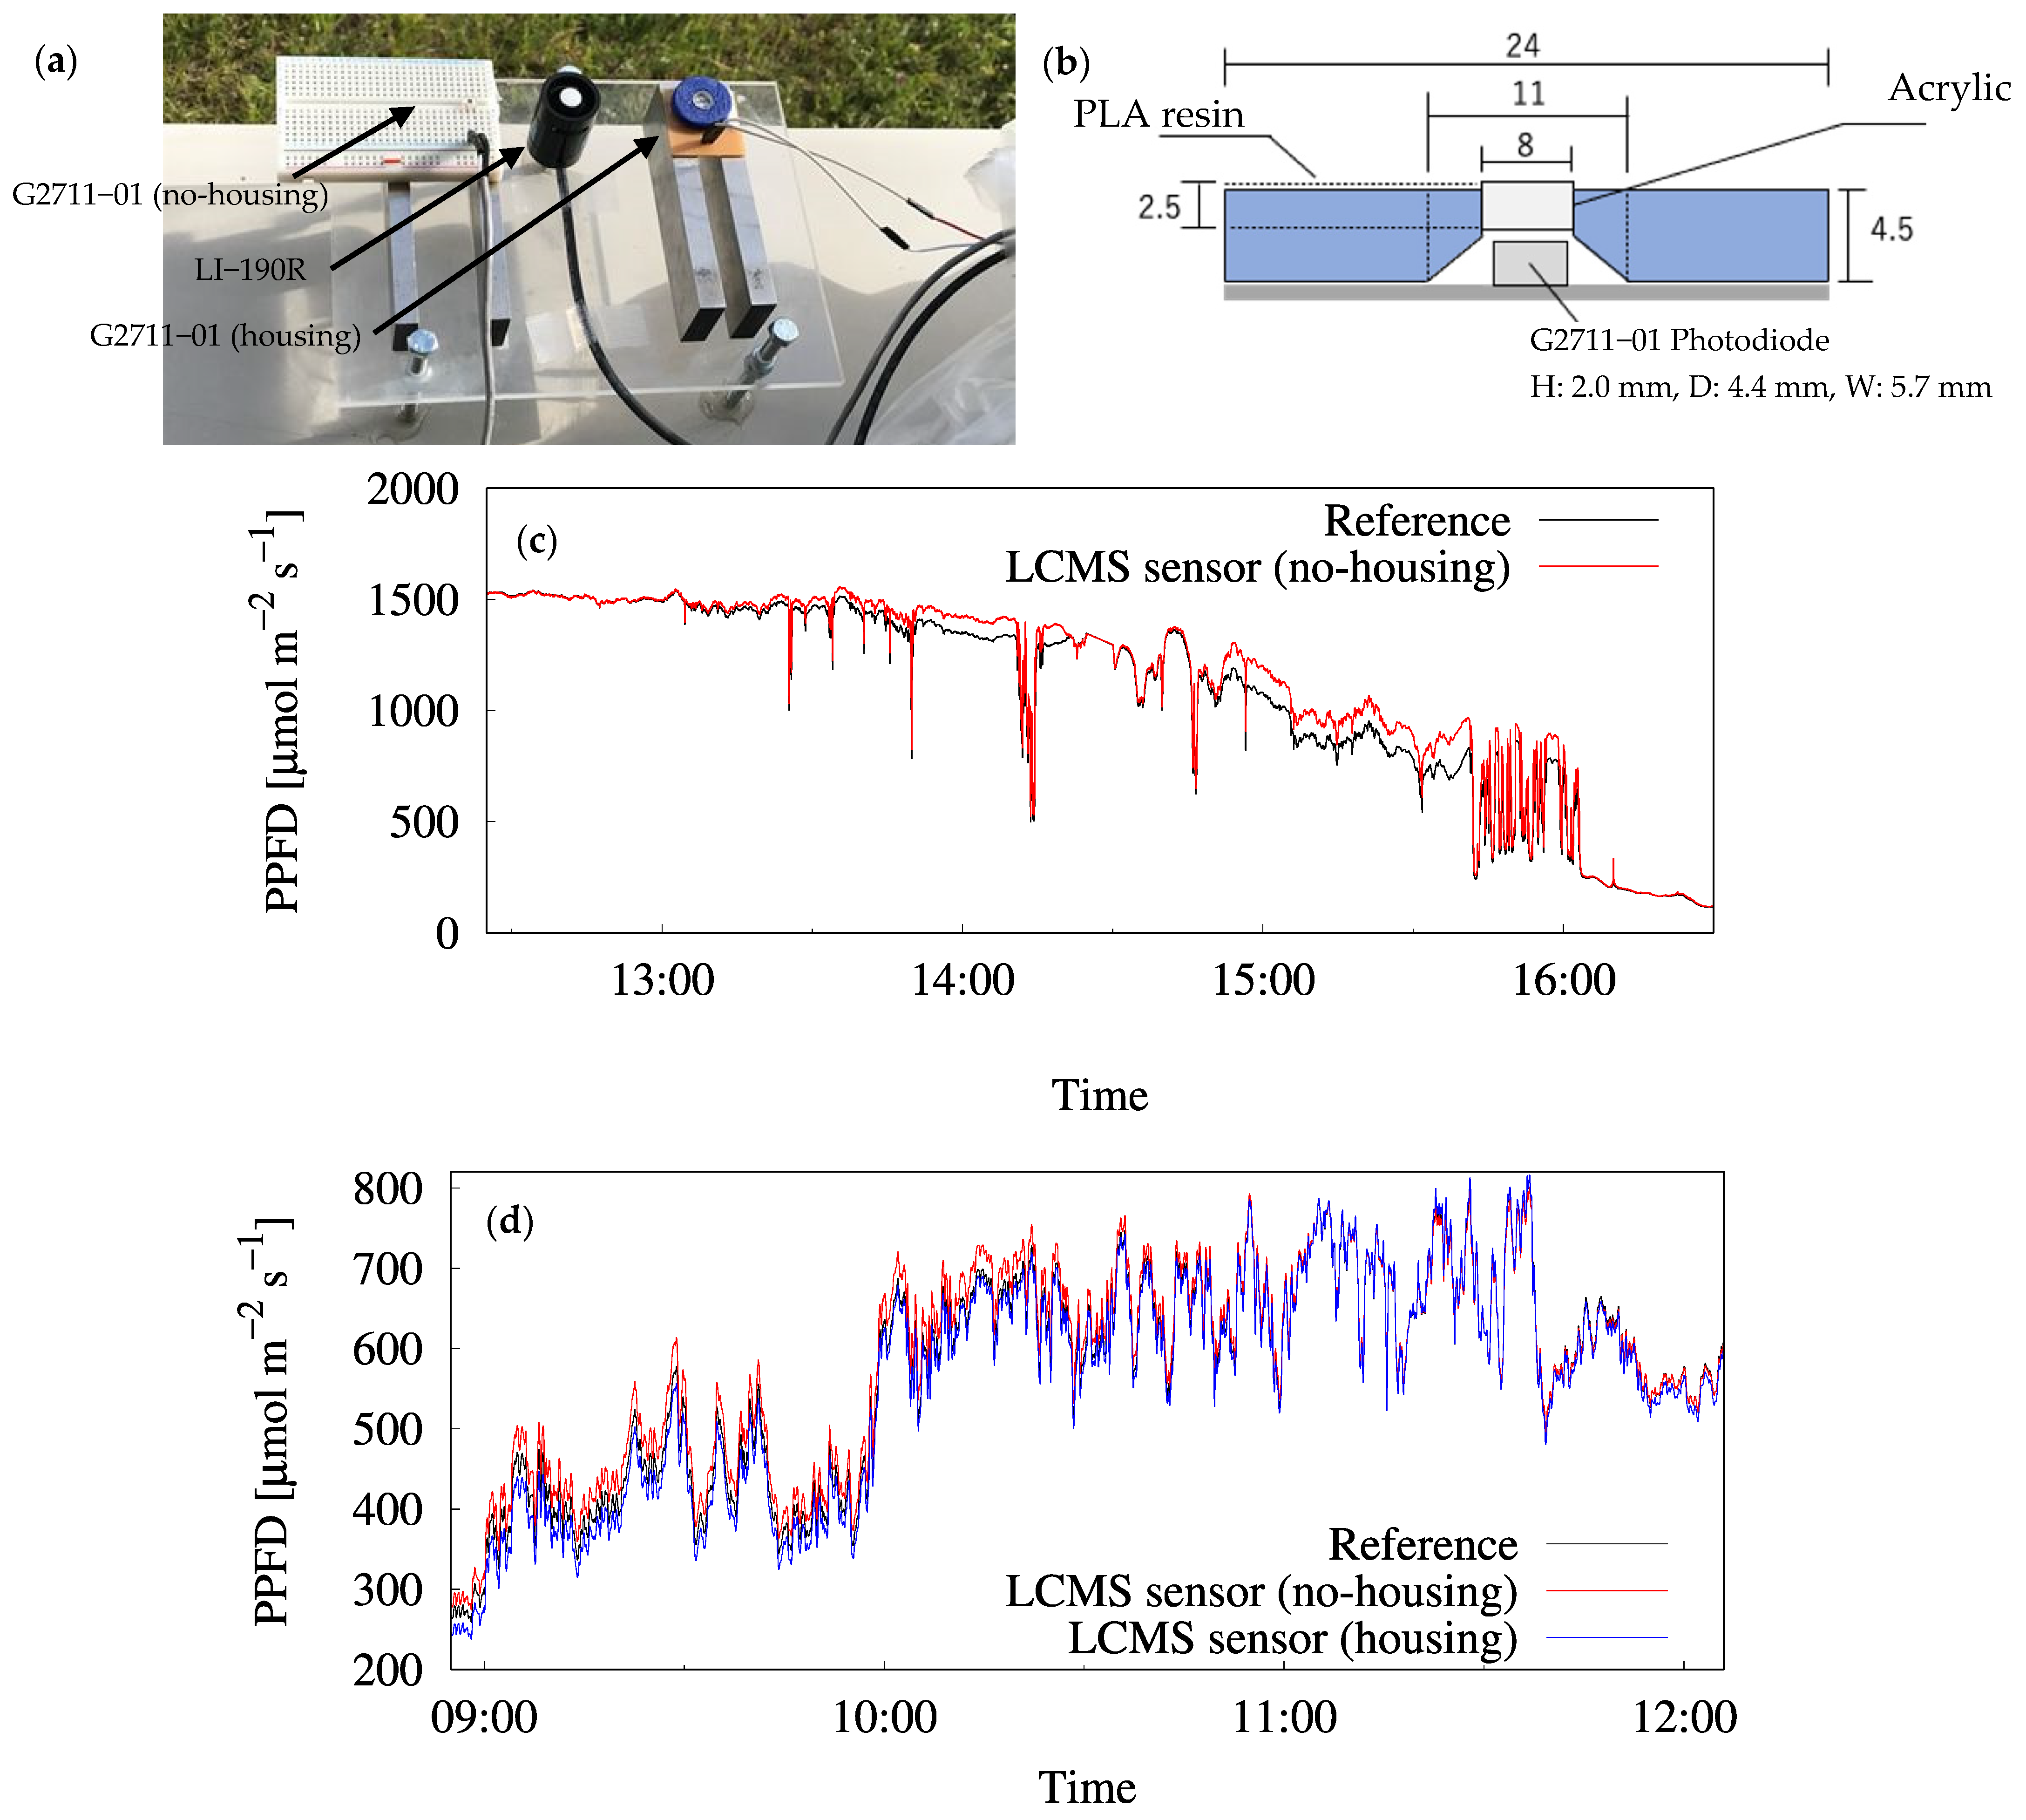
Generally, the commercially available preconfigured quantum sensor for measuring PPFD is quite expensive. Therefore, for developing the new system, it was necessary to substitute a sensor system that is easy to use and inexpensive, thereby being accessible to the researchers. In this system, the GaAsP photodiode G2711–01, which has a similar sensitivity wavelength range, was selected as a substitute for the LI−190R quantum sensor (LI-COR, Inc., Lincoln, NE, USA). In this study, we compared the accuracy of the PPFD with and without housing (with silicone waterproofing), which was created using a 3-D printer and installed to correct the cosine response error (Figure 7a,b). Figure 7c shows the result of simultaneous measurement of PPFD using uncovered G2711–01 and LI−190R with 1 s of sampling. The error between the referenced and measured values was small when the solar incidence angle was low, whereas it tended to be overestimated when the solar incidence angle was high (Figure 7c). In the LI−190R, the photosensitive area is located at the back of the housing and is separated from the outside by a diffuser. As the light incident angle increases, the amount of light received decreases, compared to that for a bare photodiode. This is the result of a design that obtains appropriate cosine characteristics. For larger light incident angles, the uncovered G2711–01 sensor overestimated the PPFD compared to the amount adjusted by the houses and diffuser. Therefore, to reduce the sensor error when the incident angle is large, we fabricated a part corresponding to the housing of the LI−190R using a 3-D printer and verified the accuracy with and without the housing. As a result, the error statistics of the output of the photodiode using the self-made housing were considerably improved (Figure 7d) and were almost similar to those of LI−190R (R2, NSE, and PBIAS of 0.999, 0.9885, and 0.541 for covered, and 0.996, 0.9751, and −2.658 for non-covered). The R2 values obtained from this result were approximately equal to those reported by Fielder and Comeau [34]. Therefore, the measurement system is expected to be expandable to many points at a low cost.
4.2. Variation in Daily Calibrations
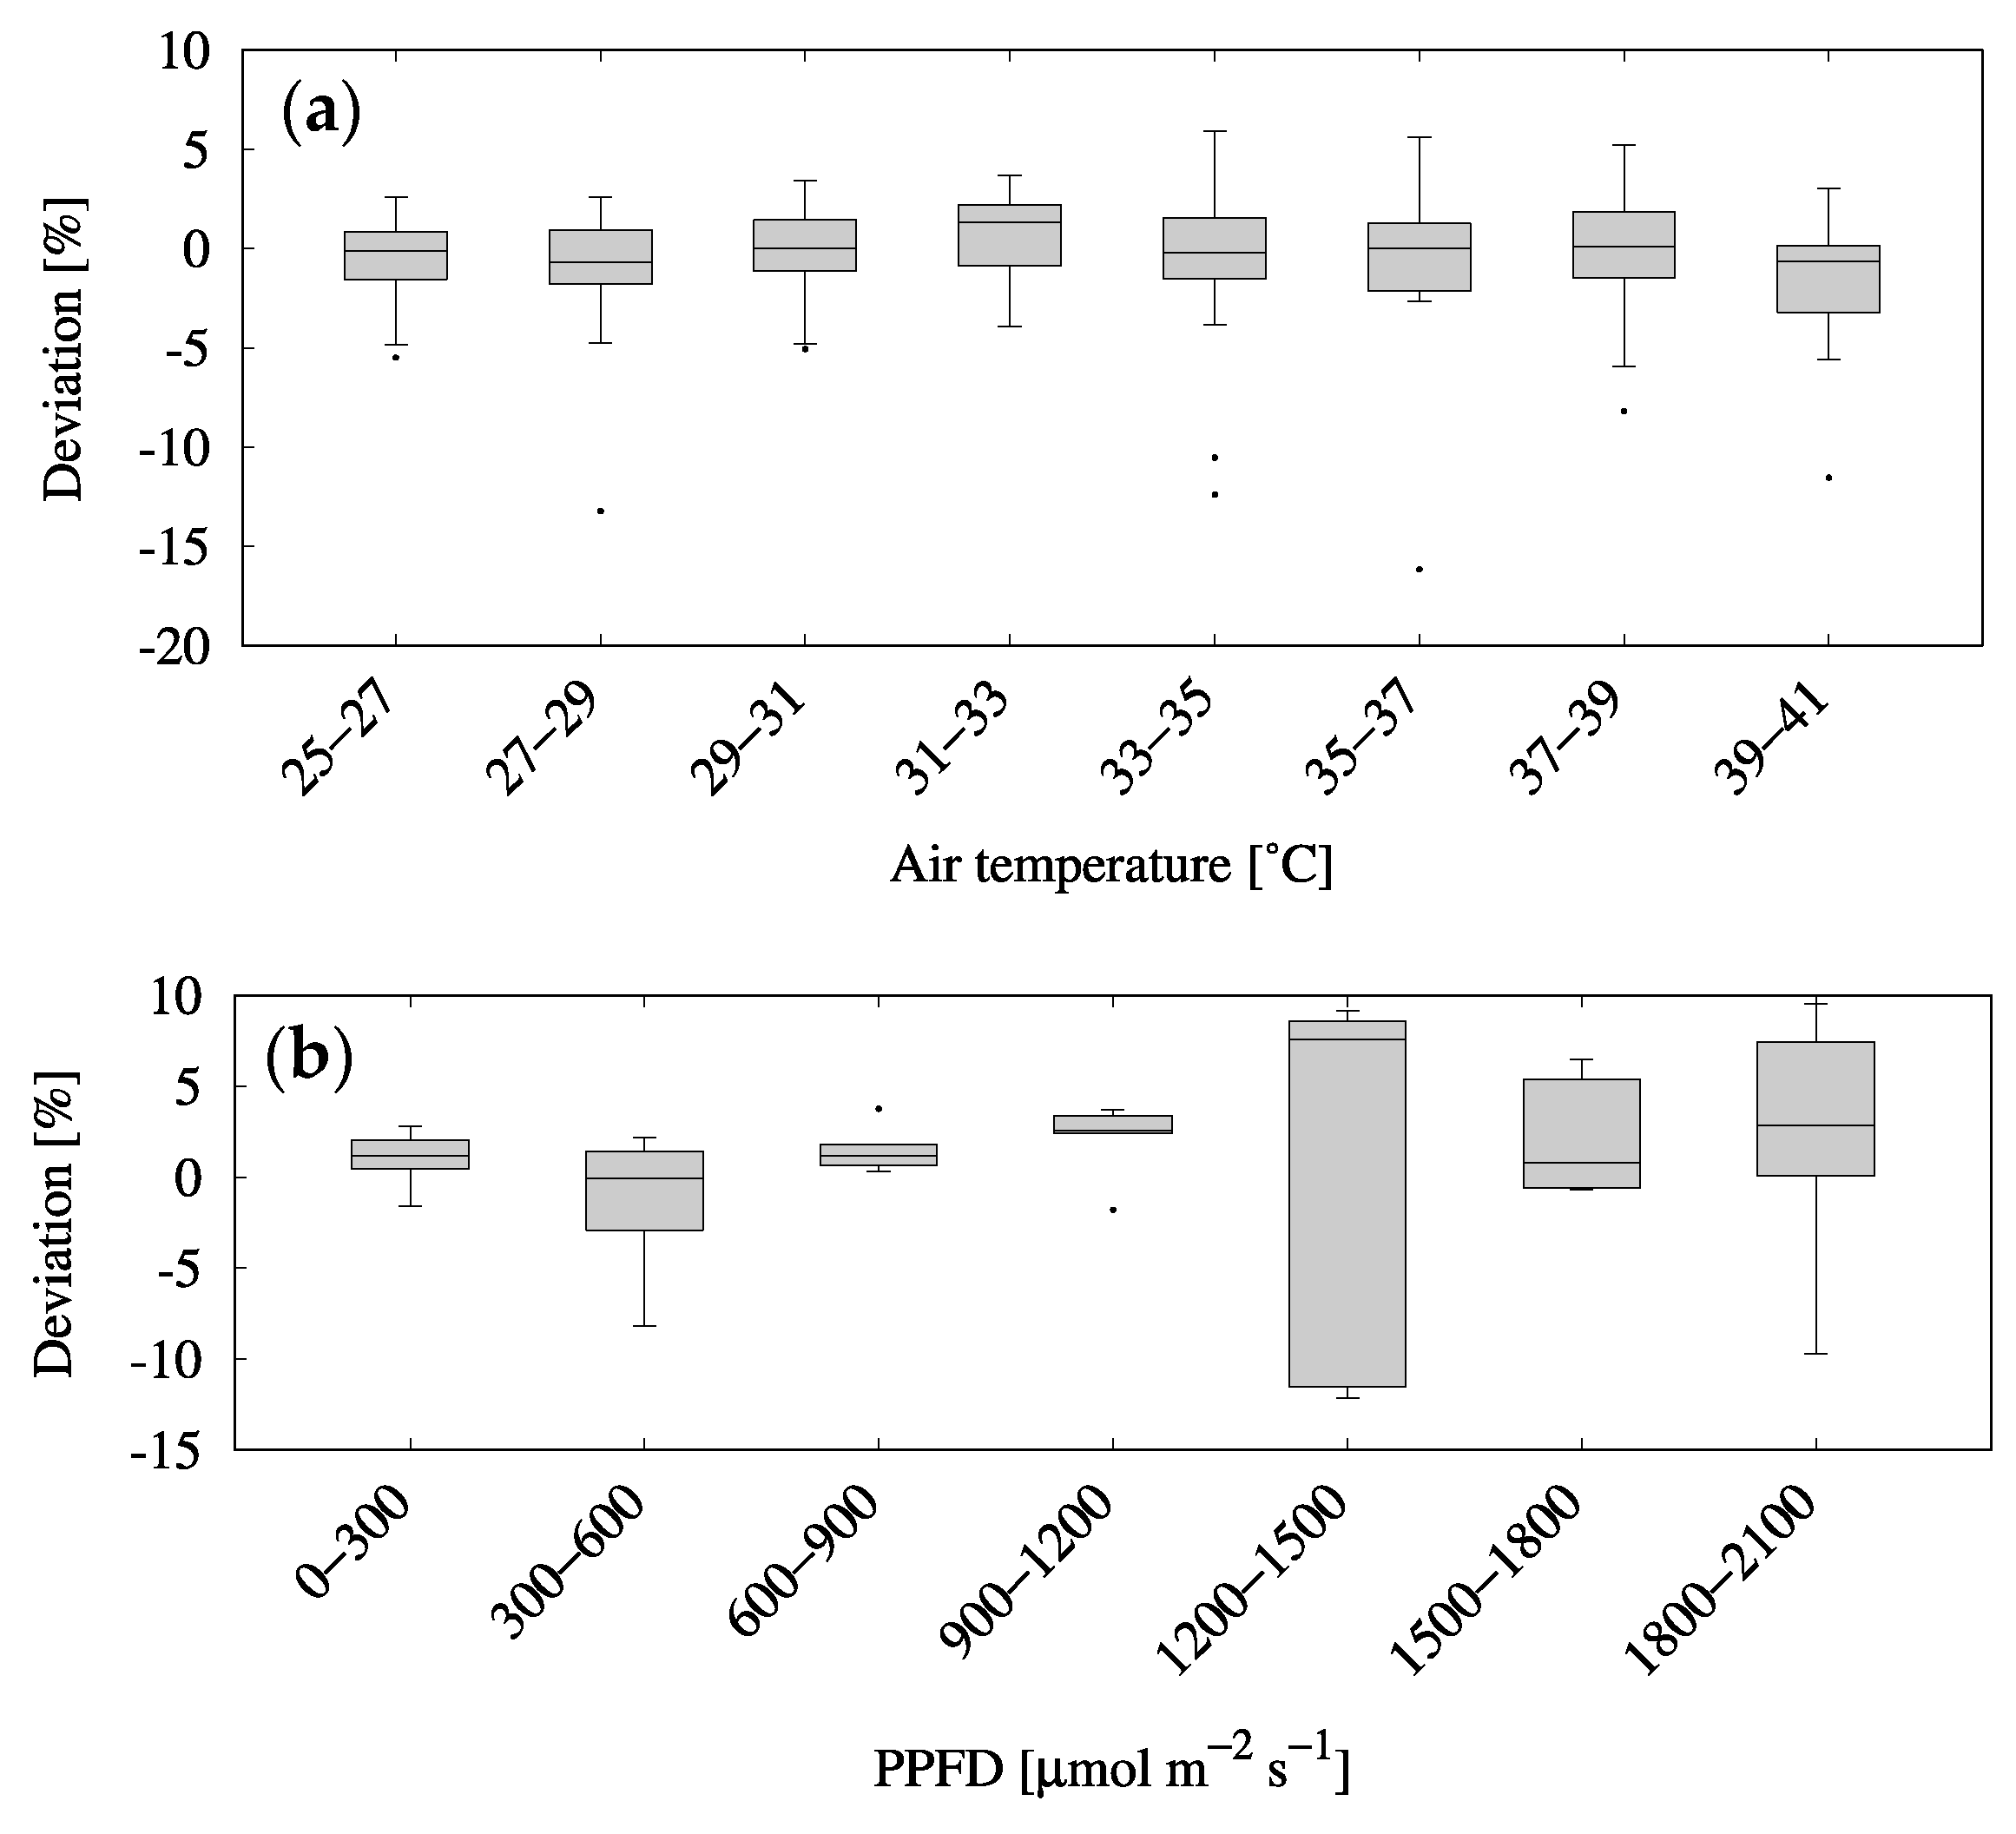
Figure 8 presents box plots of the daily calibration coefficients for each bin of air temperature and PPFD during the measurement periods shown in Figure 6. The daily calibration coefficient for each bin was estimated by subtracting the daily calibration coefficient from the average of the calibration data shown in Section 2.4 and dividing it by the average value to estimate the percentage deviation from the zero value for each sensor. The data indicated that the air temperature did not result in a consistent difference in sensor performance. Fifty percent of the daily calibration values for each bin were within ±3%, while the remaining data were within ±5%. The soil temperature exhibited a similar trend. However, the deviation of the data tended to be large for larger PPFD. As shown in Figure 8, the interquartile range (IQR) of the daily calibration values for each bin less than 1200 μmol m−2 s−1 of PPFD is less than ±3% and that for more than 1200 μmol m−2 s−1 is over 12%, with widespread data distribution. The cause of this variation is unknown. Nevertheless, the sensitivity to light at relatively high wavelengths (>600 nm) under direct solar radiation may be unstable because the photosensitivity of G2711–01 decreases rapidly above 600 nm of wavelength [33]. This would be a PPFD sensor feature that could be improved to reduce errors during higher PPFD.
4.3. Applicability and Future of the System
The proposed measurement system is readily accessible and primarily comprises an open-source hardware with low-cost sensors, which contribute to the further development of accurate crop growth models and widespread collection of accurate environmental data at multiple points in precision agriculture systems. In addition, for potential users who do not want to assemble systems from hardware components, we propose a PCB design that can be used for commercial manufacture and assembly. Sensors are easily detachable through the terminal block. In precision agriculture, the developed system can continuously record and store the variables of the field environment, which can be used by farmers and researchers as inputs of the decision support system tool. The system was designed to be easily installed in any harsh location by creating a housing using a 3-D printer, allowing even non-experts to obtain useful information from the installed sensors. Regarding the production cost, the total cost of this system is approximately $150 USD, including the sensor and battery, whereas other existing systems cost more than $1500. At present, the low cost of this system will contribute to its widespread development and application, even in developing countries. Moreover, it can be implemented in deprived areas of Asia or installed in numerous farmlands that have not been measured because of the expense. Such implementations are expected to increase the crop production, improve economic returns, and reduce environmental impact by extensively managing the hydrometeorological conditions. Furthermore, using the fabricated circuit board presented the following advantages: (1) the wiring was simplified, and the possibility of mis-wiring and contact failure was reduced. For example, when performing the measurement using three sensors, if Arduino is directly attached to a breadboard, there will be dozes of connection points; however, when a board is used, the number of connection points can be reduced to approximately 10 (sensor power +/−, signal line) × 3, main power). This significantly reduced the time required for onsite work and the possibility of wire connection errors. (2) The simplification of wiring eliminated the need for breadboards and a considerable number of jumper wires for wiring, reduced the number of items to be brought to the observation site, and reduced the capacity of the observation box. (3) By designing the board while considering the type and quantity of modules and sensors to be used in the field, a system for various observations can be developed.
The current system has scope for improvement. For example, the calibration of the sensors can be improved. Generally, the primary sources of deviation from the calibration standard are temperature dependence and signal drift errors. Considering the growing number of sensors, a standard method for characterizing and comparing the measurement capability of the sensor system must be established [39,40]. The proposed low-cost sensor has an absolute value error without calibration. Thus, calibration is essential for operation with an effective quality assurance. Therefore, in the construction of the system, a simple implementation of this improvement must be considered, along with maintaining a cost-effective design. Another challenge is access to the Internet. IoT is a new and upcoming trend in technology with possible applications in almost every field. IoT makes labor-free farms a possibility. In particular, it can be used in greenhouse farming and farm management. For agriculture, the application of sensing technology with the aid of ICT will contribute to the reduction of workload, production of high-quality crops, realization of ultra-laborsaving, and production of large-scale crops [41,42]. For example, an off-line LCMS would contribute to the analysis of the factors that lead to poor growth and to increasing the crop model accuracy by using spatial hydrometeorological datasets, which are obtained by installing multiple points in the field. Additionally, detailed information about the fluctuating incident light on leaves can be obtained by attaching the PPFD sensor directory to the leaf. This would be useful for investigating the photosynthetic capacity of leaf under fluctuating light environments. Furthermore, an on-line LCMS would be used for collecting diagnostic information on crops and farmlands in a wide area, which will be utilized for strategic decision-making systems based on the acquired dataset. To automate water management in the field, real-time information on soil temperature and moisture is necessary, for which expensive sensors are introduced. However, using our proposed inexpensive LCMS can help realize the following: (1) cultivation schedules based on weather data; (2) water management based on the variety; and (3) water management to control damage caused by high and low temperatures. Moreover, a data assimilation crop model that combines observations obtained from an LCMS system and models would be useful for crop growth forecasting systems.
At present, we have developed a device with an added data communication function using IoT. This system will be further upgraded to (1) support both off-line and on-line data collection, while maintaining the ease of sensor attachment and removal, (2) improve the wire connection reliability of LCMS and work efficiency in the field, (3) evaluate the waterproof performance and continuous measurement in severe conditions, (4) test the long-term stability and variability of the sensors, and (5) fulfil the wide range of measurement requirements of users such that it can be used for monitoring hydrometeorological environments in fields, for growth control via optimization of severe environments in fields and greenhouses, and for conservation of water via the reduction of unnecessary irrigation.
5. Conclusions
A low-cost, open-source hardware system for collecting high-temporal-resolution hydrometeorological data necessary for crop management and development of growth model was developed. The proposed system was quantitatively evaluated through comparison with commercial equipment. Based on multiple error statistics, the results show that the data quality of the proposed measurement system is satisfactory for use in precision agriculture. Furthermore, the obtained results indicate that the implemented system is not only cost efficient but also easily customizable with different sensors depending on the purpose. The hardware components used to prototype the datalogger are readily available. Considering the cost, the system exhibits a high accuracy. This system is relatively easy to use for anyone performing measurements for precision agriculture. In future studies, we will focus on the estimation of the long-term stability of sensors by continuous measurement in severe conditions. The data obtained are expected to contribute to field management, development of crop models, and laborsaving and precision farming.
Author Contributions
Conceptualization, K.T. and H.I.; methodology, K.T. and T.Y.; software, T.Y.; validation, T.Y. and K.T.; investigation, K.T. and T.Y.; resources, K.T.; writing—original draft preparation, K.T.; writing—review and editing, K.T., T.Y. and H.I.; visualization, K.T. and T.Y.; supervision, K.T.; funding acquisition, K.T. All authors have read and agreed to the published version of the manuscript.
Funding
This research was funded by JST PRESTO, grant number JPMJPR16O3 and JSPS KAKENHI, grant number 16KK0169 and 19K15944.
Institutional Review Board Statement
Not applicable.
Informed Consent Statement
Not applicable.
Data Availability Statement
The data that support the findings of this study are available from the corresponding author, K.T., upon reasonable request.
Acknowledgments
The authors would like to acknowledge and thank Rintaro Miyamachi and Mikihiko Nakamoto for their contribution in the hardware development, field data collection and technical support.
Conflicts of Interest
The authors declare no conflict of interest.
References
- Lobell, D.B.; Gourdji, S.M. The influence of climate change on global crop productivity. Plant Physiol. 2012, 160, 1686–1697. [Google Scholar] [CrossRef] [Green Version]
- Sadras, V.O.; Villalobos, F.J.; Orgaz, F.; Fereres, E. Effects of water stress on crop production. In Principles of Agronomy for Sustainable Agriculture; Villalobos, F., Fereres, E., Eds.; Springer International Publishing: Cham, Switzerland, 2017; pp. 189–204. [Google Scholar]
- Kumar, R.; Chaurasiya, P.C.; Singh, R.N.; Singh, S. A review report: Low temperature stress for crop production. Int. J. Pure App. Biosci. 2018, 6, 575–598. [Google Scholar] [CrossRef]
- Nahar, K.; Hasanuzzaman, M.; Ahamed, K.U.; Hakeem, K.R.; Ozturk, M.; Fujita, M. Plant responses and tolerance to high temperature stress: Role of exogenous phytoprotectants. In Crop Production and Global Environmental Issues; Hakeem, K., Ed.; Springer International Publishing: Cham, Switzerland, 2015; pp. 385–435. [Google Scholar]
- Gitelson, A.A.; Peng, Y.; Arkebauer, T.J.; Suyker, A.E. Productivity, absorbed photosynthetically active radiation, and light use efficiency in crops: Implications for remote sensing of crop primary production. J. Plant Physiol. 2015, 177, 100–109. [Google Scholar] [CrossRef] [Green Version]
- Tatsumi, K.; Kuwabara, Y.; Motobayashi, T. Photosynthetic light-use efficiency of rice leaves under fluctuating incident light. Agrosyst. Geosci. Environ. 2020, 3, e20030. [Google Scholar] [CrossRef]
- Allen, M.T.; Pearcy, R.W. Stomatal behavior and photosynthetic performance under dynamic light regimes in a seasonally dry tropical rain forest. Oecologia 2000, 122, 470–478. [Google Scholar] [CrossRef] [PubMed]
- Andrew, R.C.; Malekian, R.; Bogatinoska, D.C. IoT solutions for precision agriculture. In Proceedings of the 41st International Convention on Information and Communication Technology, Electronics and Microelectronics (MIPRO), Opatija, Croatia, 21–25 May 2018; MIPRO: Rijeka, Croatia, 2018; pp. 0345–0349. [Google Scholar]
- Jha, K.; Doshi, A.; Patel, P.; Shah, M. A comprehensive review on automation in agriculture using artificial intelligence. Artif. Intell. Agric. 2019, 2, 1–12. [Google Scholar] [CrossRef]
- Mohopatra, A.G.; Keswani, B.; Lenka, S.K. ICT specific technological changes in precision agriculture environment. Int. J. Comput. Sci. Mob. Appl. 2018, 6, 1–16. [Google Scholar]
- Sreekantha, D.K.; Kavya, A.M. Agricultural crop monitoring using IOT-a study. In Proceedings of the 11th International Conference on Intelligent Systems and Control (ISCO), Coimbatore, India, 5–6 January 2017; pp. 134–139. [Google Scholar]
- Shibusawa, S. A role of bio-production robots in precision farming Japan model. Agric. Inf. Res. 2003, 12, 125–133. [Google Scholar]
- Lopez, J.C.B.; Villaruz, H.M. Low-cost weather monitoring system with online logging and data visualization. In Proceedings of the 2015 International Conference on Humanoid, Nanotechnology, Information Technology, Communication and Control, Environment and Management (HNICEM), Cebu, Philippines, 9–12 December 2015; IEEE: New York, NY, USA, 2015; pp. 1–6. [Google Scholar]
- Noordin, K.A.; Chow, C.O.; Ismail, M.F. A low-cost microcontroller-based weather monitoring system. CMU. J. 2006, 5, 33–39. [Google Scholar]
- Gouda, K.C.; Preetham, V.R.; Swamy, M.N.S. Microcontroller based real time weather monitoring device with GSM. Int. J. Sci. Eng. Technol. Res. 2014, 3, 1960–1963. [Google Scholar]
- Adepoju, T.M.; Oladele, M.O.; Kasali, A.A.; Fabiyi, G.J. Development of a low-cost Arduino-based weather station. FUOYE J. Eng. Technol. 2020, 5, 69–73. [Google Scholar] [CrossRef]
- Strigaro, D.; Cannata, M.; Antonovic, M. Boosting a weather monitoring system in low income economies using open and non-conventional systems: Data quality analysis. Sensors 2019, 19, 1185. [Google Scholar] [CrossRef] [Green Version]
- Tenzin, S.; Siyang, S.; Pobkrut, T.; Kerdcharoen, T. Low cost weather station for climate-smart agriculture. In Proceedings of the 2017 9th International Conference on Knowledge and Smart Technology (KST), Chonburi, Thailand, 1–4 February 2017; IEEE: New York, NY, USA, 2017; pp. 172–177. [Google Scholar]
- Isaías, G.; Antonio, J.C. Measurement system based on Arduino for biogas sensing: Development considerations and laboratory scale approach. Int. J. Adv. Syst. Meas. 2018, 11, 93–99. [Google Scholar]
- Diafari, D.; Agung, R. Design and implementation of Arduino-based weather monitoring system in Rural. J. Elec. Electron. Inform. 2019, 3, 58–61. [Google Scholar]
- Forat, F.H.; Sarmad, N.M. Design of weather monitoring system using Arduino based database implementation. J. Multidiscip. Engg. Sci. Technol. 2017, 4, 7109–7117. [Google Scholar]
- Duckett, T.; Pearson, S.; Blackmore, S.; Grieve, B. Agricultural Robotics: The Future of Robotic Agriculture; UK-RAS Network: London, UK, 2018. [Google Scholar]
- Saiz-Rubio, V.; Rovira-Más, F. From smart farming towards Agriculture 5.0: A review on crop data management. Agronomy 2020, 10, 207. [Google Scholar] [CrossRef] [Green Version]
- Lakhiar, I.A.; Jianmin, G.; Syed, T.N.; Chandio, F.A.; Buttar, N.A.; Qureshi, W.A. Monitoring and control systems in agriculture using intelligent sensor techniques: A Review of the Aeroponic System. J. Sens. 2018, 2018, 1–18. [Google Scholar] [CrossRef] [Green Version]
- Holovatyy, A.; Teslyuk, V.; Kryvinska, N.; Kazarian, A. Development of microcontroller-based system for background radiation monitoring. Sensors 2020, 20, 7322. [Google Scholar] [CrossRef]
- Oladimeji, I.; Adediji, Y.B.; Akintola, J.B.; Afolayan, M.A.; Ogunbiyi, O.; Ibrahim, S.M.; Olayinka, S.Z. Design and construction of an Arduino-based solar power parameter-measuring system with data logger. Arid Zone, J. Eng. Technol. Environ. 2020, 16, 255–1268. [Google Scholar]
- Gunawa, T.S.; Munia, Y.M.S.; Kartiwi, M.; Hansor, H. Design and implementation of portable outdoor air quality measurement system using Arduino. Int. J. Elect. Comput. Eng. 2018, 8, 280–290. [Google Scholar]
- Siahaan, A.P.U.; Silitonga, N.; Iqbal, M.; Aryza, S.; Fitriani, W.; Ramadhan, Z.; Tharo, Z.; Hidayat, R.; Hasibuan, H.A. Arduino Uno-based water turbidity meter using LDR and LED sensors. Int. J. Eng. Technol. 2018, 7, 2113–2117. [Google Scholar] [CrossRef]
- Bansod, S.; Jaiswal, R.; Sargam, P.; Survase, P.; Sawant, S. Arduino based water irrigation system. Int. J. Adv. Res. Sci. Eng. 2018, 7, 903–910. [Google Scholar]
- Rodríguez-Robles, J.; Martin, A.; Martin, S.; Ruipérez-Valiente, J.A.; Castro, M. Autonomous sensor network for rural agriculture environments, low cost, and energy self-charge. Sustainability 2020, 12, 5913. [Google Scholar] [CrossRef]
- LM60BIZ/NOPB Data sheet. LM60 2.7V, SOT-23 or TO-92 Temperature Sensor. Available online: https://pdf1.alldatasheet.jp/datasheet-pdf/view/557993/TI1/LM60BIZ/NOPB.html (accessed on 14 May 2021).
- Random Nerd Tutorials. Guide for Soil Moisture Sensor YL-69 or HL-69 with Arduino. Available online: https://randomnerdtutorials.com/guide-for-soil-moisture-sensor-yl-69-or-hl-69-with-the-arduino/ (accessed on 21 August 2019).
- G2711-01 Data Sheet. GaAsP photodiode Diffusion type. Available online: https://datasheetspdf.com/pdf-file/90836/HamamatsuCorporation/G2711-01/1 (accessed on 8 July 2021).
- Fielder, P.; Comeau, P. Construction and testing of an inexpensive PAR sensor. Br. Columbia Minist. For. Res. Program 2000, 53, 39. [Google Scholar]
- Kerr, J.P.; Thurtell, G.W.; Tanner, C.B. An integrating pyranometer for the climatological observer stations and mesoscale networks. J. App. Meteorol. 1967, 6, 688–694. [Google Scholar] [CrossRef] [Green Version]
- Pontailler, J.Y. A cheap quantum sensor using a gallium arsenide photodiode. Funct. Ecol. 1990, 4, 591–596. [Google Scholar] [CrossRef]
- Pearcy, R.W. Radiation and light measurements. In Plant physiological ecology: Field Methods and Instrumentation; Springer Science & Business Media: Berlin, Germany, 1989; pp. 97–116. [Google Scholar]
- Hrisko, J.; Capacitive Soil Moisture Sensor Calibration with Arduino. Maker Portal. Available online: https://makersportal.com/blog/2020/5/26/capacitive-soil-moisture-calibration-with-arduino (accessed on 21 May 2019).
- Jones, S.B.; Blonquist, J.M., Jr.; Robinson, D.A.; Rasmussen, V.P.; Or, D. Standardizing Characterization of Electromagnetic Water Content Sensors: Part 1. Methodology. Vadose Zone J. 2005, 4, 1048–1058. [Google Scholar] [CrossRef] [Green Version]
- Blonquist, J.M., Jr.; Jones, S.B.; Robinson, D.A. Standardizing Characterization of Electromagnetic Water Content Sensors: Part 2. Evaluation of Seven Sensing Systems. Vadose Zone J. 2005, 4, 1059–1069. [Google Scholar] [CrossRef]
- Navarro, E.; Costa, N.; Pereira, A. A systematic review of IoT solutions for smart farming. Sensors 2020, 20, 4321. [Google Scholar] [CrossRef]
- Gómez-Chabla, R.; Real-Avilés, K.; Morán, C.; Grijalva, P.; Recalde, T. IoT applications in agriculture: A systematic literature review. In ICT for Agriculture and Environment. CITAMA2019 2019. Advances in Intelligent Systems and Computing; Valencia-García, R., Alcaraz-Mármol, G., Cioppo-Morstadt, J., Vera-Lucio, N., Bucaram-Leverone, M., Eds.; Springer International Publishing: Cham, Switzerland, 2019; Volume 901. [Google Scholar]
Figure 1.
(a) Board wiring diagram, (b) board wiring pattern, and (c) board cutting surface.


Figure 2.
(a) Substrate surface and (b) external view of the measurement system.

Figure 3.
System configuration.

Figure 4.
Flow diagram of software data processing with low-cost hardware.

Figure 5.
Assembled device: (left panel) Main components; (right panel) experimental setup.

Figure 6.
Comparison of reference and LCMS sensor: (a) Air and soil temperature for 6 July–6 August 2021 JST. (b) Soil water content for 14 May–2 June 2021, JST. (c) Photosynthetic photon flux density (PPFD) for 14 May–2 June 2021, JST. Reference values of the air temperature, soil temperature, and PPFD values were obtained using TR−72wb (T&D Corporation, Tokyo, Japan), TR−71wb (T&D Corporation, Tokyo, Japan), and LI−190R (LI-COR, Inc., Lincoln, NE, USA), respectively. The sampling interval is 1 min. x = (I5/1024 − 424)/6.25 for readings of temperature, and (I5/1024) 401 for those of PPFD. I is the analog output value from the LCMS sensor.


Figure 7.
Reference and measured PPFD values over the test period: (a) Measurement state. (b) Cross section of the GaAsP sensor cover. (b) Without housing from 12:30 to 16:30 JST on 2 March 2021, JST. (d) Without and with housing during the morning of 3 April 2021, JST. (c,d) Instantaneous values per second.

Figure 8.
Daily calibration coefficients of each sensor for each (a) air temperature range and (b) PPFD range. The dataset used is the same as in Figure 7. The data indicate the percentage deviation of each daily calibration coefficient from the mean value for the period described in Section 3.2, calibrated with TR−72wb for air temperature and LI−190R for PPFD.


Table 1.
Price list for the parts used in this study.
| Parts | Quantity | Price ($) | Vendor |
|---|---|---|---|
| Arduino Uno Rev3 | 1 | 26.7 | Arduino |
| microSD module (HW−125) | 1 | 4.5 | Shenzhen Hairuixing Technology Co., Ltd. |
| GPS module (AE−GYSFDMAXB) | 1 | 19.1 | Akizuki Denshi Tsusho Co., Ltd. |
| PCB terminal blocks | 7 | 6.5 | RS Components, Inc. |
| D-sub connector (plug) | 1 | 1.1 | Sankyu Technos Co., Ltd. |
| D-sub connector (jack) | 1 | 0.7 | Sankyu Technos Co., Ltd. |
| LED | 1 | 0.6 | EK japan Co., Ltd. |
| Board pin header | 1 | 0.9 | Hirosugi-Keiki Co., Ltd. |
| Resistance (10 k Ω , 460 Ω), Diode | 1 | 0.2 | – |
| Cutting board | 1 | 2.6 | Original Mind Co., Ltd. |
| Resin material for 3D printer (180 g) | 1 | 6.3 | 3D Solutech, LLC. |
| Slim robot cable for GPS (1 m) | 1 | 2.4 | Kyowa Harmonet Co., Ltd. |
| Total cost | 71.6 |
Table 2.
Price list for the sensors used in this study.
| Sensor (Type) | Price ($) | Vendor |
|---|---|---|
| Temperature (LM60BIZ) | 1.6 | Texas Instruments, Inc. |
| Soil moisture (YL–69) | 0.9 | WINGONNER |
| GaAsP photodiode (G2711–01) | 2.7 | Hamamatsu Photonics K.K. |
| Total cost | 5.2 |
Table 3.
Working time for each process.
| Work Content | Working Time (h) |
|---|---|
| Substrate cutting by milling machine | 0.5 |
| Board finish | 0.5 |
| Soldering | 0.5 |
| Housing modeling by a 3-D printer | 10.0 |
| Processing of housing | 1.5 |
| Total time required | 13.0 |
Table 4.
Summarized error statistics for each sensor.
| Error | Temperature | PPFD | |
|---|---|---|---|
| Air | Soil | Covered | |
| R2 (–) | 0.998 | 0.965 | 0.989 |
| NSE (–) | 0.996 | 0.889 | 0.977 |
| PBIAS (%) | −0.00254 | −1.15 | 0.015 |
Publisher’s Note: MDPI stays neutral with regard to jurisdictional claims in published maps and institutional affiliations. |
© 2021 by the authors. Licensee MDPI, Basel, Switzerland. This article is an open access article distributed under the terms and conditions of the Creative Commons Attribution (CC BY) license (https://creativecommons.org/licenses/by/4.0/).
Share and Cite
MDPI and ACS Style
Tatsumi, K.; Yamazaki, T.; Ishikawa, H. An Open-Source, Low-Cost Measurement System for Collecting Hydrometeorological Data in the Open Field. Technologies 2021, 9, 78. https://doi.org/10.3390/technologies9040078
AMA Style
Tatsumi K, Yamazaki T, Ishikawa H. An Open-Source, Low-Cost Measurement System for Collecting Hydrometeorological Data in the Open Field. Technologies. 2021; 9(4):78. https://doi.org/10.3390/technologies9040078
Chicago/Turabian StyleTatsumi, Kenichi, Tomoya Yamazaki, and Hirohiko Ishikawa. 2021. "An Open-Source, Low-Cost Measurement System for Collecting Hydrometeorological Data in the Open Field" Technologies 9, no. 4: 78. https://doi.org/10.3390/technologies9040078
Note that from the first issue of 2016, this journal uses article numbers instead of page numbers. See further details here.