1. Introduction
Color is considered a property of objects and substances indicating status and conditions. Colorimetric information, including brightness and contrast, are frequently used in characterizing and describing properties of objects and substances of interest, both in daily life and various scientific fields, such as chemical, biological and medical research and industry [
1,
2,
3,
4,
5,
6,
7].
One good example is the colorimetric identification of pH levels (power of hydrogen or potential for hydrogen in the range of 1–14) using litmus paper made from absorbent paper [
8,
9,
10]. It is used to specify how acidic or basic a water-based solution is by comparison with a standard color chart for the specific litmus paper. It is frequently used in checking swimming pool water quality, food safety, properties of unknown solutions, and vaginal acidity levels for feminine health reasons [
10,
11,
12,
13,
14]. For proper test results, an appropriate waiting time is needed before the pH reading can evaluate the complete chemical reaction. Time-dependent information on the color change, from the time of contact to completion of the reaction is ignored, even though it potentially contains valuable information on reactivity, diffusivity, non-uniformity, and so on. The color of the litmus paper is usually offset between wet and dry conditions and can cause pH reading errors in visual inspection.
In addition to the development of individual functional sensors and image analysis techniques, the development of integrated sensing systems for practical usage and automated data acquisition and analysis of database accumulation is strongly desired for efficient monitoring of time-dependent colorimetric information on the objects and substances under the process in progress. We have developed novel image analysis software with image capturing and video recording functions and introduced a few application examples in various fields, including engineering, cultural heritage evaluation/conservation, archaeology, chemical, biological and medical applications [
10,
15,
16,
17,
18,
19,
20,
21,
22,
23].
Numerous colorimetric assays exist for the measurement of analytes. Applications range from simple pH measurements to more complex assays, such as pesticides and pharmaceutical compounds, which can be used in applications for water testing and health monitoring. The majority of such tests utilize laboratory spectrophotometry. Simple calibration curves and consistent absorbance measurements are used for quantitative determination of the analyte concentration. The quantitative determination is performed by comparing the absorbance at wavelengths specific to the chromophore of interest to the calibration curve. [
24,
25,
26,
27]. Progress in image analysis techniques and the development of smart integrated systems using them will enhance our understanding of the objects and substances of interest under various conditions. The development of video clip analysis techniques and utilization of commercially available general image sensors, such as digital cameras, USB cameras, smartphones and camcorders, are important for the effective use of colorimetric information in chemical, biological and medical applications.
The colorimetric analysis technique has been extremely useful for digital forensic studies of cultural heritage identification processes [
28,
29,
30]. The world’s oldest metal-type printed book, made in 1239 in Korea, has been identified by comparing six nearly identical books from Korea from the 13th to 16th centuries using this image analysis technique.
In this paper, static and dynamic colorimetric image analysis techniques and systems for chemical, biological and medical applications are proposed and demonstrated using experimental chromatography samples and randomly blinking light-emitting-diode-based decorative lights. The static and dynamic colorimetric information was expressed as RGB (red, green, blue) intensity, HSV (hue, saturation and value) and CIE L*a*b* values as traceable, quantitative colorimetric data. Munsell color indices and hexadecimal color codes can also be extracted from any points or desired partial area of images.
2. Experimental Section
Two sets of experiments were performed to demonstrate static and dynamic colorimetric image analysis techniques developed for chemical, biological and medical applications. Photographs and video clips were captured using smartphones, USB (universal serial bus) cameras and digital microscopes. Individual photographs and video clips were analyzed using a novel image analysis software (PicMan (ver. 22.12) from WaferMasters, Inc., Dublin, CA, USA). For USB cameras and digital microscopes, individual photographs and video clips were recorded through the image analysis software PicMan [
10,
15,
16,
17,
18,
19,
20,
21,
22,
23]. The static image analysis can be performed by snapshot images (photographs) from any image sensors (cameras), any digital image files from reliable/calibrated devices and image files from reliable/trusted source. The dynamic image analysis can be performed using real-time video images or pre-recorded video clips from any image sensors (cameras). The software is constantly updated with newer functions. The authors used the latest version of PicMan at the time of manuscript submission (December 2022).
To avoid ethical issues with this study, experiments using biological specimens are not presented in this paper. Two sets of artificial experimental results are described to demonstrate the concept of static and dynamic colorimetric analysis techniques using image sensors and novel image processing software in chemical, biological and medical applications and so on.
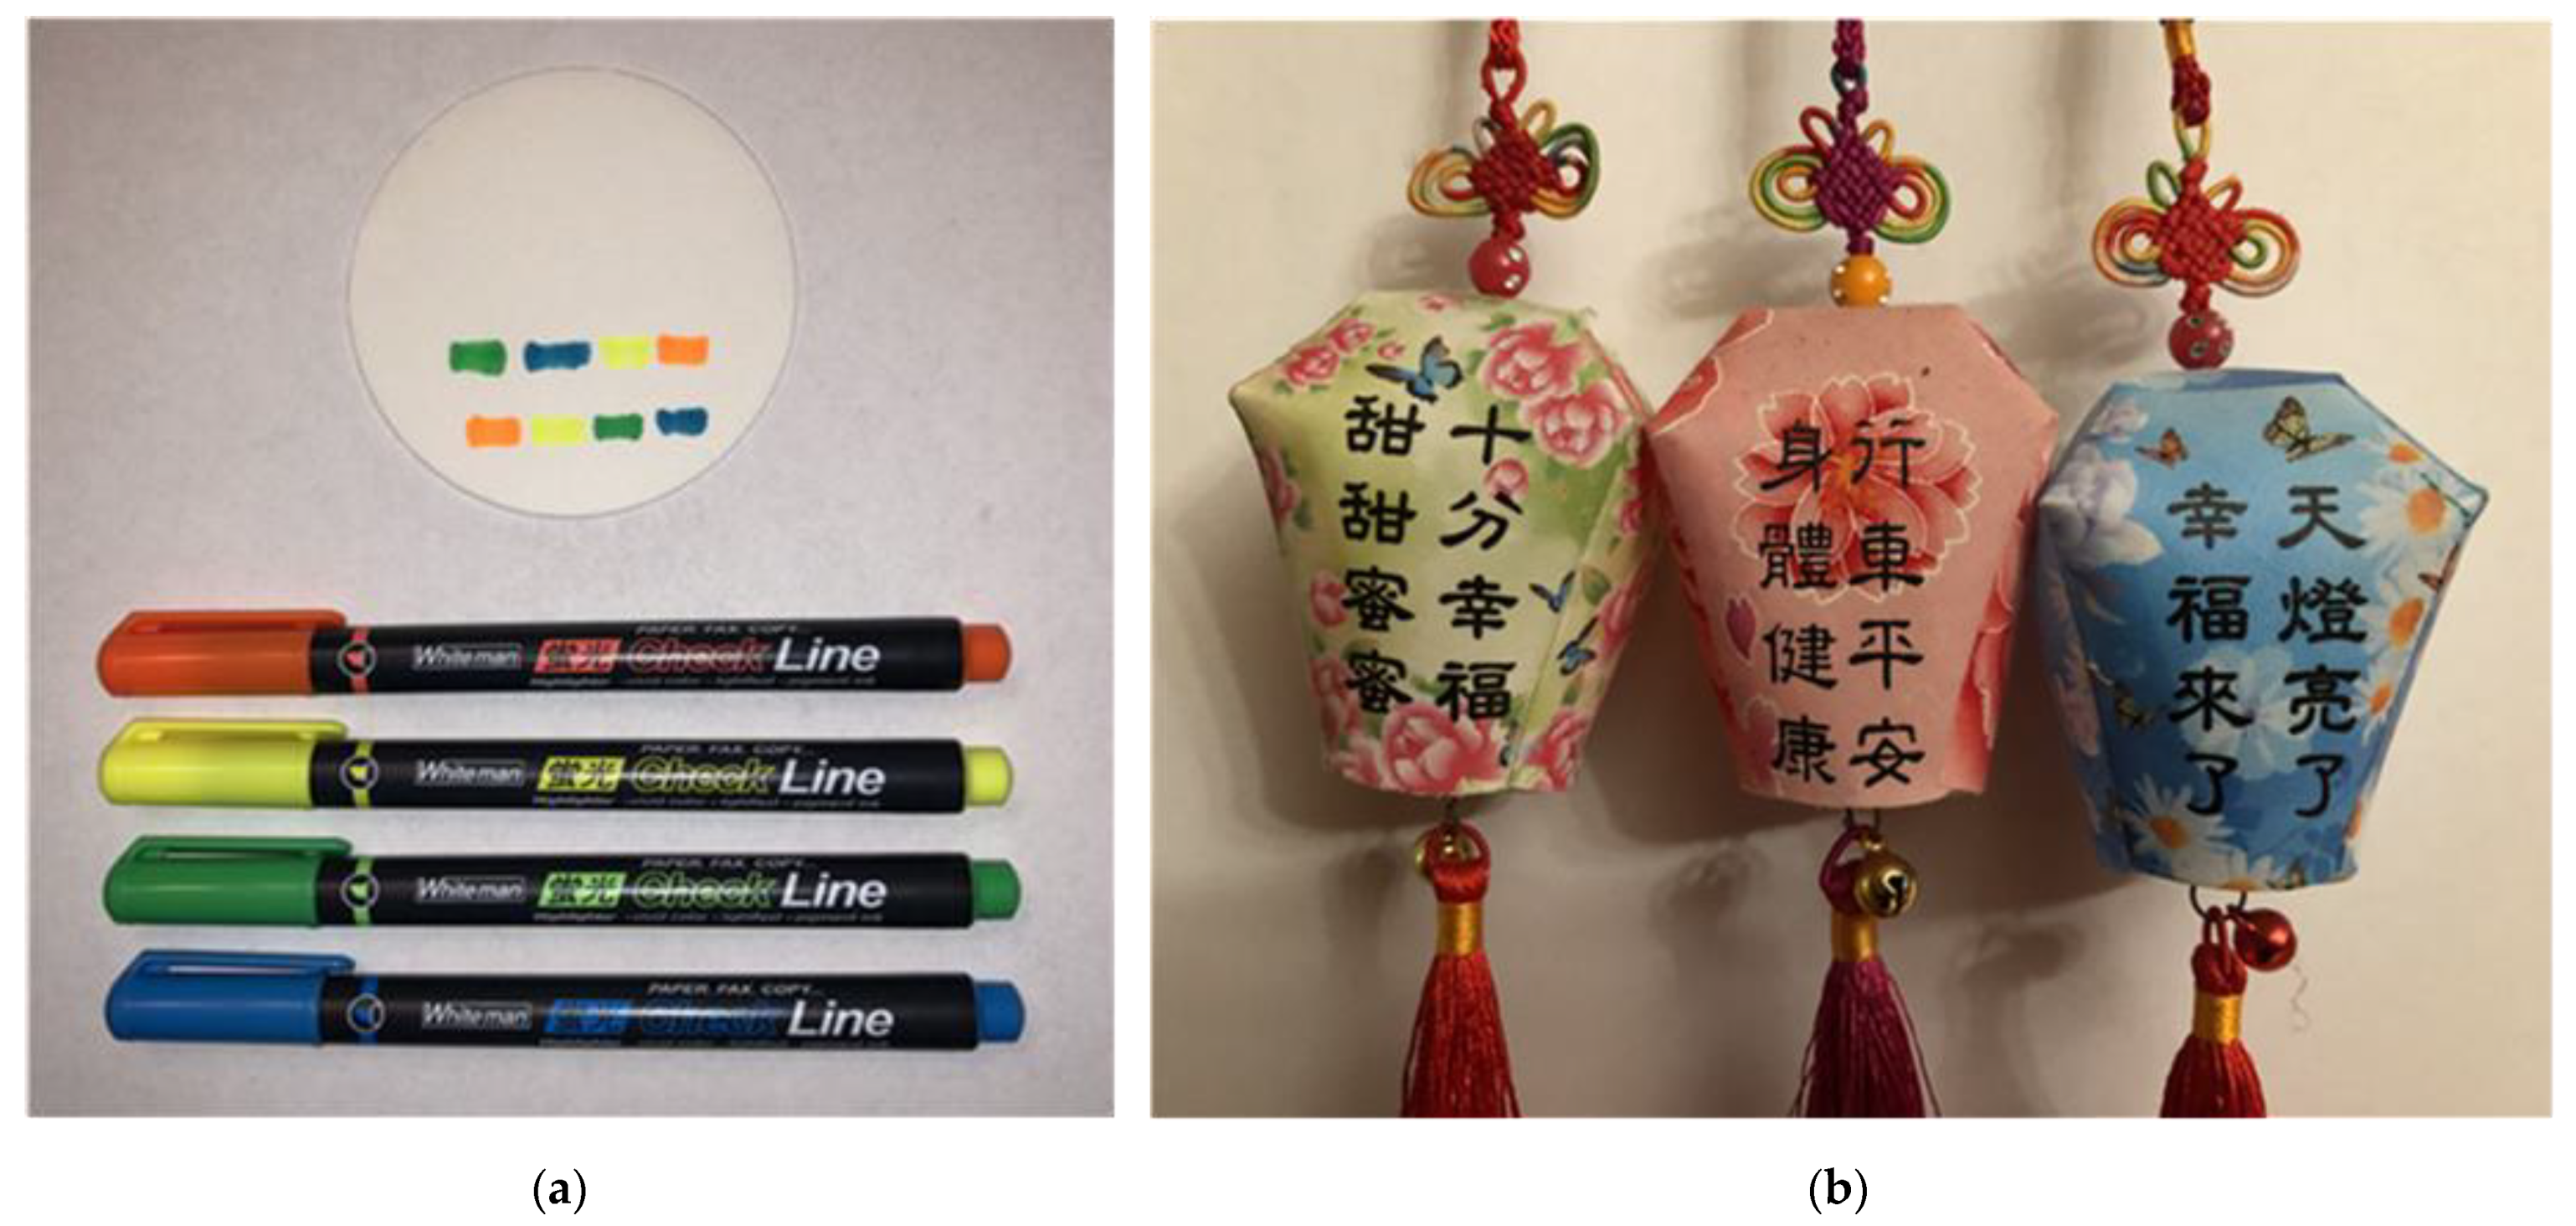
For the first set, highlighter pens with four different colors, white filter papers and a container for water were prepared for chromatography experiments (
Figure 1a). Dots and lines were drawn on the filter papers using the highlighter pens before dipping the bottom of the filter paper into the water for water absorption and diffusion for chromatography. Diffusion characteristics of highlighter ink with water absorption were recorded as video clips and the colorimetric information was extracted as a function of position and time.
For the second set, decorative lights with randomly blinking light-emitting diodes (LEDs) were prepared (
Figure 1b). Blinking decorative lights were recorded as video clips for the colorimetric analysis using the image analysis software. This is to simulate the color characterization of bioluminescence.
Quantitative colorimetric information on points, lines and areas of interest, in still images sampled from the video clips, were extracted to demonstrate the traceability and feasibility of statistical analysis of the extracted data. For dynamic analysis, colorimetric information in the video clips was extracted as a function of time and location.
The static analysis was performed at specific point(s), line(s) and area(s) of the image(s) at a given time. The dynamic analysis was performed at specific point(s), line(s) and area(s) of time-series image(s) (i.e., video clips) by either synthesizing time cross-section image(s) or color/intensity information as a function of time.
3. Results
3.1. Chromatography Experiment
White filter papers with color dots and lines in different marked patterns, using highlighter color pens, were prepared. The bottom parts of the marked filter papers were immersed into water to observe ink diffusion patterns and the speed of diffusion. As the water is absorbed by the filer paper, the ink color diffuses and travels with the water. The experimental scenes were recorded as video clips for image analysis using the software (PicMan).
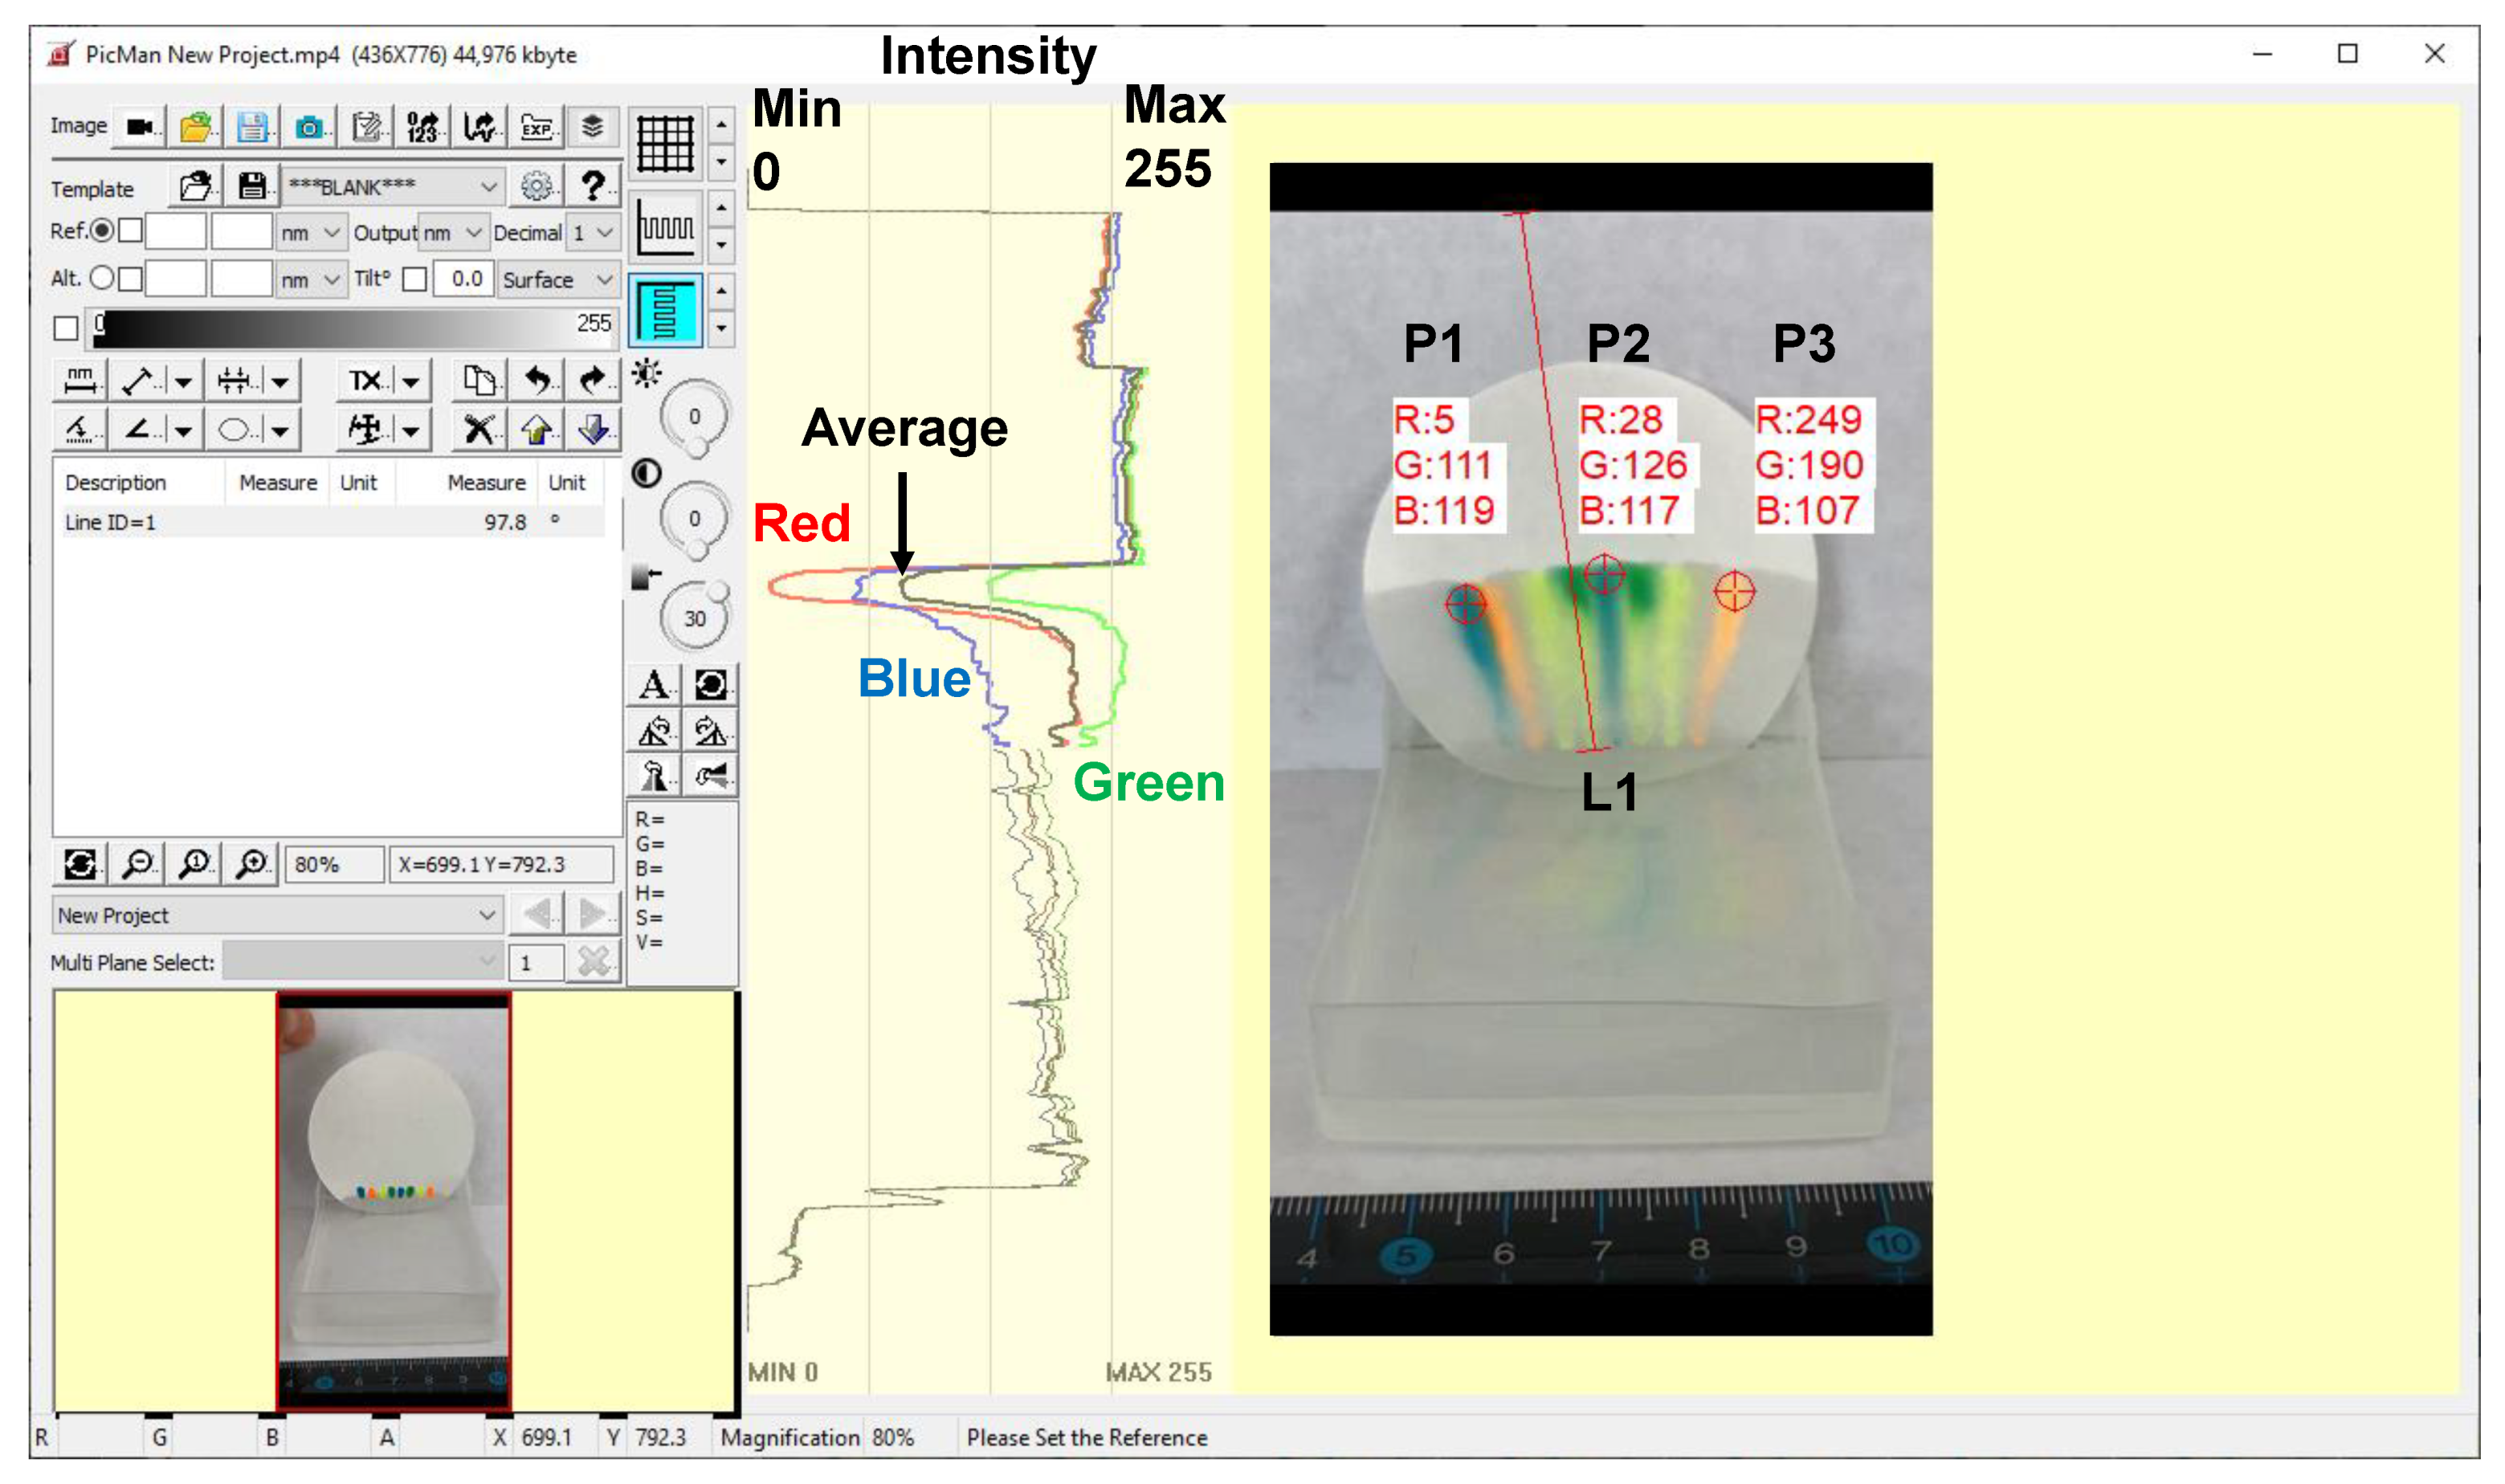
Figure 2 shows a screen captured image of the PicMan software being used for color analysis of three specific points (P1, P2 and P3) and a line segment L1, on a frame extracted from one of the video clips. The video clip used in the figure has eight (8) colored dots marked by highlighter pens. The absorption of water by the filter paper and the diffusion of colored ink dots were recorded with 30 frames per second (fps) for 180 s. The total number of frames for this specific video clip is 5400 (=180 s × 30 fps). In other words, each pixel on the image has 5400 points of time-series, RGB intensity data for a period of 180 s (30 points per second, frame rate). The figure shows an RGB intensity graph along the line segment L1. The RBG intensity range is between 0 and 255 because the intensity of each color channel is assigned to 8-bit (2
8 = 256) levels. The line intensity data can be exported as CSV files for further analysis and customized graphical display. The colors of the lines in the intensity graph represent each color component. The gray line is the average of RGB intensity in the 0~255 range. The solid lines in the line intensity graph represent the intensity of RGB channels in the line segment L1, while the dotted lines represent the line intensity of RGB channels outside of the extended portion of the line segment L1. As seen from the line intensity graph, the color ink on the line segment L1 travels with the water, leaving a bright yellowish color as a trail. Visual inspection can also be used, but it would be very difficult to quantitatively record results and the subjectivity of all records could not be avoided.
For image display on a monitor screen, color is reproduced by combinations of RGB intensity. Each pixel has three 8-bit intensity values (3 channel × 8 bit = 24 bit) and can display 2
24 (=16,777,216) colors. The RGB color system is one of many color systems used in practice. For image display, an RGB color system is used and all colors are uniquely identified as RGB-based hexadecimal color codes. For printing, CMY (cyan, magenta, yellow) and CYMK (cyan, yellow, magenta, key) color models are used. The HSL (hue, relative chroma, intensity) and HSV (hue, saturation, value) color systems are also frequently used. The CIELAB color space often referred to as L*a*b* is a color space defined by the International Commission on Illumination (CIE) in 1976 [
31,
32,
33]. Color conversion between different color systems is often required for imaging system calibration and comparison with color standards or acquired images of standard color palettes. To accommodate the technical requirements for practical use, the PicMan software added the color conversion function. Color information on point(s), line(s) and area(s) of interest can be converted into the desired format and exported as the CSV file format.
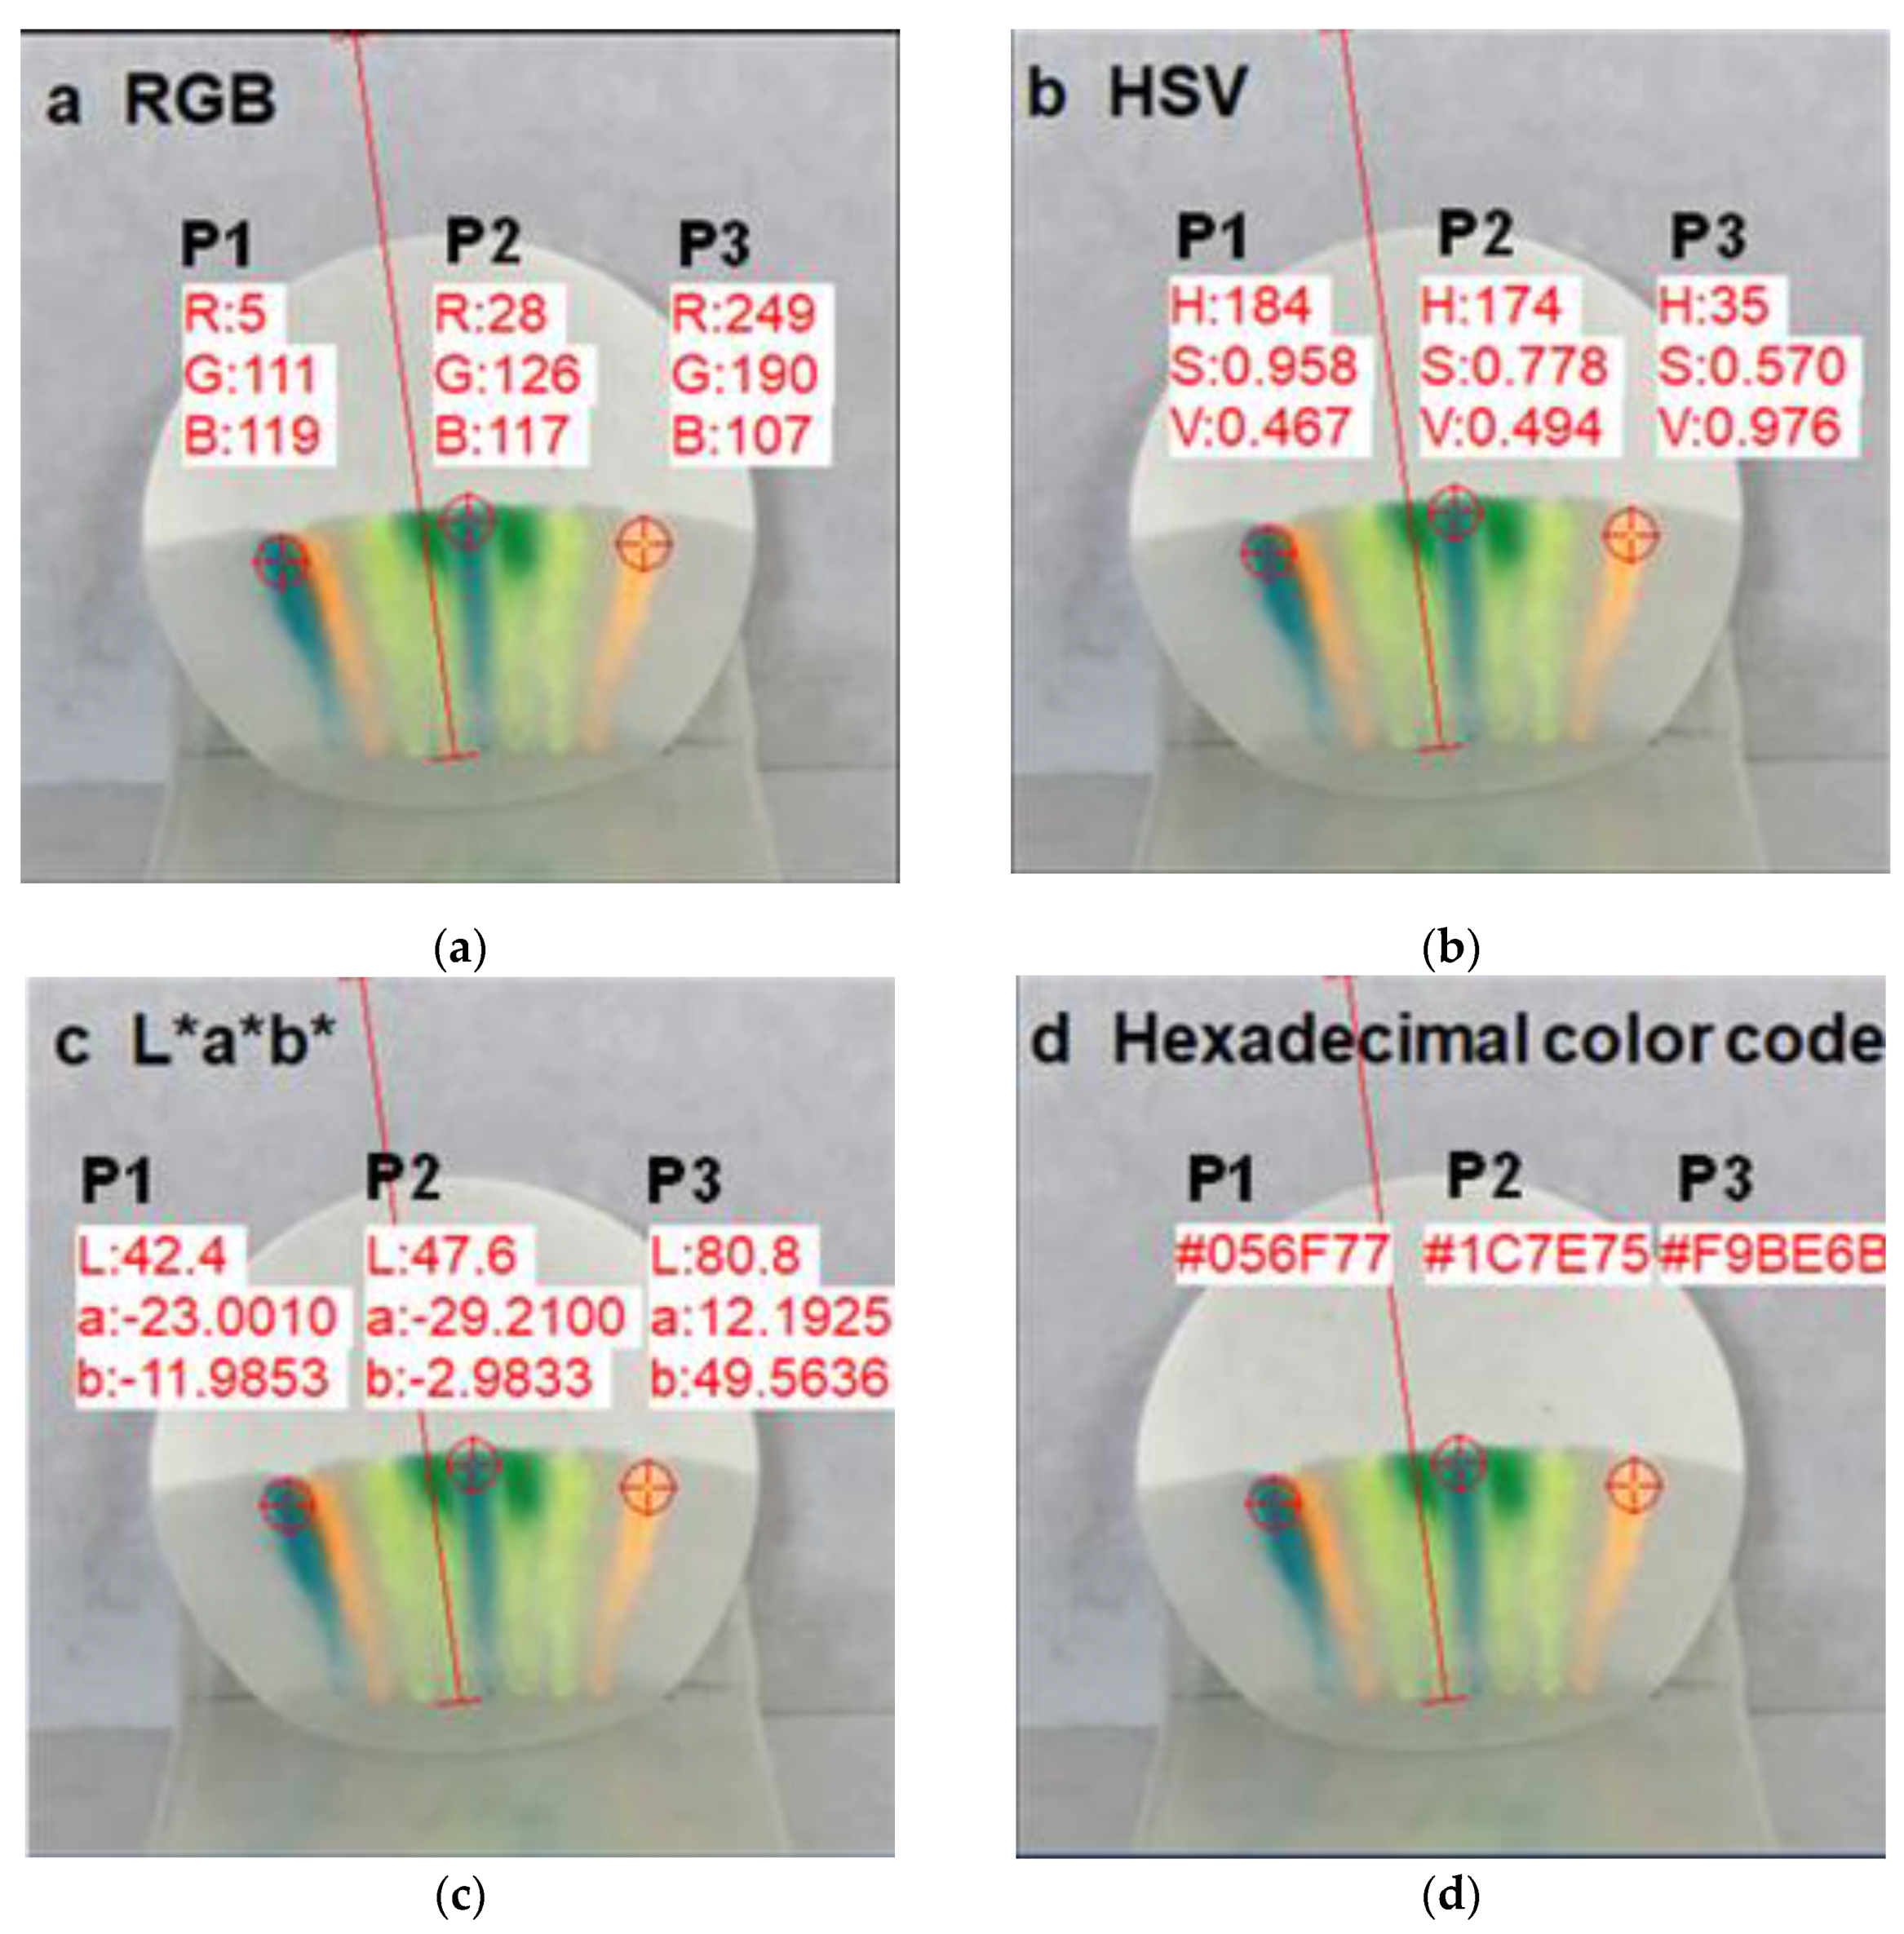
Figure 3 shows examples of color conversion of three points (P1, P2 and P3) on the image, as displayed on the screen, between color systems. HSV and L*a*b* color systems can also be used instead of the RGB color scale. The color information can also be exported in the hexadecimal codes and Munsell color system. To use general photographs and video images with RGB scale for calorimetric determination, it is convenient to use the original format from imaging devices without colorimetric conversion into other color systems.
Objects and substances which evolve with time require dynamic analysis, thus video image recording techniques are commonly used. However, dynamic image analysis is not easy because it contains a lot of information on a single-frame image and a large number of frames. A single-frame high-resolution image can easily contain more than 10 mega pixels (10 million pixels, 10 MP) of RGB intensity data. Visual inspection by trained personnel, including researchers and operators, is typically employed for this type of task. It is easy to make human errors and form biased opinions. Automatic image analysis techniques must be developed for effective data mining and the prevention of human errors.
Figure 4 shows 45 images sampled every 4 s from a 180-second-long video clip (30 fps × 180 s = 5400 frames). It only shows less than 1% (45 frames/5400 frames = 0.83%) of the total information recorded in the video clip. We are not utilizing 99.17% of the available images. By scanning well-organized time-series images, we can form an opinion on the movement of colored ink from the chromatography experiment. Without proper image analysis software, we can only rely on manual, time consuming measurements to form even a qualitative and subjective opinion. We can only verbally describe how the colored ink was diffusing with water absorption by the filter paper.
Time cross-section operation of PicMan was used to synthesize new images from the start (frame 0) to the end (frame 5400) of the 180-second-long video clips of a chromatography experiment.
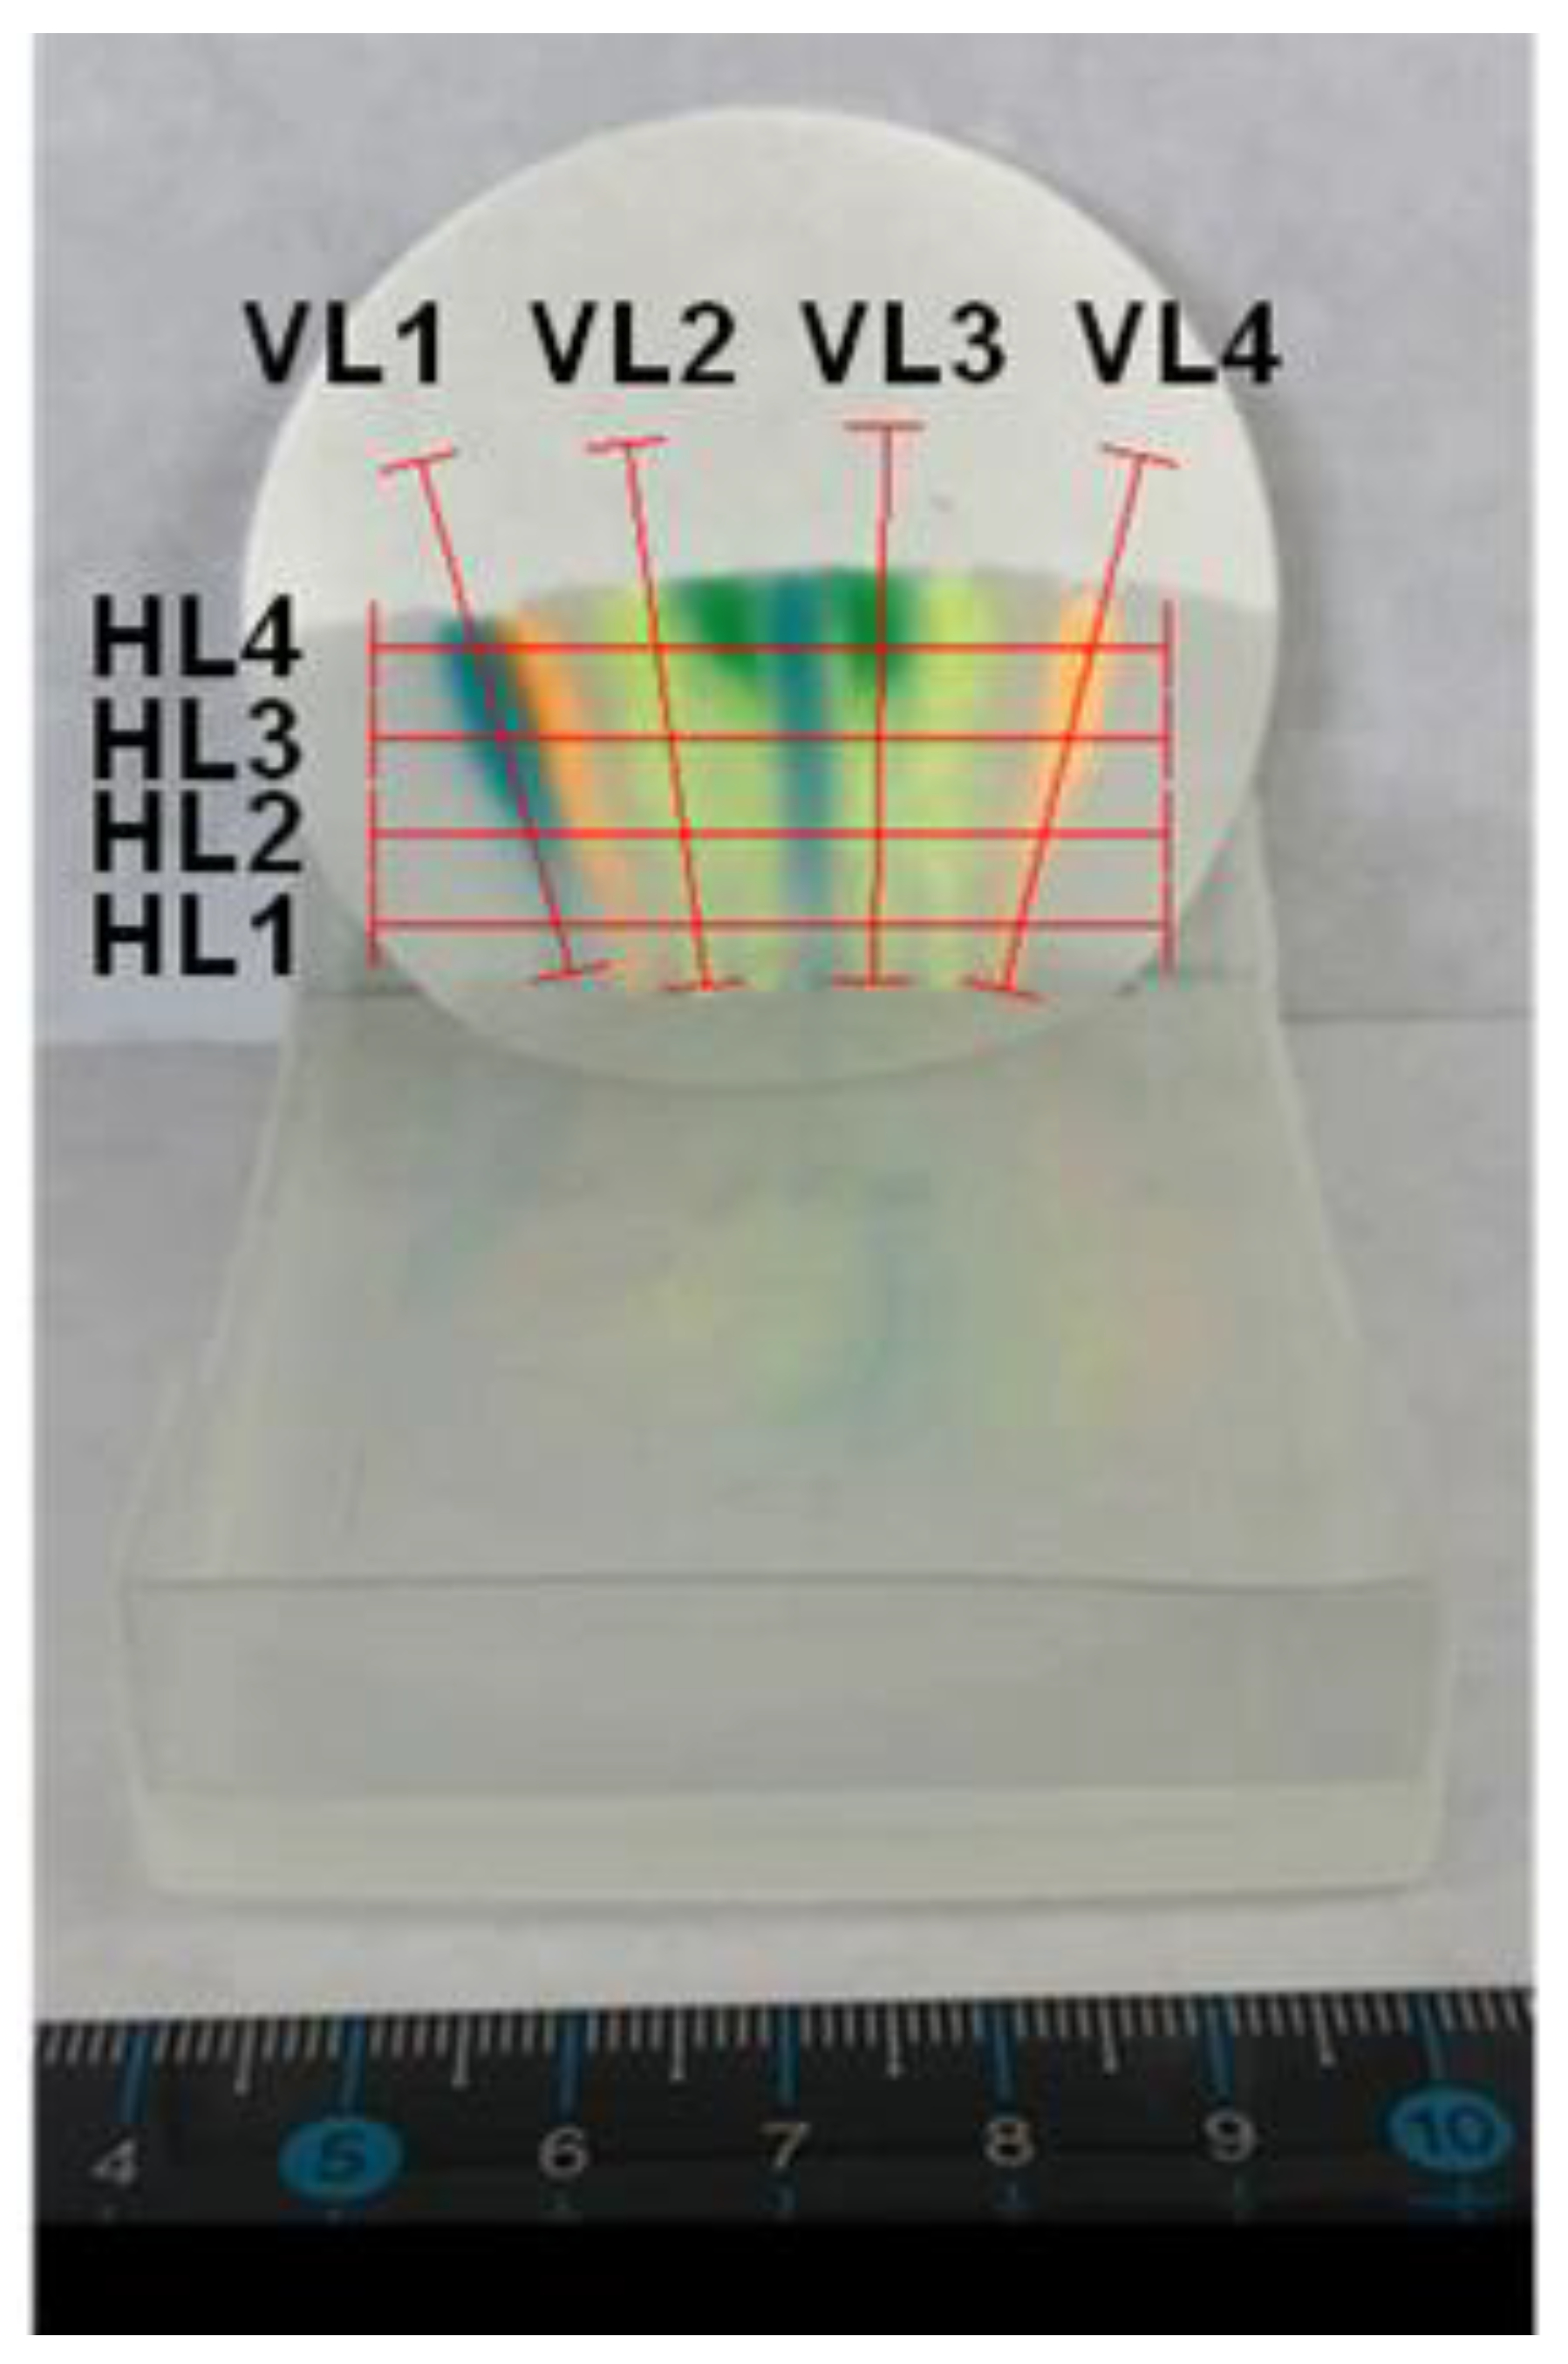
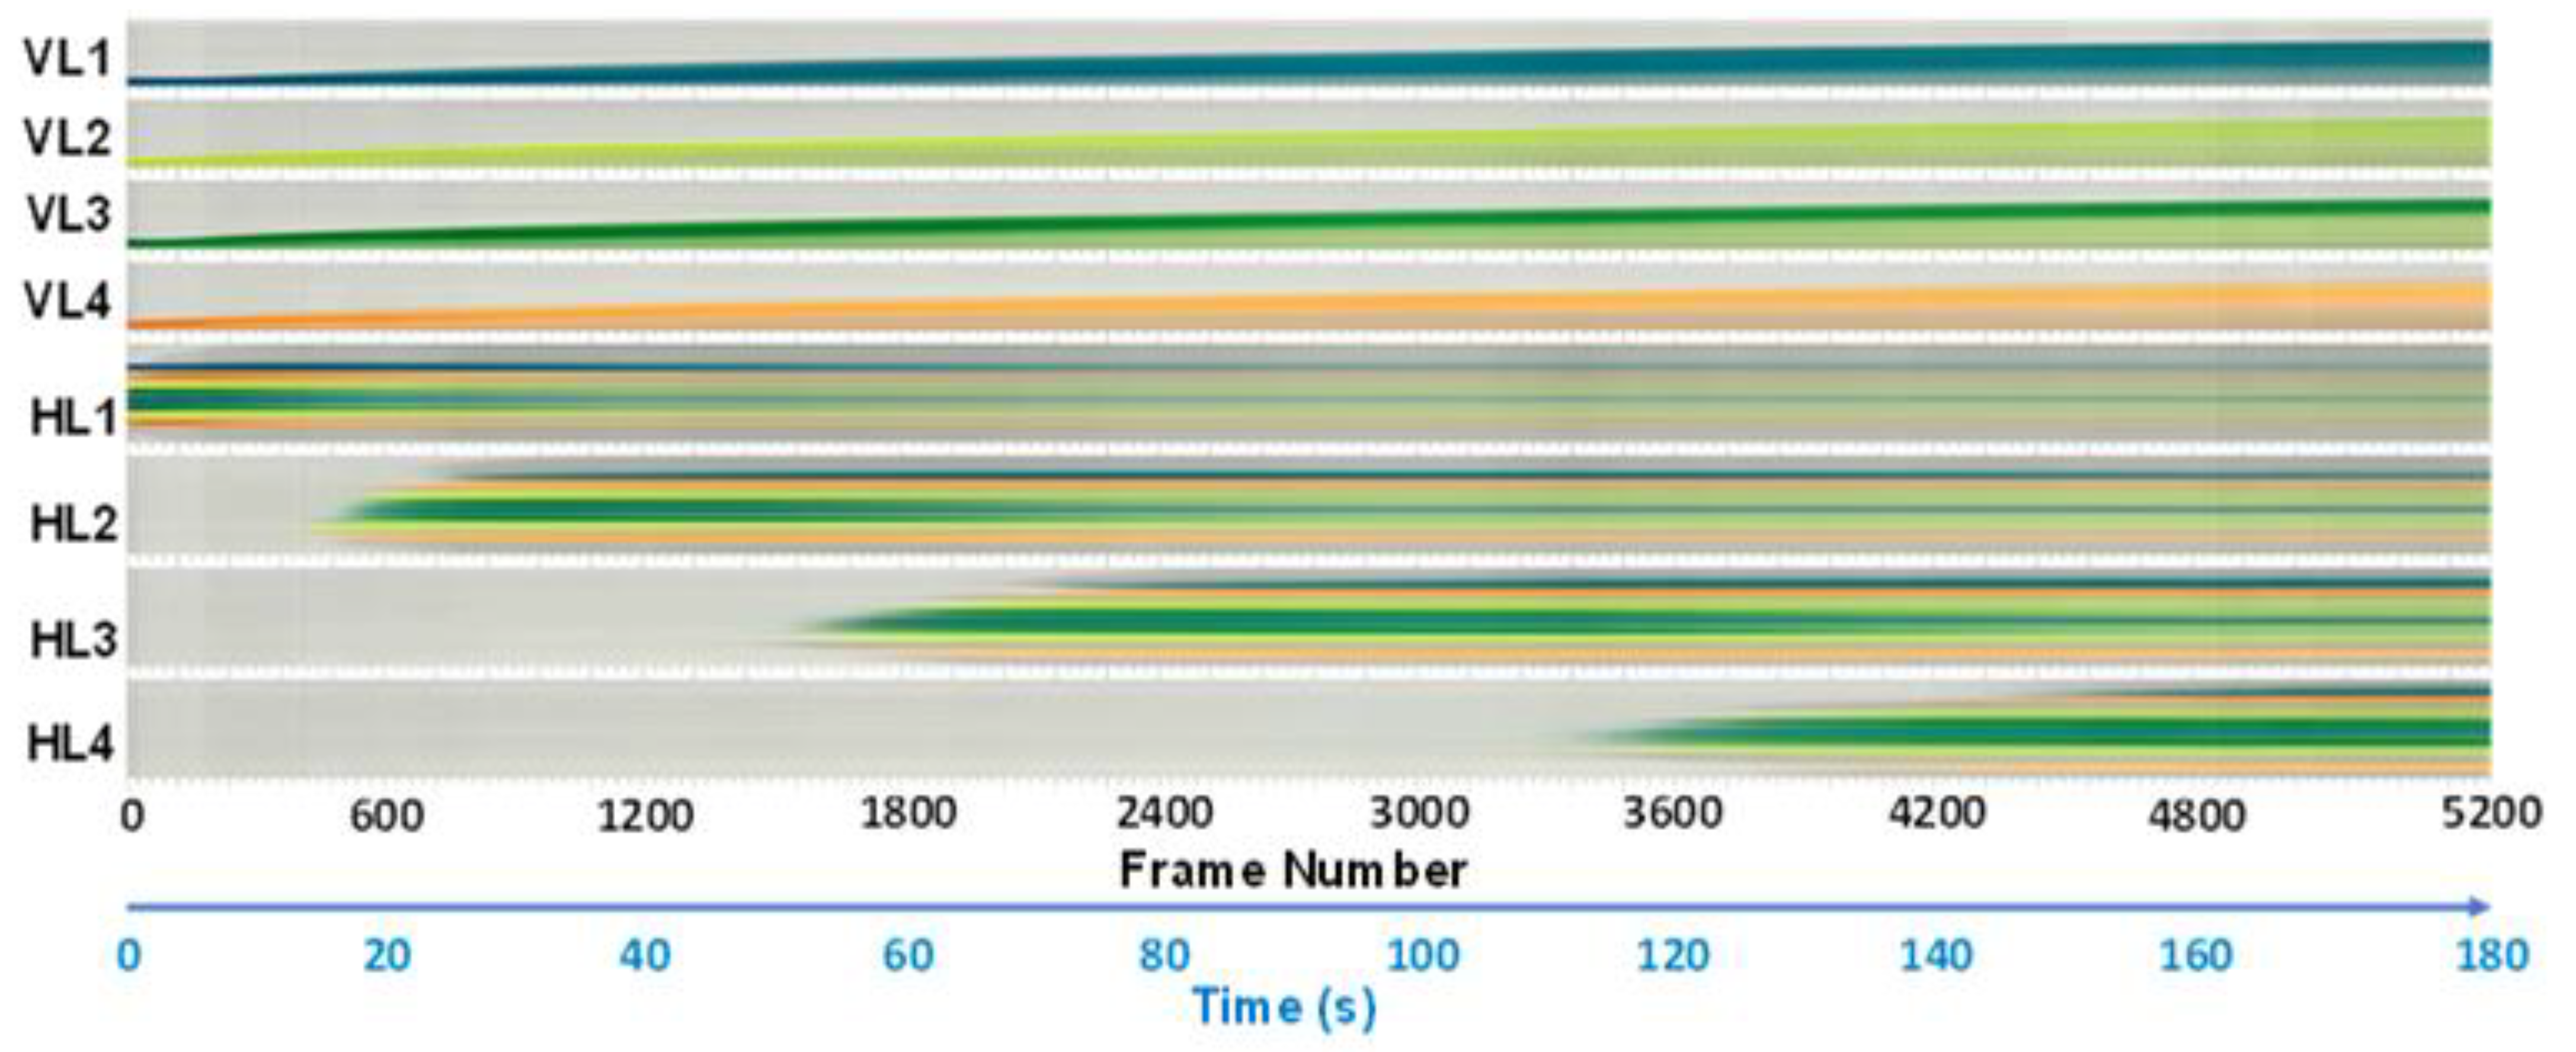
Figure 5 shows four vertically sloped line segments and four horizontal line segments of interest for information extraction. The synthesized time cross-section images of the eight-line segments from 5400 frames of images are shown in
Figure 6. The horizontal axis represents time in seconds. It can be used as a reference for frame number by multiplying the frame rate of 30 fps by the time elapsed. As seen in the figure, ink diffusion speed and color change with time (or water absorption and ink diffusion) are well summarized as a time-synchronized, newly synthesized image. From the upper half of a synthesized image (four vertically sloped line segments), we can easily recognize ink diffusion speed, ink color separation and cumulative diffusion length. From the bottom half of the synthesized image (four horizontal line segments), we can see the time required for the ink to cross the horizontal lines. The synthesized images can also be used for additional color information analysis using PicMan for additional insights. All data can be exported in various formats: CSV files, line graphs, modified or processed images and/or newly synthesized images for efficient and effective use of image-based experimental data sets.
3.2. LED-Based Decorative Light Experiment
Color, brightness, contrast, uniformity and their changes with time and conditions are considered as meaningful signals in image-based data processing for chemical, biological and medical applications. We typically take photographs and record video clips to document what we observe under certain circumstances, either simple observations or controlled experiments. Finding meaningful signals from acquired image(s) and video clip(s) is the most important step. Once the signals are found, the decoding and analysis of the signals into meaningful stories or scenarios begins. It is similar to a detective’s investigation process.
To simulate this process, we recorded video clips of three decorative lights which have independently and randomly blinking, three-color, LEDs inside. From one of the recorded video clips, we have extracted color and brightness information on a line segment (L-L’) as a function of time (or frames) in
Figure 7. It was an 18.5 s long video clip with 30 fps. The total number of frames was 555. All color and brightness information on the line segment L-L’, per frame, was extracted and assembled into a new, time cross-section image in the time sequence. Images extracted from the video clip at 4, 8, 12 and 16 s from the recording start were also shown for reference. Three squares (A1, A2 and A3) indicated in the top image allow statistical analysis of color and brightness information as a function of time (or frames) to decode LED blinking sequences or time charts per individual LED in three different decorative lights. White filter papers with color dots and lines in different marked patterns, using highlighter color pens, were prepared. The bottom part of the marked filter papers was immersed into water to observe ink diffusion patterns and the speed of diffusion. As the water is absorbed by the filter paper, the ink color diffuses and travels with the water. The experimental scenes were recorded as video clips for image analysis using the software (PicMan).
From the time cross-section image in
Figure 7 (bottom left), we can easily recognize rough blinking intervals and color changes in each of the decorative lights. However, it is difficult to decode the mixture of an individual LED’s blinking sequence by visual inspection, due to the filtering effect from the color and black letters of the light housing. For accurate decoding of an individual LED’s blinking sequence, we have to select the area of minimum disturbances from the design pattern and letters on the decorative lights. We have selected three areas (A1, A2 and A3 in
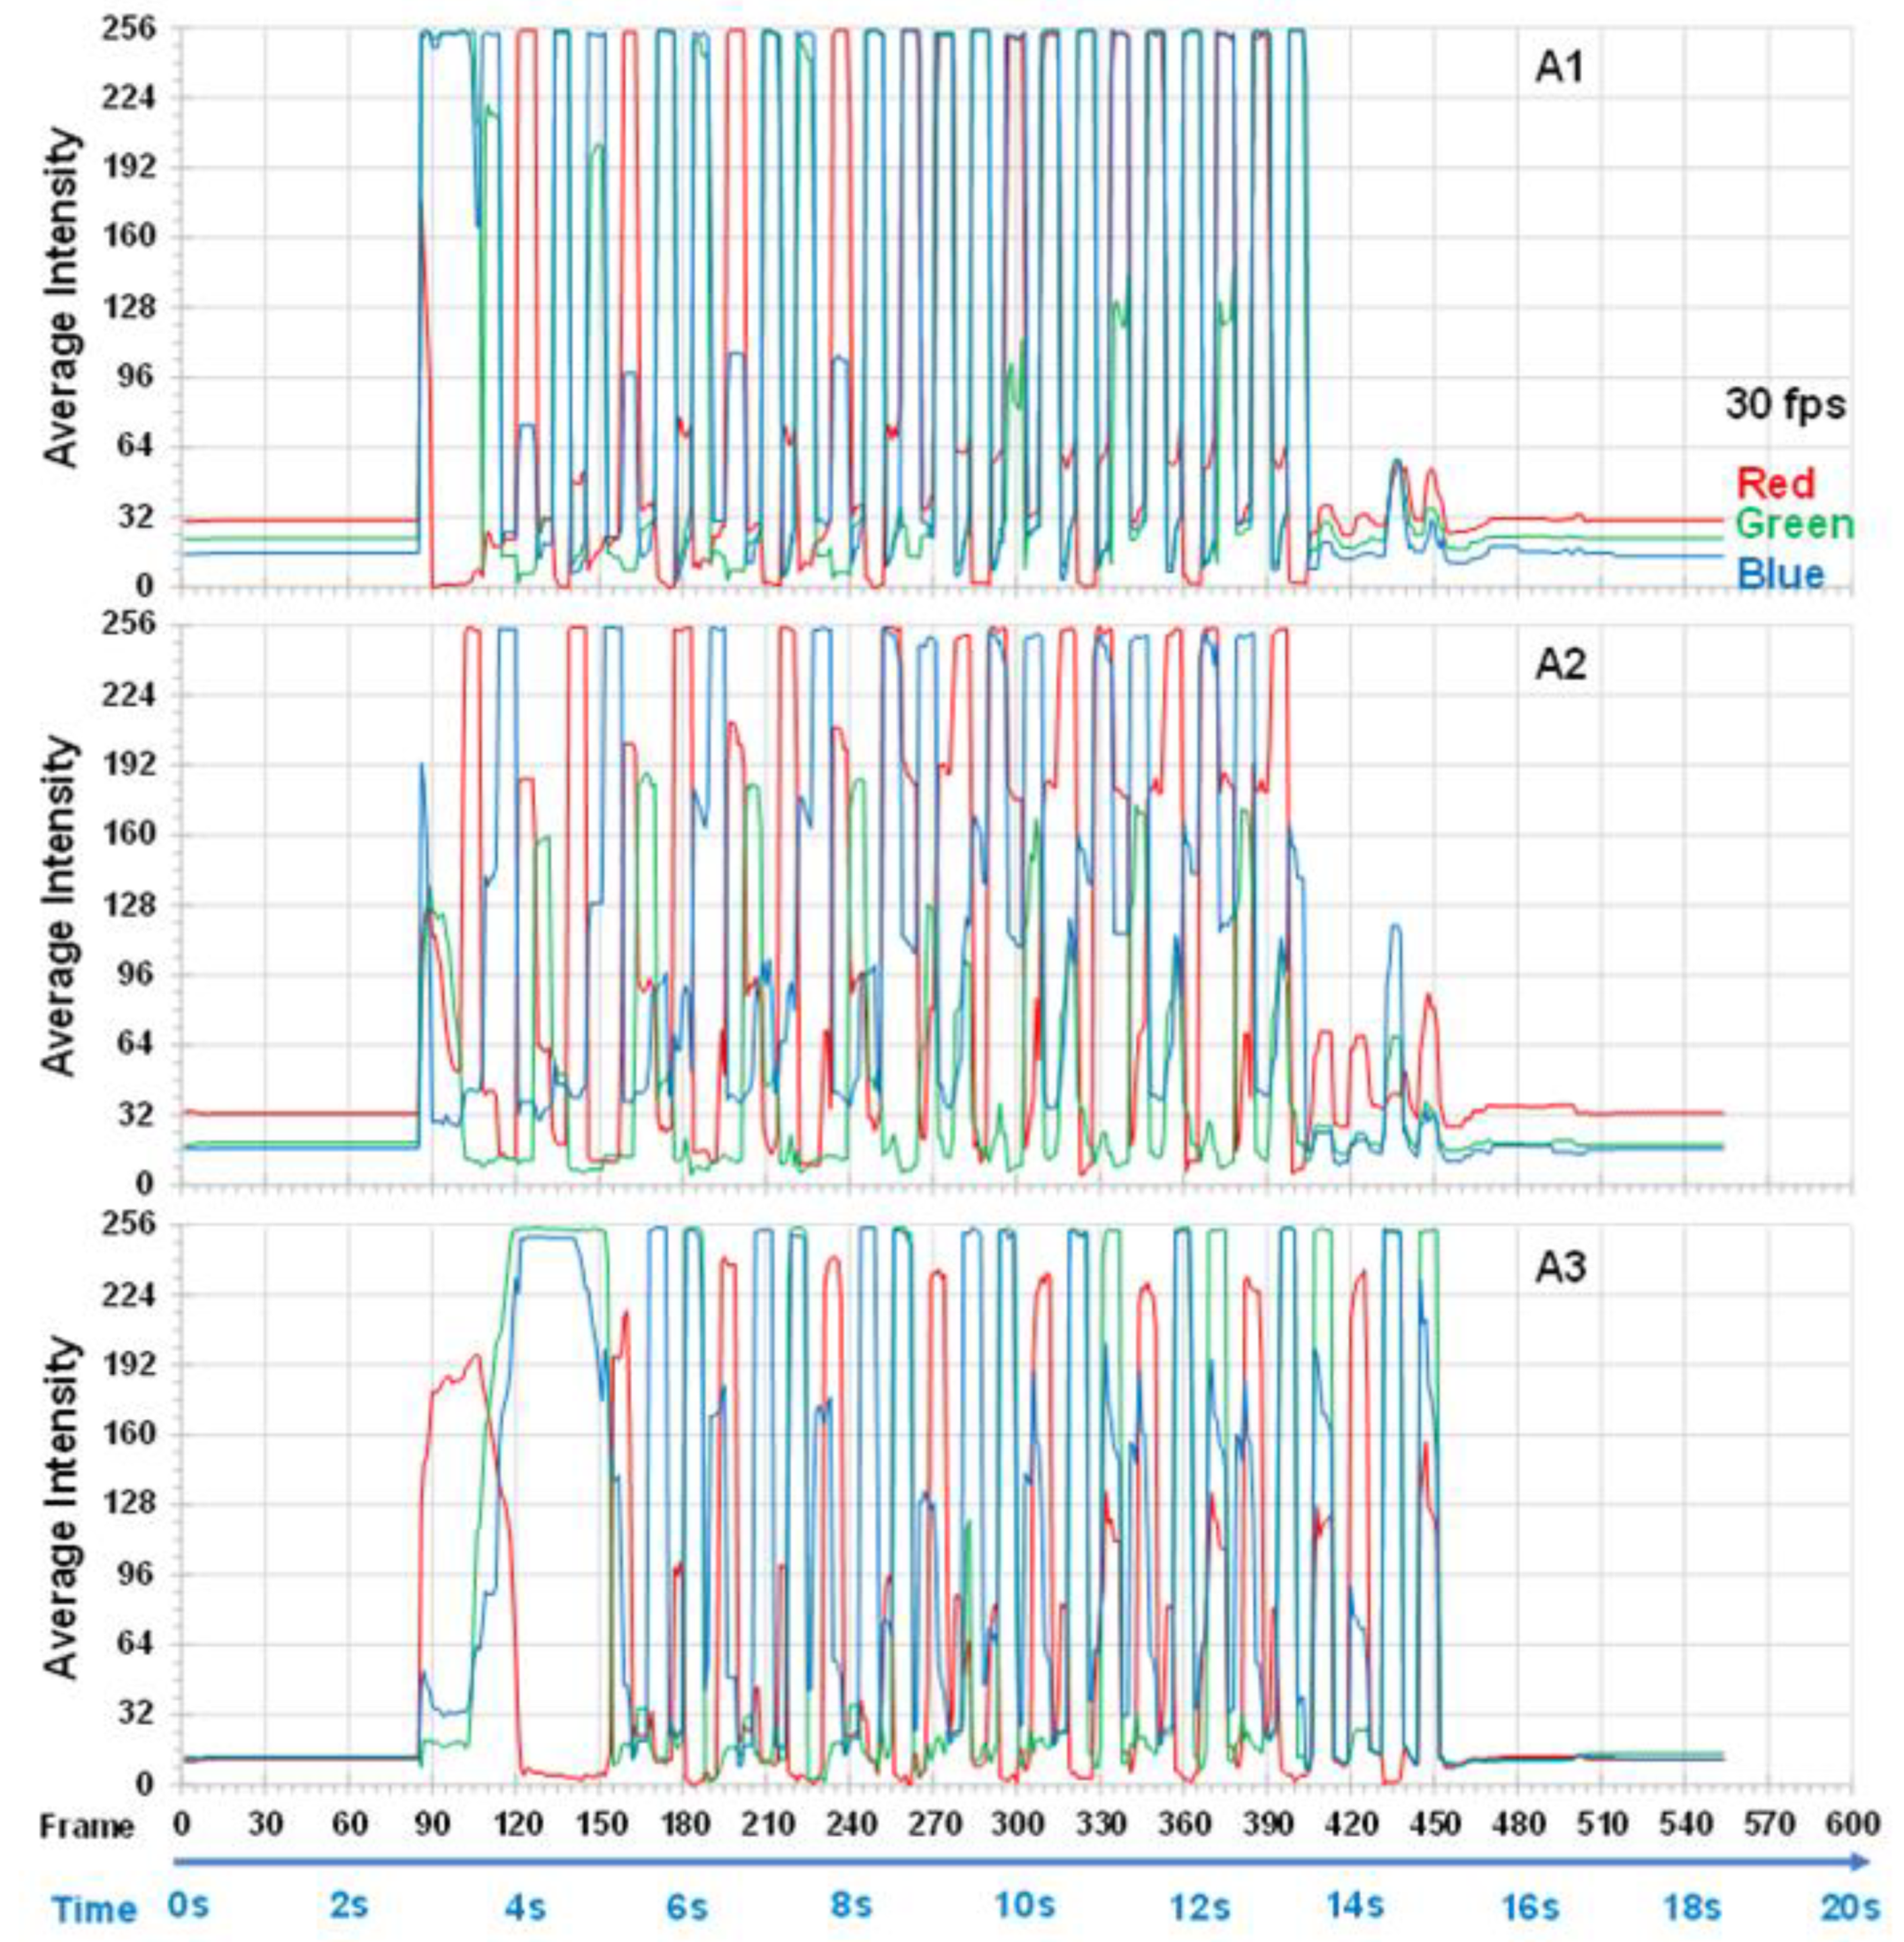
Figure 7) of 100-pixel squares (=10 pixel × 10 pixel) and extracted average color information on the selected areas per frame. The extracted color information was graphed as RGB intensity as a function of time per decorative light (
Figure 8). The blinking sequences of nine LEDs (a set of RGB LEDs per decorative light) were perfectly decoded.
4. Discussion
With the advances in image sensor technology, application software development and computer performance, we can record a large quantity of high-resolution and high-quality photographs and video clips. However, we can only use a very small portion of the information from recorded images. It is typically far less than a fraction of one percent of the information contained in image files. This is true for all industries and academic fields, including the semiconductor industry, materials science and engineering, chemical, biological and medical fields. It is time to focus on image analysis and investigate how to use the information contained in images effectively and efficiently. Newer concepts for image data processing and extracted data reconstruction must be developed.
We have demonstrated new ways of image analysis, data extraction and image reconstruction techniques using the novel image processing software, PicMan. It is easy to integrate image sensors with PicMan to develop customized integrated image sensing and image analysis systems. Color conversion functions can also be used for system calibration. Of course, all basic functions can either be found or developed by individual researchers. However, it is neither cost-effective nor is it the best possible option for image acquisition and analysis for practical usage. It is important to collaborate with experts to provide engineering solutions with necessary skill sets. We have to remind ourselves how much information in the image files is not utilized or even reviewed and how important it could be. We have to mine meaningful data from all images, as much as possible, before acquiring additional image data. To do this we must improve our data mining skills.
Almost all image-based colorimetric studies are designed for very specific tasks for static analysis and are not available for dynamic analysis or the expansion/modification of applications [
1,
2,
3,
4,
5,
6,
7,
8,
9,
24,
25,
26,
27]. The development of image-based, static and dynamic colorimetric analysis software (PicMan) for universal applications can provide significant flexibility in image analysis and information extraction from image(s) and video clip(s) of various formats. Various application examples can be found elsewhere [
10,
15,
16,
17,
18,
19,
20,
21,
22,
23,
28,
29,
30,
34].
5. Conclusions
Concepts of colorimetric sensing techniques for point(s), linear and areal array(s) were introduced along with the use of newly developed image processing software (PicMan) combined with image sensors for greater insight into the fields of chemical, biological and medical applications. As analytical examples, using the image analysis software, video clips of chromatographic experiments using different colored inks on filter papers dipped in water and randomly blinking LED-based decorative lights were used. The colorimetric information on real-time monitoring and recorded images or video clips can be analyzed for the point(s), line segment(s) and area(s) of interest for manual and automatic data collection.
The colorimetric information on point(s), line segment(s) and area(s) with different sizes from the video clips were extracted, analyzed and recreated as synthesized images as a function of time. As a demonstration of the developed colorimetric analysis technique, the colorimetric information was expressed as static and time-series combinations of RGB (red, green, blue) intensity, HSV (hue, saturation and value), CIE L*a*b* values, hexadecimal color codes and Munsell color index. Monitoring and recording of colorimetric information on one or more specimens were demonstrated by decoding blinking time sequences of individual LEDs in three independently operating, randomly blinking LED-based decorative lights.
Ex situ and in situ colorimetric data can be used as signals for process control, process optimization, safety and security alarms, and inputs for machine learning and data mining, including artificial intelligence. The importance of improving image analysis techniques for the efficient and effective use of information carried by images is demonstrated and emphasized.
For ensuring colorimetric data accuracy and repeatability, the qualification and calibration of image sensors must be established. The image resolution, frame rate, shutter speed and image format must be specified for consistent results. Application-specific customized functions for proper colorimetric analysis must be developed based on the requirement for image analysis/processing software.


