Article

An Efficient Hybrid CNN Classification Model for Tomato Crop Disease

by
Maria Vasiliki Sanida
1,†,
Theodora Sanida
2,*,†,
Argyrios Sideris
2 and
Minas Dasygenis
2
1
Department of Digital Systems, University of Piraeus, 18534 Piraeus, Greece
2
Department of Electrical and Computer Engineering, University of Western Macedonia, 50131 Kozani, Greece
*
Author to whom correspondence should be addressed.
These authors contributed equally to this work.
Technologies 2023, 11(1), 10; https://doi.org/10.3390/technologies11010010
Submission received: 28 November 2022 / Revised: 17 December 2022 / Accepted: 30 December 2022 / Published: 4 January 2023
(This article belongs to the Section Assistive Technologies)

Abstract

:
Tomato plants are vulnerable to a broad number of diseases, each of which has the potential to cause significant damage. Diseases that affect crops substantially negatively impact the quantity and quality of agricultural products. Regarding quality crop maintenance, the importance of a timely and accurate diagnosis cannot be overstated. Deep learning (DL) strategies are now a critical research field for crop disease diagnoses. One independent system that can diagnose plant illnesses based on their outward manifestations is an example of an intelligent agriculture solution that could address these problems. This work proposes a robust hybrid convolutional neural network (CNN) diagnostic tool for various disorders that may affect tomato leaf tissue. A CNN and an inception module are the two components that make up this hybrid technique. The dataset employed for this study consists of nine distinct categories of tomato diseases and one healthy category sourced from PlantVillage. The findings are promising on the test set, with 99.17% accuracy, 99.23% recall, 99.13% precision, 99.56% AUC, and 99.17% F1-score, respectively. The proposed methodology offers a solution that boasts high performance for the diagnostics of tomato crops in the actual agricultural setting.

1. Introduction

Each year, around 177 million tons of tomatoes are produced worldwide, which are among the essential crops. Tomatoes can improve health and lower the risk of diseases like cancer, osteoporosis, and heart disease. Regular tomato consumers are less at risk of cancers such as prostate, stomach, lung, breast, oral, colorectal, cervical, esophageal, pancreatic, and many other forms [1,2]. Since healthy plants are particularly susceptible to illnesses, which have devastating consequences on the agricultural economy, protection from disease is necessary to ensure the quantity and quality of crops.
The primary cause for the reduction in worldwide tomato production is tomato disease, according to research conducted by the Food and Agriculture Organization of the United Nations (FAO) [3,4]. Most tomato infections, however, begin inside the leaves and gradually extend to the entire plant. It is crucial to note that early monitoring is necessary for selecting the most effective strategy and preventing disease progression. Experts frequently identify and detect diseases through straightforward manual [5,6]. Therefore, to detect crop disease early on, deep learning and machine learning techniques have emerged as the main directions for future research. Timely disease management will increase the survival rate of crops, flowers, and vegetables, including fruits and grass [7,8].
The conventional, professional diagnosis of diseases that affect tomato leaves is both expensive and prone to subjectivity [9,10]. The detection of agricultural diseases is presently making substantial use of machine learning, computer vision, and deep learning due to the fast rise of computer technology. The development of open-source hardware has increased in recent years, which has stimulated the architecture and deployment of low-cost agricultural monitoring devices that are equipped with artificial intelligence (AI) and image-processing algorithms. The commonality of disease features, which makes it difficult to discern between different disease types, contributes to the poor accuracy of sickness detection in natural environments that are very complex [11,12].
Today, convolutional neural networks (CNNs) are more capable than standard feature extraction methods. CNN is a deep learning network that performs at a high level and employs an end-to-end architecture and abandons the complicated procedures of image preprocessing and feature extraction, simplifying the identification process compared with its learning model counterparts. Deep learning has gained significant dominance in several application areas in recent years. This new subject of deep learning is rapidly expanding and has been applied to the majority of classic application domains as well as some new application areas that provide more excellent prospects. In the fields of medical imaging, machine translation, speech identification, computer vision, image processing, medical information processing, art, natural language processing, robotics and control, bioinformatics, and cyber security, among others, deep learning outperforms conventional machine learning techniques [13,14,15].
This article presents a practical hybrid classification approach using image data to identify ten different diseases that have the potential to damage tomato plants. The model’s CNN architecture combines VGG [16] blocks and the inception [17] module. The proposed model obtains a high classification accuracy rate on a large dataset compared to other already developed approaches. In this way, image-based tomato disease identification enables agricultural domain specialists to detect damaged crops as early as feasible to avoid production loss problems.
The main contributions of the proposed work can be summarized as follows:
  • A hybrid-enhanced CNN model is proposed for tomato disease identification. An inception block was added to the VGG16 model in order to take use of the capabilities of simultaneous multiscale feature extraction. The hybrid CNN model has powerful feature extraction qualities and uses these capabilities.
  • The effectiveness of the proposed hybrid CNN model was analyzed through rigorous high-level simulations. The results obtained from the developed hybrid CNN model were compared against the most recent and state-of-the-art models.
The remaining sections are organized as follows: Section 2 examines the newest disease categorization strategies for tomato crops. Section 3 then explains the architecture of the proposed approach, while Section 4 analyzes the findings and compares the acquired classification accuracy with current classification methods. Section 5 concludes the work provided in this article and provides an outlook for the future.

2. Related Work

A significant amount of research has been carried out in order to find the most effective solution to the problem of crop disease identification. This has been accomplished by establishing methods that assist in the identification of crops in an agricultural context. This section covers research that has been vetted by experts, and it focuses on tomato plant disease and CNN methodology.
Rangarajan et al. [18] classified six distinct illnesses and a healthy tomato variety using AlexNet and VGG16. Performance was examined by adjusting the number of pictures, weight and bias learning rates, and batch sizes. They found that AlexNet provides more precision with less execution time than VGG16. Using 13,262 images, the classification rate for VGG16 was 97.29%, while for AlexNet, it was 97.49%. A modified CNN model was developed by Agarwal et al. [19] by altering the structure and architecture of the VGG16 network. They compared this model against three different kinds of deep learning models (VGG16, InceptionV3, and MobileNet) using ten different classes of tomato. The custom CNN model was trained using 1400 images of tomato leaves from 10 different classes, and then it was verified with 300 images from each class. Each category in the testing set comprised a total of 100 images. The custom CNN model achieved an accuracy rate of 98.40%.
Agarwal et al. [20] developed a CNN-based disease identification model for tomato crops. In the proposed CNN-based architecture, there were three convolution layers, followed by a max-pooling layer and a configurable number of filter layers. The leaf data for tomatoes were taken from the dataset provided by PlantVillage. Within the collection, one class only contained healthy images, and nine classes were dedicated to various illnesses. The model’s average testing accuracy was 91.20%. Support vector machine (SVM), convolutional attention module (CBAM), CNN, and two phases of transfer learning were used in a hybrid system that was described in [21]. This system was designed to categorize ten illnesses that can be found in tomato leaf tissue. The leaf images for tomatoes come from the dataset maintained by PlantVillage. The accuracy of the testing performed on the classification model was 97.20%.
Mim et al. [22] designed a customized CNN architecture for the detection of diseases that affect tomato leaves. This dataset consists of 6000 images and includes 5 distinct diseases that may affect tomato leaves and a healthy condition. The accuracy of classification achieved by the custom CNN model was 96.55%. In [23], a restructured residual dense network was presented to diagnose tomato leaf diseases. This model takes the best aspects of dense and deep residual networks and integrates them into a single solution. As a result, the number of training process parameters decreases, increasing the computation accuracy. Additionally, the flow of information and gradients was improved. The results of experiments indicated that this model had an accuracy of 95.00%.
Ouhami et al. [24] used transfer learning in three CNN models. These models included DensNet121, DensNet161, and VGG16. There were a total of six categories in the dataset, with three categories representing harm caused by insects and three classes representing symptoms produced by cryptogamic pathogens. The accuracy of DensNet161 was 95.65%, whereas the accuracy of DensNet121 was 94.93%, and that of VGG16 was 90.58%. The authors of [25] developed a CNN architecture to efficiently detect and categorize the tomato illnesses utilizing 3000 unique tomato leaf images that were afflicted by 9 distinct diseases and 1 healthy leaf class. The prediction accuracy of the categorization model was 98.49%.
Brahimi et al. [26] categorized nine different illnesses in tomato variety using AlexNet and GoogleNet. Employing 14,828 tomato images, the accuracy rate for GoogleNet was 99.185%, and a precision rate of 98.529%, a recall rate of 98.532%, and an F1-score of 98.518% were observed. In [27], the authors compared the VGGNet, LeNet, ResNet50, and Xception models for tomato leaf disease detection. All the networks were trained using 14,903 images and included 10 distinct diseases. The VGGNet model revealed a test accuracy of 99.25%. The authors of [28] compared four CNN models (Xception, NasNetMobile, MobileNetV2, and MobileNetV3) for ten tomato leaf disease detection categories. They used 18,215 tomato images from the Plantvillage dataset and increased the whole dataset 6 times, so the augmented set consisted of 109,290 images. The Xception model reached an accuracy of 100.00%, but from the confusion matrix, the 100% identification results were achieved in one of the ten tomato categories in the test data set.
In [29], the authors compared the InceptionV3, GoogleNet, AlexNet, ResNet50, and ResNet18 models for ten distinct diseases of tomato detection. All networks were trained to utilize 18,160 images from the Plantvillage dataset. The GoogleNet model reached an accuracy of 99.39%, but from the confusion matrix, the 100% identification results were achieved in three of the ten tomato categories in the test data set.
In Table 1, a detailed comparison of the categorization systems listed above is included, as well as an analysis of each system in terms of the algorithm used and the accuracy gained. In our work, the initial collection included 18,160 images of tomato leaves, and by augmenting the data only in the training dataset, it became 76,995 images. None of the previous works include such a large number of tomato leaf images, and unlike previous studies, we achieved 100% identification results in six of the ten tomato categories in the test dataset, based on the results of our experiments.
Thus, in this study, a hybrid CNN classification strategy was developed for the diagnosis of tomato diseases based on image evidence from a large dataset. The primary goal of our proposed architecture was to enhance the accuracy of tomato leaf identification and minimize the number of incorrect classifications. The hybrid CNN architecture was trained and tested using image data containing ten different kinds of tomato diseases. The classification accuracy of the model was 99.17%. The suggested method may assist professionals working in the agricultural sector in terms of improved screening since it has a high accuracy rate.

3. Proposed System

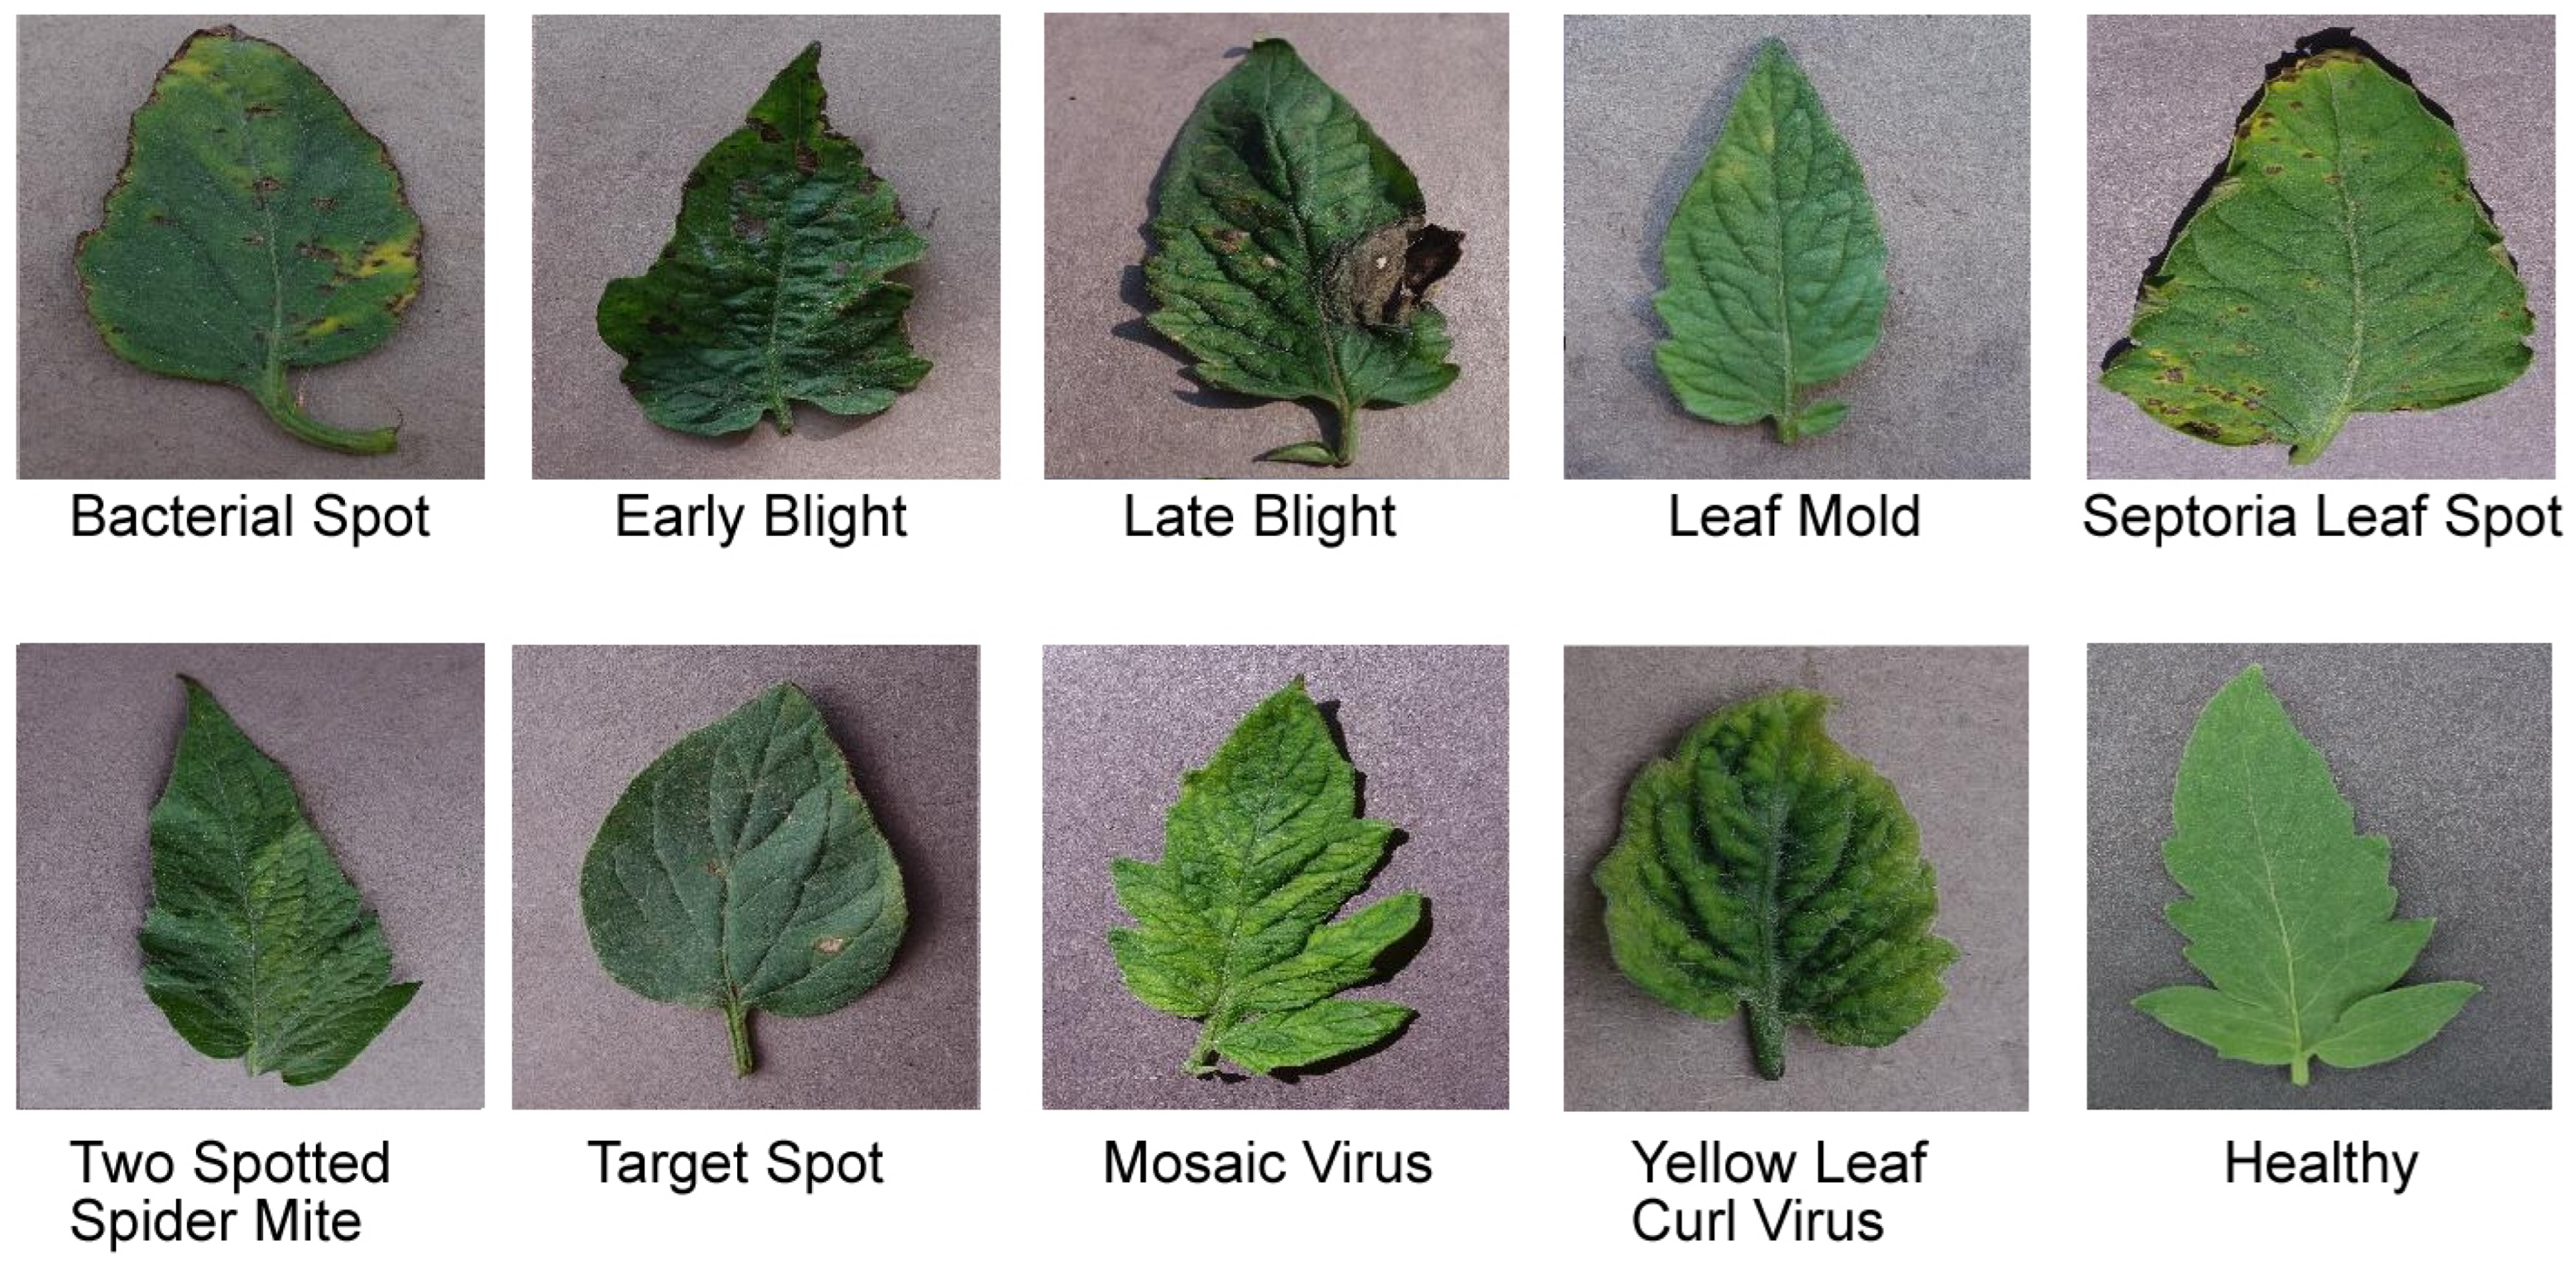
3.1. Dataset Description

The collection PlantVillage comprises 18,160 images of tomato leaves that are available to the public and represent 9 illnesses and 1 healthy condition [30]. Each of the ten types of tomatoes is represented by a single leaf in each image. Every image was shot against a plain neutral background to seem reasonably uniform. In addition, every leaf was positioned such that it would be centered on each image. No trimming or preprocessing was performed on the images; thus, they may contain display borders in the background that were irrelevant. The dataset was provided in the JPEG file format, and the resolution was 256 pixels on each side. A sample of nine different illnesses that might affect tomato leaves is shown in Figure 1, along with a healthy leaf.

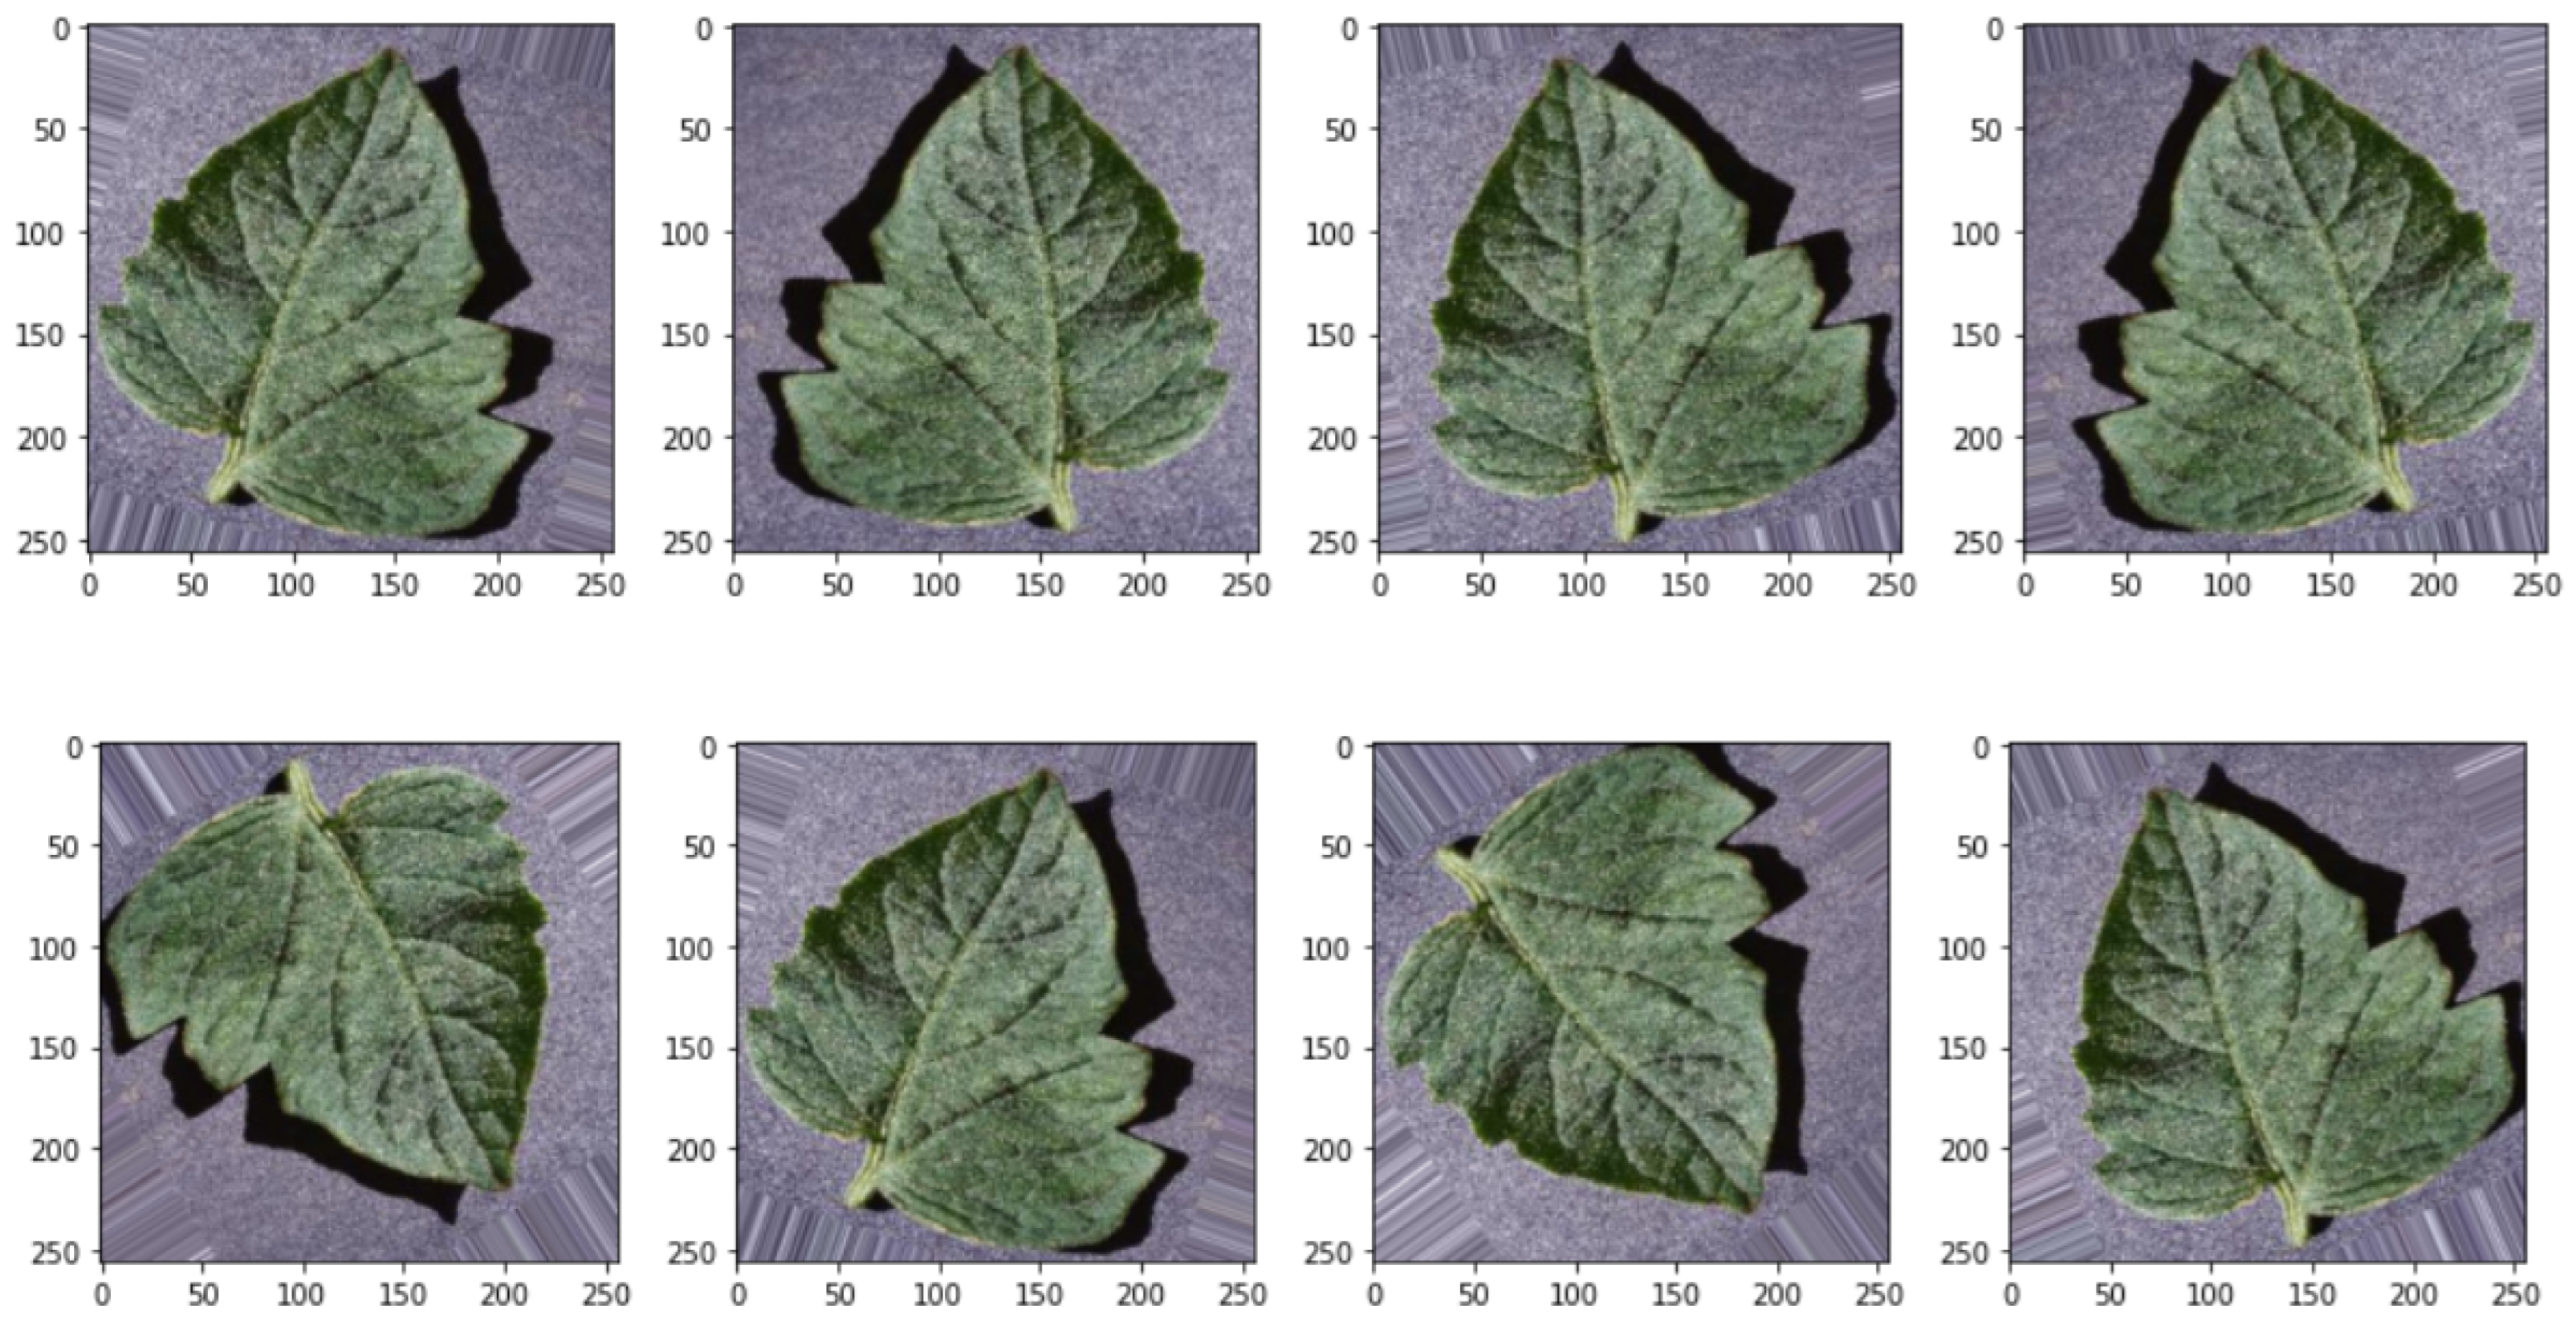
3.2. Data Augmentation

In order for DL algorithms to handily train and improve their performance, they need a large volume of data. Data augmentation is the method of increasing the size of a dataset by generating new training data from the current training data. By augmenting the data, we can create a larger and more diverse dataset, which can improve the model’s generalization ability and help it perform better on new data. Therefore, the model can train more efficiently and produce more accurate predictions if the dataset has a vast quantity of varied and well-labeled data. Conversely, the model’s poor performance is caused by having a small dataset. In addition to improving model performance, data augmentation can also help to reduce overfitting, which is a common problem in DL [31,32].
In this work, we improved the data quality using techniques such as vertical flipping, height shift, zoom, horizontal flipping, random rotation, shearing transformation, and width shift, with the ranges shown in Table 2. Figure 2 illustrates a number of different applications of data enhancement applied to the training dataset.

3.3. Split Dataset

In deep learning, the ratio of a dataset’s training, validation, and test sets is determined by the size and nature of the dataset. A typical split ratio is 90/10, in which 90% of the data are used for training/validation and 10% for testing. Out of the 90% of data used for training/validation, 80% were used for training and 10% for validation. This ratio is frequently employed when the dataset is relatively large, and there are sufficient data to effectively train the model while still leaving sufficient data for validation and testing. Thus, the larger the number of input images used during the training process, the better the learning of the model [33].
A training dataset is a collection of data utilized to train a CNN. The model is trained on a large volume of labeled data, which are then used to train the model to make predictions on new, unused data in order to improve the model’s predictive accuracy. It is essential to employ a high-quality, diverse dataset representative of the data that the model will encounter in the real world, as the quality of the training dataset is crucial to the model’s performance.
A validation dataset is a collection of data used to evaluate the performance of a CNN during training. The model is evaluated on a validation dataset to determine how well it can generalize to new, unused data. The training dataset is larger than the validation dataset. It is utilized to tune the model’s hyperparameters, learning rate, and the number of hidden layers to enhance its performance on the validation dataset. Using a validation dataset, the model can be trained to optimize its performance on new data instead of merely memorizing the training dataset.
A testing dataset is a collection of data used to evaluate a CNN after training. The testing dataset is distinct from the training and validation datasets and is used to evaluate the model’s performance on new, unused data. The testing dataset provides an objective evaluation of the performance of the model. It is used to compare the performance of various models or variants of the same model.
The training dataset was the only one to which post-split data augmentation techniques were applied. After augmentation, the size of the training images was expanded 5 times. Thus, the original collection comprised 18,160 images of tomato leaves and, with data augmentation, it became 76,995 images. An overview of the tomato dataset is shown in Table 3.

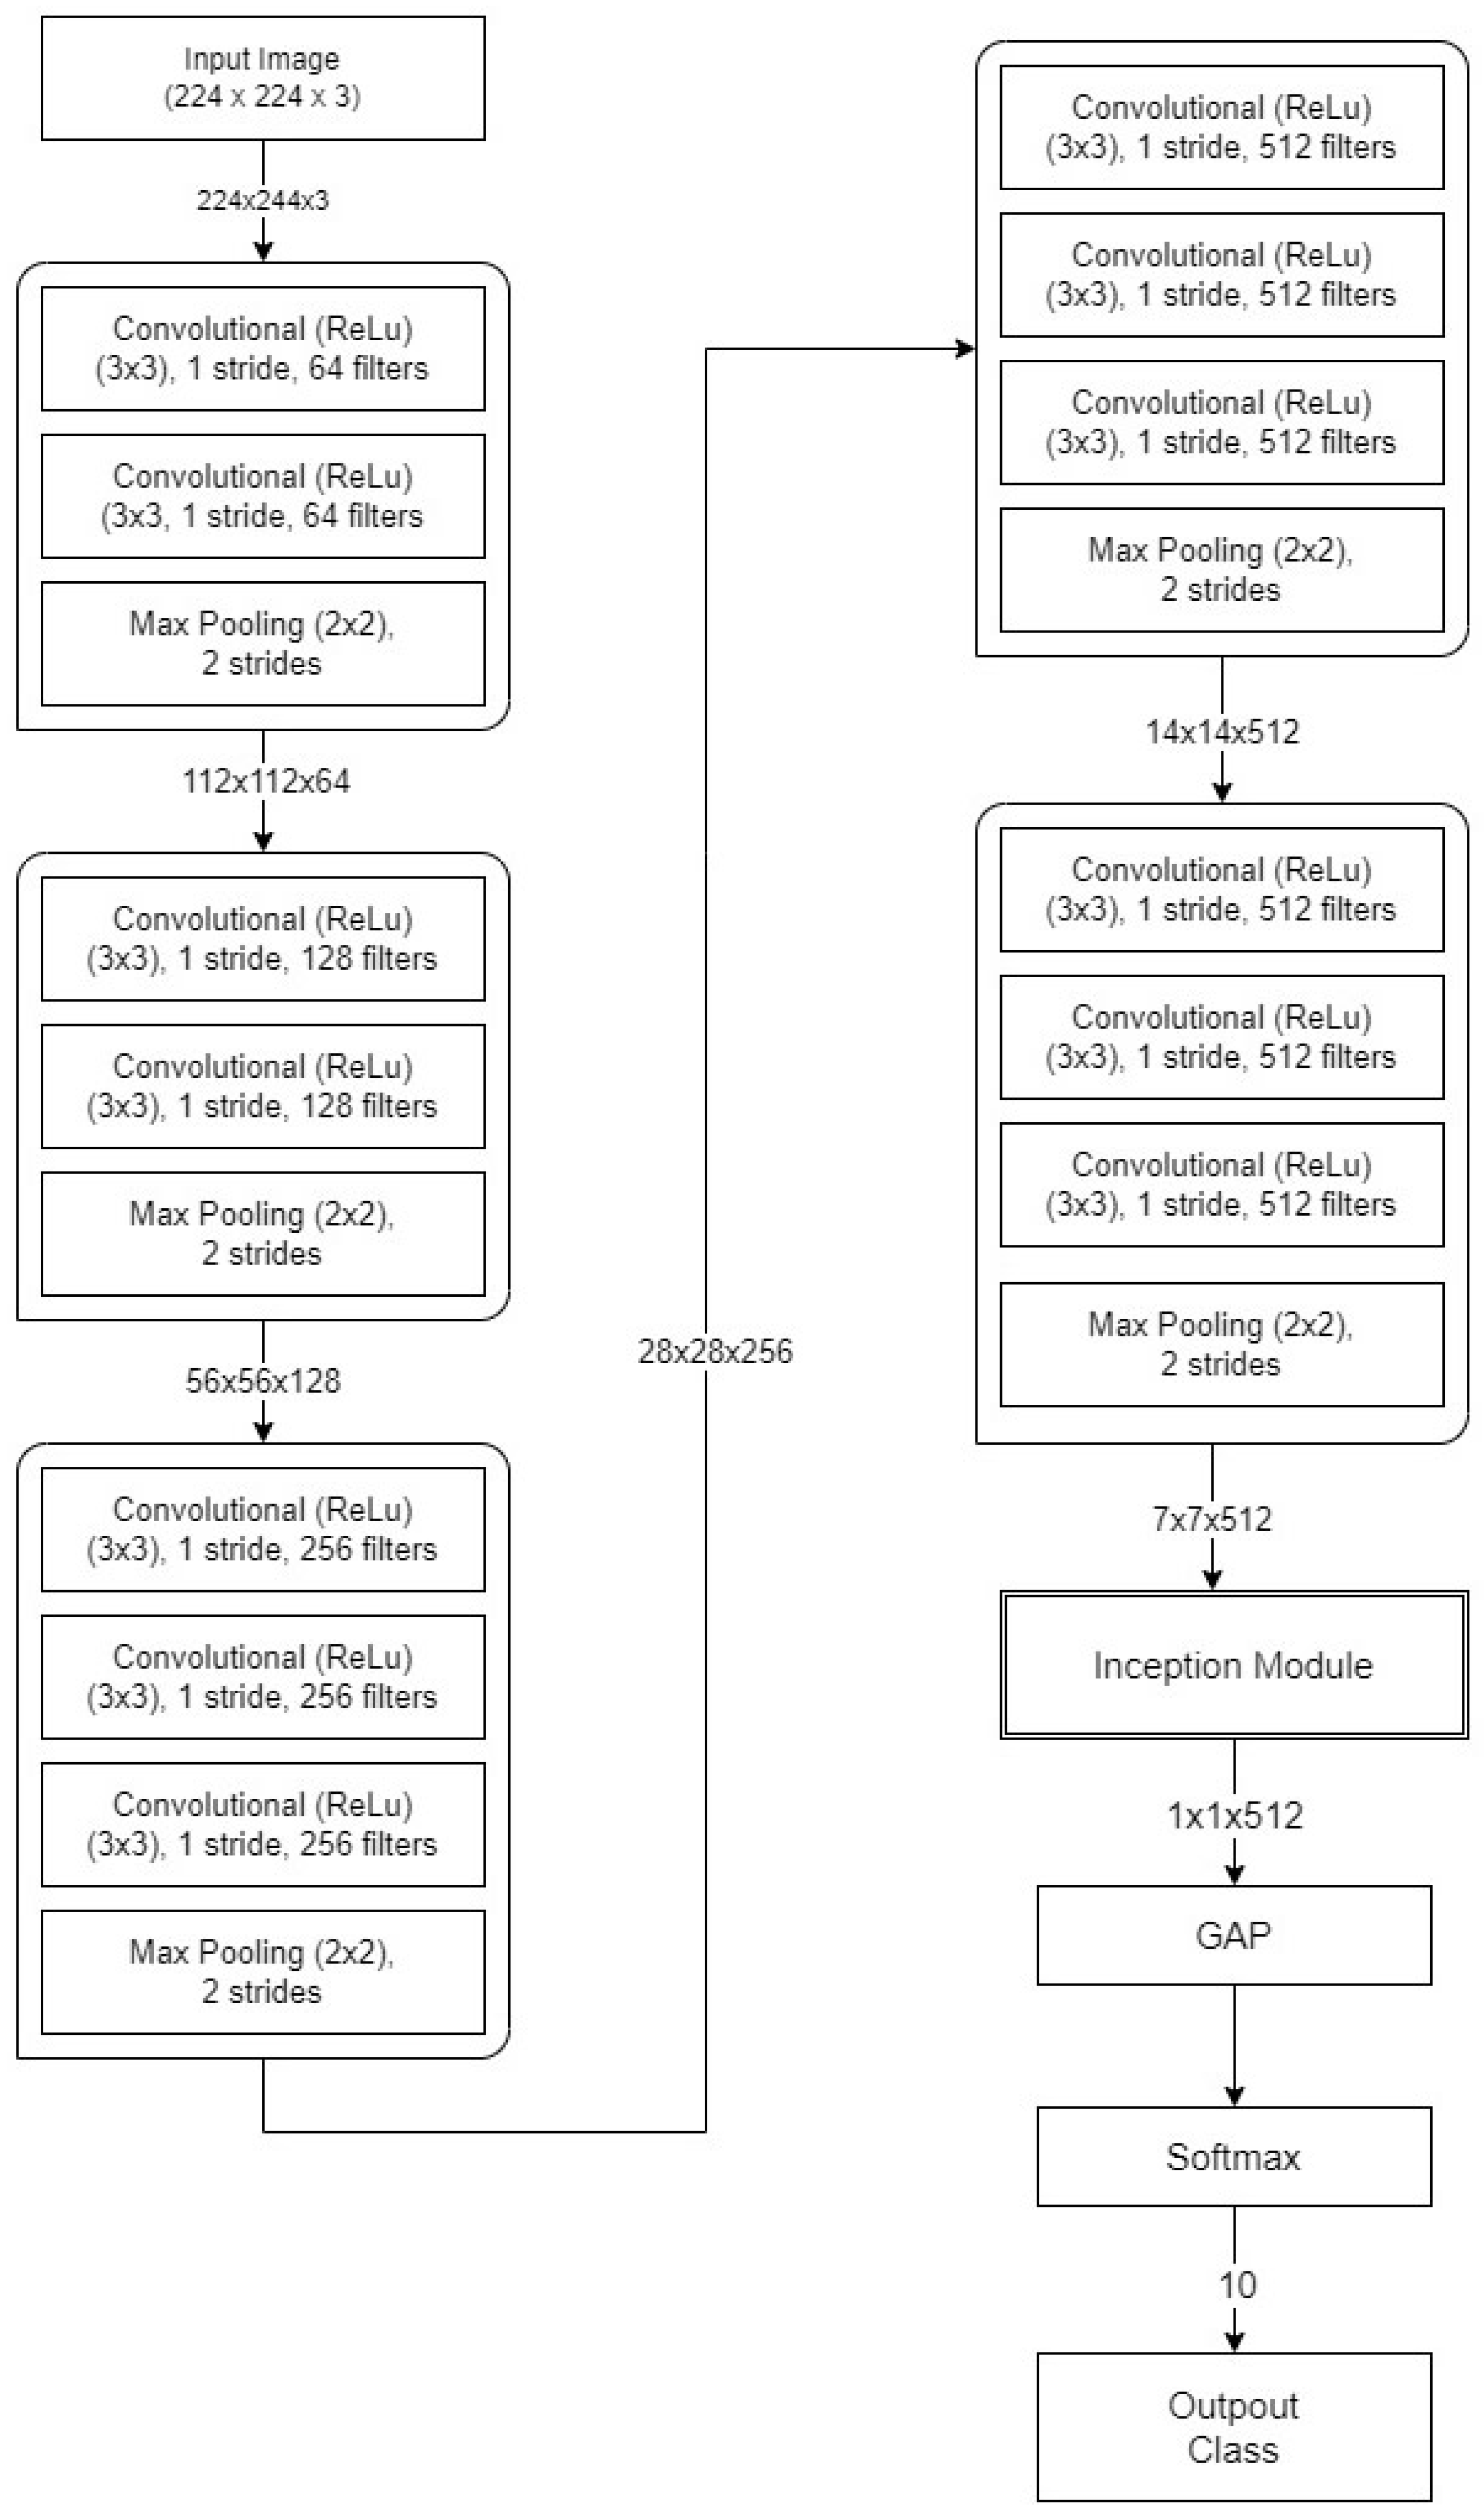
3.4. Hybrid CNN Model for Tomato Crop Disease

In order to differentiate between the ten unique illnesses that might affect tomatoes, we developed a hybrid CNN model that is both effective and practical. Combining the VGG blocks with the inception module resulted in the most advanced state-of-the-art CNN model. Growing the scale of a deep neural network is the quickest and easiest way to enhance the performance of these kinds of systems.
The VGG provides powerful and accurate classification capabilities. The dimensions of the input image were 224 × 224 × 3 . The first VGG block had 64 filters and outputted a feature map of size 224 × 224 × 64 , and the output shape was 112 × 112 × 64 . The second VGG block had 128 filters and outputted a feature map of size 112 × 112 × 128 , and the output shape was 56 × 56 × 28 . The third VGG block had 256 filters and outputted a feature map of size 56 × 56 × 256 , and the output shape was 28 × 28 × 256 . The fourth VGG block had 512 filters and outputted a feature map of size 28 × 28 × 512 , and the output shape was 14 × 14 × 512 . The fifth VGG block had 512 filters and outputted a feature map of size 14 × 14 × 512 , and the output shape was 7 × 7 × 512 .
In addition, the inception module has shown its usefulness for implementation in GoogleNet and has been proven to accomplish remarkable and unachievable outcomes. Inception modules have four parallel convolutional and pooling layers that are designed to capture various spatial scales. These layers are designed to work in conjunction with one another. As a result of this, we were able to improve the capacity of the newly developed hybrid network to extract features by including an inception module into the conventional VGGNet.
The hybrid CNN model for tomato crop disease includes the following components: 13 convolutional layers for feature extraction, each with a size of 3 × 3 ; 5 max-pooling layers, each with a size of 2 × 2 ; an inception module; a global average pooling layer (GAP); and the softmax activation function for classification. After each convolutional layer, there was a ReLU layer, which acted as an activation function for the model. The mathematical computation of the ReLU activation function is shown in Equation (1). The final layer contained one feature map for each matched category of the classification job that was constructed using global average pooling.
ReLU ( z ) = 0 , if z < 0 z , if z 0
One advantage of using global average pooling is that it is better suited to the convolution structure that exists between feature maps and categories. Finally, the softmax function was used while dealing with multiclass classification issues and trying to forecast output images. Equation (2) depicts the mathematical computation of the softmax activation function, where zi represents input data, and k is the number of categories.
Softmax z i = e z i y = 1 k e z y
The inception module diagram is shown in Figure 3, and the hybrid network diagram is presented in Figure 4.

3.5. Implementation Specification

All the experiments were conducted using a GPU (NVIDIA GTX 1070 with 8GB RAM). Python 3, the Keras package, CUDA, Matplotlib, and CuDNN were the primary libraries used in the process of implementing the hybrid CNN model, as well as all of the models that were compared. The values of the training settings were set to enable the model to effectively generalize new data, thus producing accurate forecasts based on test data. All CNN models were optimized using an Adam [34] optimizer with the learning rate set at 0.0001, and the epoch was set at 30. The categorical cross-entropy was used to compute the loss function of all of the models. Table 4 outlines the particular training settings in all of the models.
Adam is an established algorithm for optimization. It is an extension of the gradient descent optimization algorithm, a popular optimization strategy used while training DL models. It is also computationally effective, which is one of the reasons it is such a popular option; identification tasks have been performed with its assistance on several occasions.
The batch size is used to establish the total number of samples that pass through the model before the parameters of the model may be updated. A batch size of 16 necessitates more updates to the model’s parameters, but each update will be based on a smaller sample of the data. This resulted in better stable estimations of the loss function and gradients.
Cross-entropy is a loss function, and it is well suited for identification assignments. When training a classifier, the objective is to achieve the lowest possible error between the predicted and the actual class probabilities. Because it pushes the model to be more cautious in its predictions, cross-entropy is a good option because it helps the model achieve better accuracy overall.
The number of epochs is a hyperparameter that specifies the total number of times the model is trained using the whole training dataset. The performance of the model was significantly affected by using 30 epochs.
During the training process, the learning rate is a hyperparameter that affects the size of the step at which the optimizer updates the model parameters. It is common practice to use a learning rate of 0.0001 to guarantee that the model can train efficiently and converge to a satisfactory solution.

3.6. Performance Metrics

The performance of the developed model was analyzed using the following metrics: accuracy, precision, recall, receiver operating characteristic curve (ROC), and F1-score [35]. The four evaluation metrics were calculated using Equations (3)–(6), where t p , f n , f p , t n represent the number of true positives, false negatives, false positives, and true negatives. Finally, the ROC is called the area under the curve (AUC). It indicates how well the model can differentiate between different types of data. When the AUC is higher, the model can better differentiate between the category who have the disease and those who do not.
Accuracy = t p + t n t p + f n + f p + t n × 100 %
Precision = t p t p + f p × 100 %
Recall = t p t p + f n × 100 %
F 1 - score = 2 × ( Precision × Recall ) ( Precision + Recall ) × 100 %

4. Results

The primary goal of our proposed architecture was to enhance tomato leaf detection accuracy and decrease erroneous classifications. To evaluate the performance of the hybrid CNN model, we compared the accuracy/loss performance, recall, F1-score, precision, overall accuracy, and AUC.

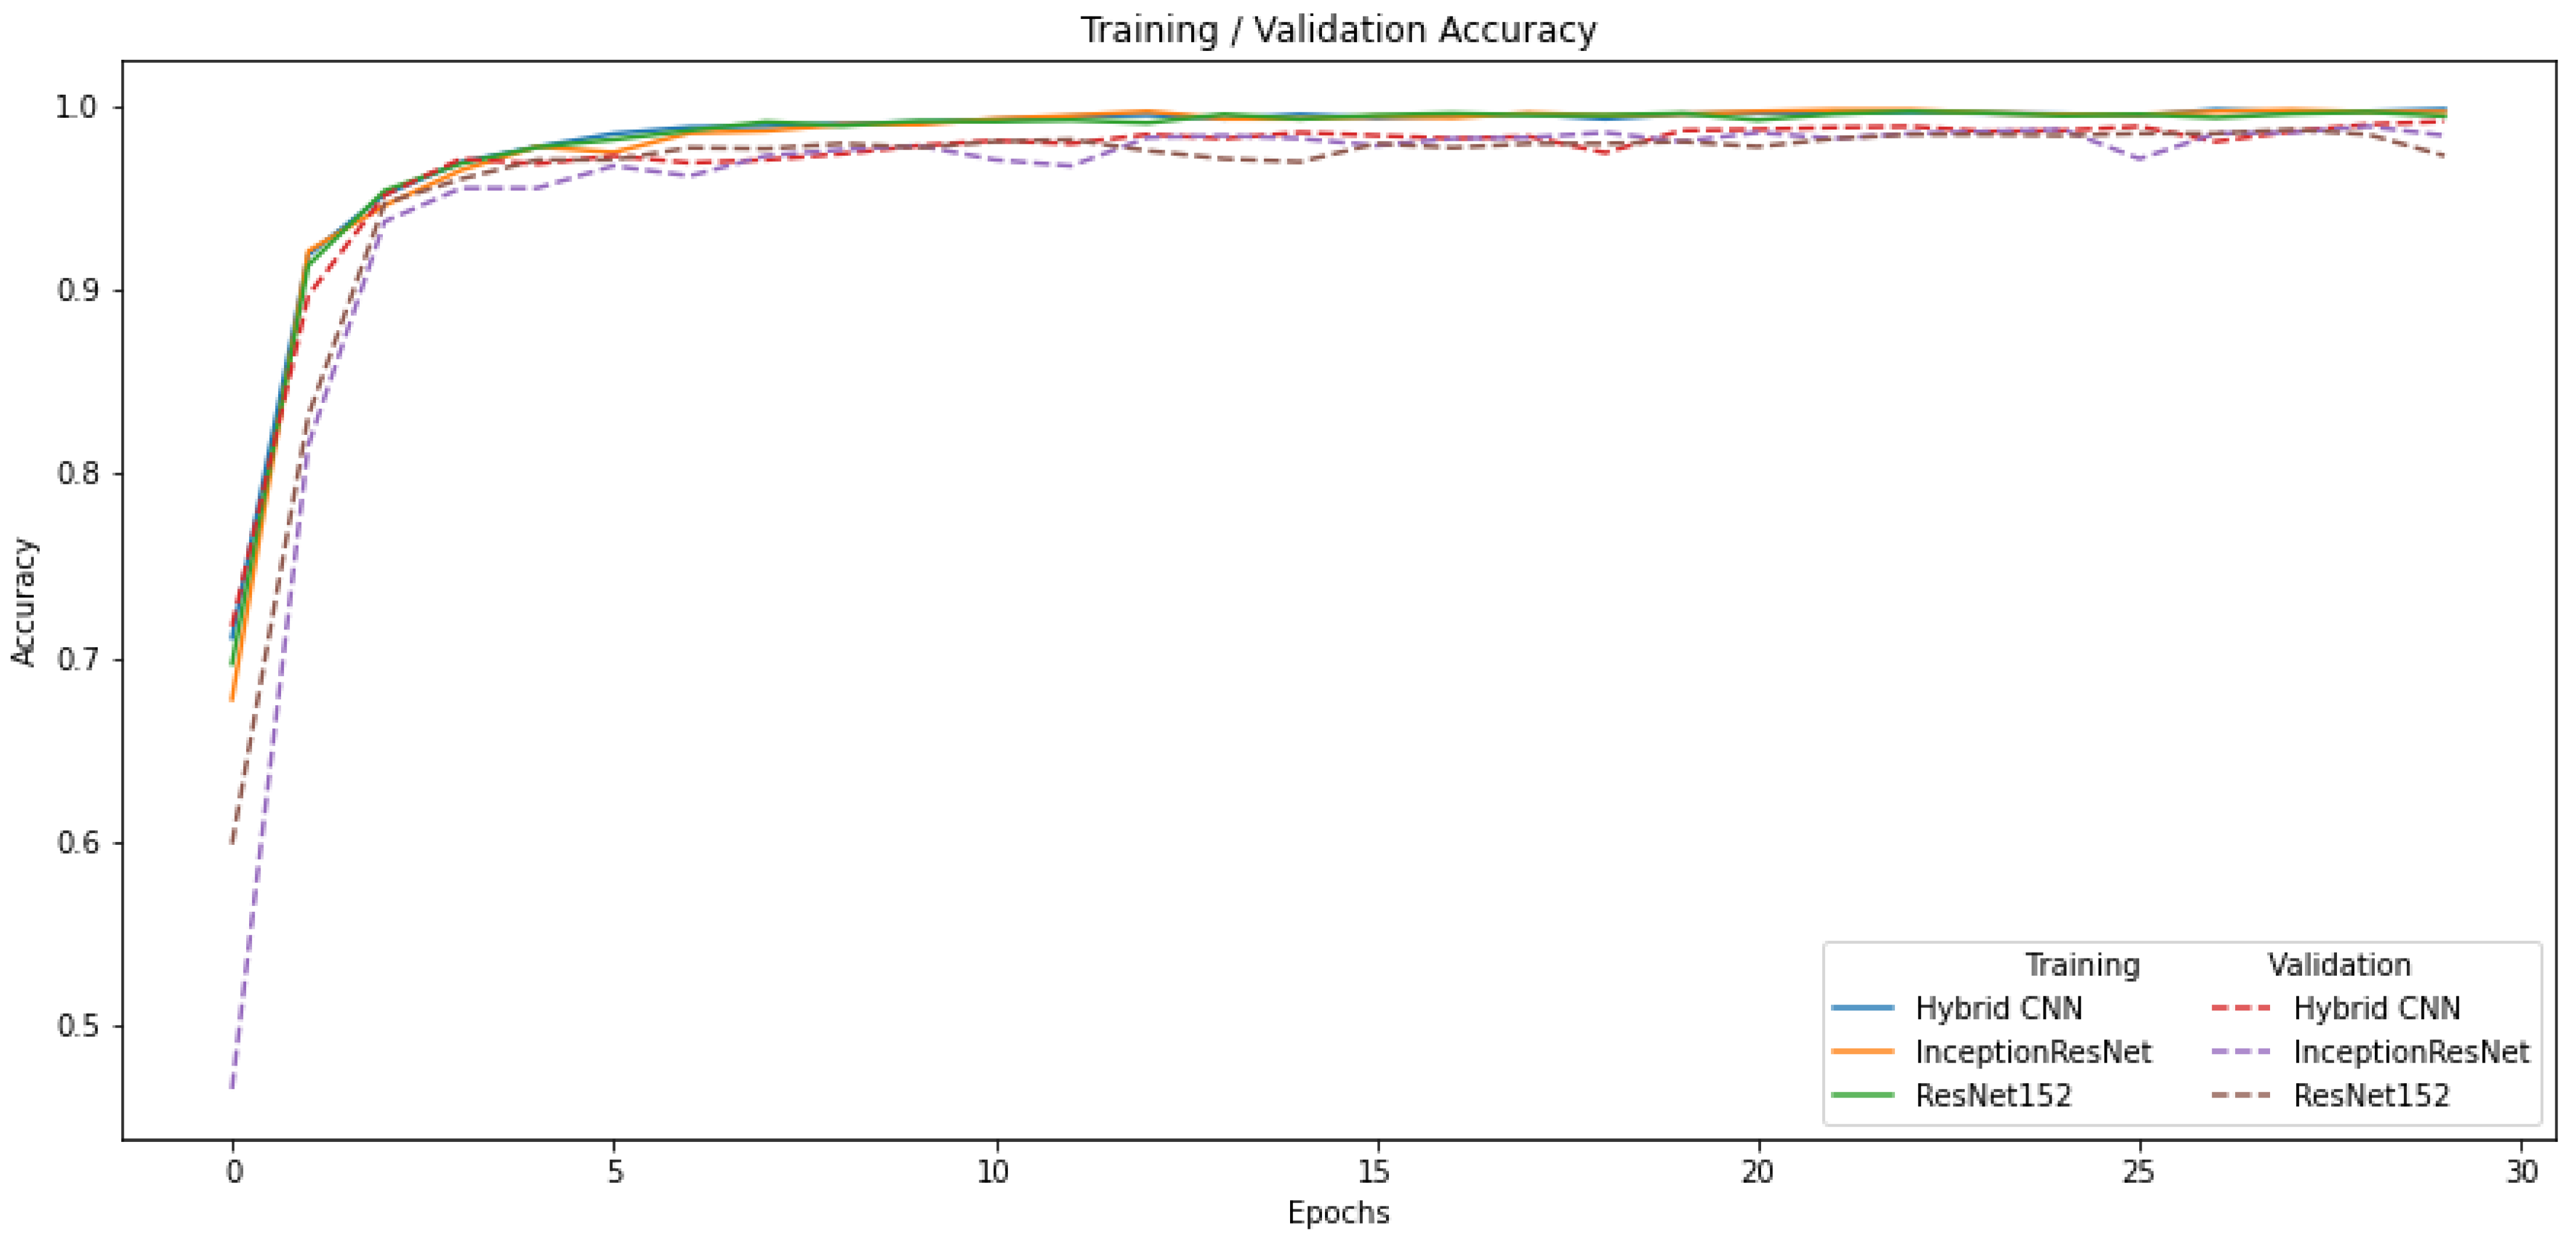
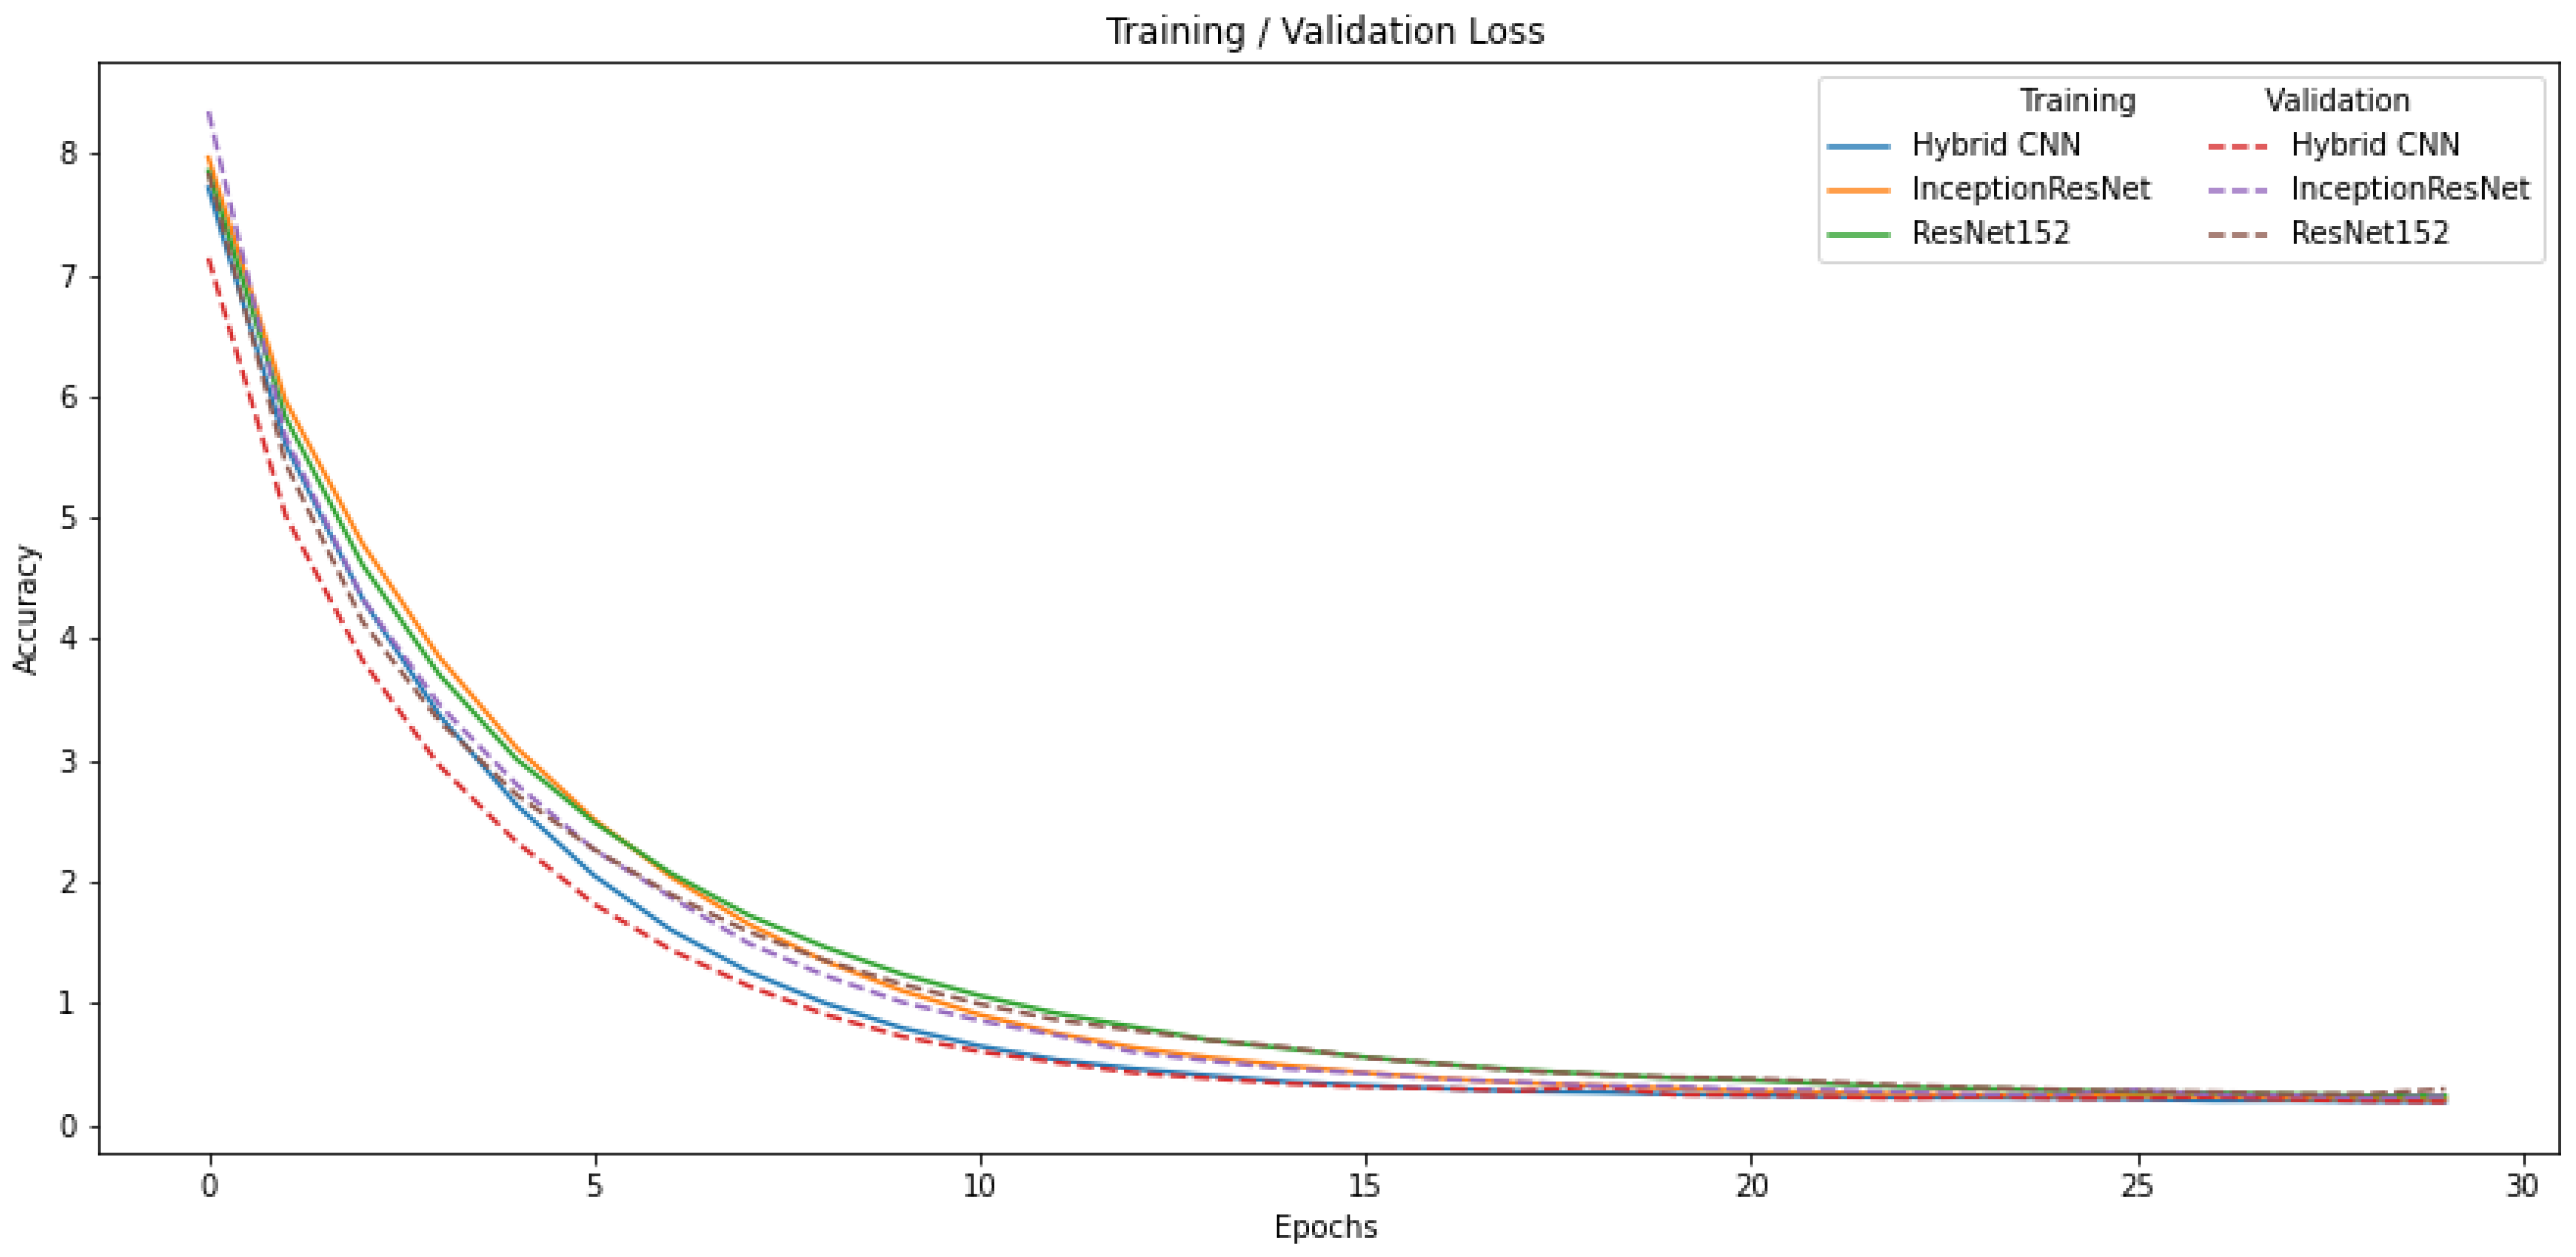
4.1. Training Loss and Accuracy

To evaluate the performance of the hybrid CNN model, we compared the InceptionResNet, and ResNet152 accuracy performance and loss performance. The network was trained by considering the parameters listed in Table 4. The hybrid CNN model achieved a training accuracy of 99.83%, a validation accuracy of 99.17%, a loss of 0.1853, and a validation loss of 0.1834. The InceptionResNet model demonstrated a training accuracy of 99.69%, a validation accuracy of 98.40%, a loss of 0.2103, and a validation loss of 0.2305. Finally, the ResNet152 model showed a training accuracy of 99.45%, a validation accuracy of 97.30%, a loss of 0.2348, and a validation loss of 0.9730. Figure 5 and Figure 6 show the change in training accuracy and loss for the three convolutional models for 30 epochs.

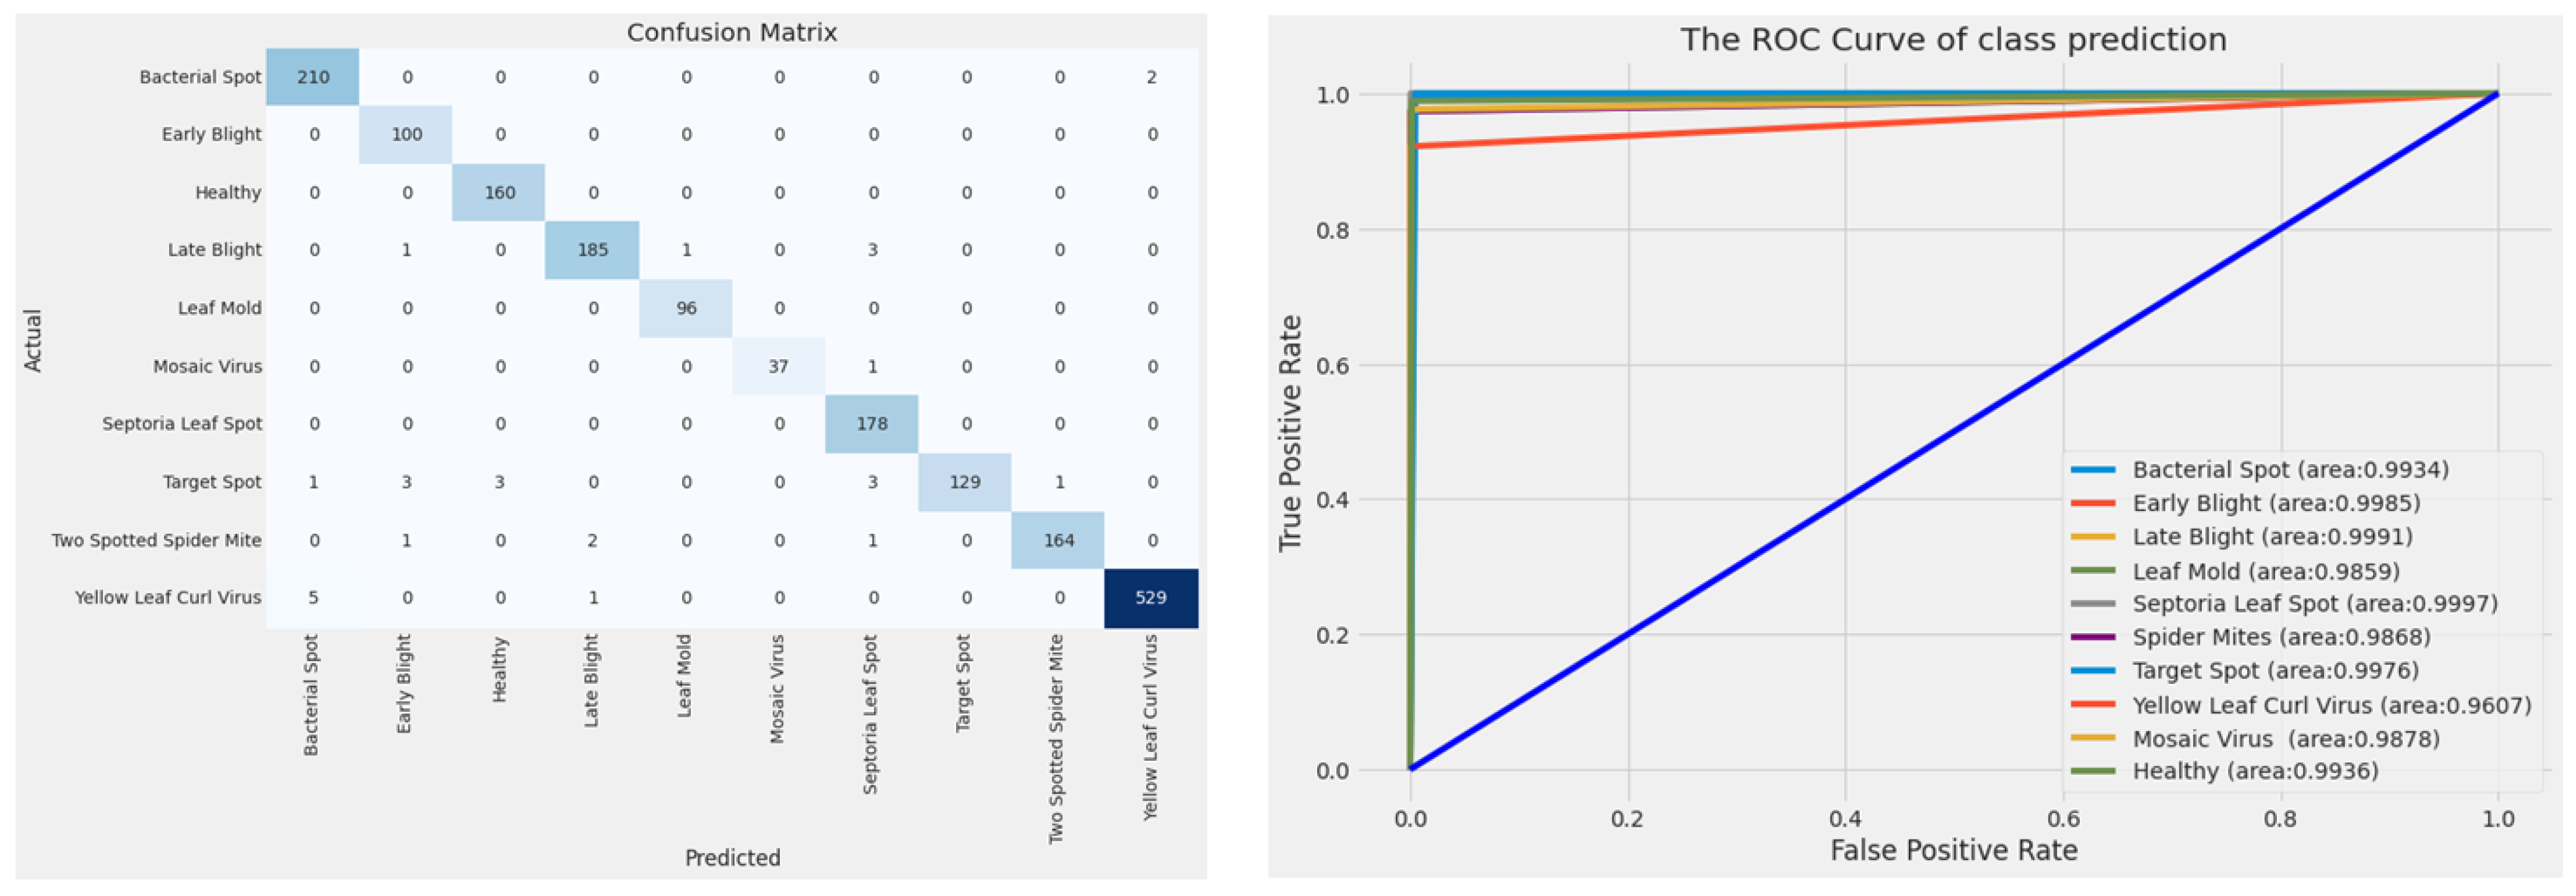
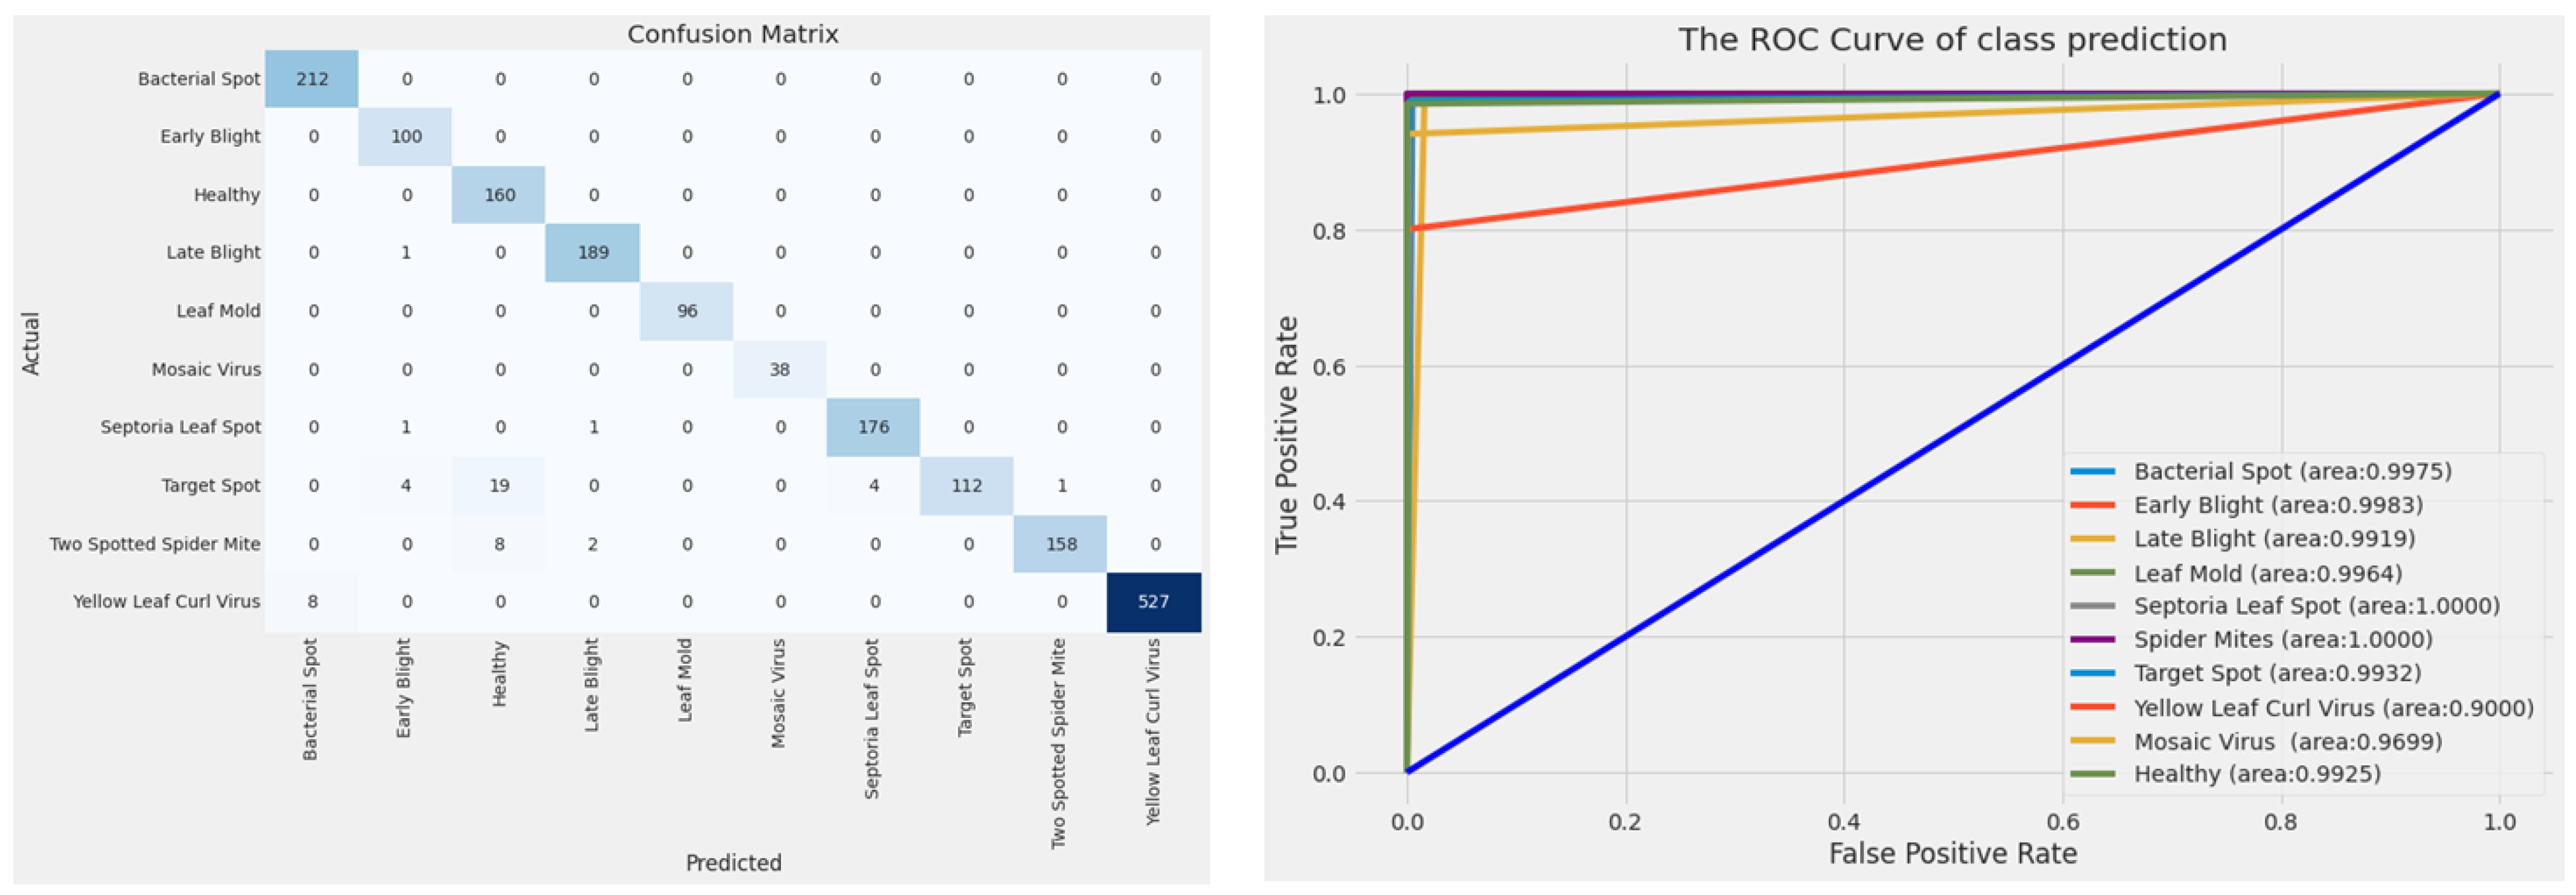
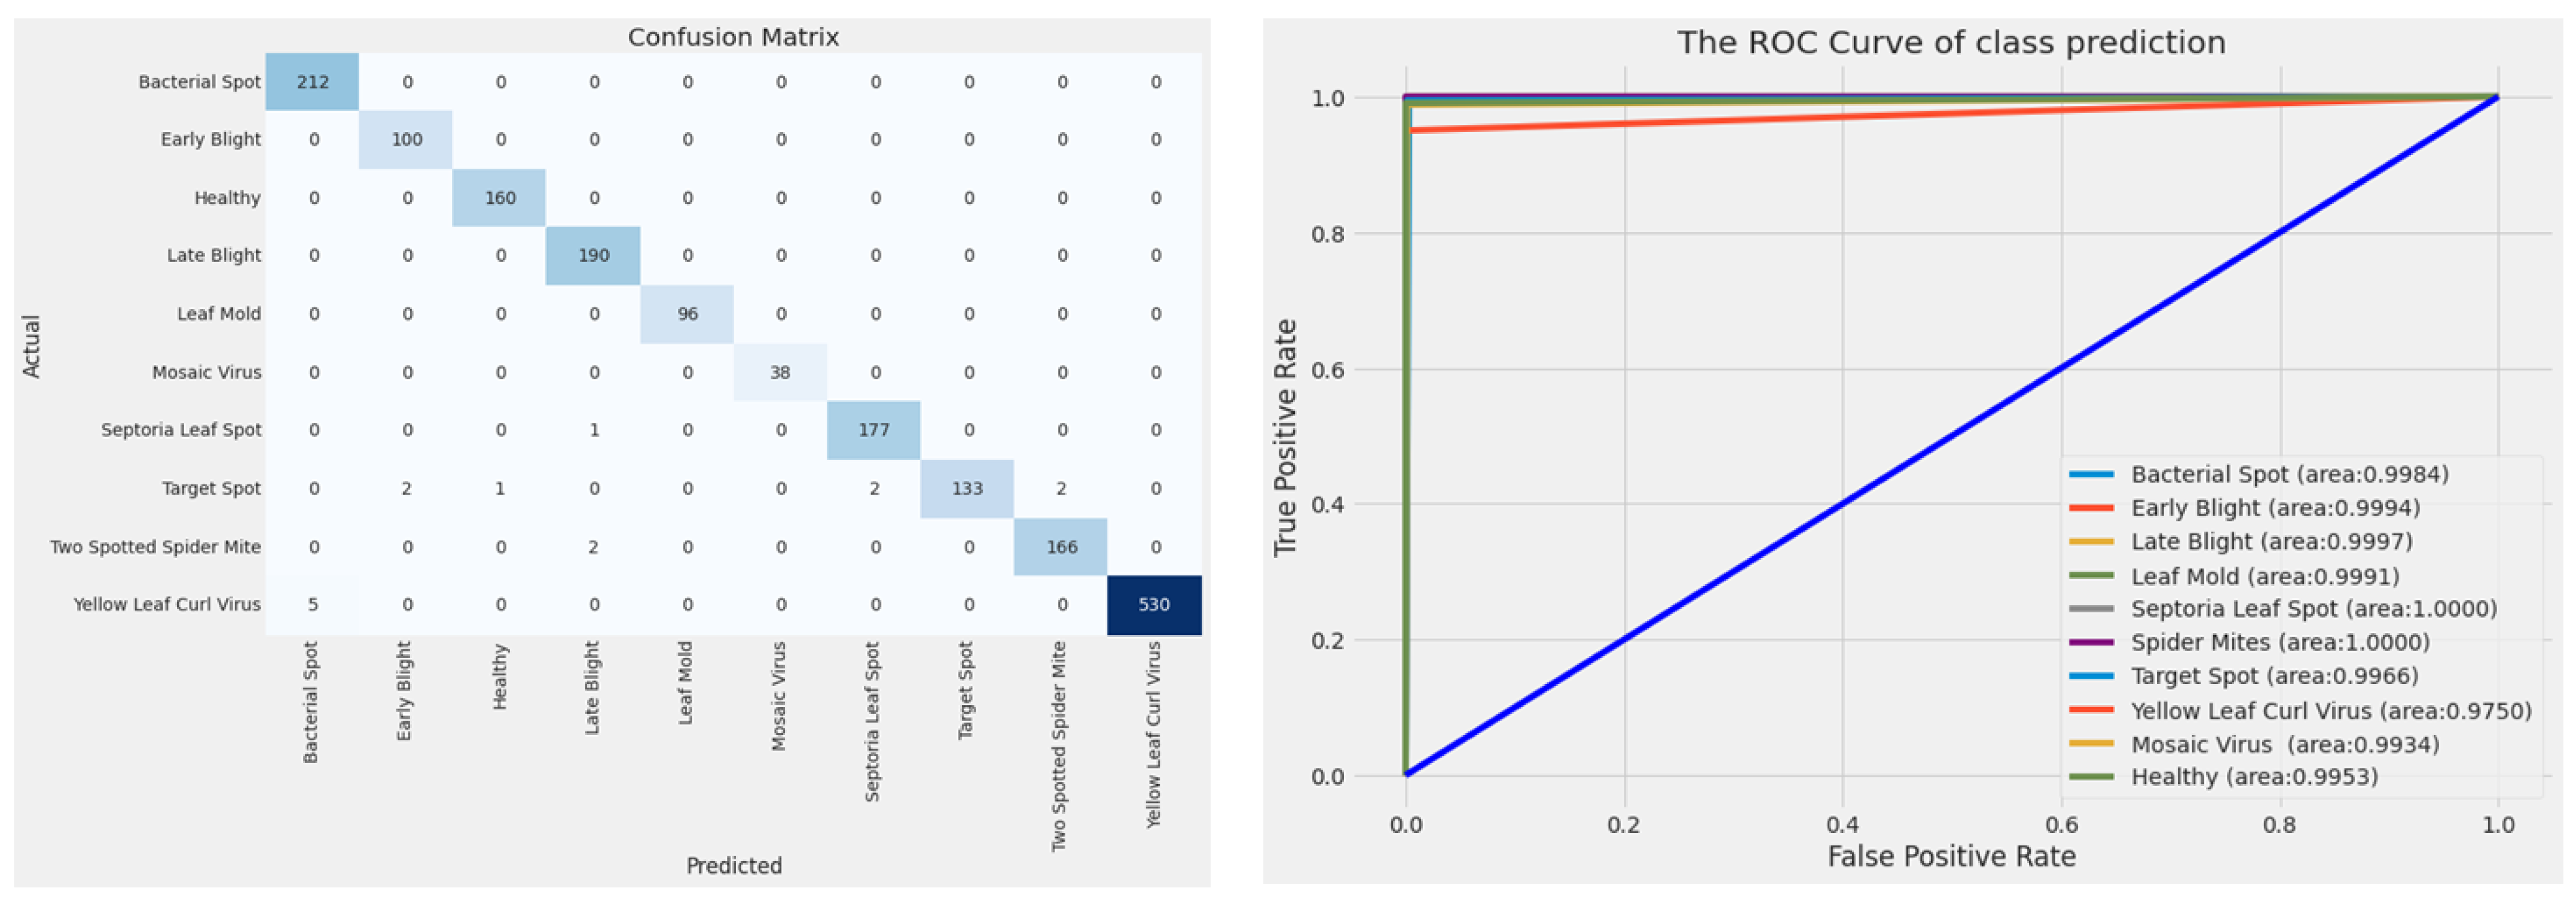
4.2. Evaluation of Models on the Test Dataset

Table 5 presents the performance measurement results in the test set to compare the various models. In addition, the results of applying each model to the various tomato crop disease scenarios included in the test set are summarized in Table 6 below.
Compared with the ResNet152 and InceptionResNet models, the suggested hybrid CNN model in this study revealed superior average testing accuracy, with an accuracy of 99.17%, under the same experimental settings as those of ResNet152 and InceptionResNet. At the same time, the rate of convergence in the presented model was the fastest among all the models. In addition, the model was stable, and the variance in loss performance had a limited range. The results in Table 6 reveal that the addition of the inception module yielded much better outcomes for the model. In Figure 7, Figure 8 and Figure 9, we present the confusion matrix and ROC curve plots for the three models.
It can be seen from Figure 9 that the proposed hybrid CNN model showed identification results that were 100% accurate in six out of ten categories. This is because the diseases that fall into these categories have unique symptoms and characteristics compared with the other categories.
As shown in Figure 10, the identified categories for most of the tomato plant images corresponded to their actual kinds. For instance, the proper disease for the image in Figure 10a was accurately diagnosed as a "bacterial spot” with a probability greater than 99.30%. Similarly, the proposed method correctly identified each sample in Figure 10b. On the other hand, inconsistent lighting conditions, such as shadowing in the images, affected the feature extraction. Thus, they could lead to inaccurate classifications of tomato diseases, as shown in Figure 10c. According to the results, it can be concluded that the suggested hybrid network is beneficial in improving the accuracy of tomato leaf identification.

5. Conclusions and Future Work

Tomato plants are vulnerable to a broad number of diseases, each of which, if allowed to develop further, has the potential to cause significant damage to the plant if it is permitted to continue. It is impossible to exaggerate how important it is to arrive at a diagnosis as promptly and correctly as is humanly feasible. The objective of this work was to propose a hybrid deep convolutional neural network as a diagnostic tool for a variety of diseases that may impact tomato leaf tissue. This hybrid diagnostic instrument revealed an accuracy of 99.17%, a recall of 99.23%, a precision of 99.13%, and an F1-score of 99.17%. We believe the presented approach provides a potential solution that will be of significant value to the field of agriculture. Consequently, future work that further builds this hybrid network will facilitate the improvement in the efficiency of the categorization model, thus leading to further overall improvement.

Author Contributions

Conceptualization, M.V.S. and T.S.; formal analysis, M.V.S., T.S. and A.S.; investigation, M.V.S., T.S. and A.S.; methodology, M.V.S. and T.S.; project administration, M.V.S. and T.S.; resources, A.S.; software, M.V.S. and T.S.; supervision, M.D.; validation, A.S.; visualization, A.S.; writing—original draft preparation, M.V.S. and T.S.; writing—review and editing, M.D. All authors were informed about each step of manuscript processing including submission, revision, revision reminder, etc., via emails from our system or assigned Assistant Editor. All authors have read and agreed to the published version of the manuscript.

Funding

This research received no external funding.

Institutional Review Board Statement

Not applicable.

Informed Consent Statement

Not applicable.

Data Availability Statement

This paper utilizes the PlantVillage dataset, which is fully available in [30].

Conflicts of Interest

The authors declare no conflict of interest.

Abbreviations

The following abbreviations are used in this manuscript:
AIArtificial Intelligence
AUCArea Under the Curve
CBAMConvolutional Attention Module
CNNConvolutional Neural Network
DLDeep learning
FAOFood and Agriculture Organization of the United Nations
MDPIMultidisciplinary Digital Publishing Institute
ROCReceiver Operating Characteristic Curve
SVMSupport Vector Machine
VGGVisual Geometry Group

References

  1. Salehi, B.; Sharifi-Rad, R.; Sharopov, F.; Namiesnik, J.; Roointan, A.; Kamle, M.; Kumar, P.; Martins, N.; Sharifi-Rad, J. Beneficial effects and potential risks of tomato consumption for human health: An overview. Nutrition 2019, 62, 201–208. [Google Scholar] [CrossRef] [PubMed]
  2. Liu, Y.; Chen, H.; Chen, W.; Zhong, Q.; Zhang, G.; Chen, W. Beneficial effects of tomato juice fermented by Lactobacillus plantarum and Lactobacillus casei: Antioxidation, antimicrobial effect, and volatile profiles. Molecules 2018, 23, 2366. [Google Scholar] [CrossRef] [PubMed] [Green Version]
  3. Liu, J.; Wang, X. Tomato diseases and pests detection based on improved Yolo V3 convolutional neural network. Front. Plant Sci. 2020, 11, 898. [Google Scholar] [CrossRef] [PubMed]
  4. Gould, W.A. Tomato Production, Processing and Technology; Elsevier: Amsterdam, The Netherlands, 2013. [Google Scholar]
  5. Barbedo, J.G. Factors influencing the use of deep learning for plant disease recognition. Biosyst. Eng. 2018, 172, 84–91. [Google Scholar] [CrossRef]
  6. Tatas, K.; Al-Zoubi, A.; Christofides, N.; Zannettis, C.; Chrysostomou, M.; Panteli, S.; Antoniou, A. Reliable IoT-Based Monitoring and Control of Hydroponic Systems. Technologies 2022, 10, 26. [Google Scholar] [CrossRef]
  7. Sujatha, R.; Chatterjee, J.M.; Jhanjhi, N.; Brohi, S.N. Performance of deep learning vs. machine learning in plant leaf disease detection. Microprocess. Microsyst. 2021, 80, 103615. [Google Scholar] [CrossRef]
  8. Aboneh, T.; Rorissa, A.; Srinivasagan, R.; Gemechu, A. Computer Vision Framework for Wheat Disease Identification and Classification Using Jetson GPU Infrastructure. Technologies 2021, 9, 47. [Google Scholar] [CrossRef]
  9. Waldamichael, F.G.; Debelee, T.G.; Schwenker, F.; Ayano, Y.M.; Kebede, S.R. Machine Learning in Cereal Crops Disease Detection: A Review. Algorithms 2022, 15, 75. [Google Scholar] [CrossRef]
  10. Benos, L.; Tagarakis, A.C.; Dolias, G.; Berruto, R.; Kateris, D.; Bochtis, D. Machine learning in agriculture: A comprehensive updated review. Sensors 2021, 21, 3758. [Google Scholar] [CrossRef]
  11. Ojo, M.O.; Zahid, A. Deep Learning in Controlled Environment Agriculture: A Review of Recent Advancements, Challenges and Prospects. Sensors 2022, 22, 7965. [Google Scholar] [CrossRef]
  12. Dhaka, V.S.; Meena, S.V.; Rani, G.; Sinwar, D.; Ijaz, M.F.; Woźniak, M. A survey of deep convolutional neural networks applied for prediction of plant leaf diseases. Sensors 2021, 21, 4749. [Google Scholar] [CrossRef] [PubMed]
  13. Sanida, T.; Sideris, A.; Tsiktsiris, D.; Dasygenis, M. Lightweight neural network for COVID-19 detection from chest X-ray images implemented on an embedded system. Technologies 2022, 10, 37. [Google Scholar] [CrossRef]
  14. Alom, M.Z.; Taha, T.M.; Yakopcic, C.; Westberg, S.; Sidike, P.; Nasrin, M.S.; Hasan, M.; Van Essen, B.C.; Awwal, A.A.; Asari, V.K. A state-of-the-art survey on deep learning theory and architectures. Electronics 2019, 8, 292. [Google Scholar] [CrossRef] [Green Version]
  15. Sanida, T.; Sideris, A.; Chatzisavvas, A.; Dossis, M.; Dasygenis, M. Radiography Images with Transfer Learning on Embedded System. In Proceedings of the 2022 7th South-East Europe Design Automation, Computer Engineering, Computer Networks and Social Media Conference (SEEDA-CECNSM), Ioannina, Greece, 23–25 September 2022; pp. 1–4. [Google Scholar] [CrossRef]
  16. Simonyan, K.; Zisserman, A. Very deep convolutional networks for large-scale image recognition. arXiv 2014, arXiv:1409.1556. [Google Scholar] [CrossRef]
  17. Szegedy, C.; Vanhoucke, V.; Ioffe, S.; Shlens, J.; Wojna, Z. Rethinking the inception architecture for computer vision. In Proceedings of the IEEE Conference on Computer Vision and Pattern Recognition, Las Vegas, NV, USA, 27–30 June 2016; pp. 2818–2826. [Google Scholar] [CrossRef] [Green Version]
  18. Rangarajan, A.K.; Purushothaman, R.; Ramesh, A. Tomato crop disease classification using pre-trained deep learning algorithm. Procedia Comput. Sci. 2018, 133, 1040–1047. [Google Scholar] [CrossRef]
  19. Agarwal, M.; Gupta, S.K.; Biswas, K. Development of Efficient CNN model for Tomato crop disease identification. Sustain. Comput. Inform. Syst. 2020, 28, 100407. [Google Scholar] [CrossRef]
  20. Agarwal, M.; Singh, A.; Arjaria, S.; Sinha, A.; Gupta, S. ToLeD: Tomato leaf disease detection using convolution neural network. Procedia Comput. Sci. 2020, 167, 293–301. [Google Scholar] [CrossRef]
  21. Altalak, M.; Uddin, M.A.; Alajmi, A.; Rizg, A. A Hybrid Approach for the Detection and Classification of Tomato Leaf Diseases. Appl. Sci. 2022, 12, 8182. [Google Scholar] [CrossRef]
  22. Mim, T.T.; Sheikh, M.H.; Shampa, R.A.; Reza, M.S.; Islam, M.S. Leaves diseases detection of tomato using image processing. In Proceedings of the 2019 8th International Conference System Modeling and Advancement in Research Trends (SMART), Moradabad, India, 22–23 November 2019; pp. 244–249. [Google Scholar] [CrossRef]
  23. Zhou, C.; Zhou, S.; Xing, J.; Song, J. Tomato leaf disease identification by restructured deep residual dense network. IEEE Access 2021, 9, 28822–28831. [Google Scholar] [CrossRef]
  24. Ouhami, M.; Es-Saady, Y.; Hajji, M.E.; Hafiane, A.; Canals, R.; Yassa, M.E. Deep transfer learning models for tomato disease detection. In Proceedings of the International Conference on Image and Signal Processing, Marrakesh, Morocco, 4–6 June 2020; pp. 65–73. [Google Scholar] [CrossRef]
  25. Trivedi, N.K.; Gautam, V.; Anand, A.; Aljahdali, H.M.; Villar, S.G.; Anand, D.; Goyal, N.; Kadry, S. Early detection and classification of tomato leaf disease using high-performance deep neural network. Sensors 2021, 21, 7987. [Google Scholar] [CrossRef]
  26. Brahimi, M.; Boukhalfa, K.; Moussaoui, A. Deep learning for tomato diseases: Classification and symptoms visualization. Appl. Artif. Intell. 2017, 31, 299–315. [Google Scholar] [CrossRef]
  27. Kumar, A.; Vani, M. Image based tomato leaf disease detection. In Proceedings of the 2019 10th International Conference on Computing, Communication and Networking Technologies (ICCCNT), Kanpur, India, 6–8 July 2019; pp. 1–6. [Google Scholar] [CrossRef]
  28. Gonzalez-Huitron, V.; León-Borges, J.A.; Rodriguez-Mata, A.; Amabilis-Sosa, L.E.; Ramírez-Pereda, B.; Rodriguez, H. Disease detection in tomato leaves via CNN with lightweight architectures implemented in Raspberry Pi 4. Comput. Electron. Agric. 2021, 181, 105951. [Google Scholar] [CrossRef]
  29. Maeda-Gutiérrez, V.; Galvan-Tejada, C.E.; Zanella-Calzada, L.A.; Celaya-Padilla, J.M.; Galván-Tejada, J.I.; Gamboa-Rosales, H.; Luna-Garcia, H.; Magallanes-Quintanar, R.; Guerrero Mendez, C.A.; Olvera-Olvera, C.A. Comparison of convolutional neural network architectures for classification of tomato plant diseases. Appl. Sci. 2020, 10, 1245. [Google Scholar] [CrossRef] [Green Version]
  30. Hughes, D.; Salathé, M. An open access repository of images on plant health to enable the development of mobile disease diagnostics. arXiv 2015, arXiv:1511.08060. [Google Scholar] [CrossRef]
  31. Khalifa, N.E.; Loey, M.; Mirjalili, S. A comprehensive survey of recent trends in deep learning for digital images augmentation. Artif. Intell. Rev. 2021, 55, 2351–2377. [Google Scholar] [CrossRef] [PubMed]
  32. Buslaev, A.; Iglovikov, V.I.; Khvedchenya, E.; Parinov, A.; Druzhinin, M.; Kalinin, A.A. Albumentations: Fast and flexible image augmentations. Information 2020, 11, 125. [Google Scholar] [CrossRef] [Green Version]
  33. Mohanty, S.P.; Hughes, D.P.; Salathé, M. Using deep learning for image-based plant disease detection. Front. Plant Sci. 2016, 7, 1419. [Google Scholar] [CrossRef] [Green Version]
  34. Sanida, T.; Tsiktsiris, D.; Sideris, A.; Dasygenis, M. A heterogeneous implementation for plant disease identification using deep learning. Multimed. Tools Appl. 2022, 81, 15041–15059. [Google Scholar] [CrossRef]
  35. Tharwat, A. Classification assessment methods. Appl. Comput. Inform. 2020, 17, 168–192. [Google Scholar] [CrossRef]
Figure 1. Sample images of the tomato plant from the PlantVillage collection (nine diseases and one healthy).
Technologies 11 00010 g001
Figure 2. An augmented sample in the training dataset using classical geometric transformations.
Technologies 11 00010 g002
Figure 3. Inception module diagram.
Technologies 11 00010 g003
Figure 4. Hybrid CNN model diagram with five VGG blocks, inception module, GAP, and softmax activation function for classification.
Technologies 11 00010 g004
Figure 5. Comparative training accuracy of all models.
Technologies 11 00010 g005
Figure 6. Comparative loss function on the training dataset of all models.
Technologies 11 00010 g006
Figure 7. Confusion matrix and ROC curve of InceptionResNet model on the tomato test data.
Technologies 11 00010 g007
Figure 8. Confusion matrix and ROC curve of ResNet152 model on the tomato test data.
Technologies 11 00010 g008
Figure 9. Confusion matrix and ROC curve of proposed hybrid CNN model on the tomato test data.
Technologies 11 00010 g009
Figure 10. The examples of identification results of tomato plant diseases on the test data.
Technologies 11 00010 g010
Table 1. A comparison of the several tomato crop methods.
ReferenceAlgorithmAccuracy (%)
[18]VGG16
AlexNet
97.29
97.49
[19]Modified VGG1698.40
[20]CNN model91.20
[21]CNN-SVM-CBAM97.20
[22]CNN model96.55
[23]Restructured residual dense network95.00
[24]DensNet161
DensNet121
VGG16
95.65
94.93
90.58
[25]CNN model98.49
[26]GoogleNet
AlexNet
99.18
98.66
[27]VGGNet
LeNet
ResNet50
Xception
99.25
96.27
98.65
98.13
[28]Xception
NasNetMobile
MobileNetV2
MobileNetV3
100.00
084.00
075.00
098.00
[29]InceptionV3
GoogleNet
AlexNet
ResNet50
ResNet18
98.65
99.39
98.93
99.15
99.06
Table 2. Tomato details of data augmentation in the training set.
ParameterValue
        Random rotation[+12, −12]
        Width shift[0.6, 1.1]
        Zoom[0.5, 0.9]
        Fill modeNearest
        Horizontal flipTrue
        Height shift0.15
        Shearing transformation0.25
        Vertical flipTrue
Table 3. Tomato datasets (training, validation, and testing).
CategoriesNumber
of
Original
Images
Training
Images
Training
Images
after
Augmentation
Validation
Images
Test
Images
Early Blight1000810405090100
Target Spot140411385688126140
Mosaic Virus37330215083438
Septoria Leaf Spot177114347169159178
Late Blight190915477736172190
Healthy159112886440143160
Spider Mites167613576786151168
Bacterial Spot212717248618192212
Leaf Mold95277038528696
Yellow Leaf Curl Virus5357434021,699482535
Total Images18,16014,70973,54416341817
Table 4. Training settings for all models.
ParameterValue
         OptimizerAdam
         Batch size16
         Loss functionCross-entropy
         Epochs30
         Learning rate0.0001
Table 5. Performance metrics of three models.
Performance
Metrics (%)
InceptionResNetResNet152Hybrid CNN
  Training accuracy99.6999.4599.83
  Testing accuracy98.4097.3099.17
  Precision98.2797.1999.13
  Recall98.2497.0999.23
  F1-score98.2396.9599.17
  AUC99.0398.3999.56
Table 6. Performance evaluation of three models.
ModelCategoriesPrecisionRecallF1-Score
InceptionResNetBacterial Spot0.97220.99060.9813
Healthy0.98161.00000.9907
Mosaic Virus1.00000.97370.9867
Two Spotted Spider Mites0.99390.97620.9850
Late Blight0.98400.97370.9788
Early Blight0.95241.00000.9756
Septoria Leaf Spot0.95701.00000.9780
Leaf Mold0.98971.00000.9948
Yellow Leaf Curl Virus0.99620.98880.9925
Target Spot1.00000.92140.9591
ResNet152Bacterial Spot0.96361.00000.9815
Healthy0.85561.00000.9222
Mosaic Virus1.00001.00001.0000
Two Spotted Spider Mites0.99370.94050.9664
Late Blight0.98440.99470.9895
Early Blight0.94341.00000.9709
Septoria Leaf Spot0.97780.98880.9832
Leaf Mold1.00001.00001.0000
Yellow Leaf Curl Virus1.00000.98500.9925
Target Spot1.00000.80000.8889
Hybrid CNNBacterial Spot0.97701.00000.9883
Healthy0.99381.00000.9969
Mosaic Virus1.00001.00001.0000
Two Spotted Spider Mites0.98810.98810.9881
Late Blight0.98451.00000.9922
Early Blight0.98041.00000.9901
Septoria Leaf Spot0.98880.99440.9916
Leaf Mold1.00001.00001.0000
Yellow Leaf Curl Virus1.00000.99070.9953
Target Spot1.00000.95000.9744
Disclaimer/Publisher’s Note: The statements, opinions and data contained in all publications are solely those of the individual author(s) and contributor(s) and not of MDPI and/or the editor(s). MDPI and/or the editor(s) disclaim responsibility for any injury to people or property resulting from any ideas, methods, instructions or products referred to in the content.

