
Modelling Systemic Risk in Morocco’s Banking System


Abstract
:1. Introduction
2. Literature Review
3. Materials and Methods
3.1. QRNN
3.2. VaR
3.3. CoVaR
4. Data
5. Model Selection
6. Results and Discussion
7. Conclusions
Author Contributions
Funding
Data Availability Statement
Conflicts of Interest
Appendix A


Appendix B


References
- Acharya, Viral V., Lasse H. Pedersen, Thomas Philippon, and Matthew Richardson. 2017. Measuring systemic risk. The Review of Financial Studies 30: 2–47. [Google Scholar] [CrossRef]
- Allen, Franklin, and Ana Babus. 2009. Networks in finance. In The Network Challenge: Strategy, Profit, and Risk in an Interlinked World. Westford: Prentice Hall Professional. [Google Scholar]
- AMMC. 2020. Autorité Marocaine du Marché des Capitaux Annual Report. Available online: https://www.ammc.ma/fr/rapports-annuel (accessed on 1 January 2023).
- Bernardi, Mauro, Ghislaine Gayraud, and Lea Petrella. 2013. Bayesian inference for CoVaR. arXiv arXiv:1306.2834. [Google Scholar] [CrossRef]
- Bisias, Dimitrios, Mark Flood, Andrew W. Lo, and Stavros Valavanis. 2012. A survey of systemic risk analytics. Annual Review of Financial Economics 4: 255–96. [Google Scholar] [CrossRef]
- BKAM. 2020. BANK AL-MAGHRIB (BKAM) Annual Report. Available online: https://www.bkam.ma/en/Publications-and-research/Institutional-publications/Annual-report-presented-to-his-majesty-the-king (accessed on 1 January 2023).
- Bondell, Howard D., Brian J. Reich, and Huixia Wang. 2010. Noncrossing quantile regression curve estimation. Biometrika 97: 825–38. [Google Scholar] [CrossRef]
- Brownlees, Christian T., Benjamin Remy Chabot, Eric Ghysels, and Christopher Kurz. 2015. Backtesting Systemic Risk Measures during Historical Bank Runs. Available online: https://papers.ssrn.com/sol3/papers.cfm?abstract_id=2702258 (accessed on 21 November 2022).
- Cannon, Alex J. 2011. Quantile regression neural networks: Implementation in R and application to precipitation downscaling. Computers & Geosciences 37: 1277–84. [Google Scholar] [CrossRef]
- Cao, Zhili. 2013. Multi-Covar and Shapley Value: A Systemic Risk Measure. Banque de France Working Paper. Paris: French National Bank. [Google Scholar]
- Chao, Shih-Kang, Wolfgang Karl Hardle, and Weining Wang. 2015. Quantile regression in risk calibration. In Handbook of Financial Econometrics and Statistics. New York: Springer. [Google Scholar] [CrossRef]
- Demuth, Howard B., Mark H. Beale, Orlando De Jess, and Martin T. Hagan. 2014. Neural Network Design, 2nd ed. Stillwater: Martin Hagan. [Google Scholar]
- Diebold, Francis X., and Robert S. Mariano. 2002. Comparing predictive accuracy. Journal of Business & Economic Statistics 20: 134–44. [Google Scholar] [CrossRef]
- Drehmann, Mathias, Claudio E. V. Borio, Leonardo Gambacorta, Gabriel Jimenez, and Carlos Trucharte. 2010. Countercyclical Capital Buffers: Exploring Options. Basel: Bank for International Settlements Communications. [Google Scholar] [CrossRef]
- Duan, Yuejiao, Sadok El Ghoul, Omrane Guedhami, Haoran Li, and Xinming Li. 2021. Bank systemic risk around COVID-19: A cross-country analysis. Journal of Banking & Finance 133: 106299. [Google Scholar] [CrossRef]
- Girardi, Giulio, and A. Tolga Ergün. 2013. Systemic risk measurement: Multivariate GARCH estimation of CoVaR. Journal of Banking & Finance 37: 3169–80. [Google Scholar] [CrossRef]
- González-Rivera, Gloria, Tae-Hwy Lee, and Santosh Mishra. 2004. Forecasting volatility: A reality check based on option pricing, utility function, value-at-risk, and predictive likelihood. International Journal of Forecasting 20: 629–45. [Google Scholar] [CrossRef]
- Hagan, Martin T., Howard B. Demuth, and Mark Beale. 1997. Neural Network Design. Boston: PWS Publishing Co. [Google Scholar]
- Hautsch, Nikolaus, Julia Schaumburg, and Melanie Schienle. 2015. Financial Network Systemic Risk Contributions. Review of Finance 19: 685–738. [Google Scholar] [CrossRef]
- Härdle, Wolfgang Karl, Weining Wang, and Lining Yu. 2016. Tenet: Tail-event driven network risk. Journal of Econometrics 192: 499–513. [Google Scholar] [CrossRef]
- Huber, Peter J. 1964. Robust estimation of a location parameter: Annals Mathematics Statistics. IEEE Transactions on Signal Processing 56: 2346–56. [Google Scholar] [CrossRef]
- Keilbar, Georg, and Weining Wang. 2021. Modelling systemic risk using neural network quantile regression. Empirical Economics 62: 93–118. [Google Scholar] [CrossRef]
- Keskar, Nitish Shirish, and Richard Socher. 2017. Improving generalization performance by switching from adam to sgd. arXiv arXiv:1712.07628. [Google Scholar] [CrossRef]
- Kingma, Diederik P., and Jimmy Ba. 2014. Adam: A method for stochastic optimization. arXiv arXiv:1412.6980. [Google Scholar] [CrossRef]
- Koenker, Roger, and Gilbert Bassett Jr. 1978. Regression quantiles. Econometrica: Journal of the Econometric Society 46: 33–50. [Google Scholar] [CrossRef]
- Lan, Cheng, Ziyi Huang, and Wenli Huang. 2020. Systemic risk in China’s financial industry due to the COVID-19 pandemic. Asian Economics Letters 1: 18070. [Google Scholar] [CrossRef]
- Lang, Bernhard. 2005. Monotonic multi-layer perceptron networks as universal approximators. Paper presented at 15th International Conference on Artificial Neural Networks, Warsaw, Poland, September 11–15; pp. 31–37. [Google Scholar] [CrossRef]
- Locurcio, Marco, Francesco Tajani, Pierluigi Morano, Debora Anelli, and Benedetto Manganelli. 2021. Credit risk management of property investments through multi-criteria indicators. Risks 9: 106. [Google Scholar] [CrossRef]
- Mainik, Georg, and Eric Schaanning. 2014. On dependence consistency of CoVaR and some other systemic risk measures. Statistics & Risk Modeling 31: 49–77. [Google Scholar] [CrossRef]
- Martínez-Jaramillo, Serafín, Omar Pérez Pérez, Fernando Avila Embriz, and Fabrizio López Gallo Dey. 2010. Systemic risk, financial contagion and financial fragility. Journal of Economic Dynamics and Control 34: 2358–74. [Google Scholar] [CrossRef]
- Minin, Alexey, Marina Velikova, Bernhard Lang, and Hennie Daniels. 2010. Comparison of universal approximators incorporating partial monotonicity by structure. Neural Networks 23: 471–75. [Google Scholar] [CrossRef] [PubMed]
- Naeem, Muhammad Abubakr, Sitara Karim, and Aviral Kumar Tiwari. 2022. Quantifying systemic risk in US industries using neural network quantile regression. Research in International Business and Finance 61: 101648. [Google Scholar] [CrossRef]
- Oh, Dong Hwan, and Andrew J. Patton. 2013. Simulated method of moments estimation for copula-based multivariate models. Journal of the American Statistical Association 108: 689–700. [Google Scholar] [CrossRef]
- Popkova, Elena G., and Bruno S. Sergi. 2021. Dataset modelling of the financial risk management of social entrepreneurship in emerging economies. Risks 9: 211. [Google Scholar] [CrossRef]
- Queyranne, Maximilien, Daniel Baksa, Azhin Abdulkarim, and Vassili Bazinas. 2021. Morocco’s Monetary Policy Transmission in the Wake of the COVID-19 Pandemic. Washington, DC: IMF. [Google Scholar]
- Rivera-Escobar, Orlando, John Willmer Escobar, and Diego Fernando Manotas. 2022. Measurement of Systemic Risk in the Colombian Banking Sector. Risks 10: 22. [Google Scholar] [CrossRef]
- Rizwan, Muhammad Suhail, Ghufran Ahmad, and Dawood Ashraf. 2020. Systemic risk: The impact of COVID-19. Finance Research Letters 36: 101682. [Google Scholar] [CrossRef] [PubMed]
- Rockafellar, R. Tyrrell, and Stanislav Uryasev. 2000. Optimization of conditional value-at-risk. Journal of Risk 2: 21–42. [Google Scholar] [CrossRef]
- Siebenbrunner, Christoph, and Michael Sigmund. 2019. Quantile panel estimation of financial contagion effects. In Panel Data Econometrics. New York: Elsevier, pp. 639–64. [Google Scholar] [CrossRef]
- Takeuchi, Ichiro, Quoc Le, Timothy Sears, and Alexander Smola. 2006. Nonparametric quantile estimation. The Journal of Machine Learning Research 7: 1231–64. [Google Scholar]
- Taylor, James W. 2000. A quantile regression neural network approach to estimating the conditional density of multiperiod returns. Journal of Forecasting 19: 299–311. [Google Scholar] [CrossRef]
- The Moroccan Ministry of Health. 2020. Morocco Announces the Registration of the First Case of the New Coronavirus. Rabat: Moroccan Ministry of Health. [Google Scholar]
- The World Bank. 2020. Available online: https://data.worldbank.org/indicator/NY.GDP.MKTP.KD.ZG?locations=MA (accessed on 1 January 2023).
- The World Health Organization. 2020. WHO Director-General’s Opening Remarks at the Mission Briefing on COVID-19—12 March 2020. Geneva: World Health Organization. [Google Scholar]
- Tobias, Adrian, and Markus K. Brunnermeier. 2016. CoVaR. The American Economic Review 106: 1705. [Google Scholar] [CrossRef]
- White, Halbert. 1992. Nonparametric estimation of conditional quantiles using neural networks. In Computing Science and Statistics: Statistics of Many Parameters: Curves, Images, Spatial Models. New York: Springer, pp. 190–99. [Google Scholar] [CrossRef]
- Xu, Qifa, Bei Jin, and Cuixia Jiang. 2021. Measuring systemic risk of the Chinese banking industry: A wavelet-based quantile regression approach. The North American Journal of Economics and Finance 55: 101354. [Google Scholar] [CrossRef]
- Xu, Qifa, Kai Deng, Cuixia Jiang, Fang Sun, and Xue Huang. 2017. Composite quantile regression neural network with applications. Expert Systems with Applications 76: 129–39. [Google Scholar] [CrossRef]
- Zhang, Hong, and Zhen Zhang. 1999. Feedforward networks with monotone constraints. Paper presented at IJCNN’99. International Joint Conference on Neural Networks. Proceedings (Cat. No.99CH36339), Washington, DC, USA, July 10–16; vol. 3, pp. 1820–23. [Google Scholar] [CrossRef]
- Zhang, Wenjie, Hao Quan, and Dipti Srinivasan. 2018. An improved quantile regression neural network for probabilistic load forecasting. IEEE Transactions on Smart Grid 10: 4425–34. [Google Scholar] [CrossRef]


| Bank | Symbol |
|---|---|
| Attijariwafa Bank | AWB |
| Banque Centrale Populaire | BCP |
| Bank of Africa | BOA |
| Banque Marocaine du Commerce et Industrie | BMCI |
| Credit Immobilier et Hotelier | CIH |
| Credit du Maroc | CDM |
| Bank | Symbol |
|---|---|
| Morocco’s interbank market weighted average minus policy rate | IS |
| Changes in Morocco’s interbank daily transactions volume | ITV |
| 10-Year Minus 3-Month Moroccan treasury yield spread | TS |
| MASI’s daily log-returns | R-MASI |
| Morocco’s banking index daily log-returns | R-B |
| Bank | Min. | Max. | S.D. | Mean | Skewness | Kurtosis | J-B p-Value | ADF p-Value |
|---|---|---|---|---|---|---|---|---|
| AWB | −0.11 | 0.06 | 0.01 | 0 | −0.66 | 8.08 | 0 | 0.01 |
| BCP | −0.11 | 0.07 | 0.01 | 0 | −0.91 | 12.45 | 0 | 0.01 |
| BOA | −0.10 | 0.10 | 0.01 | 0 | 0.05 | 7.21 | 0 | 0.01 |
| BMCI | −0.23 | 0.10 | 0.02 | 0 | −0.90 | 10.92 | 0 | 0.01 |
| CIH | −0.10 | 0.08 | 0.02 | 0 | −0.10 | 4.18 | 0 | 0.01 |
| CDM | −0.11 | 0.10 | 0.02 | 0 | −0.09 | 5.75 | 0 | 0.01 |
| State-Variables | Min. | Max. | S.D. | Mean | Skewness | Kurtosis | J-B p-Value | ADF p-Value |
|---|---|---|---|---|---|---|---|---|
| R-B | −0.1030 | 0.0650 | 0.0091 | 0 | −1.3456 | 21.6283 | 0 | 0.01 |
| R-MASI | −0.0923 | 0.0530 | 0.0073 | 0.0001 | −1.8328 | 30.2986 | 0 | 0.01 |
| ITV | −0.8670 | 6.9423 | 0.4019 | 0.0538 | 5.1456 | 68.04 | 0 | 0.01 |
| IS | −0.0050 | 0.0061 | 0.0009 | 0 | −1.912 | 16.5678 | 0 | 0.01 |
| TS | −0.0018 | 0.0225 | 0.0019 | 0.0082 | −0.5770 | 6.3063 | 0 | 0.01 |
| Model | AWB | BOA | CIH | BCP | BMCI | CDM |
|---|---|---|---|---|---|---|
| QR | 0.00466 | 0.00517 | 0.00596 | 0.00527 | 0.00836 | 0.00669 |
| QRNN-100 | 0.00242 | 0.00391 | 0.00529 | 0.00193 | 0.00717 | 0.00586 |
| QRNN-100-100-A | 0.00237 | 0.00381 | 0.00425 | 0.00168 | 0.00729 | 0.00537 |
| CoVaR | DM Test | AWB | BOA | CIH | BCP | BMCI | CDM |
|---|---|---|---|---|---|---|---|
| QRNN-100-100-A | DM statistic | −13.43 | −17.692 | −13.394 | −23 | −1.8652 | −22.375 |
| /QR | p-value | 0.0000 | 0.0000 | 0.0000 | 0.0000 | 0.03107 | 0.0000 |
| QRNN-100-100-A | DM statistic | −6.1557 | −8.6295 | −3.1601 | −6.0819 | −1.7234 | −21.876 |
| /QRNN-100 | p-value | 0.0000 | 0.0000 | 0.0007 | 0.0000 | 0.0424 | 0.0000 |
| Quarter | AWB | BOA | CIH | BCP | BMCI | CDM | |
|---|---|---|---|---|---|---|---|
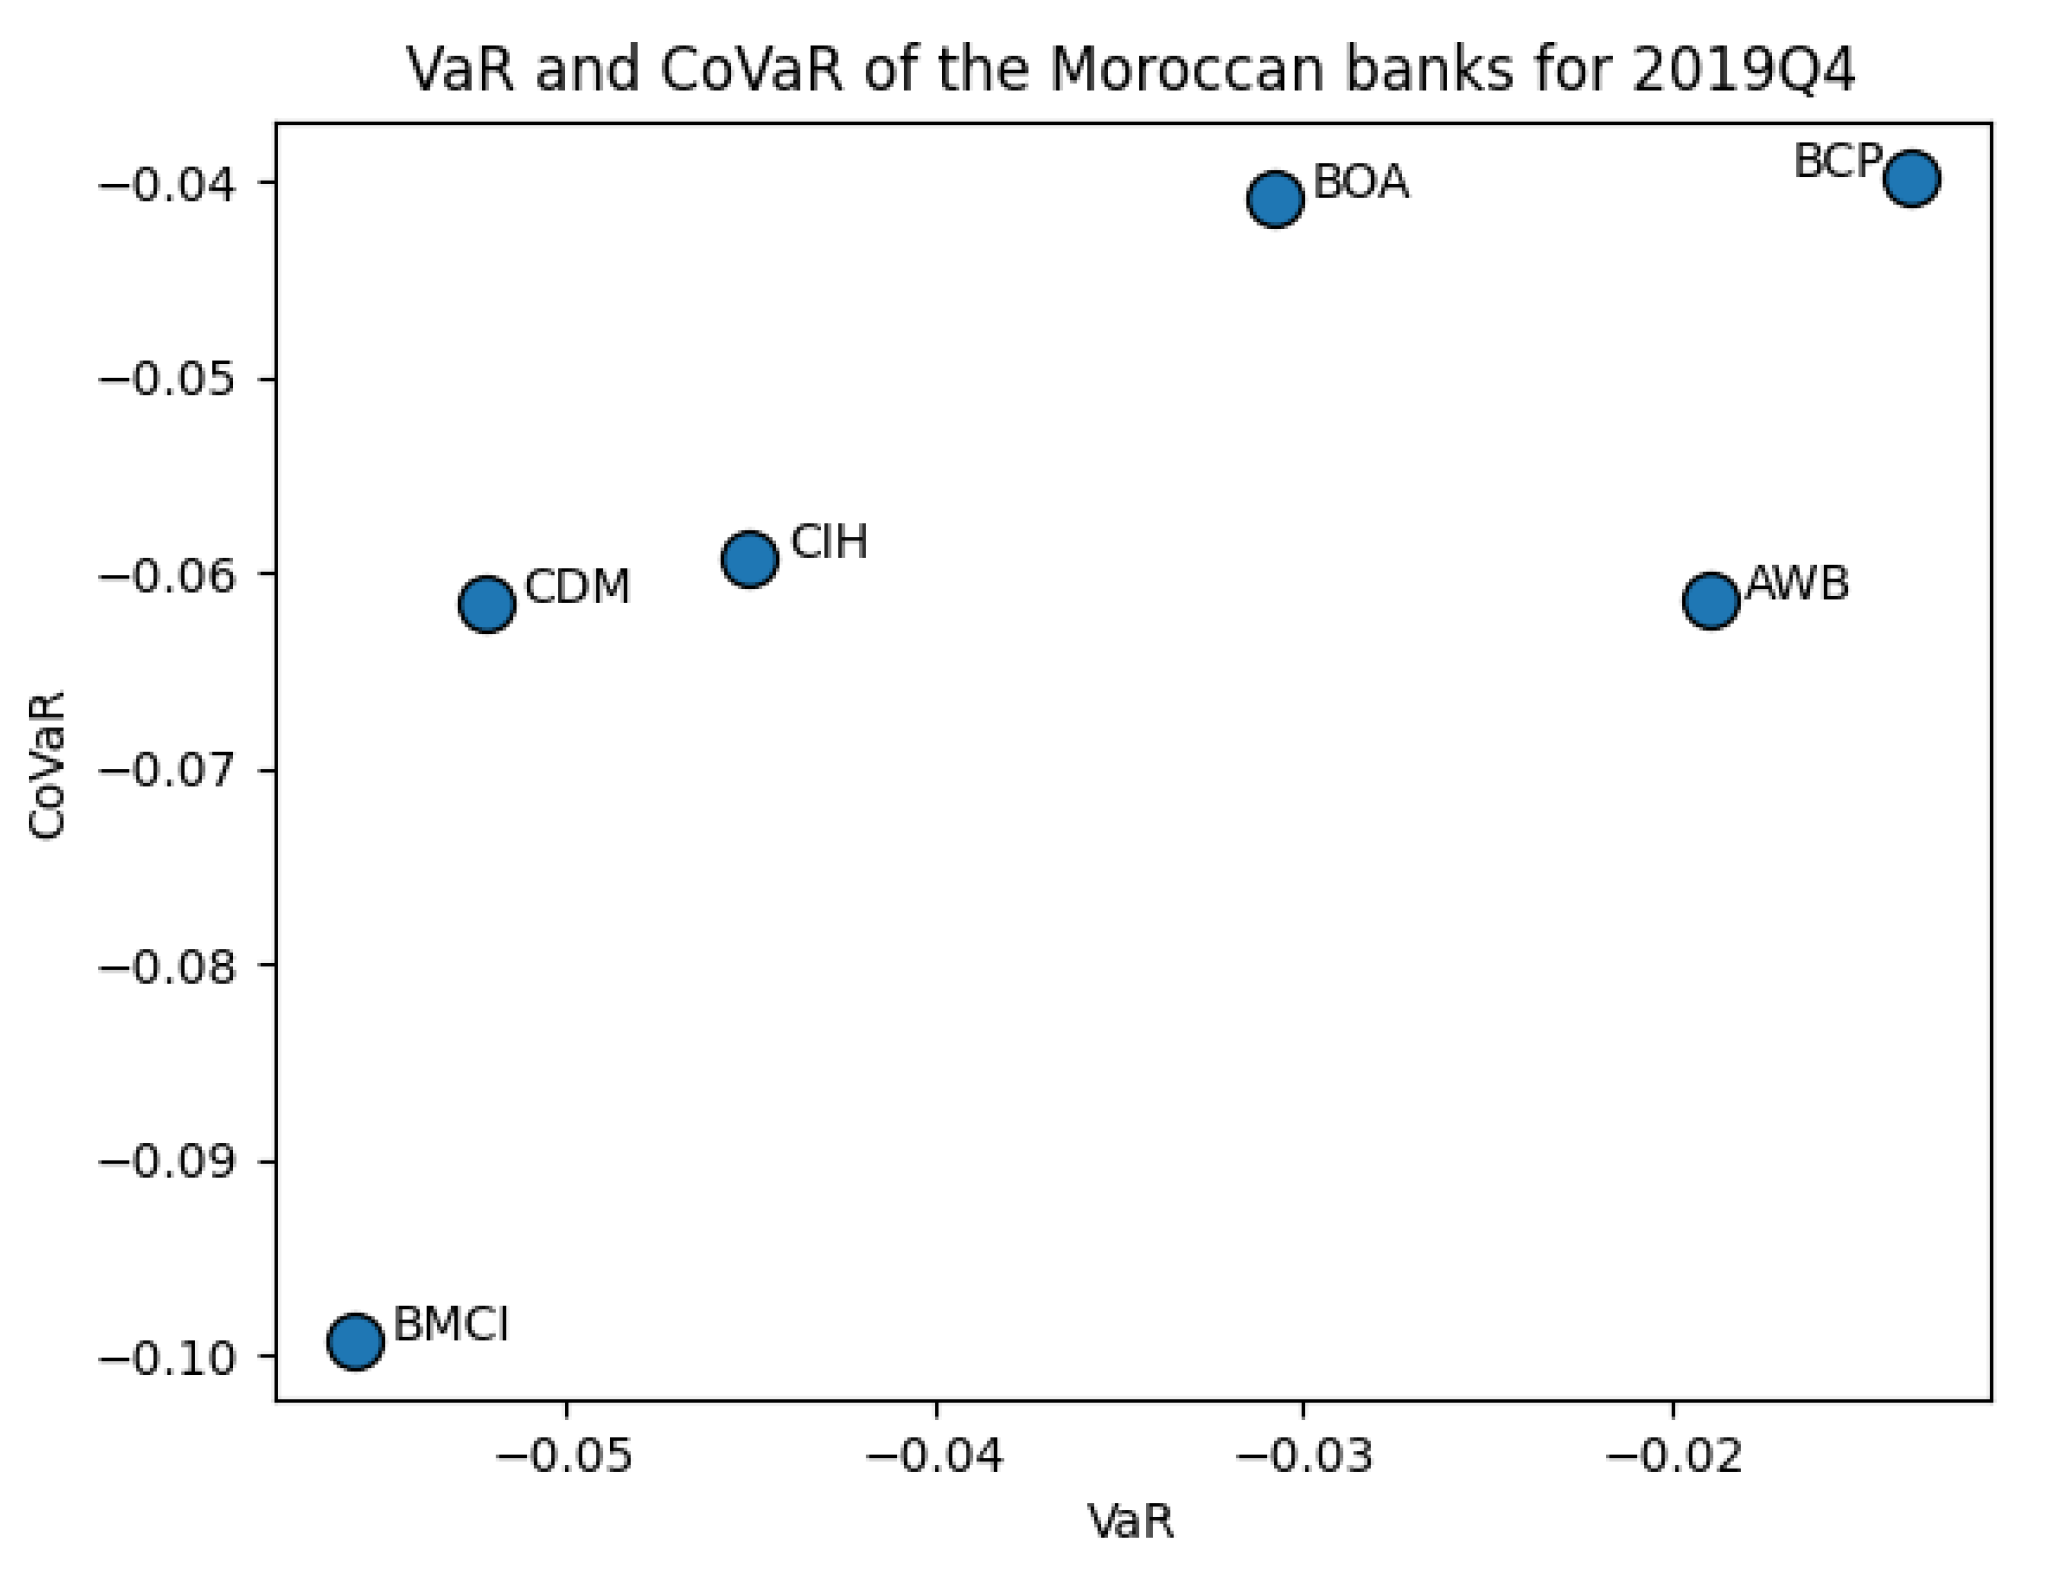
| VaR | 2019Q4 | −0.0190 | −0.0308 | −0.0450 | −0.01351 | −0.0557 | −0.0521 |
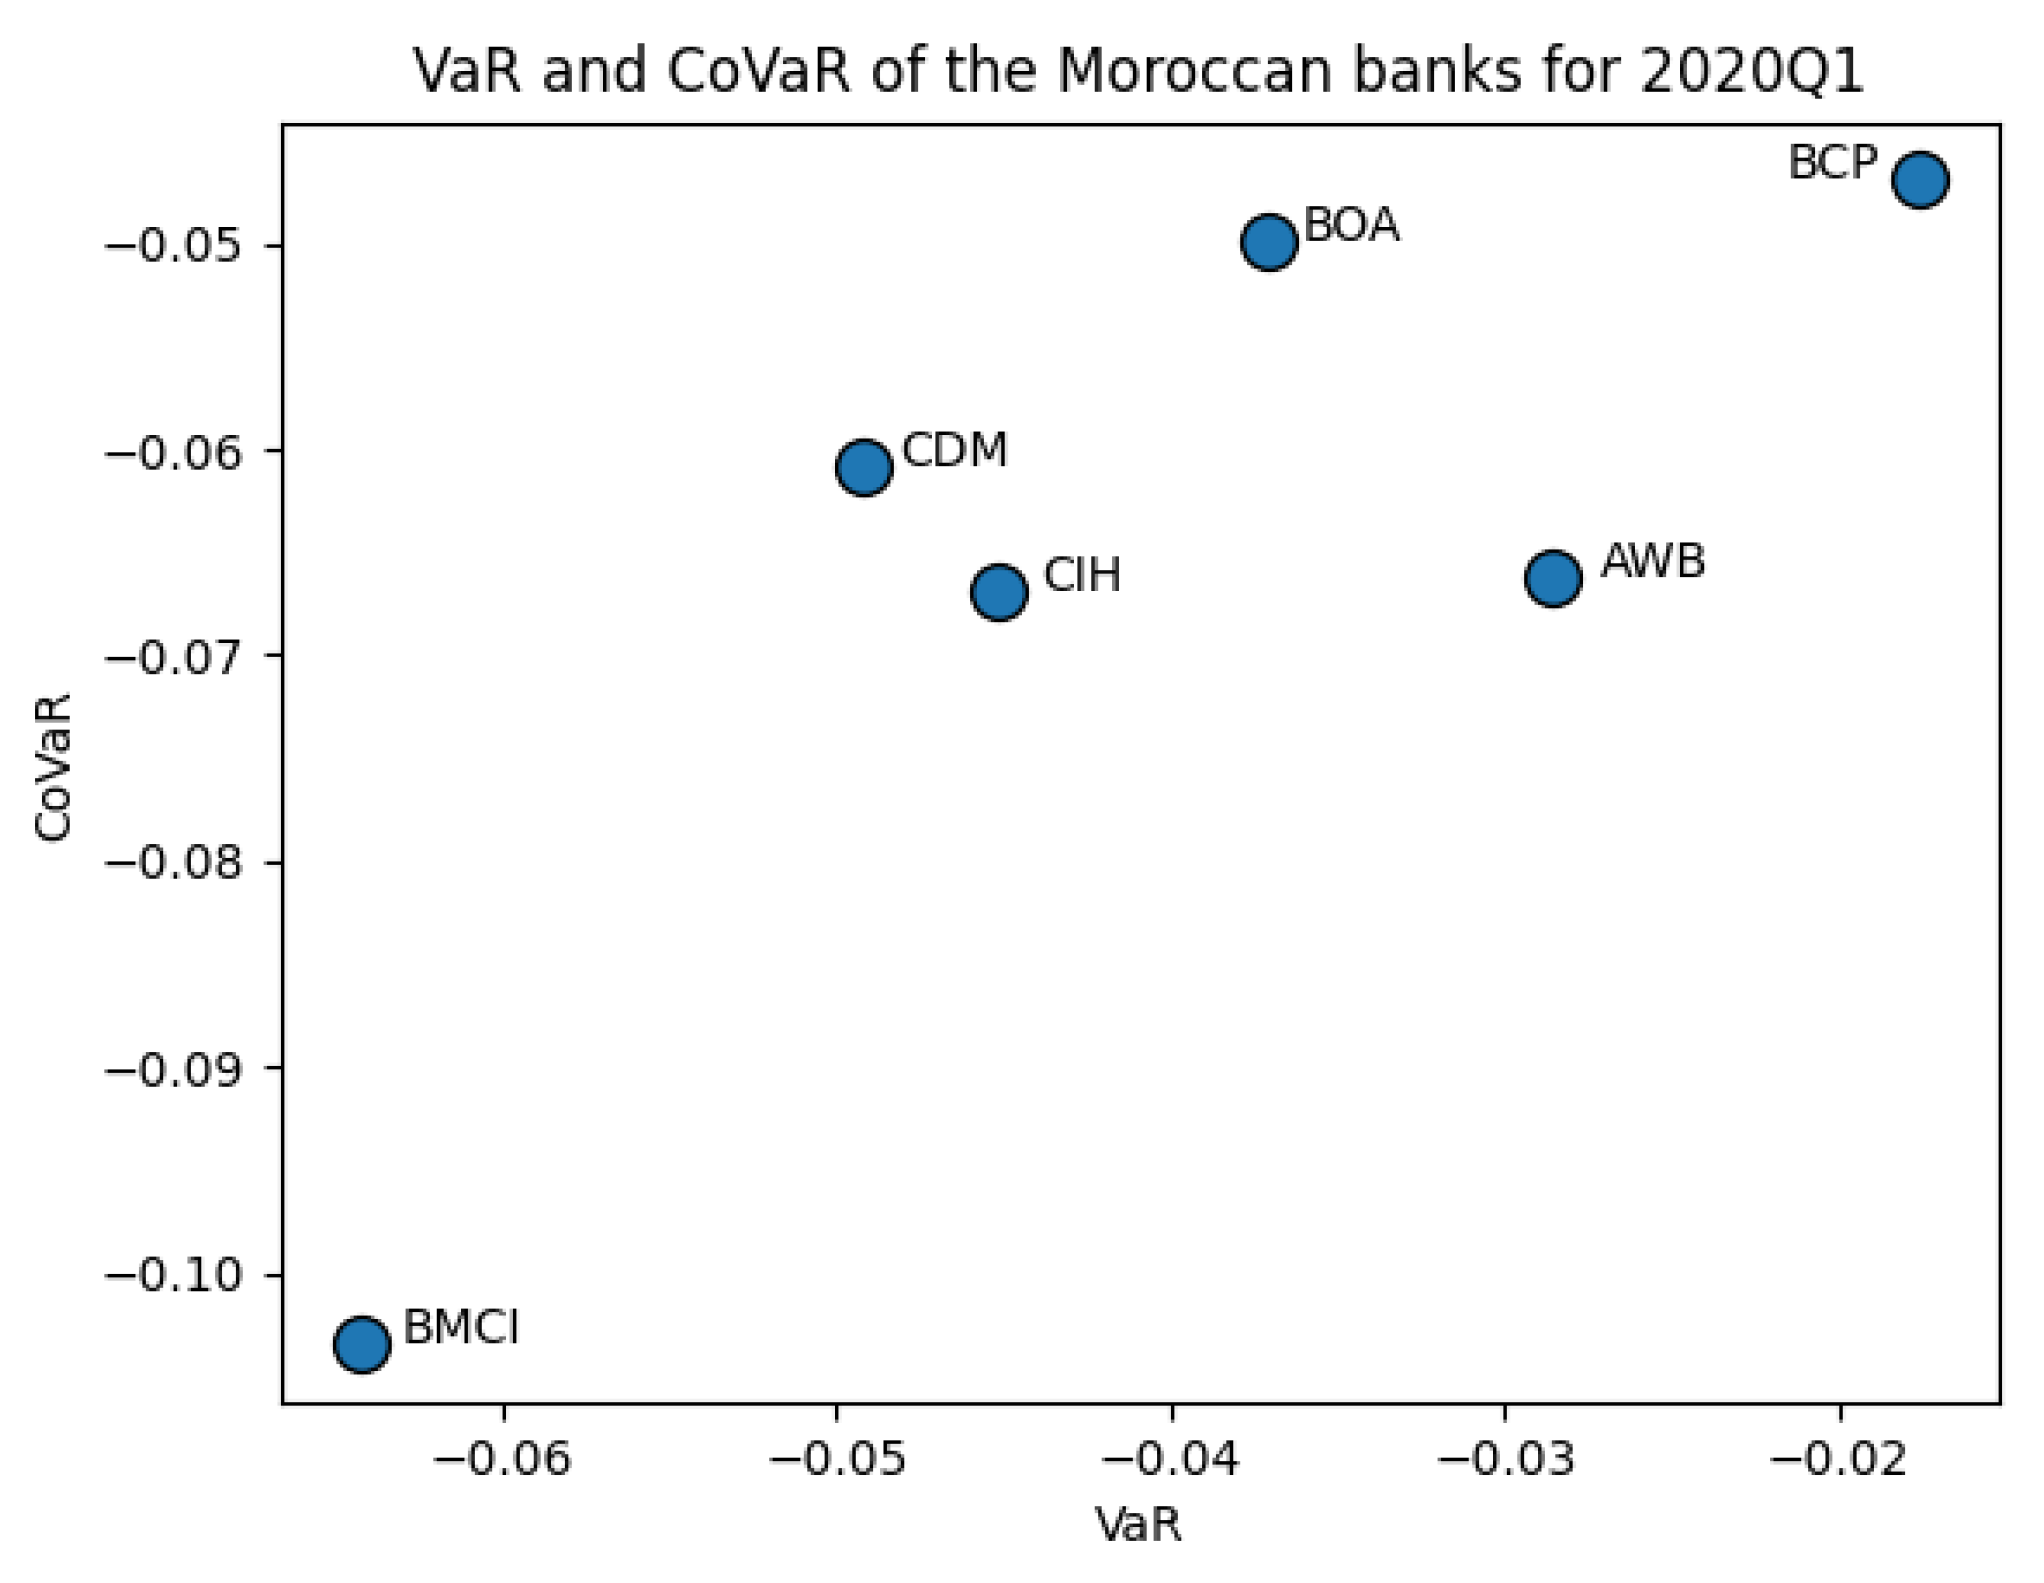
| 2020Q1 | −0.0285 | −0.0371 | −0.0451 | −0.01751 | −0.0643 | −0.0492 | |
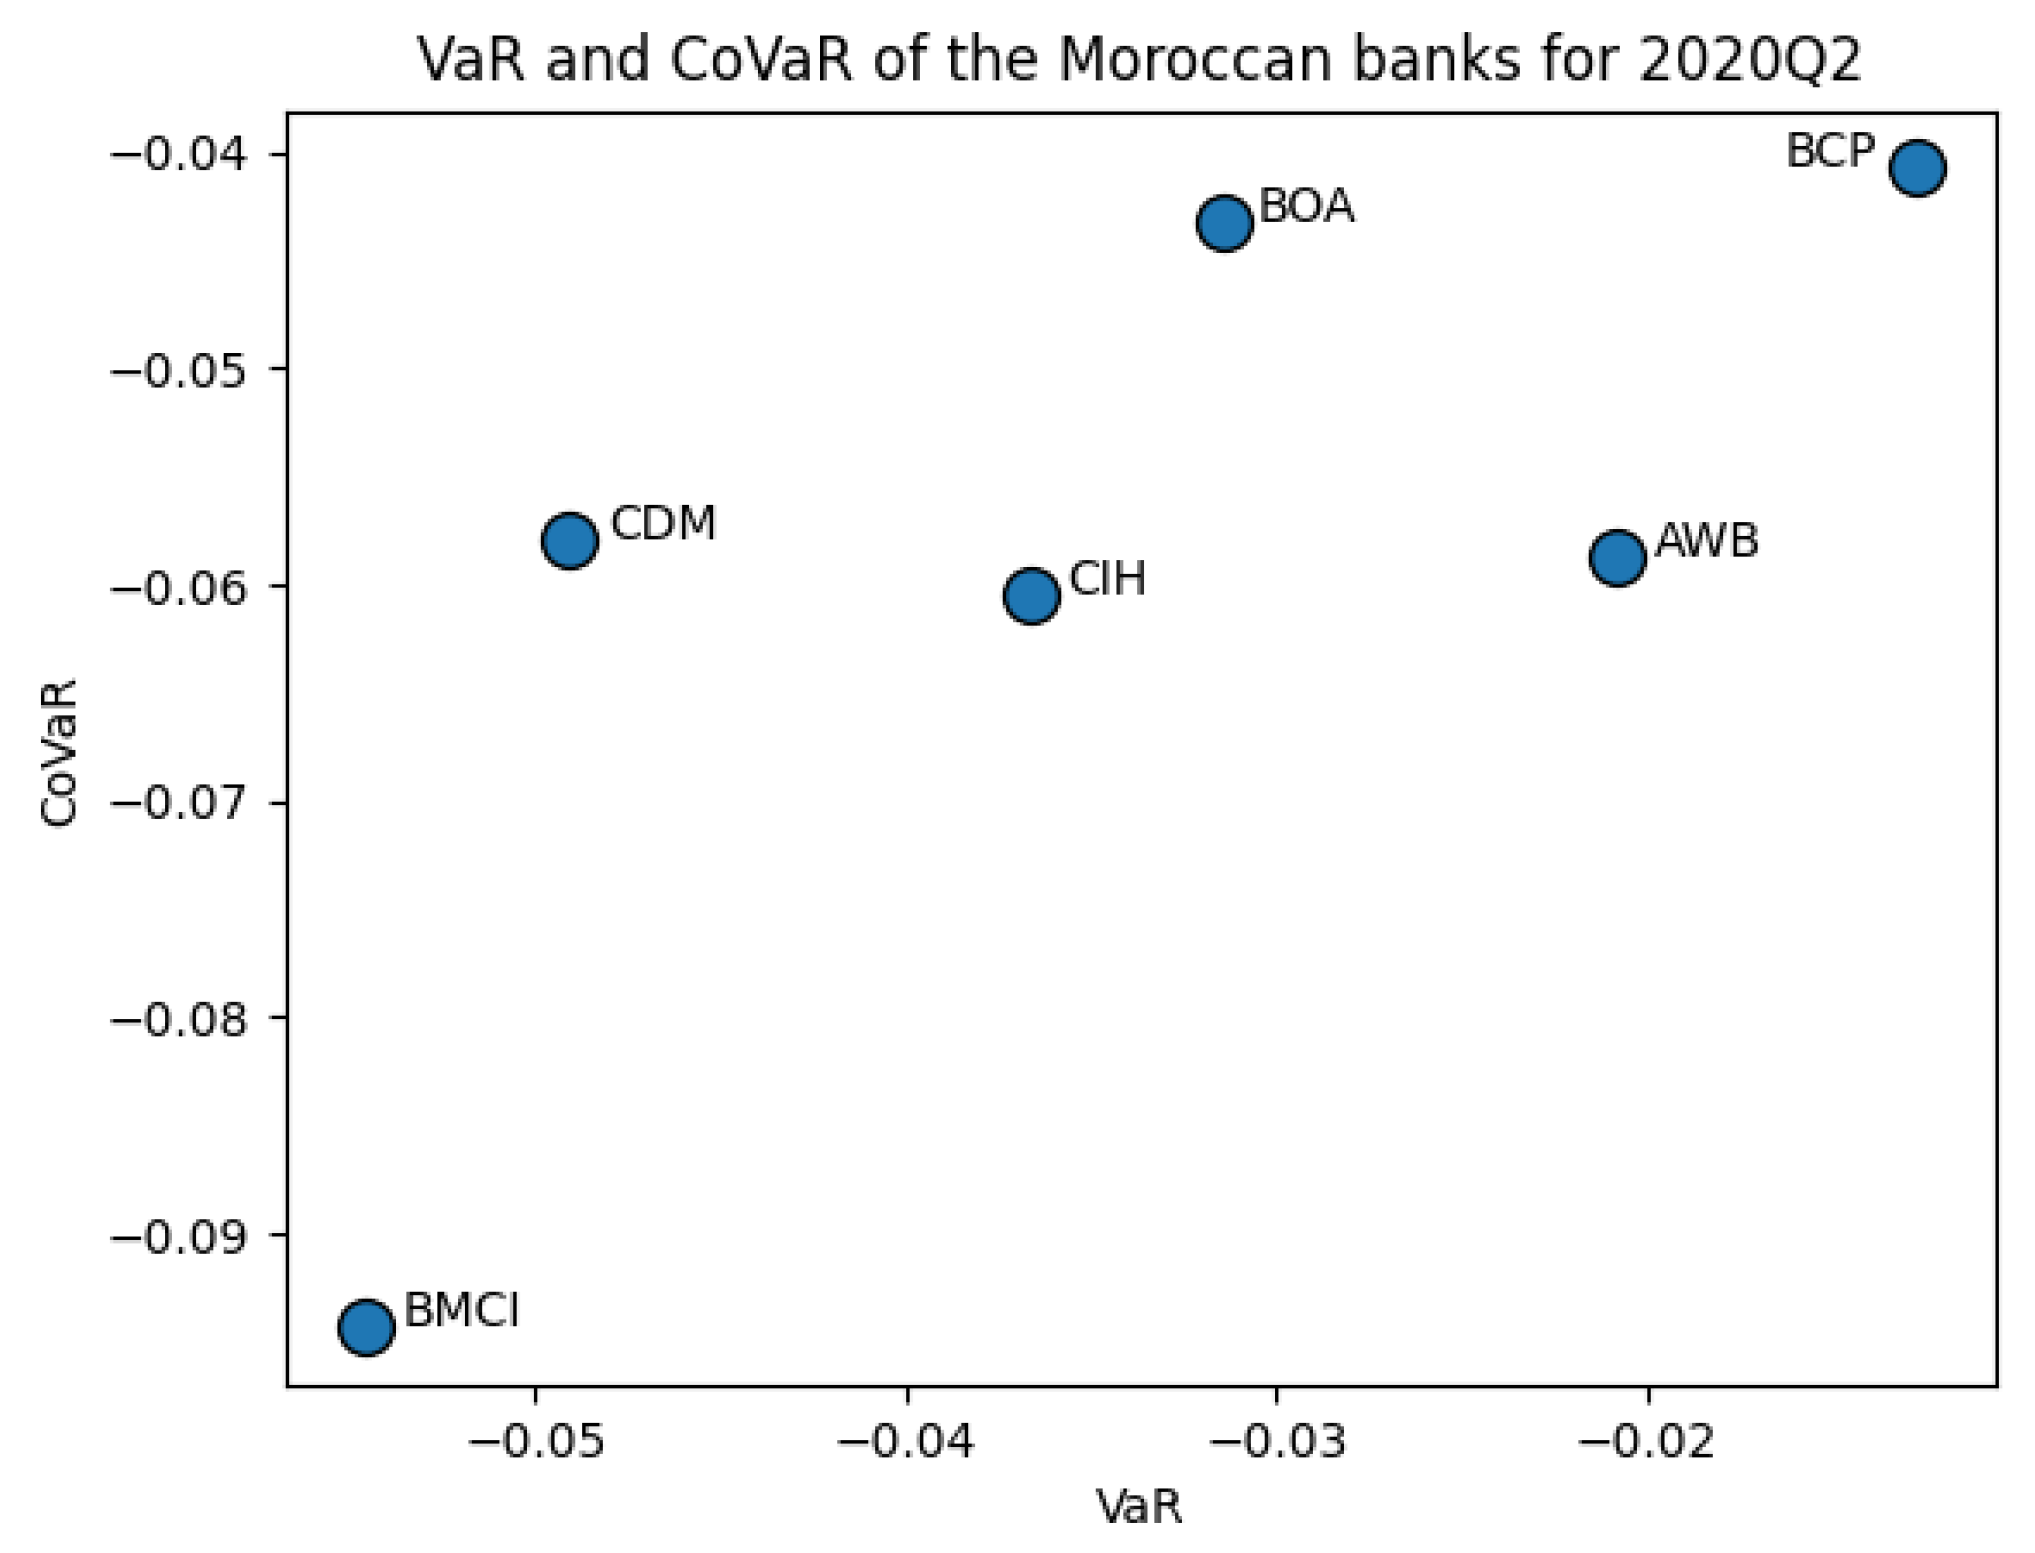
| 2020Q2 | −0.0207 | −0.0314 | −0.0366 | −0.01268 | −0.0546 | −0.0490 | |
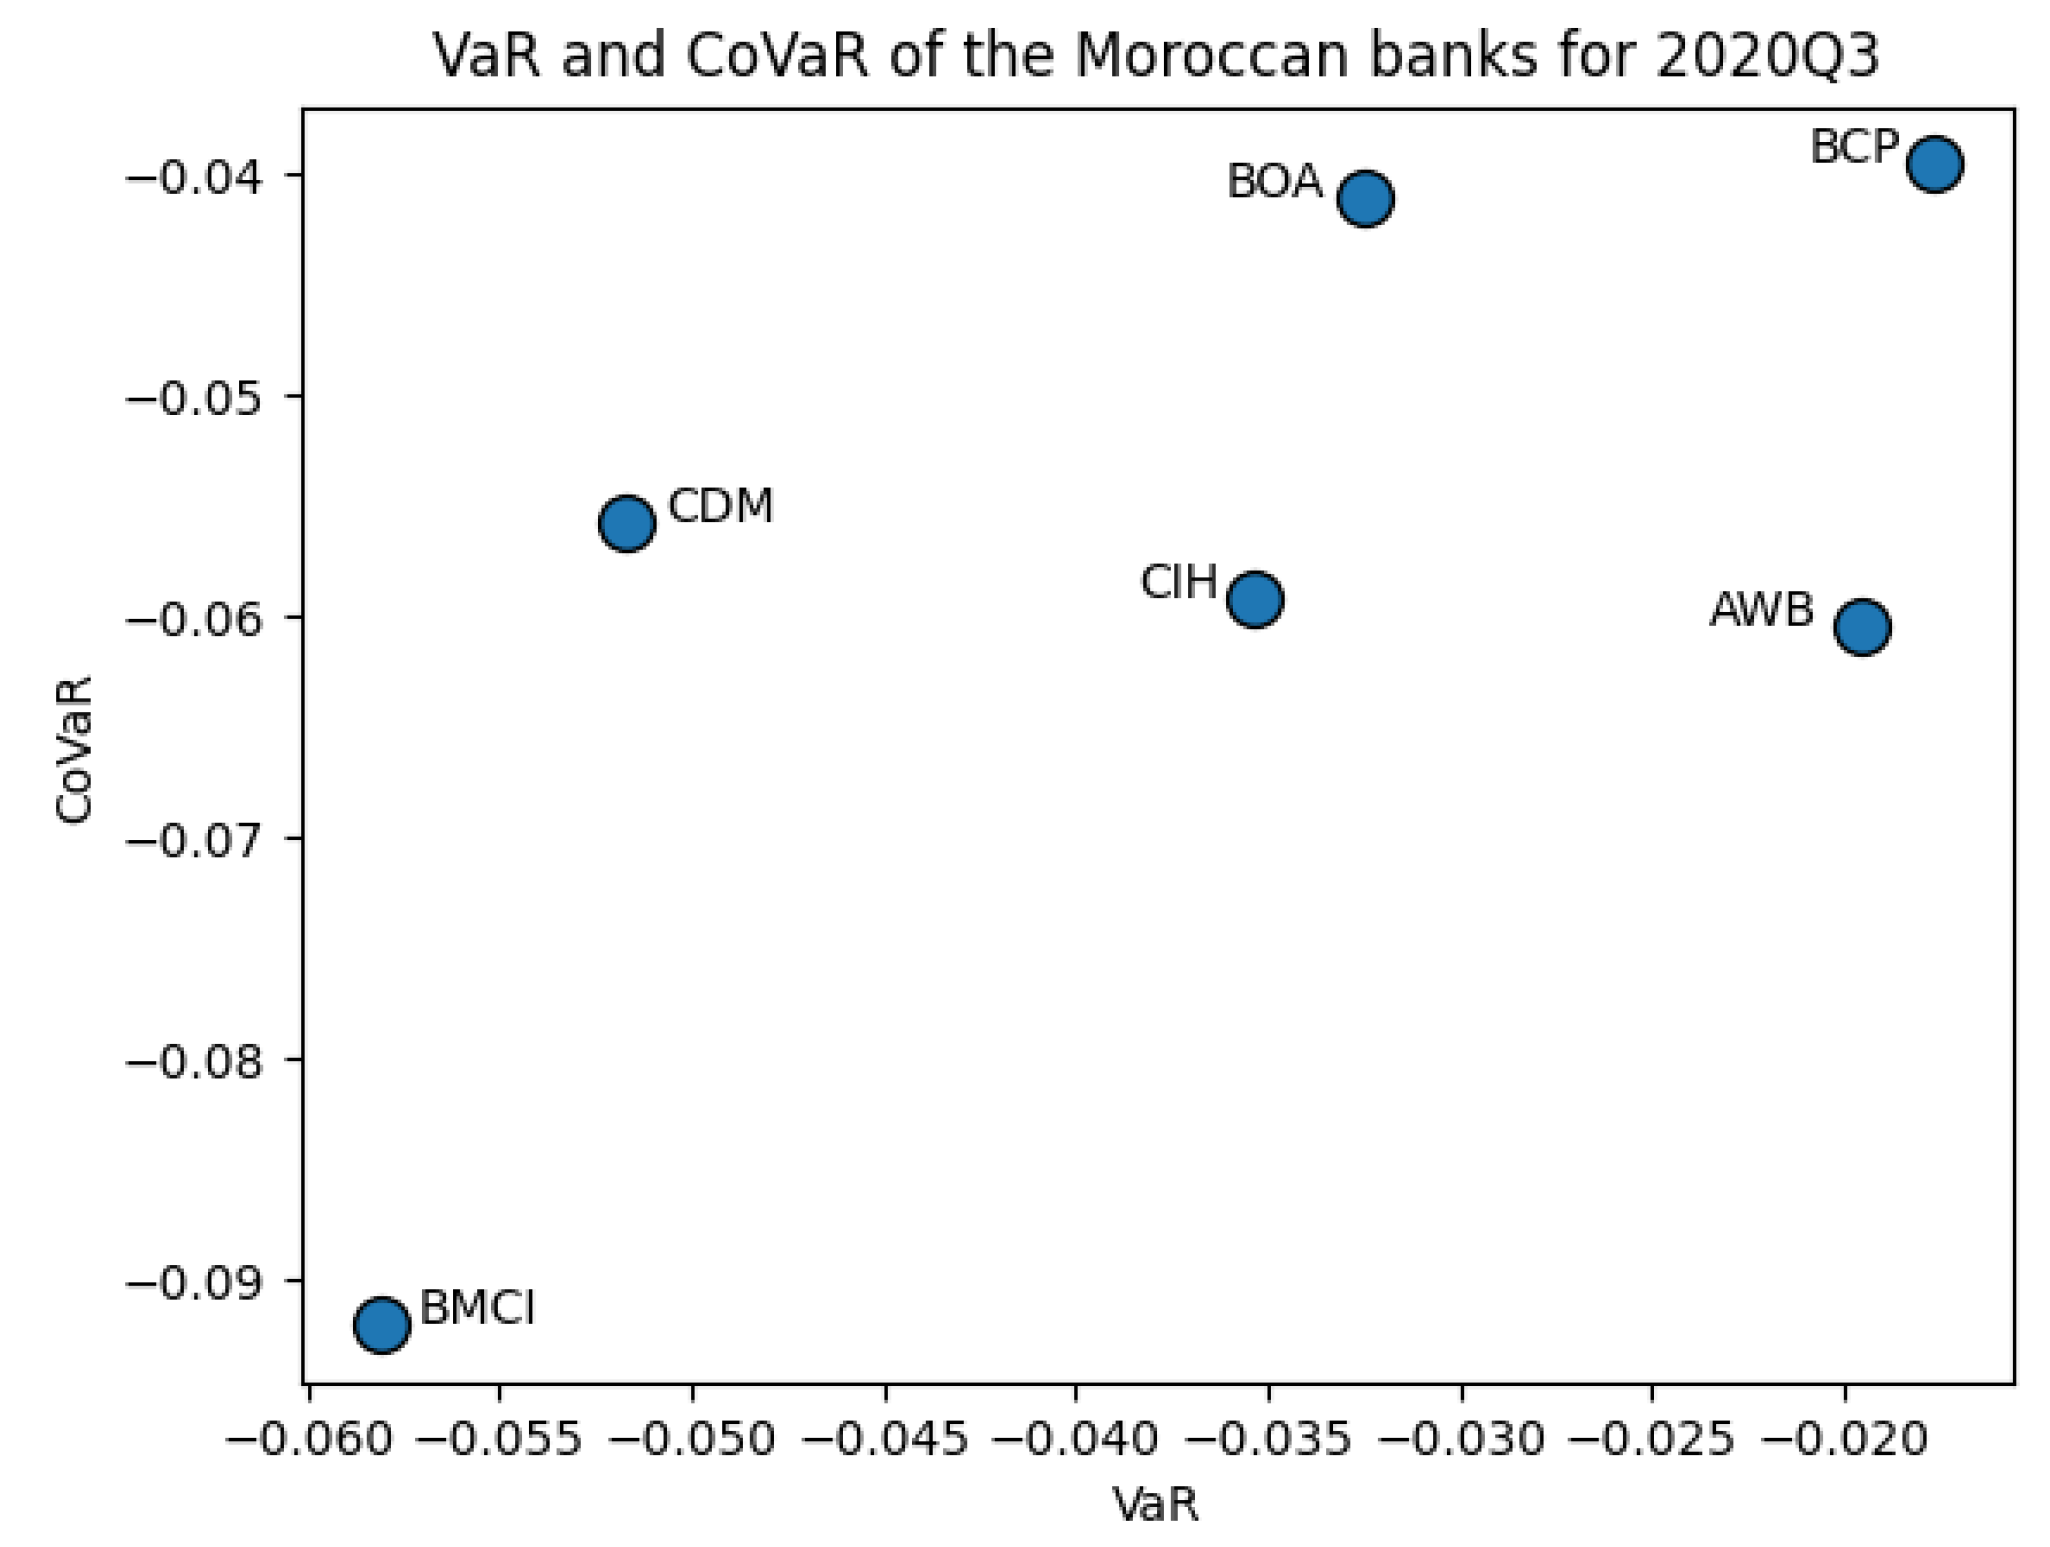
| 2020Q3 | −0.0195 | −0.0324 | −0.0353 | −0.01762 | −0.0581 | −0.0516 | |
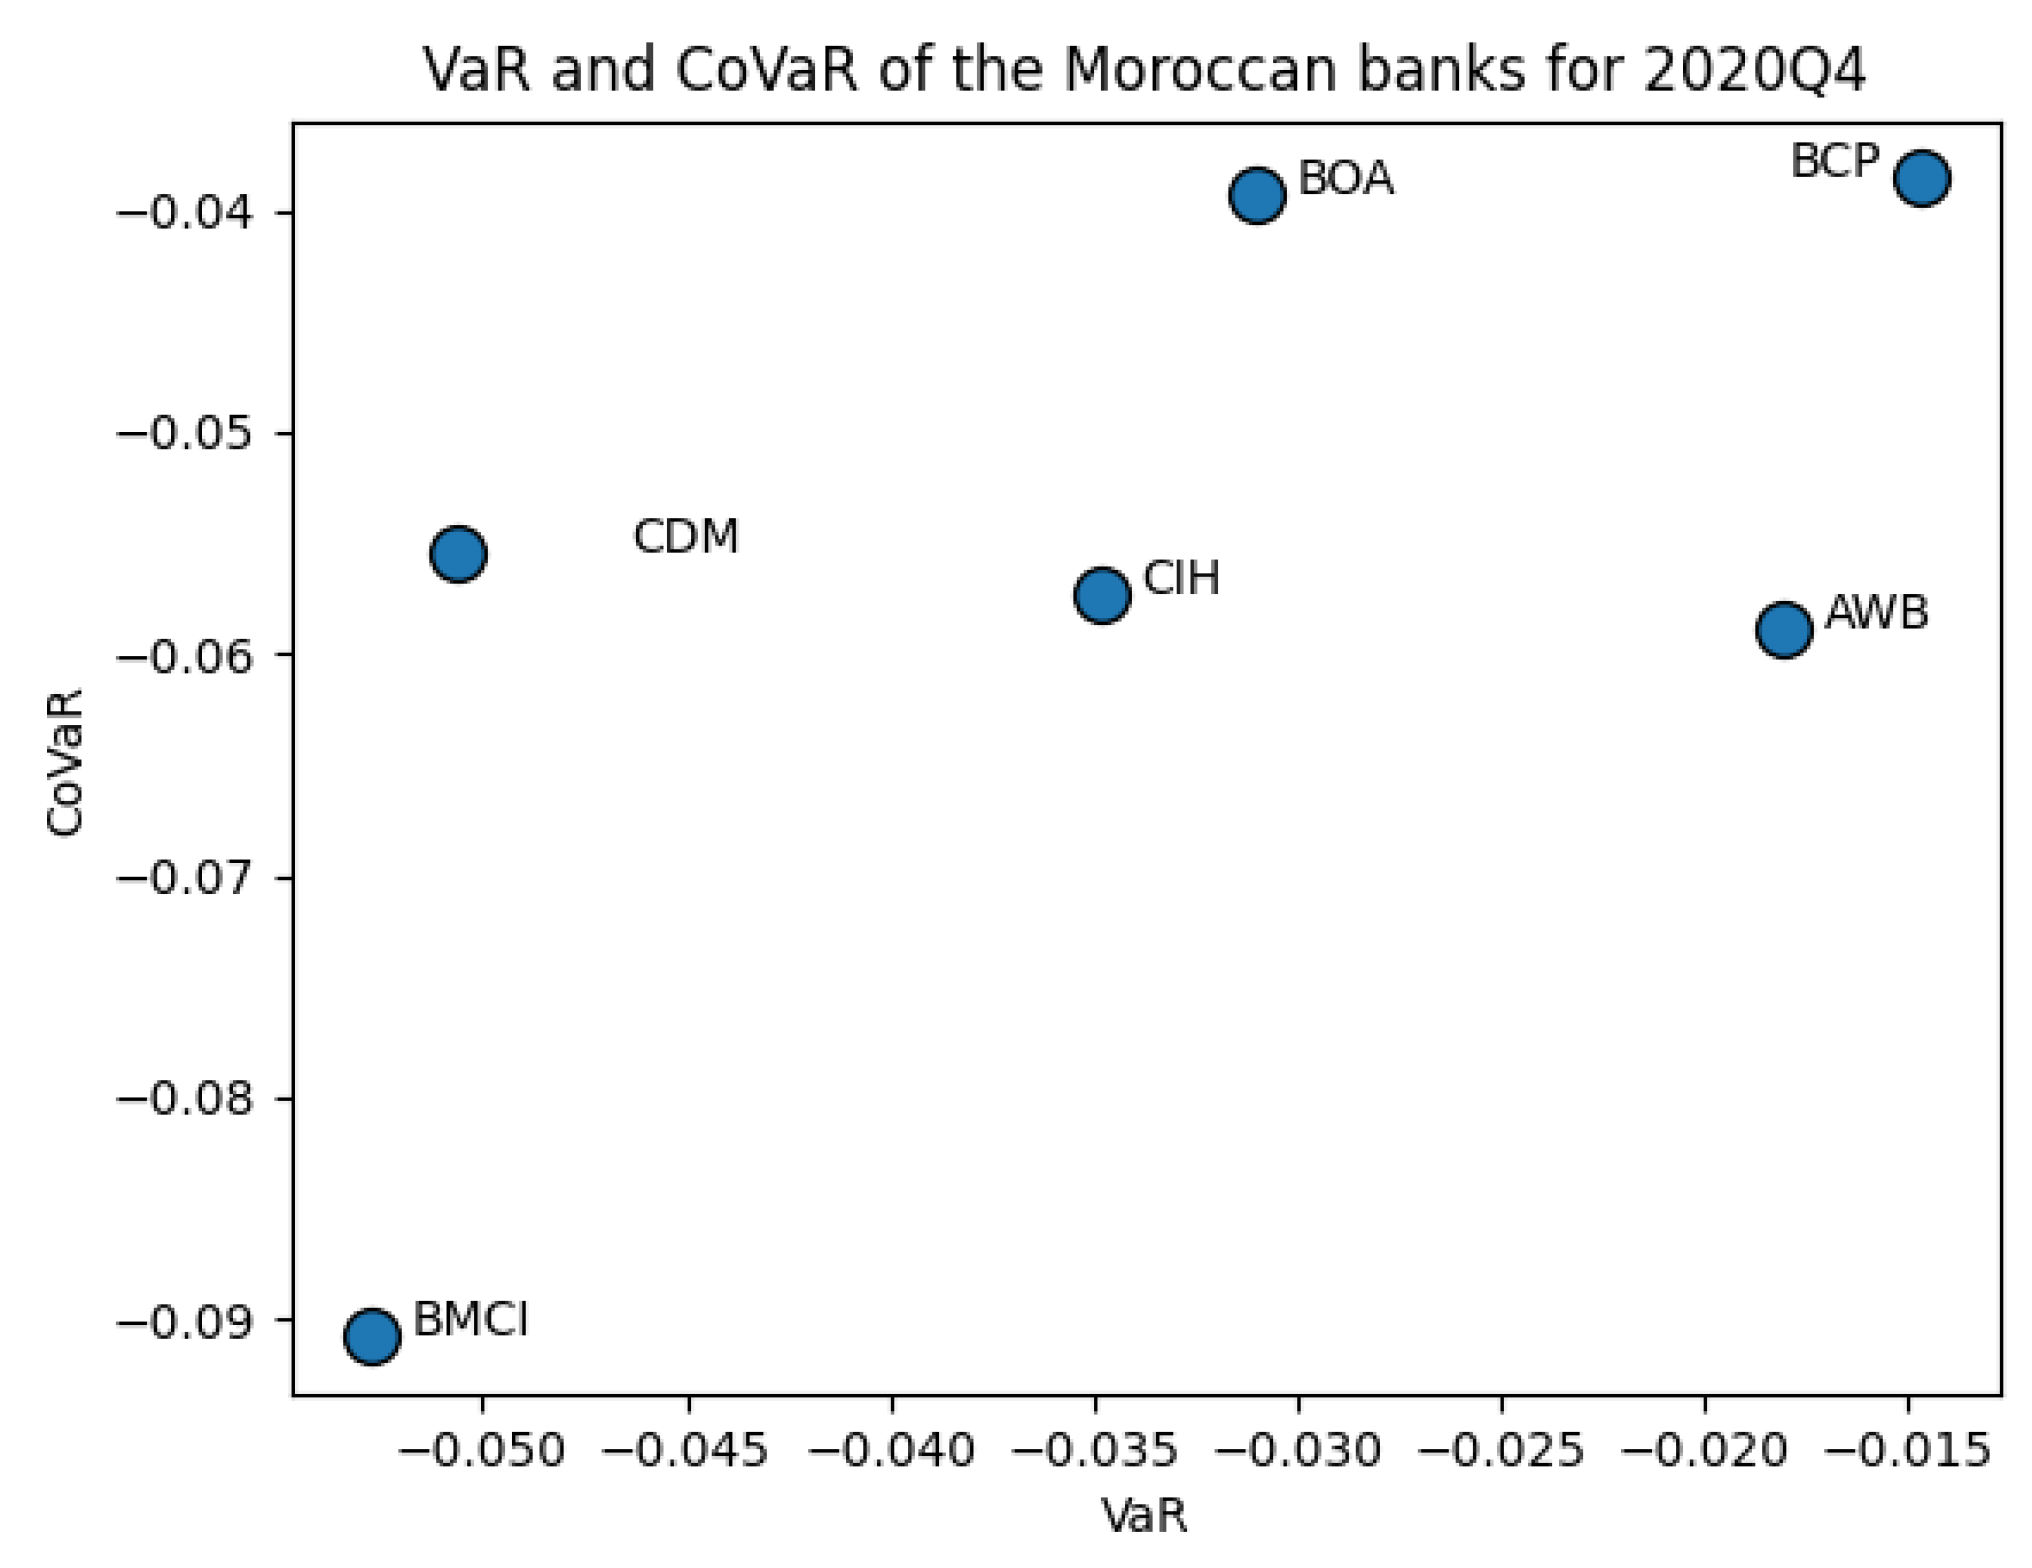
| 2020Q4 | −0.0179 | −0.0309 | −0.0348 | −0.01459 | −0.0527 | −0.0506 | |
| CoVaR | 2019Q4 | −0.0613 | −0.0409 | −0.0593 | −0.0398 | −0.0993 | −0.0614 |
| 2020Q1 | −0.0662 | −0.0499 | −0.0669 | −0.0469 | −0.1034 | −0.0607 | |
| 2020Q2 | −0.0587 | −0.0432 | −0.0601 | −0.0407 | −0.0943 | −0.0579 | |
| 2020Q3 | −0.0603 | −0.0410 | −0.0591 | −0.0395 | −0.0920 | −0.0557 | |
| 2020Q4 | −0.0588 | −0.0392 | −0.0573 | −0.0385 | −0.0908 | −0.0554 |
Disclaimer/Publisher’s Note: The statements, opinions and data contained in all publications are solely those of the individual author(s) and contributor(s) and not of MDPI and/or the editor(s). MDPI and/or the editor(s) disclaim responsibility for any injury to people or property resulting from any ideas, methods, instructions or products referred to in the content. |
© 2023 by the authors. Licensee MDPI, Basel, Switzerland. This article is an open access article distributed under the terms and conditions of the Creative Commons Attribution (CC BY) license (https://creativecommons.org/licenses/by/4.0/).
Share and Cite
Kyoud, A.; El Msiyah, C.; Madkour, J. Modelling Systemic Risk in Morocco’s Banking System. Int. J. Financial Stud. 2023, 11, 70. https://doi.org/10.3390/ijfs11020070
Kyoud A, El Msiyah C, Madkour J. Modelling Systemic Risk in Morocco’s Banking System. International Journal of Financial Studies. 2023; 11(2):70. https://doi.org/10.3390/ijfs11020070
Chicago/Turabian StyleKyoud, Ayoub, Cherif El Msiyah, and Jaouad Madkour. 2023. "Modelling Systemic Risk in Morocco’s Banking System" International Journal of Financial Studies 11, no. 2: 70. https://doi.org/10.3390/ijfs11020070