Article

Negative Interest Rates and Its Impact on GDP, FDI and Banks’ Financial Performance: The Cases of Switzerland and Sweden

Faculty of Economic Studies, Department of Economics and Management, University of Finance and Administration, Estonska 500, 10100 Prague, Czech Republic
*
Author to whom correspondence should be addressed.
Int. J. Financial Stud. 2023, 11(2), 69; https://doi.org/10.3390/ijfs11020069
Submission received: 11 March 2023 / Revised: 9 May 2023 / Accepted: 11 May 2023 / Published: 17 May 2023

Abstract

:
The article deals with the issue of how negative interest rate policies, introduced in the second decade of the 21st century in some countries, affect certain macroeconomic indicators and bank performance. We concentrate specifically on Switzerland and Sweden. We use correlation analysis to reveal the relationship between interest rates and GDP, the level of foreign direct investment (FDI) and some indicators of banks’ performance. We found that negative interest rates (NIRs) are strongly correlated with the level of GDP in both Switzerland and Sweden but that they do not affect their FDI. The share of banks´ deposits in GDP is also strongly correlated with NIR. Other indicators of bank performance do not show a strong correlation for both countries. Our evidence is consistent with NIR not being associated with undesirable effects concerning economic growth and bank performance in Switzerland and Sweden. The value of FDI depends on many factors—mainly on the attractiveness of a country for foreign investors in terms of its political and economic stability and by general conditions for business operation.

1. Introduction

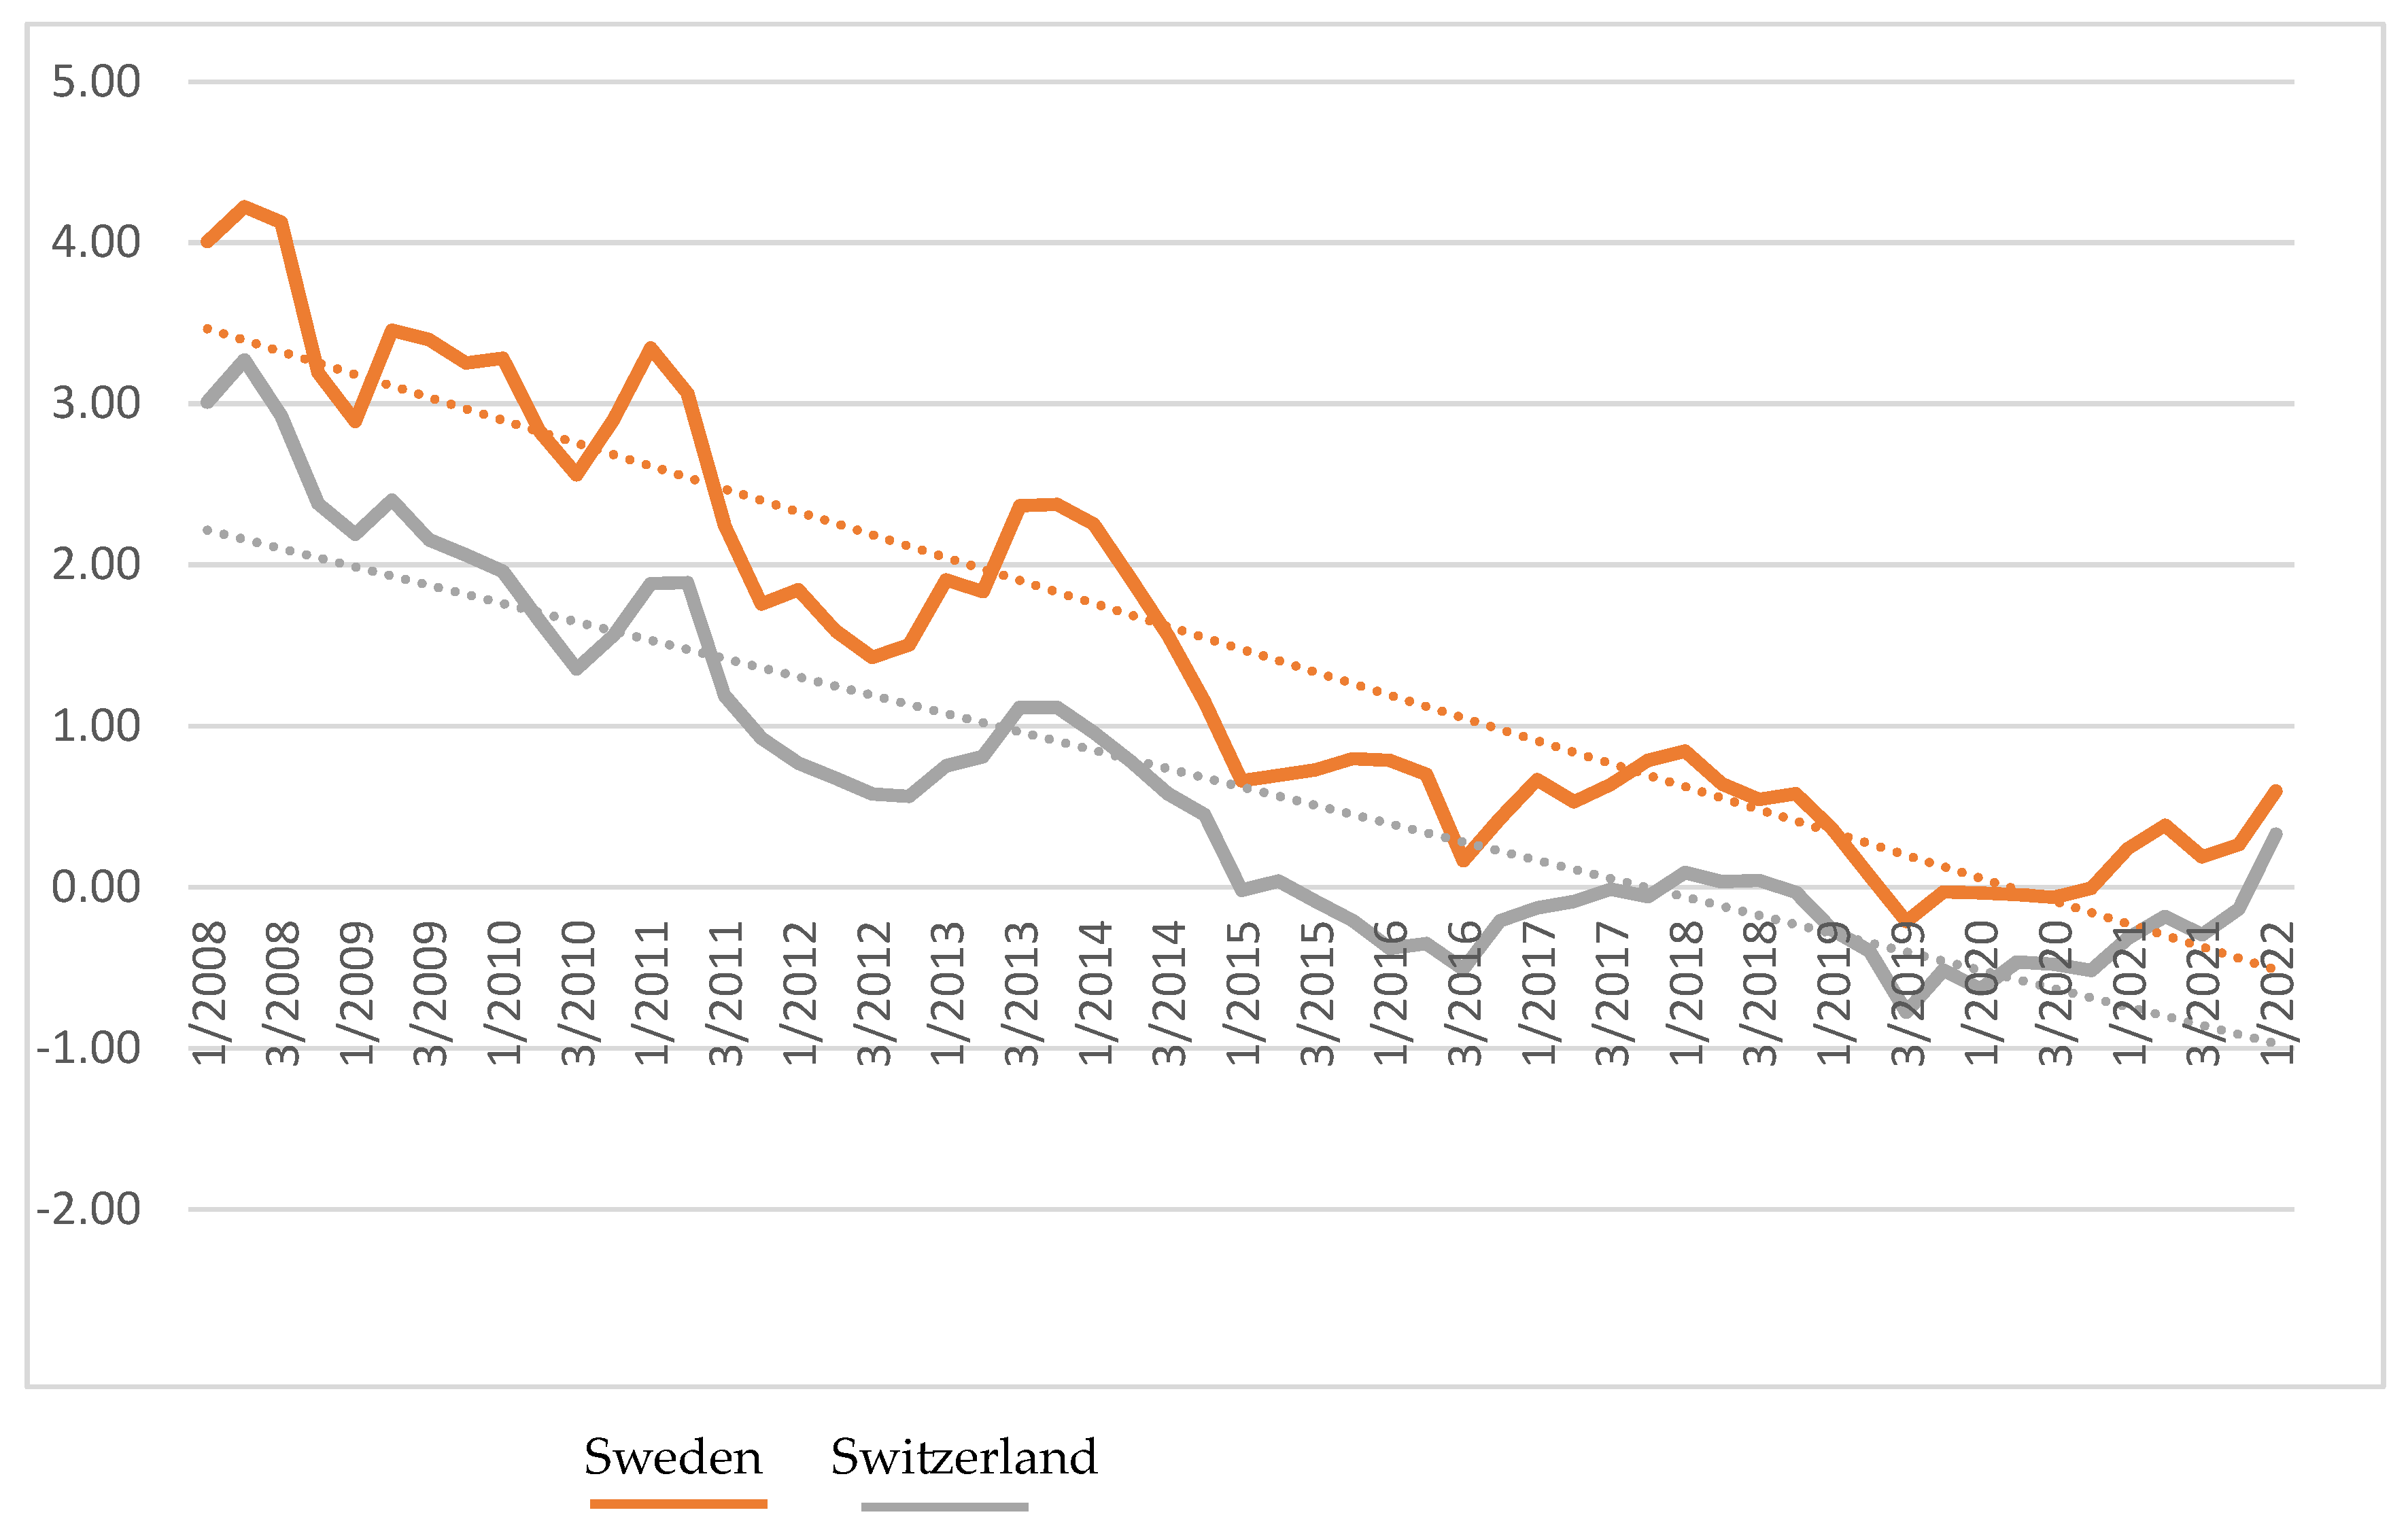
To overcome the consequences of the global financial crisis in 2008–2009, central banks made many extraordinary steps to increase the money supply and to force commercial banks to lend money to other subjects. One of the most controversial measures was the implementation of negative interest rate policy (NIRP) that implies setting nominal target interest rates below the zero percent bound. Sweden’s central bank was the first to deploy negative interest rates (NIRs). In July 2009, the Riksbank cut its overnight deposit rate to −0.25%. The European Central Bank (ECB) lowered its deposit rate to −0.1% in June 2014. Several other central banks followed this policy—Denmark adopted an NIRP in September 2014, Switzerland in December 2014, Sweden in February 2015, Norway in September 2015, Bulgaria in January 2016, Japan in February 2016 and Hungary in March 2016 (Arteta et al. 2016; Czudaj 2020). Commercial banks operating in these countries were supposed to pay central banks a small fee to hold their excess reserves at central banks. The main objective of these decisions (de Groot and Haas 2020) was to promote bank lending, which stimulates economic growth and fights against low inflation and the increasing threat of deflation. Negative interest rates should encourage commercial banks to lend more money to households and companies, rather than hold it at the central bank. As such, a business can invest more, using even lower rates.
The implementation of NIRP has triggered concerns about the possible impact of this policy on banks’ profitability. The overall effect of negative monetary policy rates on banks’ profitability is not immediately obvious. According to one of the authors (e.g., Borio et al. 2018), negative rates may erode banks’ profitability, primarily by narrowing their net interest margin (the gap between bank lending and deposit rates), given their reluctance to introduce negative retail deposit rates. However, another group of authors (e.g., Jobst and Lin 2016) was not so skeptical, pointing out that other channels include the development of wholesale funding costs, as well as lending volumes, credit losses, or fee and commission income. Moreover, asset purchases and other measures contributing to lower interest rates increase the value of the securities held by banks, with a positive impact on profits. Such a dual outcome raises important questions about the effectiveness and consequences of expansionary monetary policy.
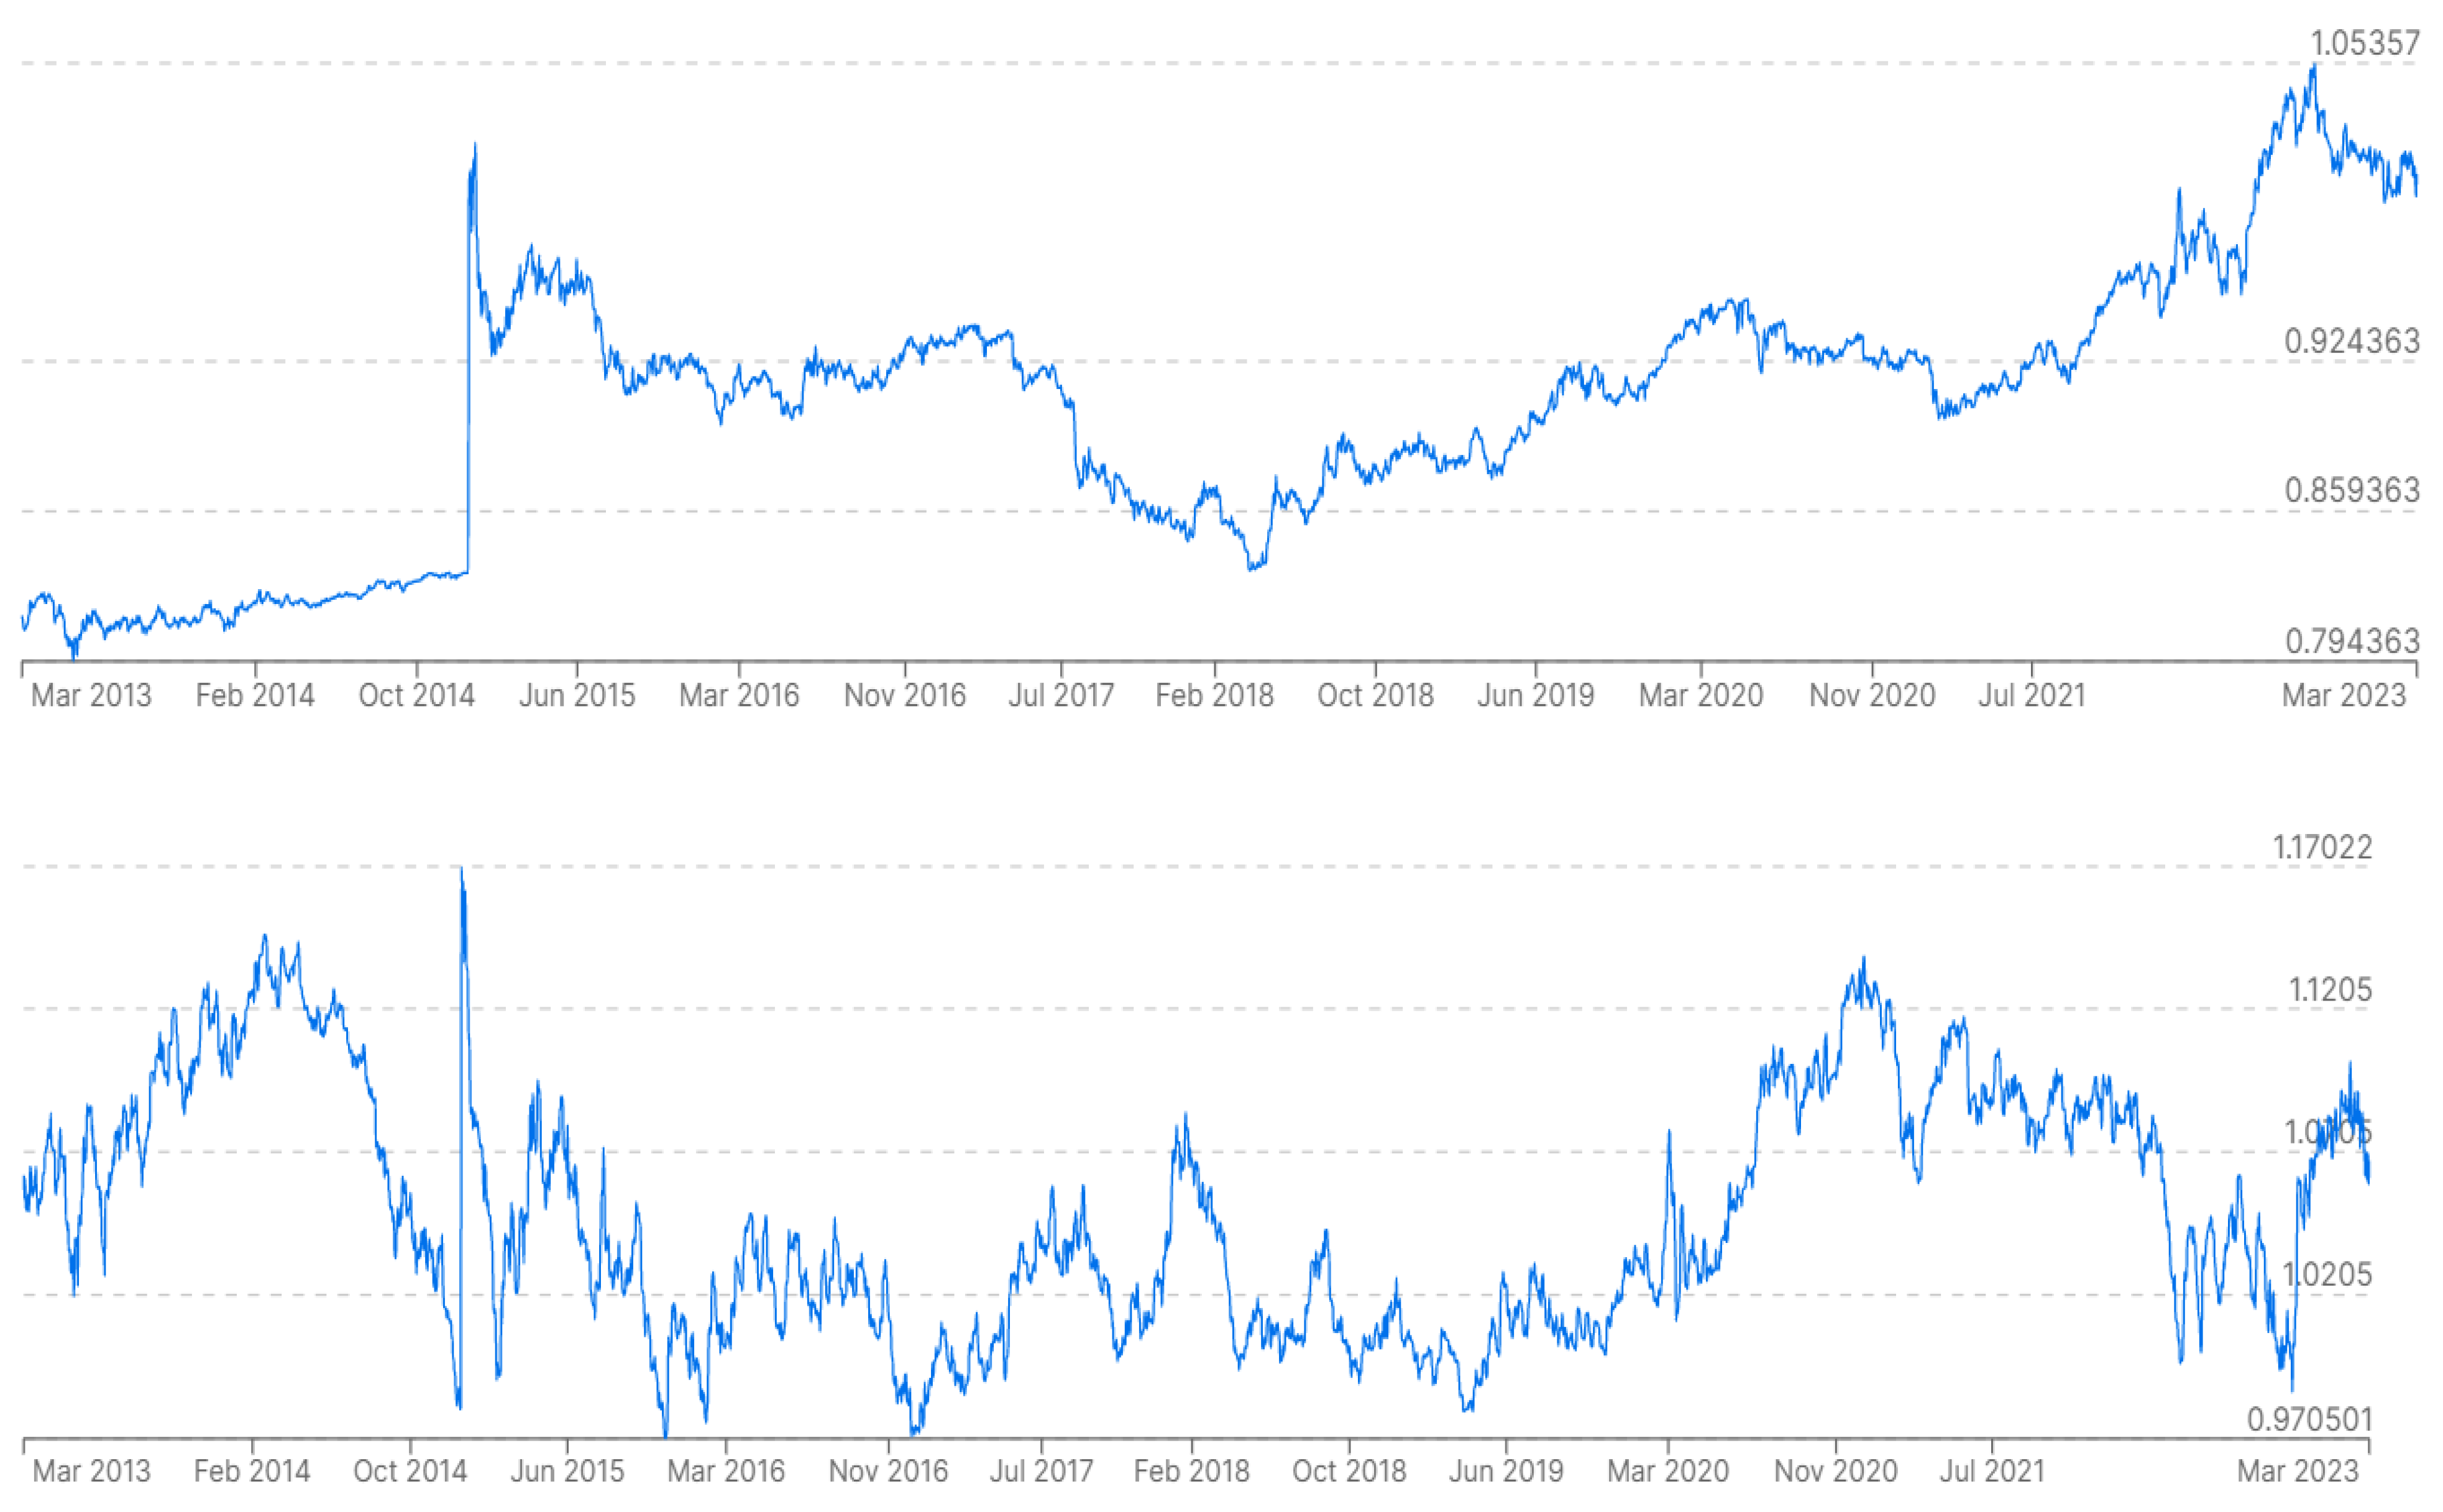
The main research aim of this article is to quantify the impact of NIR on foreign direct investment, GDP and banks’ profitability in the two aforementioned countries—Switzerland and Sweden. The countries were intentionally chosen. Although they differ in some aspects, they also have many in common. Both have a quite similar population—approximately 10.38 million inhabitants in Switzerland and 8.60 million in Sweden. Both still keep their national currency with the floating exchange regime and both currencies are considered a relatively safe haven in the case of financial turmoil (Fabozzi and Jones 2019). They are also quite similar in their relationships with the European Union (EU)—Sweden is a full member, but is not part of the Eurozone; whilst Switzerland is not a member state of the EU but remains associated with the EU through a series of bilateral treaties in which Switzerland has adopted various provisions of European Union law in order to participate in the EU’s single market, including the free movement of capital. Both countries are some of the richest states in the world: if GDP per capita measured in purchasing power parity (USD) is used, then Switzerland ranked 6th place with a value of 71,032 in 2021; Sweden was 16th with a value of 53,613 (The Global Economy 2023). Both are considered business-friendly (both were ranked a value of approximately 80 by the Doing Business evaluation in the long term, where 0 represents the lowest and 100 represents the best performance, with only a few countries obtaining a better score—see (Doing Business 2023) for details). They are also considered to have low levels of corruption: both, according to Transparency International and its Corruption Perception Index, have historically belonged the ten least corrupt countries (Transparency International 2023; Otáhal et al. 2013; Wawrosz and Valenčík 2014; Wawrosz 2019). One of the big differences concerns the share of the banking sector in GDP (=bank assets to GDP). The share of the banking sector has historically been high in Switzerland and now (2020) it represents almost 500% of GDP. In Sweden, the share is much smaller, representing approximately 160% of GDP (Helgi Library 2023).
The article has the following hypotheses:
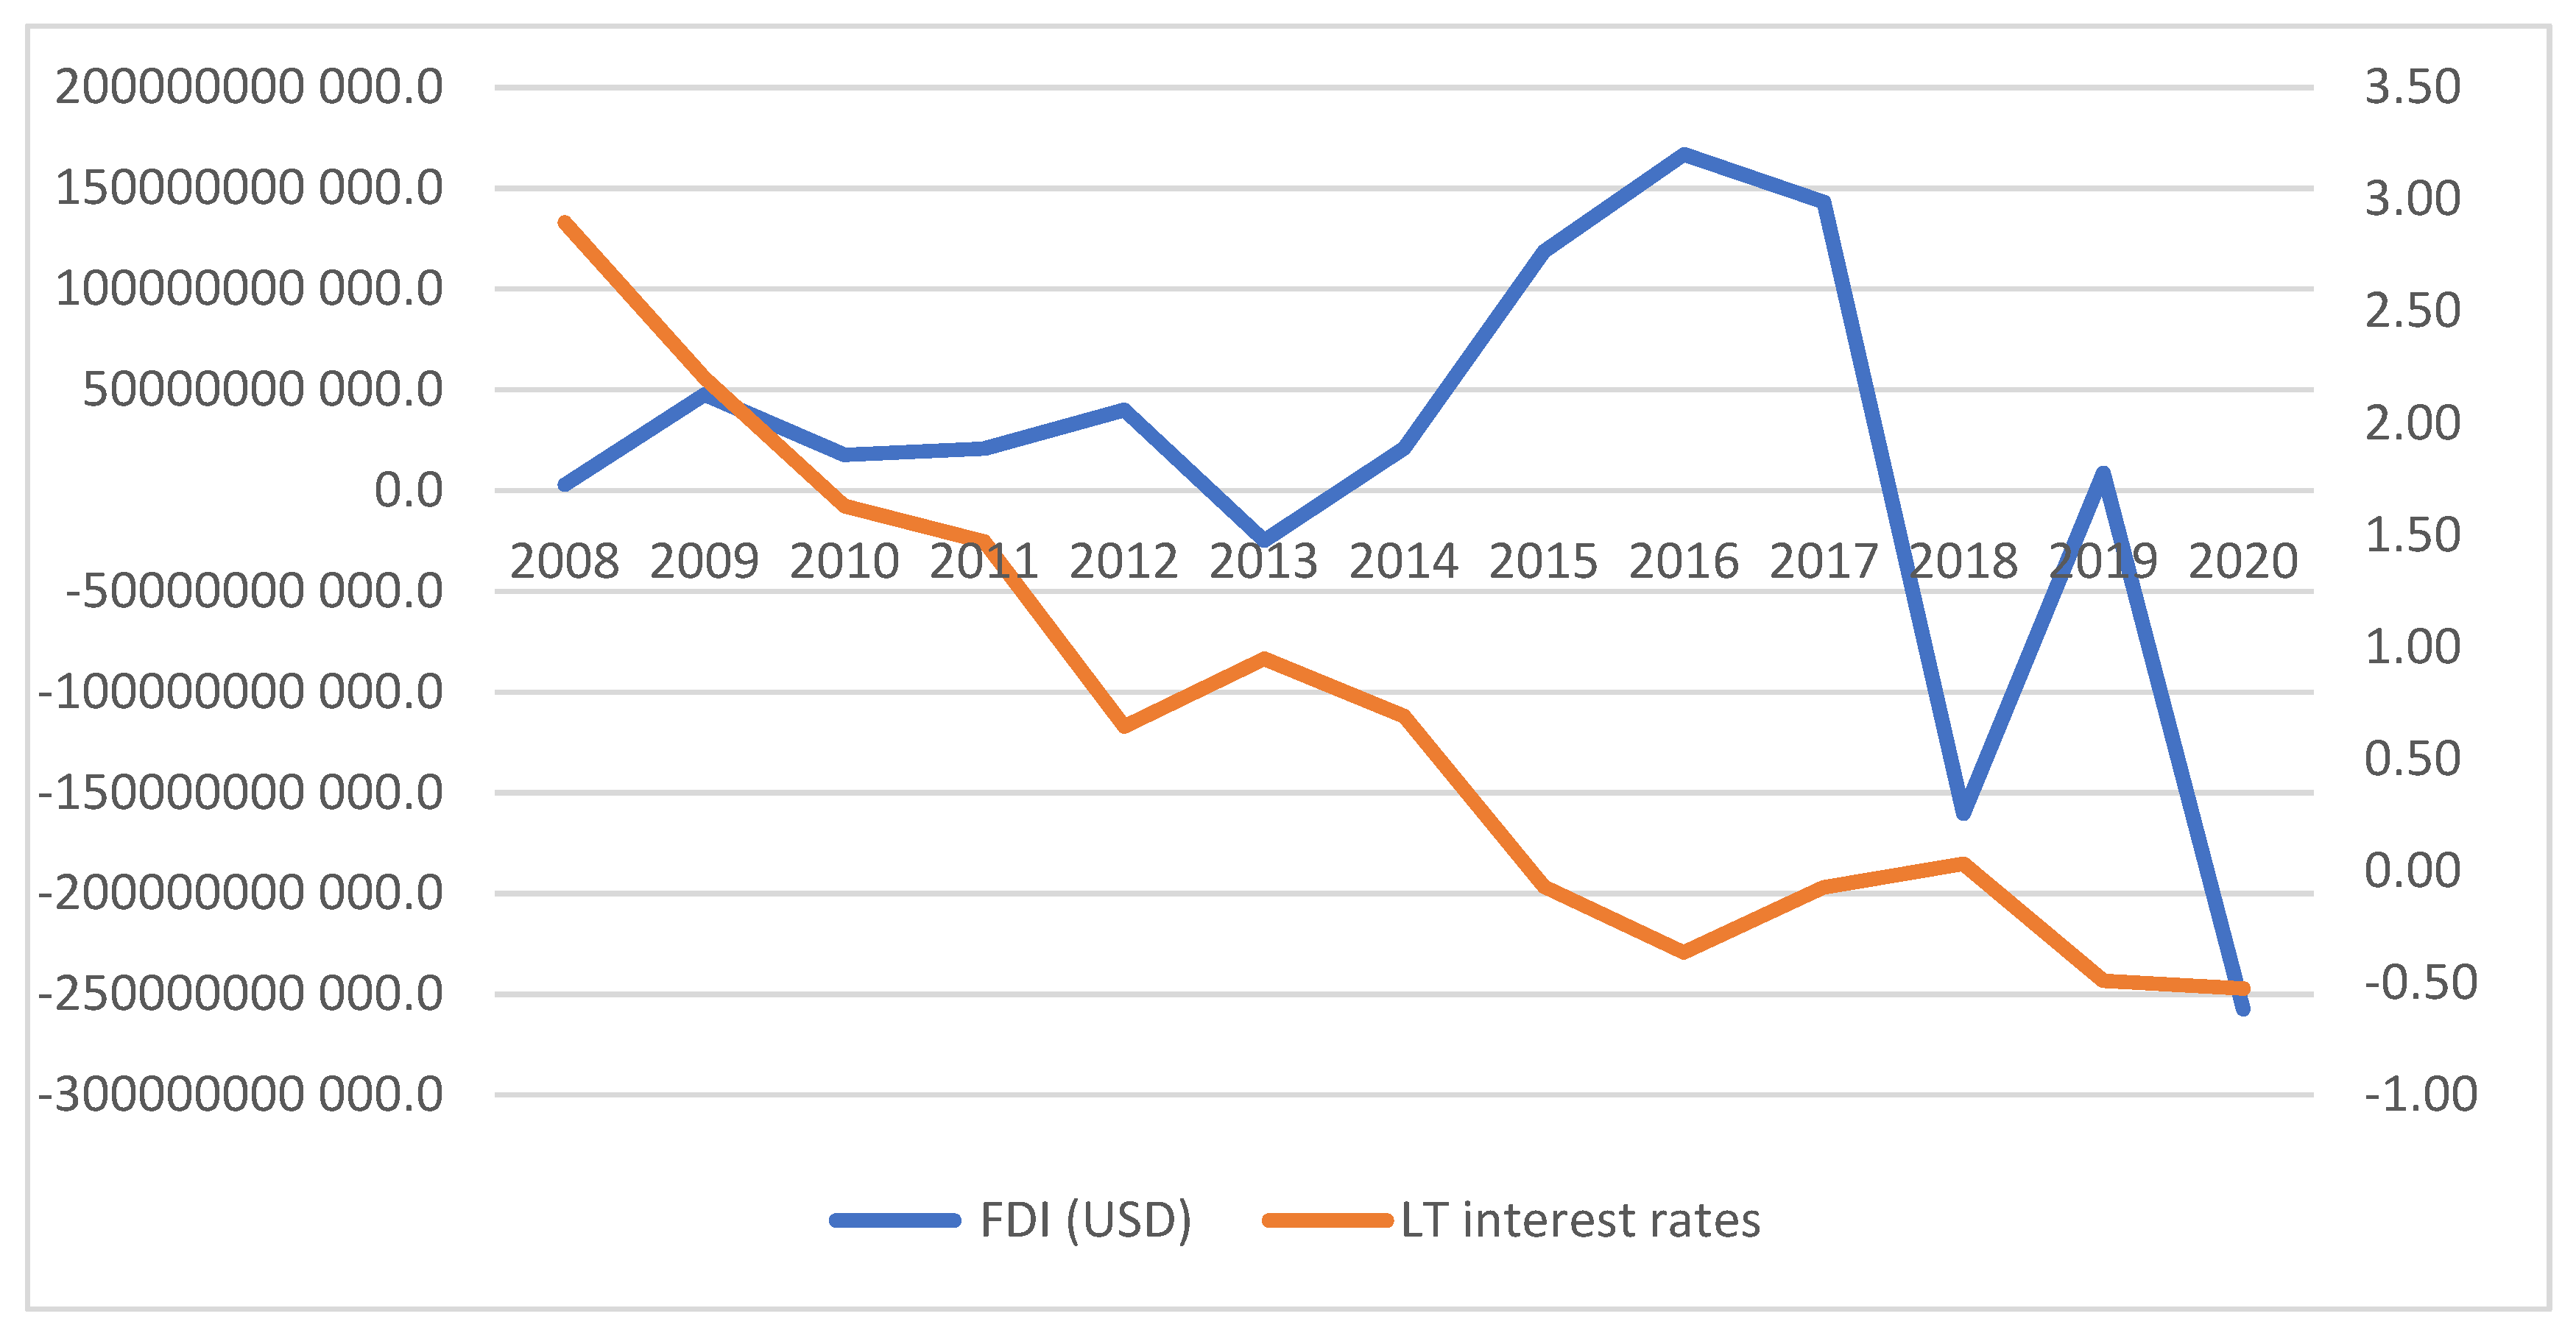
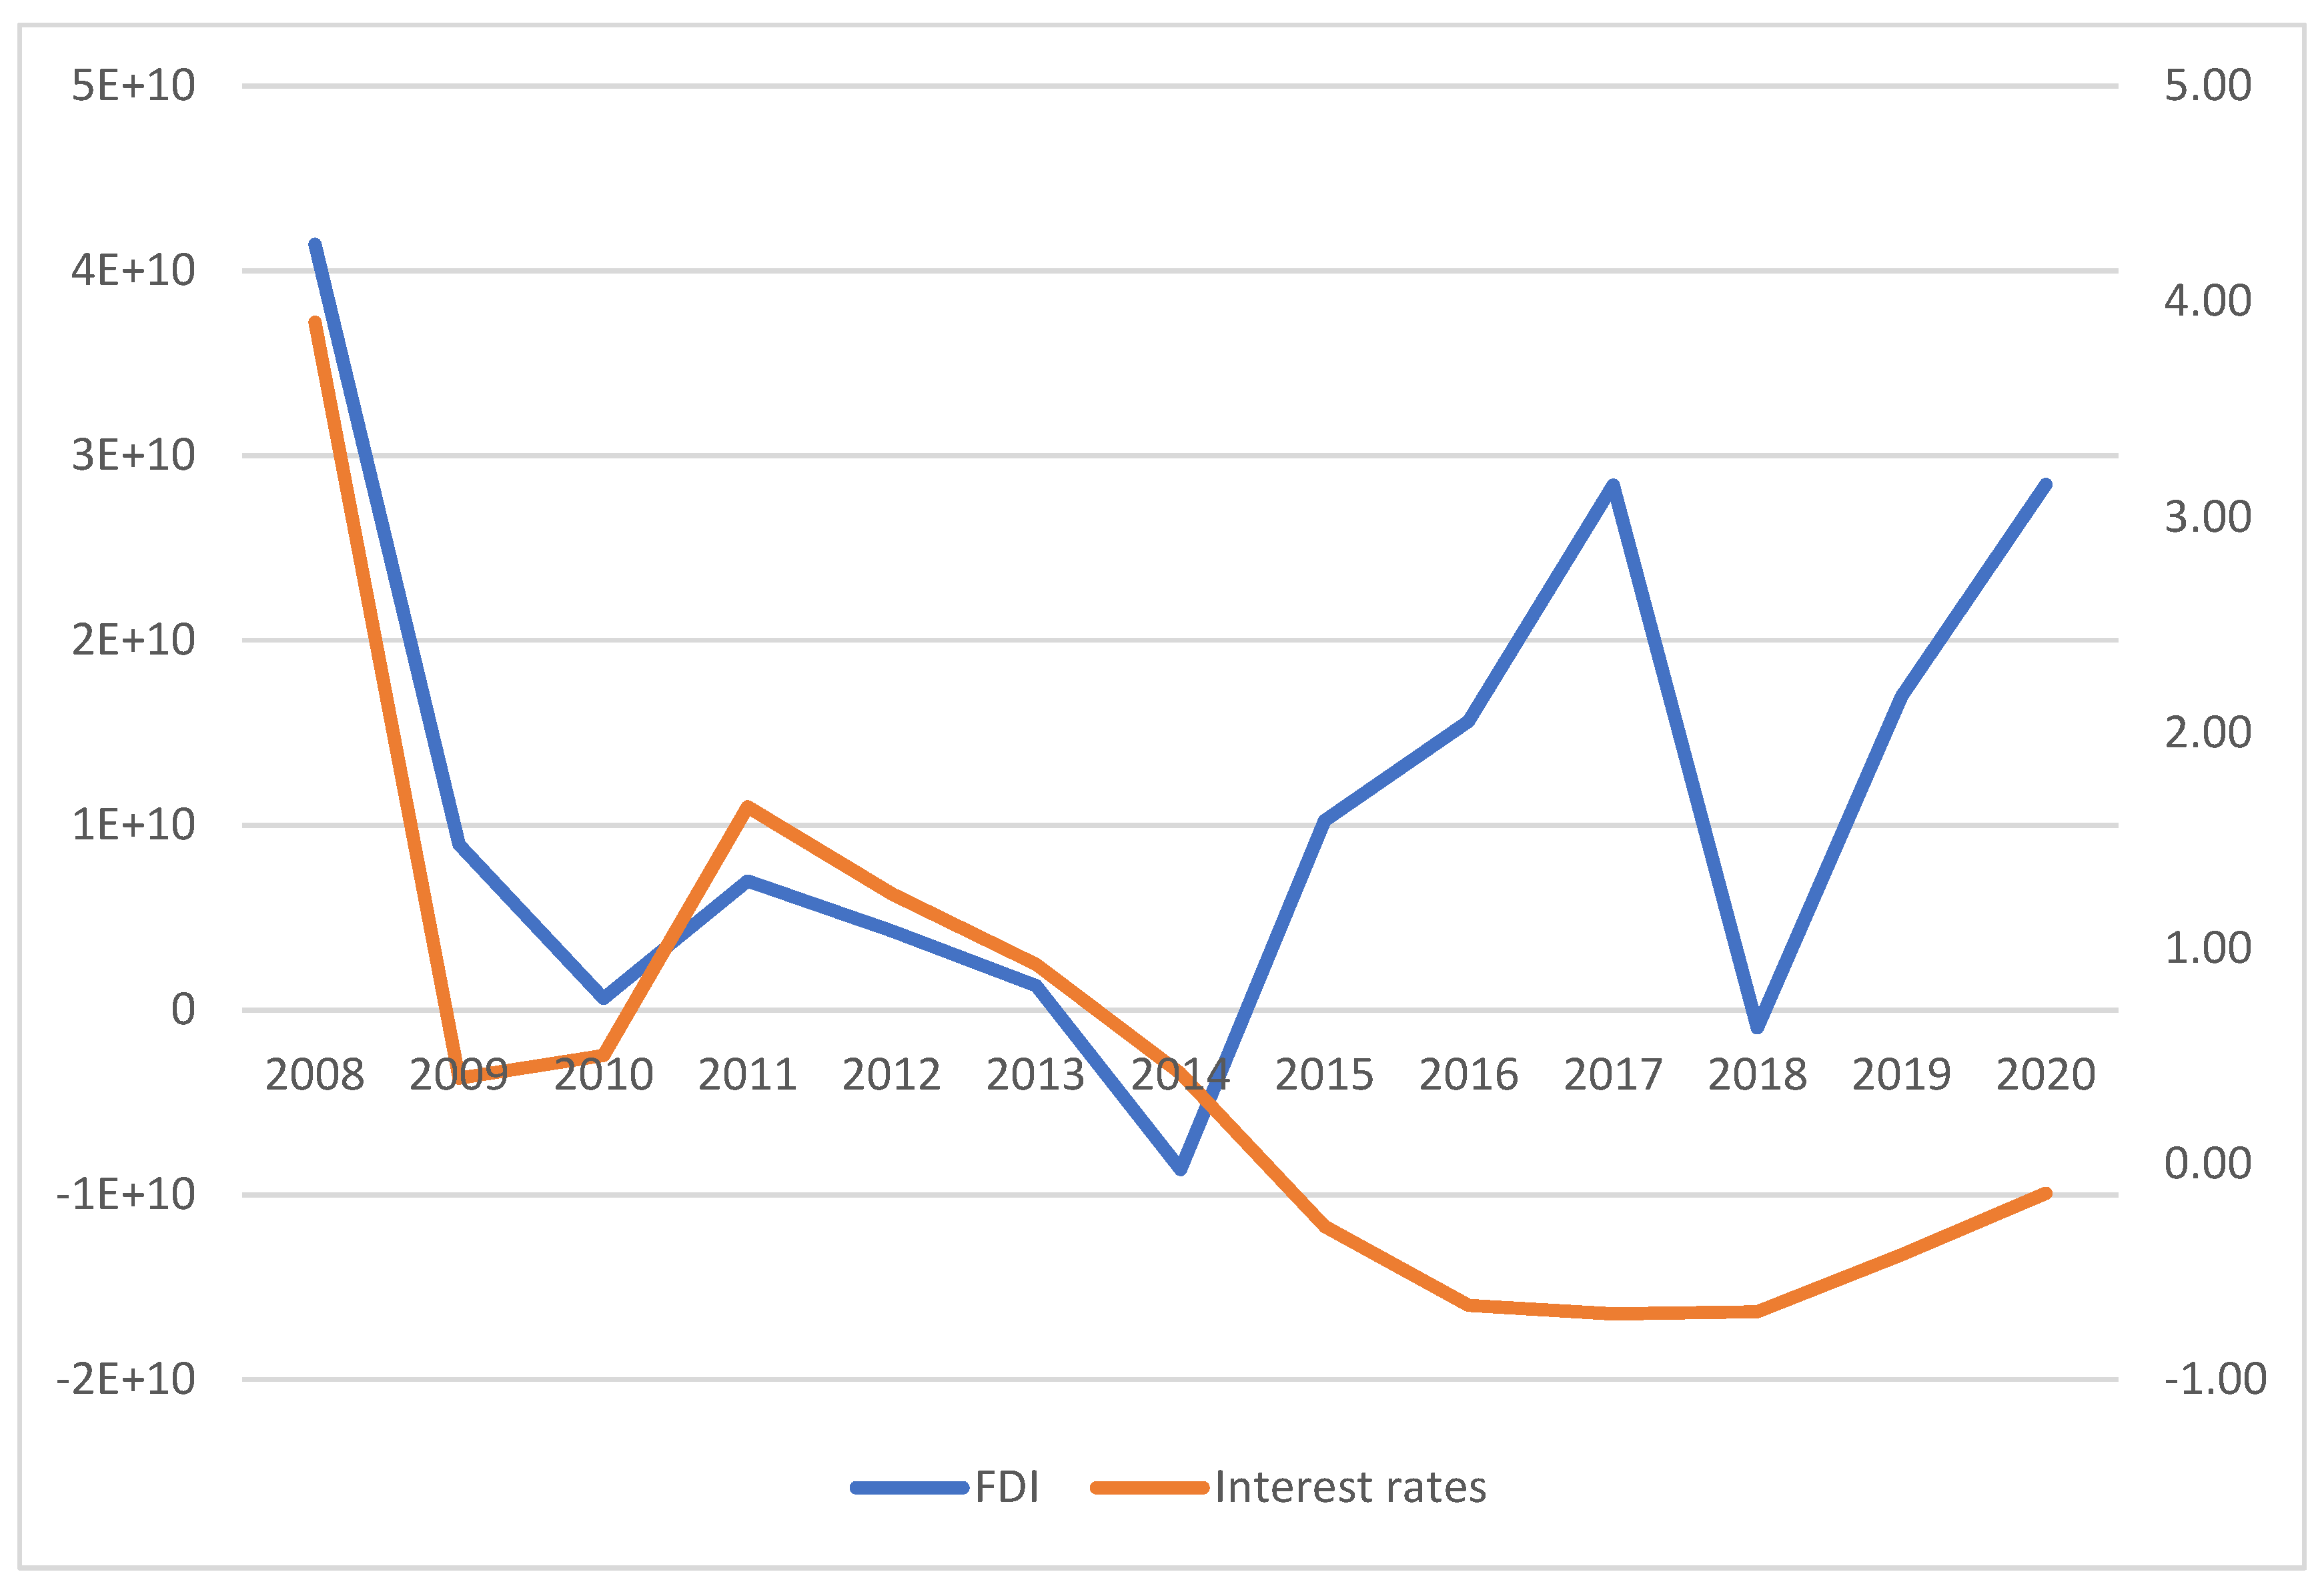
Hypothesis 1.
Decreasing interest rates cause a decrease in foreign direct investment (FDI) flowing into the country. It can be argued that lower yields connected with NIR in both countries and the fact that foreign investors had many possibilities to invest their money (sources) in other countries non-affected by NIRP during the period of NIR can outweigh other factors (some of which were mentioned above) that favor both countries for foreign investors.
Hypothesis 2.
Negative interest rates introduced by the central banks of Switzerland and Sweden helped both countries stimulate the economy (i.e., GDP growth). This hypothesis is consistent with the main NIR objective (see de Groot and Haas 2020).
Hypothesis 3.
The financial indicators of the commercial banks of Sweden and Switzerland are correlated with the interest rate. We assume that NIR affects the financial performance of commercial banks. We intentionally did not formulate in which way the indicators are affected—the formulation allows one to test both possibilities: both a positive and negative impact.
This article is organized as follows: the second chapter contains a literature review and overviews the theoretical background concerning NIRP. The third chapter introduces our materials and methods. Results are presented in the fourth chapter and discussed in the fifth chapter. The fifth chapter also extends some (especially problematic) aspects of NIRP. The conclusion summarizes main points.

2. Literature Review and Theoretical Background

For most of history, nominal interest rates have been positive. There were some theoretical attempts concerning tax holding money (negative interest rates can be seen as a form of money holding taxation, see (Ilgmann and Menner 2011) for details)—among which the most famous was that of Gesell (e.g., Gesell 1916), who introduced new notes with coupons when the coupon represented a part of the nominal value of the note and coupons lost their value over time. The suggestion was taken up by various prominent economists such as Irving Fisher (Fisher 1933) and John Maynard Keynes (Keynes 1936); however, after the second world war, the idea of NIR or other forms of money holding taxation did not play a significant role in economic thinking. Some authors (Buiter and Panigirtzoglou 1999, 2003; Goodfriend et al. 2000; Fukao 2005; Buiter 2005a, 2005b, 2007, 2009) took up Gesell’s proposal of a tax on money as a means of overcoming the zero bound on interest rates, which was seen, for instance, in the case of Japanese experience, when the country faced a liquidity trap during the 1990s (Koo 2008); however, this experience was mainly considered a curiosity and a rare exception (Ullersma 2002; Yates 2004).
The situation changed after the financial crisis in 2007 (the so-called Great Recession—see, for instance, Blanchard 2021). Due to this crisis, an increasing number of central banks (CBs) resorted to low-rate policies. Several CBs, as mentioned in the introduction, started experimenting with negative interest rates —essentially charging banks for holding their excess cash at the central bank (Haksar and Kopp 2020). In theory (European Central Bank 2014), banks would rather lend money to borrowers and earn at least some interest as opposed to being charged for holding their money at a central bank. Commercial banks cannot lower their deposit rates below zero in the same amount as the central bank since depositors have the option to substitute deposits for cash holdings (Czudaj 2020). This should lead to a higher number of loans and thus to higher investments and consumption, generally leading to a higher GDP and a positive value of inflation. With regard to GDP, Czudaj (2020) found a significantly positive effect of this unconventional monetary policy tool on GDP growth for all aforementioned countries—it was on average more than 1 percentage point higher in comparison with countries that did not adopt NIRP.
Among the most likely negatives outcomes of NIRs (for instance, Heider et al. 2019) is their effect on bank profitability. The main source of the bank’s profit is a spread, i.e., the difference between what they pay savers (depositors) and what they charge on the loans they make. When central banks lower their policy rates, the spread is reduced, as overall lending and longer-term interest rates tend to fall. When rates go below zero, banks may be reluctant to levy negative interest rates on their depositors for fear that they will withdraw their deposits. If banks refrain from negative rates on deposits, this could in principle make the lending spread negative, because the return on a loan would not cover the cost of holding deposits. This could in turn lower banks´ profitability and net worth and undermine the stability of the financial system. A fall in net worth forces banks to curtail lending. NIRP can be counterproductive if lending and thus consumption and investment really decline (Groot and Haas 2020).
The empirical results on whether NIRs reduce commercial banks´ performance are ambiguous. For instance, Bongiovanni et al. (2021), on a sample of 2584 banks from 33 OECD countries from 2012 to 2016, found that NRIP is associated with reductions in banks’ loan growth and average loan price (by 3.7 percentage points and 59 basis points) and a rebalancing of asset portfolios towards safer assets. Altavilla et al. (2022) argued that, in the case of ECB and NIR in the Eurozone, deposits on average increased during the NIRP period as households and firms were looking for liquidity and safe assets. According to the authors (p. 7): “Since there has been no broad-based outflow of deposits from banks charging negative rates, which instead appear to have attracted new deposits, the overall cost of funding of sound banks has decreased. … banks charging negative rates extend relatively more credit. These results suggest that the ECB has not reached the reversal rate, at which the negative effect of a lower interest rate on bank profits may lead to a contraction in lending and economic activity.” Boungou and Mawusi (2023) found, using a dataset of 9638 banks from 41 countries during the period 2009–2018, that bank margins have contracted in countries where negative rates were implemented. Their results suggest that, in a negative interest rate environment, the rate on loans declines faster than the rate on retail deposits. The effects of NIRP on bank lending margins were stronger for smaller, less capitalized, deposit-dependent banks. These findings are supported by the theoretical model of Brunnermeier and Koby (2019) which demonstrates that a NIRP has contractionary effects on the economy when the liquidity and capital constraints of the banking sector bind. In such a situation, the reduction in bank profits negatively affects the net worth and translates into a decline in the volume of loans.
On the other hand, Bats et al. (2023), based on the sample of European commercial banks, argue that NIRs matter for bank stock prices. The study discovered, controlling for broad stock market movements, that an unanticipated downward shift in the yield curve and a flattening of the shorter end of the yield curve resulting from monetary policy announcements persistently reduce bank stock prices in a low and especially negative interest rate environment. Bank stocks thus face a disadvantage compared to other firms listed in a stock market in the situation of NIR. The accounting data of the investigated banks further confirms that a drop in the yield curve in an NIR environment hurts banks through shrinking deposit margins. Similarly, Freriks and Kakes (2021) used data from over 300 European monetary and financial institutions from the third quarter of 2007 to the second quarter of 2019 in the Eurozone to confirm that banks´ interest margins are reduced if NIRs are introduced and banks’ profitability declines due to this reduction. Their finding does not include institutions from Greece and Cyprus as their results were affected by the financial crisis ‚Great Recession) that had hit these countries, institutions from Estonia, Latvia, Lithuania, Luxemburg, Slovenia and Slovakia were not also included due to limited availability of some data.”
The comprehensive study of Brandao-Marques et al. (2021) that investigates the effects of NIRP on financial markets, banks, households, firms and the macroeconomy concluded that lending and deposit rates decrease following the adoption of NIRPs. Based on the experience to date, bank lending volumes have risen, and bank profits have not significantly deteriorated, although there is considerable heterogeneity in the effects.
We did not find any empirical article investigating the impact of NIR on capital inflows and outflows. Some theoretical texts deal with this relationship but mainly concentrate on how NIR affects the exchange rate (e.g., Ruprecht 2020). In the case of Switzerland, Yesin (2015) investigated capital flow waves to and from this county between the first quarter of 2000 and the second quarter of 2014, i.e., before and after the financial crisis, and revealed that both inflows and outflows of private capital have become significantly less volatile in the post-crisis period than in the pre-crisis period, but the study did not research the issue of NIR. In their comprehensive and worldwide study, Forbes and Warnock (2020) mentioned that in Switzerland was the only country to experience a sharp decrease in gross capital outflows in the second decade of the 20th century, specifically between 2008 and 2017. During that period, Sweden experienced one sharp increase in gross capital inflow between 2013 and 2014, one sharp decrease in gross capital outflows between 2014 and 2015, and in opposition, one sharp increase in gross capital outflows in 2017.

3. Material and Methods

We investigated the relationship between the central bank interest rate (an independent variable) and some dependent variables such FDI (net flow), GDP, and indicators of bank performance (see below) separately for Switzerland and for Sweden using the correlations coefficient, which was calculated as (Zaiontz 2022):
r = ( x m x ) ( y m y ) / ( x m x ) 2 ( y m y ) 2 ,
where r—correlation coefficient; x—the first variable; y—the second variable; mx—the mean of x; and my—the mean of y. Based on the value r, correlation is defined (Zaiontz 2022): up to 0.2—very weak correlation; from 0.2 to 0.5—weak correlation; from 0.5 to 0.7—moderate correlation; from 0.7 to 0.9—high correlation; over 0.9—very high correlation. If the correlation coefficient is 0, both variables are linearly independent of each other. Although it can be objected that correlation statistics constitute a simple method, it still gives sufficient insight into the relationship among the investigated variables. We are aware of the fact that our data can be distorted by the serial correlation, which cannot be detected by our approach. However, we do not think that a serial correlation affects all data.
According to the theory (e.g., Dorman 2014), we assume that changes in interest rates in the economy do not immediately affect macroeconomic indicators. Therefore, within the framework of statistical analysis, it should be considered that, after the introduction of the interest rate correction, some time passes before economic subjects begin to react. We set up this time as three months. Accordingly, economic indicators will be taken one quarter later (since the calculation will be based on quarterly data). The data for analysis are taken from 2008, as the world experienced a financial and economic crisis that year, to which central banks also react by introducing monetary measures. The key indicators of bank financial performance that will be considered in this paper are described in Table 1.
When analyzing the effect of negative interest rates on financial indicators in the banking sector, it should be considered (Dorman 2014) that a temporary delay of 1 year must be observed for the financial indicators. This is the reporting period for banks, and after a year may the perspective change in the financial policy of commercial banks be reflected in financial statements. Additionally, the 1-year delay can be justified in such a way that, after the publication of new instructions from a central bank on interest rates for commercial banks, there comes a certain period for the implementation of these rates in commercial practice. After the introduction of new financial conditions, it takes some time before bank customers begin to respond to innovations. All these periods constitute a long-term reaction, so a year of delay in these banks’ financial indicator of will be an adequate period.

4. Results

4.1. Development of Interest Rates in Investigated Countries since 2008

Before analyzing each country separately, it is necessary to compare the interest rates between the two countries. Therefore, the data are shown in one figure (Figure 1). It is clear that the interest rates in both countries reached high values (from 3 to 4.3%) in 2008. Since 2008, the interest rates in all mentioned countries have gradually decreased. Figure 1 further depicts the trend line of each country. Interest rates are falling more smoothly in Switzerland, which introduced a negative interest rate in 2015. Sweden also applied negative interest rate this year. The figure also shows that, in both countries, interest rates began to rise after the pandemic years 2020–2021 as both central banks reacted to the COVID-19 crisis and inflation that was caused by this crisis (and then also intensified by the Russian–Ukraine war).

4.2. Results for Switzerland

In January 2015, the Swiss Central Bank abandoned its exchange rate commitment and at the same time took negative interest rate measures to prevent the further strengthening of the domestic currency. It reduced the overnight deposit rate (SARON) to −0.75 percent while the target corridor for the 3M CHF Inter-bank offered rate (LIBOR) was set between −0.25 and −1.25%. Switzerland has thus become the country with the “most negative” main interest rate in the world. It must be emphasized that the main reason for NIRP was the appreciation of the Swiss franc (CHF) to the euro (EUR) and US dollar (USD). In the case of euro, the exchange rate was approximately EUR 0.82 EUR for CHF 1 in autumn 2012. It soared to its peak of EUR 1.09925 in January 2015. NIR should prevent this appreciation (Pyka and Nocon 2019). The NIR was successful from that point of view, and the Swiss franc was depreciated compared both to EUR and USD after the introduction of NIR (see Figure 2, whilst other details can be also found in (Ziegler-Hasiba and Turnes 2018)).
If the appreciation trends that occurred in autumn 2014 and at the beginning of January 2015 had continued, the Swiss net export (NX) would have probably failed and the profit of exported decreased. Thorbecke and Kato (2018) counted that a 10% appreciation of the Swiss nominal effective exchange rate caused Swiss franc export prices for capital goods to fall by 4%, while the decline is more than 4% for precision instruments. The development of the Swiss net export before the introduction of NIR after this event is described in Figure 3 and it indicates that NIR and the depreciation of the Swiss franc caused by NIR introduction at least partially contributed to the increase in Swiss NX, as expressed in both USD and in percentage share of Swiss GDP.

4.2.1. Correlation between Interest Rates and Foreign Direct Investments

The basic development of the Swiss FDI (net inflows) and the central bank interest rate in the Swiss period of NIR is described in Figure 4—its left vertical axis contains the volume of FDI, and the right axis contains the value of the CB interest rate. The detailed view can be further found in Table 2. It is already clear from the figure that the NIRs did not lead to a decrease in FDI. The value of the correlation coefficient between these variables is 0.090097797, i.e., it is close to zero. This means that the two data ranges are not related, or there is a very low relationship that is not statistically significant. There is no dependence on the correlation field, which is presented in detail in Figure 5. Our first hypothesis was refuted in the case of Switzerland. Volumes of foreign direct investment do not correlate with the level of interest rates in the state. It also follows that investors or large corporations choose Switzerland for business or investment activities due to reasons other than capital appreciation.

4.2.2. Correlation between Interest Rates and GDP, Respective and Financial Indicators in Commercial Banks

The purpose of monetary policy is to stimulate investment activity and the economy. Accordingly, it is logical to assume that negative interest rates will positively affect the GDP of a country. To investigate whether this applies in the case of Switzerland, quarterly data were analyzed. Data on GDP were taken with a three-month delay (the time for the effect of changes in interest rates in the economy to manifest itself). The calculation and data for the correlation analysis are in Appendix A. A strong negative dependence was revealed, which tends towards −1 (=−0.902216314). This means that with a decrease in the interest rates in the Swiss economy, the monetary effect that is assumed by this non-conventional instrument occurs—the economy is stimulated and the real product grows. Hypothesis 2 was confirmed in the case of Switzerland.
Let´s turn to the correlation between the interest rates and financial indicators of the Swiss banking sector. Table 3 shows the Swiss data of the chosen indicators (for their description, see Table 1). The period of the analysis is 11 years, showing the periods when interest rates set up by the Swiss Central Bank were negative.
Based on the data, we counted the following correlation coefficients:
  • The correlation coefficient between the interest rates and the share of bank deposits to GDP approaches a value of −1, which gives a strong negative dependence. Specifically: a lower interest rate is connected with a higher value of the share of bank deposits to GDP. As we revealed that the NIRP has a strong negative correlation with GDP, it is clear that the denominator (i.e., GDP) in the share increases. To achieve a higher value of the share, the numerator (i.e., the banks’ deposit) must grow at a higher growth rate than GDP. From that point of view, the NIR did not discourage subjects to hold money in Swiss banks. However, exactly the opposite happened, with savers saving even more and banks having more sources for lending.
  • The correlation coefficient between the interest rates and bank net interest margin with a value of −0.91 again gives a strong negative dependence.
  • The correlation coefficient between interest rates and bank ROE (%) with a value of −0.289, i.e., a weak negative dependence.
  • The correlation coefficient between interest rates and bank ROA (%) with a value of −0.372, i.e., a weak negative dependence.
  • The correlation coefficient between interest rates and the bank cost-to-income ratio with a value of 0.552, which means a moderate positive dependence.
For Switzerland, it can thus be concluded that a strong dependence between the interest rate and bank financial indicators was only found for two indicators, and thus our second hypothesis was only partially confirmed in the case of this country.

4.3. Results for Sweden

The Swedish central bank reduced its main interest rate below zero for the years 2009 and 2010 and again in February 2015, and then held a negative main interest rate until the end of 2020. The main interest rate then equaled 0 until the beginning of 2022, when it gradually started to grow. The main reason for implementing NIR was to counteract excessively low inflation (Pyka and Nocon 2019). Its values are mentioned in Table 4 which shows the inflation increased (albeit small) after the NIR introduction. However, as Andersson and Jonung (2020) found the main factor that affected Swedish inflation during this period to be the value of euro-area unemployment, Swedish inflation falls when euro-area unemployment increases, and vice versa. The correlation between these two variables is −0.8 during the period 2009–2018. In contrast, the correlation between the Swedish inflation rate and the Swedish unemployment rate was only −0.3 during the same period. The reason for the high level integration of Sweden into the EU is the eurozone. For instance, Swedish exports increased as a share of GDP from 30 percent during the 1980s (before Sweden’s membership in the European Union in 1995) to above 50% in the second decade of the 21st century (Trading Economics 2023). The impact of NIR on Swedish inflation is thus small.

4.3.1. Correlation between Interest Rates and Foreign Direct Investment

Figure 6 shows that, until 2015, the interest rates and foreign direct investment were moving in the same direction. However, once rates fell to negative ones, foreign direct investment in Sweden began to increase. In both Sweden and Switzerland, the reduction in the central bank interest rates to negative aimed to stimulate the economy. Lower interest rates should contribute to the development of manufacturing and many other industrial sectors. This attracts foreign investors who have assessed investment opportunities in business and industry as more profitable than in other countries. However, further insights point out that the correlation coefficient r for the relationship between the interest rates and the volume of foreign direct investment (net inflows) is 0.294 for the investigated ed period, which means a low direct dependence. This means that the FDI is only slightly dependent on interest rates. Detailed information can be found in Table 5.

4.3.2. Correlation between Interest Rates and GDP and the Respective Financial Indicators in Commercial Banks

The correlation between the interest rates and GPD for Sweden was the same as that in the case of Switzerland, i.e., made for quarterly data. The calculation and data for the correlation analysis are in Appendix B. The correlation coefficient is −0.907170508 (almost the same value as for Switzerland), which means that it is very close to −1, i.e., an almost absolute negative dependence. Hypothesis 2 was confirmed in the case of Sweden.
With regard to the correlation between the Swedish interest rate and the financial indicators of Swedish banks (indicators are described in Table 6), we note that there is:
  • A strong negative correlation between the interest rate and the share of deposits to GDP in Sweden (r = −0.803846524). This means that the lesser the interest rate, the higher the ratio of bank deposits to GDP. As in Switzerland, the NIR did not discourage subjects from saving but, on the contrary, the NIR is connected with higher savings.
  • A very weak negative correlation between the interest rates and the bank interest margin (r = −0.063599). It can be said that, in the case of Sweden, the negative interest rates had no great impact on the bank’s interest margin.
  • A weak negative correlation between the interest rates and bank ROE (r = −0.4669862) as well as between the interest rates and bank ROA (r = −0.328223).
  • A very weak positive correlation between the interest rates and bank cost to margin profit (r = 0.176885238).
Our third hypothesis regarding the correlation between the interest rate and the banking indicator was only confirmed in the case of Sweden for the relationships between the interest rate and the deposits to GDP.

5. Discussion

5.1. Possible Explanations of Some Correlations

Our analysis only concerns two countries but their results differ in some dimensions. The most important finding is that both countries have strong negative correlations between the interest rates and GPD. Negative interest rates are correlated with economic growth. We also found that the negative interest rates for both countries did not correlate with foreign direct investment (net inflows). It can be logically assumed that a negative value should lead to a decline in foreign inflows to a country and an increase in outflows from a country. Switzerland and Sweden did not prove this assumption.

5.1.1. Swiss Attractiveness for Doing Business

Especially in the case of Switzerland, it can be argued that it is commonly known that the country has always been an attractive “harbor” for investors and entrepreneurs who wanted to ensure the safety of their capital. The first reason for this is (Jost et al. 2020), of course, the geopolitical and economic neutrality of Switzerland. This country is not a part of the European Union but has a free zone with EU countries. Additionally, this country has its independent currency, which allows it to manage its monetary policy. Geopolitical neutrality ensures the freedom of its decision making at the confederal and regional levels because the individual cantons of Switzerland are endowed with sufficiently strong power. Switzerland is not subject to the communitarian law of the European Union and creates its market and conditions for attracting investment and capital.
The second reason is the high level of privacy. For many years, Swiss banks have been able to keep information about their customers in absolute secrecy. However, such opportunities has been changed by international anti-money-laundering rules. In this context, Swiss financial institutions have had to slightly change their approach to privacy. Today, it is only possible to obtain information about a client’s account if there are abuses, criminal cases, and tax investigations related to the client. In all other cases, banking secrecy remains unchanged. However, Swiss banks still preserve the standards and principles of bank secrecy (The Guardian 2022).
The third reason for the attractiveness of Swiss banks is their level of technology and infrastructure. It is here that one of the world’s most developed infrastructures and extensive large-scale network connects Switzerland with the rest of Europe. The jurisdiction is particularly valued for its innovation and technological progress, with the highest ratio of patent applications to population. The jurisdiction has a huge number of world-class research institutes and a highly skilled workforce that attracts foreign direct investment from multinational corporations (Tradeclub 2022). In addition, other central banks also applied a policy of negative or zero interest rates during the investigated period, so investors had a limited portfolio of countries in which they could achieve positive returns. These returns may have been associated with risks that investors did not want to bear during the period under review.
Another important reason for which Switzerland is attractive to investors is the Swiss stock exchange. The Swiss stock exchange includes the largest securities traded on the Zurich SIX exchange. The second exchange is located in Bern—it offers most of the shares traded within the state. It is the largest stock market in Europe, offering the highest security and reliability, from which large companies benefit significantly, along with a very wide range of financial instruments for trading securities (The Swiss Stock Exchange 2022). Additionally, the Swiss Exchange (SIX) can be called the most progressive stock exchange. In 2019, it launched the world’s first exchange product for crypto investments. The value of the Amun Crypto exchange product is determined depending on the price of the four major cryptocurrencies (Ari 2019).

5.1.2. Swedish Attractiveness for Doing Business

Historically, the Swedish economy has not had the aforementioned “Swiss” factors. However, it is also interesting for foreign investors. Let us focus only on the financial and banking sector—FDI usually means an increase in bank assets. If the whole financial sector is considered, it accounts (Swedish Bankers’ Association 2023) for 4.6 percent of the Swedish GDP and employs over 100,000 individuals, representing approximately 2 percent of the total workforce. (For comparison, Swiss banks and insurance companies accounted for 9.0 percent of the Swiss GDP in 2021, and employed 212,000 people in 2022, i.e., approximately 2 percent of the total workforce, as can be seen in (Finance Swiss 2022).) However, Swedish membership in the EU and the existence of the independent Swedish krona (SEK) with a flexible exchange rate, its social policy, and its stable political environment make Sweden attractive to foreign investors too (Kushnir 2019).
The Swedish credit market is dominated by four big banks: Handelsbanken, Nordea, SEB, and Swedbank. Together, they make up just below 70% of the market (Swedish Banker´s Association (2019)). Since 2010, three out of the four largest banks lost market shares, with Nordea experiencing the biggest decline, losing around 3 percentage points. SEB is the only one of the four largest banks to have increased its market share. Small- and medium-sized banks in Sweden have collectively gained market shares since 2010 through the strong growth in lending. In total, Swedish banks have increased their credit volume by some 50% since 2010, corresponding to the average annual credit growth of some 5%. Banks outside the top seven biggest banks realized 23% of the total credit growth from 2010 to 2018, despite having a market share of approximately 13% in 2010. From an international perspective, Swedish banking customers are satisfied. In a survey from 2016, 61% responded that they were satisfied with their bank, which is above the average of the benchmark countries of 57%. Generally, it can be concluded that Swedish banking customers are offered high-quality and low-priced financial services.
The aforementioned factors outweigh the negative value of the interest rate. As has already been mentioned in the case of Switzerland, in addition, other central banks also applied a policy of negative or zero interest rates, so investors had a limited portfolio of countries in which they could achieve positive returns. These returns may have been associated with risks that investors did not want to bear during the period under review. Generally, it is also necessary to distinguish between the short- and long-term consequences of NIRP. In the short run, the FDI can be decreased because the investors are demotivated to hold money in banks where they must pay for their deposits. However, in the long run, negative interest rates stimulate the economy of a country, thus making the country attractive for investors.

5.1.3. Did Quantitative Easing Affect FDI?

DI is defined as an investment where an investor holds at least 10 percent voting power than the investee (International Monetary Fund 2013). FDI is a category of cross-border investment in which an investor resident in one economy establishes a lasting interest in and a significant degree of influence over an enterprise resident in another economy. Ownership of 10 percent or more of the voting power in an enterprise in one economy by an investor in another economy is evidence of such a relationship (OECD 2023). The long-term character of FDI should guarantee that the development is not biased by immediate factors. The period under review herein was characterized by quantitative easing (QE), among other things, when many central banks including the Federal Reserve and European Central Bank purchased securities from the open market to reduce interest rates and increase the money supply. There is plenty of literature (e.g., Bhattarai and Neely 2016; Bluwstein and Canova 2016; Bhattarai et al. 2018) arguing that QE can easily affect exchange rates, and consequently, the capital inflow and outflow. For instance, Dedola et al. (2020) found that QE has large and persistent effects on the exchange rate: The typical ECB or Federal Reserve expansionary QE announcement sample resulted in an increase in the relative balance sheet of approximately 20% and, in turn, in a persistent exchange rate depreciation of approximately 7%. FDI should be at least partially resistant to such effects. QE is mainly concentrated on buying bonds and other debt assets (Rasure and Munichiello 2022), while FDI represents buying stocks and other forms of ownership. Investors in the case of FDI consider mainly long-term prosperity and future permanent yields (Moon 2015).
As stated by the International Monetary Fund (2023), FDI declined and became fragmented after the Great Recession. Global FDI declined from 3.3% of GDP in 2000 to 1.3% between 2018 and 2020. Firms and policymakers are increasingly looking at strategies for moving production processes to trusted countries with aligned political preferences to make supply chains less vulnerable to geopolitical tensions. The FDI concentrates on countries that are geopolitically aligned. The share of FDI among these countries is larger than the share among geographically close countries, suggesting that geopolitical preferences play a key role as a driver of FDI. Some abrupt geopolitical events can lead to changes in DI—for instance, in the case of Brexit. Campello et al. (2022) found that US firms exposed in the UK decreased their total investment in comparison with non-UK exposed companies. Both Switzerland and Sweden are can be considered stable democratic countries from this point of view, with the highest protection of ownership rights, qualified labor force, and economic growth. All these factors contribute to FDI inflows to both countries (OECD 2021, 2022), even in the case of NIR. Our results confirm the finding of Danthine (2018) that countries that are seen as a safe currency haven can have a negative difference between their interest rates and the interest rates of other countries, even in the case of NIR.

5.1.4. Factors Affecting Banks’ Performance

With regard to the issue of how negative interest rates correlated with the financial performance of commercial banks, we revealed a correlation in the case of bank deposits to GDP, net interest margin and the ratio of expenses to bank income for Switzerland. In the case of Sweden, we found only one strong (negative) correlation concerning bank deposits to GDP. As we already mentioned in the introduction, Switzerland has a much higher share of bank assets in terms of its GDP than Sweden (representing approximately 500% of the GDP in Switzerland but only 160% of the GDP in Sweden); thus, the impact of interest rates on the net interest margin will logically be higher in the case of Switzerland. The Swiss moderate positive correlation between interest rates and bank cost-to-income ratio shows that Swiss banks have not only interest rates but also other sources of revenue.
In both countries, NIRs are correlated with higher values of GDP, i.e., GDP growth. Banks´ deposits had to grow faster than GDP to achieve an increase in the value of banks´ deposits to GDP. NIR did not have an effect on the willingness of subjects to save and did not contribute to withdrawing money from the banks in either country. Despite the differences in the other indicators of banks´ performance indicators and their correlation with NIRs, it seems that the NIR stimulated economic demand, making Switzerland or Sweden more attractive to domestic and foreign investors. Investing capital in stock activity and industry stimulates the demand for credit products in banks and increases the profits that banks receive from these products and investment activity. Furthermore, this leads to an increase in the country’s production and competitiveness, as well as economic growth. Our findings are in accordance with the finding of Basten and Mariathasan (2018) or Eggertsson et al. (2017) who discovered that both Swiss and Swedish banks increased mortgage rates and other sources of their revenue after the introduction of NIR. The negative impact of NIR on bank performance was offset by these factors. From the theoretical point of view, a cut in the policy rate which generates capital gains for banks. When liabilities have a short duration and assets have a long duration, a surprise cut in the central bank rate can decrease interest expenses without decreasing the interest income, temporarily benefiting banks (Balloch et al. 2022). Capital gains also originate from long-lived securities that increase in value after a cut in the central bank rate (Wang 2020). All these factors can only explain the weak dependence between the interest rates and banks´ ROA or ROE in both countries during the period of NIRP.
Some authors have argued that government deficits affect credit markets through a variety of channels (Silva 2021) and affect banks’ reported income (Dantas et al. 2023). However, as shown in Table 7, both countries had quite healthy developments of government surplus/deficit and government debt during the period under investigation. Yearly results of the difference between government revenues and expenditures were mostly positive. Gross government debt fluctuated in both countries at approximately 40%, i.e., well below the critical threshold, which is usually seen at 60% (e.g., Priewe 2020). In comparison with the result of other advanced economies (e.g., France, Germany, Italy, Spain, United Kingdom, United States), the Swiss and Swedish results are clearly better. All these factors can contribute to the good results of commercial banks in both countries.
As already mentioned in Section 4.2 and Section 4.3, the NIRs were introduced in both countries due reasons than other than contributing to GDP growth, and both CBs followed different goals that did not consider the development of FDI or commercial bank performance. The Swiss CB wanted to prevent the appreciation of the domestic currency, and the Swedish CB wanted to increase inflation and its expectation. If the CBs did not follow the goals (indicators) investigated in our article, they had room for their free development. This fact can also explain why NIRs did not reduce the volume of FDI in both countries and had only a partial impact on the performance of commercial banks with a seat or affiliation in Switzerland or Sweden.

5.2. Some Side Effects of Negative Interest Rates

The effectiveness of NIRPs has been broadly discussed since the policy’s introduction. Economists supporting the policy have argued that NIRPs will provide an overall positive impact through a combination of stronger credit growth, increased non-interest income, higher asset prices, and ultimately stronger aggregate demand. At the same time, this policy obviously has some weak points, as described by its critics (e.g., Illing 2018). The main objection is the following: if a country goes into more and more negative territory in terms of interest rates, at some point in time, people decide to withdraw all their money from the banking system, which subsequently causes its collapse.
Another risk of NIRP implementation is the possible failure of commercial banks to accommodate and pass negative rates on their retail customers. In case they accept the central bank’s new policy and accordingly correct their own interest rates, it inevitably means narrowing the profit margins. In this context, commercial banks which struggled to alter their business portfolio become less profitable. As a result, the level of business activity goes down along with the decreased lending volume (HSBC 2020). Commercial banks respond to this development by increasing the bank risk-taking—banks’ exposure to credit risk is heightened as they issue riskier loans to nonfinancial corporations (Brown 2020). Smaller banks have here fewer possibilities for investment and their higher risk exposure can cause their inability to satisfy the claims of customers. If the potential problems of the banks are solved by their takeover, then the bank’s concertation increases and the level of competition decreases. All these outcomes can contradict the intentions of the central bank’s policy. To avoid that, a central bank should carefully weigh measurements and also consider certain specificities of the local market.
The perverse effect on people’s savings of NIR representing a hidden tax on savers (Waller 2016; Khoury and Pal 2020) is worth mentioning as another potential side effect of NIRP. For instance, people of pre-pension age who discovered the constant state of NIRP in their country are going to save more than before to hit their pension plan’s targets. Such behavior in society would further push interest rates even lower (HSBC 2020). Consequently, this also weakens the economy, which could not be associated with desired monetary stimulus. People can start, especially in situations of the long run period of NIR, to behave differently in comparison with the period of positive interest rates resulting in undesirable microeconomic and macroeconomic effects, including a lower level of innovation (Kay 2018). The period of NIR in the second decade of the 20th century mostly did not exceed 5 years. Interest rates are now growing and they do not seem to be returning to negative values due to the current global development. From that point, the effects of NIR may only be limited, although how they contribute to current high inflation should be studied (this issue is, however, beyond our scope).

6. Conclusions

Monetary policy usually pays attention not only to inflation but also to general economic development. Different central banks select different approaches regarding the interest rates that affect the economy and the activity of commercial banks in the market. One of the tools that central banks use is the interest rate, which depends on the economic situation in the country. This article analyzed the relationship between GDP growth and the financial indicators of commercial banks in two European countries (Switzerland and Sweden) on the one hand and interest rates on the other hand for the period of negative interest rates.
As the main sources of banks’ income are 1. interest on deposits; 2. interest on loans provided; and 3. commission fees from transactions on financial markets, it was first tested whether negative interest rates affected the inflow of foreign direct investment into countries. We found no statistically significant correlation for both countries. However, we found strong negative correlations between negative interest rates and GDP in both countries. Our results indicate that NIR is being associated with undesirable effects with regard to economic growth and bank performance in Switzerland and Sweden. Furthermore, the financial indicators of banks were analyzed. In Switzerland, there was greater correlation between the changes in interest rates and the financial indicators of commercial banks than in Sweden. In some respects, this also reflects Switzerland’s special position with respect to foreign investors, their confidence in the country and its currency, which the state can regulate with the help of conventional and unconventional monetary policy instruments.
This article has intentionally only concentrated on two countries, both of which experienced NIRP, had their own currency with a flexible exchange rate, and shared close ties with European Union. It should be interesting in the next research to compare Swiss and Swedish results with situations in countries with different characteristics (for instance, countries with a similar number of inhabitants but using the euro) and to investigate how the aforementioned specifics affect the decisions of investors regarding their FDI, bank performance, the relationship between NIR and GDP, or other indicators.

Author Contributions

Conceptualization, S.T.; methodology, S.T. and P.W.; formal analysis, S.T. and P.W.; investigation, S.T.; resources, S.T.; data curation, S.T.; writing—original draft preparation, S.T.; writing—review and editing, P.W.; visualization, S.T.; supervision, P.W.; project administration, P.W.; funding acquisition, P.W. All authors have read and agreed to the published version of the manuscript.

Funding

The result was created by solving the student project “Financial sector in the third decade of the 21st century” using objective-oriented support for specific university research from the University of Finance and Administration.

Informed Consent Statement

Not applicable.

Data Availability Statement

The data used in the study come from Federal Reserve Economic Data (2022)—see the link in References.

Conflicts of Interest

The authors declare no conflict of interest.

Appendix A

Table A1. Swiss long-term interest rate and quarterly GDP, 2008–2021.
PeriodInterest Rate (%)GDP (Millions of CHF)
2008-01-013.01152,876.7
2008-04-013.27150,263.8
2008-07-012.93151,306.5
2008-10-012.38153,219.2
2009-01-012.19154,513.5
2009-04-012.40155,517.7
2009-07-012.16156,591.3
2009-10-012.06158,065.0
2010-01-011.96159,116.7
2010-04-011.65160,025.8
2010-07-011.35160,776.2
2010-10-011.56160,095.8
2011-01-011.88160,569.0
2011-04-011.89162,464.2
2011-07-011.19161,619.4
2011-10-010.92162,546.9
2012-01-010.77162,582.9
2012-04-010.68163,304.8
2012-07-010.58164,996.0
2012-10-010.56166,061.9
2013-01-010.75166,558.4
2013-04-010.81167,561.6
2013-07-011.12168,914.9
2013-10-011.12169,936.8
2014-01-010.96170,811.0
2014-04-010.78170,408.3
2014-07-010.58171,556.7
2014-10-010.45172,924.1
2015-01-01−0.02173,637.6
2015-04-010.04174,113.5
2015-07-01−0.09175,482.3
2015-10-01−0.21176,140.2
2016-01-01−0.38177,002.4
2016-04-01−0.35177,238.2
2016-07-01−0.51177,558.8
2016-10-01−0.21178,653.2
2017-01-01−0.13180,402.6
2017-04-01−0.09182,647.0
2017-07-01−0.01184,358.7
2017-10-01−0.06183,464.2
2018-01-010.09184,062.2
2018-04-010.03184,635.5
2018-07-010.04185,427.6
2018-10-01−0.03186,285.4
2019-01-01−0.27187,135.6
2019-04-01−0.40184,379.2
2019-07-01−0.78172,962.8
2019-10-01−0.52184,056.6
2020-01-01−0.63184,129.1
2020-04-01−0.47183,618.9
2020-07-01−0.48187,033.9
2020-10-01−0.52190,831.5
2021-01-01−0.32191,134.1
2021-04-01−0.18192,071.9
Source: own work based on Federal Reserve Economic Data (2022).

Appendix B

Table A2. Swedish long-term interest rate and quarterly GDP, 2008–2021.
PeriodInterest Rate (%)GDP (Millions of EUR)
2008-01-014.01886,804.4
2008-04-014.22855,432.6
2008-07-014.13842,791.8
2008-10-013.19843,320.0
2009-01-012.89842,879.9
2009-04-013.46846,781.9
2009-07-013.40869,419.8
2009-10-013.25887,252.6
2010-01-013.28898,049.8
2010-04-012.83912,593.8
2010-07-012.56915,876.1
2010-10-012.90918,796.7
2011-01-013.35930,804.7
2011-04-013.07917,823.4
2011-07-012.25919,434.3
2011-10-011.76920,798.7
2012-01-011.85919,571.5
2012-04-011.59913,150.7
2012-07-011.43925,805.4
2012-10-011.50924,820.7
2013-01-011.91929,009.3
2013-04-011.83935,640.7
2013-07-012.37943,338.6
2013-10-012.38951,115.6
2014-01-012.25957,859.7
2014-04-011.91965,309.3
2014-07-011.56978,929.1
2014-10-011.15988,664.1
2015-01-010.661,002,279.0
2015-04-010.691,009,688.6
2015-07-010.731,009,156.2
2015-10-010.801,009,620.8
2016-01-010.791,012,720.2
2016-04-010.701,021,494.1
2016-07-010.161,026,415.1
2016-10-010.431,039,785.8
2017-01-010.671,049,540.4
2017-04-010.531,051,1,03.1
2017-07-010.641,055,369.2
2017-10-010.791,066,462.0
2018-01-010.841,058,048.9
2018-04-010.641,071,443.4
2018-07-010.541,077,452.7
2018-10-010.581,083,951.9
2019-01-010.361,085,957.2
2019-04-010.071,089,597.1
2019-07-01−0.211,088,009.0
2019-10-01−0.031,000,284.3
2020-01-01−0.041,074,172.9
2020-04-01−0.051,073,287.0
2020-07-01−0.061,090,492.8
2020-10-01−0.011,098,788.3
2021-01-010.241,120,808.0
2021-04-010.381,133,742.8
2021-07-010.191,124,585.1
Source: own work, based on Federal Reserve Economic Data (2022).

References

  1. Altavilla, Carlo, Lorenzo Burlon, Mariassunta Giannetti, and Sarah Holton. 2022. Is there a zero lower bound? The effects of negative policy rates on banks and firms. Journal of Financial Economics 144: 885–907. [Google Scholar] [CrossRef]
  2. Andersson, Frederik N. G., and Lars Jonung. 2020. Lessons from the Swedish Experience with Negative Central Bank Rates. Cato Journal 40: 595–612. [Google Scholar]
  3. Ari, Corinne. 2019. Swiss Stock Exchange Launches World’s First Crypto Index Product. Available online: https://www.s-ge.com/en/article/news/20184-fintech-amun (accessed on 8 May 2023).
  4. Arteta, Carlos, Ayhan Kose, Marc Stocker, and Temel Taskin. 2016. Negative Interest Rate Policies, Sources and Implications; Policy Research Working Paper 7791. World Bank Group. Available online: https://openknowledge.worldbank.org/bitstream/handle/10986/25036/Negative0inter0ces0and0implications.pdf?sequence=1&isAllowed=y (accessed on 8 May 2023).
  5. Balloch, Cynthia, Yann Koby, and Mauricio Ulate. 2022. Making Sense of Negative Nominal Interest Rates. Working Paper 2022-12 Federal Reserve Bank of San Francisco. [CrossRef]
  6. Basten, Christoph, and Mike Mariathasan. 2018. How Banks Respond to Negative Interest Rates: Evidence from the Swiss Exemption Threshold; CESifo Working Paper Series, No. 6901. Munich: CESIfo. Available online: https://ssrn.com/abstract=3164780 (accessed on 8 May 2023).
  7. Bats, Joost V., Massimo Giuliodori, and Aerdt C. F. J. Houben. 2023. Monetary policy effects in times of negative interest rates: What do bank stock prices tell us? Journal of Financial Intermediation 53: 101003. [Google Scholar] [CrossRef]
  8. Bhattarai, Saroj, and Christopher Neely. 2016. A Survey of the Empirical Literature on U.S. Unconventional Monetary Policy. Federal Reserve Bank of St. Louis, Working Paper 2016-21. Available online: https://files.stlouisfed.org/files/htdocs/wp/2016/2016-021.pdf (accessed on 8 May 2023).
  9. Bhattarai, Saroj, Arpita Chatterjee, and Woong Y. Park. 2018. Effects of US Quantitative Easing on Emerging Market Economies. ADBI Working Paper, 803. Available online: https://www.adb.org/sites/default/files/publication/399121/adbi-wp803.pdf (accessed on 8 May 2023).
  10. Blanchard, Olivier. 2021. Macroeconomics, 8th ed. London: Pearson. [Google Scholar]
  11. Bluwstein, Krisitna, and Fabio Canova. 2016. Beggar-Thy-Neighbor? The international effects of ECB unconventional monetary policy measures. International Journal of Central Banking 12: 69–120. [Google Scholar]
  12. Bongiovanni, Alessio, Alessio Reghezza, Riccardo Santamaria, and Jonathan Williams. 2021. Do negative interest rates affect bank risk-taking? Journal of Empirical Finance 63: 350–64. [Google Scholar] [CrossRef]
  13. Borio, Claudio, Piti Disyatat, Mikael Juselius, and Phurichai Rungcharoenkitku. 2018. The ‘Real’ Illusion: How Monetary Factors Matter in Low-for-Long Rates. Available online: https://new.cepr.org/voxeu/columns/real-illusion-how-monetary-factors-matter-low-long-rates (accessed on 8 May 2023).
  14. Boungou, Whelsy, and Charles Mawusi. 2023. Bank lending margins in a negative interest rate environment. International Journal of Finance & Economics 28: 886–901. [Google Scholar] [CrossRef]
  15. Brandao-Marques, Luis, Marco Casiraghi, Gaston Gelos, Gunes Kamber, and Ronald Meeks. 2021. Negative Interest Rate Policies: A Survey. CEPR Press Discussion Paper No. 16016. Available online: https://cepr.org/publications/dp16016 (accessed on 8 May 2023).
  16. Brown, Martin. 2020. Negative Interest Rates and Bank Lending. CESifo Forum 21: 18–23. [Google Scholar]
  17. Brunnermeier, Markus K., and Yann Koby. 2019. The Reversal Interest Rate. IMES Discussion Paper Series 19-E-0. Tokyo: Institute for Monetary and Economic Studies, Bank of Japan. [Google Scholar]
  18. Buiter, Willem H. 2005a. New developments in monetary economics: Two ghosts, two eccentricities, a fallacy, a mirage and a mythos. The Economic Journal 115: 1–31. [Google Scholar] [CrossRef]
  19. Buiter, Willem H. 2005b. Overcoming the zero bound: Gesell vs. Eisler. International Economics and Economic Policy 2: 189–200. [Google Scholar] [CrossRef]
  20. Buiter, Willem H. 2007. Is numérairology the future of monetary economics? Open Economies Review 18: 127–56. [Google Scholar] [CrossRef]
  21. Buiter, Willem H. 2009. Negative nominal interest rates: Three ways to overcome the zero lower bound. The North American Journal of Economics and Finance 20: 213–38. [Google Scholar] [CrossRef]
  22. Buiter, Willem H., and Nikolaos Panigirtzoglou. 1999. Liquidity Traps: How to Avoid Them and How to Escape Them. NBER Working Paper Series, Working Paper 7245. Available online: https://www.nber.org/papers/w7245 (accessed on 8 May 2023).
  23. Buiter, Willem H., and Nikolaos Panigirtzoglou. 2003. Overcoming the zero bound on nominal interest rates with negative interest on currency: Gesell’s solution. The Economic Journal 113: 723–746. [Google Scholar] [CrossRef]
  24. Campello, Murilo, Gustavo S. Cortes, Fabrício D’Almeida, and Guarav Kankanhalli. 2022. Exporting Uncertainty: The Impact of Brexit on Corporate America. Journal of Financial and Quantitative Analysis 57: 3178–222. [Google Scholar] [CrossRef]
  25. Czudaj, Robert L. 2020. Is the negative interest rate policy effective? Journal of Economic Behavior & Organization 174: 75–86. [Google Scholar] [CrossRef]
  26. Dantas, Manuela, Kenneth J. Merkley, and Felipe B. G. Silva. 2023. Government Guarantees and Banks’ Income Smoothing. Journal of Financial Services Research 63: 123–73. [Google Scholar] [CrossRef]
  27. Danthine, Jean-Pierre. 2018. Negative interest rates in Switzerland: What have we learned? Pacific Economic Review 23: 43–50. [Google Scholar] [CrossRef]
  28. Dedola, Luca, Georgios Georgiadis, Johannes Gräb, and Arnaud Mehl. 2020. Does a Big Bazooka Matter? Quantitative Easing Policies and Exchange Rates. Journal of Monetary Economics 117: 489–506. [Google Scholar] [CrossRef]
  29. de Groot, Oliver, and Alexander Haas. 2020. The Negative Interest Rate Policy Experiment. CESifo Forum 21: 7–12. [Google Scholar]
  30. Doing Business. 2023. Doing Business Data. Available online: https://archive.doingbusiness.org/en/data (accessed on 8 May 2023).
  31. Dorman, Petr. 2014. Macroeconomics: A Fresh Start. Berlin/Heidelberg: Springer. [Google Scholar]
  32. Eggertsson, Gauti B., Ragnar E. Juelsrud, and Ella Getz Wold. 2017. Are Negative Nominal Interest Rates Expansionary? NBER Working Paper Series, Working Paper 24039. Available online: http://www.nber.org/papers/w24039 (accessed on 8 May 2023).
  33. European Central Bank. 2014. The ECB’s Negative Interest Rate. Frankfurt: European Central Bank. Available online: https://www.ecb.europa.eu/ecb/educational/explainers/tell-me-more/html/why-negative-interest-rate.en.html (accessed on 8 May 2023).
  34. Fabozzi, Frank J., and Frank J. Jones. 2019. Foundations of Global Financial Markets and Institutions, 5th ed. Cambridge: The MIT Press. [Google Scholar]
  35. Federal Reserve Economic Data. 2022. Economic Data. Long-Term Interest Rates. St. Louis: Federal Reserve Bank of St. Louis. Available online: https://fred.stlouisfed.org/categories/22 (accessed on 8 May 2023).
  36. Finance Swiss. 2022. Swiss Financial Centre—Key Figure. April. Available online: https://finance.swiss/en/news-and-events/updated-figures-on-the-swiss-financial-centre/ (accessed on 8 May 2023).
  37. Fisher, Irwing. 1933. Stamp Scrip. Garden City: Adelphi. [Google Scholar]
  38. Forbes, Kristin J., and Francis E. Warnock. 2020. Extreme Capital Flow Movements since the Crisis. NBER Working Paper Series, Working Paper 26851. Available online: http://www.nber.org/papers/w26851 (accessed on 8 May 2023).
  39. Freriks, Jorien, and Jan Kakes. 2021. Bank Interest Rate Margins in a Negative Interest Rate Environment. DNB Working Paper, No. 721 (July 2021). Available online: https://www.dnb.nl/media/soqkaxcw/working_paper_no-_721.pdf (accessed on 8 May 2023).
  40. Fukao, Mitsuhiro. 2005. The Effects of ‘Gesell’ (Currency) Taxes in Promoting Japan’s Economic Recovery. Discussion Paper Series 94. Tokyo: Intitute of Economic Research of the Hitotsubashi University. [Google Scholar]
  41. Gesell, Silvio. 1916. Die natürliche Wirtschaftsordnung durch Freiland und Freigeld. Independently published. [Google Scholar]
  42. Goodfriend, Marvin, Ralph C. Bryant, and Charles Freedman. 2000. Overcoming the zero bound on interest rate policy. Journal of Money, Credit & Banking 32: 1007–35. [Google Scholar]
  43. Haksar, Vikram, and Emanuel Kopp. 2020. How Can Interest Rates be Negative? International Monetary Fund. Available online: https://www.imf.org/en/Publications/fandd/issues/2020/03/what-are-negative-interest-rates-basics (accessed on 8 May 2023).
  44. Heider, Florian, Farzad Saidi, and Glenn Schepens. 2019. Life below Zero: Bank Lending under Negative Policy Rates. The Review of Financial Studies 32: 3728–61. [Google Scholar] [CrossRef]
  45. Helgi Library. 2023. Bank Assets (As % of GDP). Available online: https://www.helgilibrary.com/indicators/bank-assets-as-of-gdp/ (accessed on 8 May 2023).
  46. HSBC. 2020. Negative Effects on Negative Rates. Available online: https://www.gbm.hsbc.com/insights/global-research/negative-effects-of-negative-rates (accessed on 8 May 2023).
  47. Ilgmann, Cordelius, and Martin Menner. 2011. Negative nominal interest rates: History and current proposals. International Economics and Economic Policy 8: 383–405. [Google Scholar] [CrossRef]
  48. Illing, Gerhard. 2018. The Limits of a Negative Interest Rate Policy (NIRP). Credit and Capital Markets 51: 561–85. [Google Scholar] [CrossRef]
  49. International Monetary Fund. 2013. Balance of Payments and International Investment Position Manual, 6th ed. Washington, DC: International Monetary Fund. [Google Scholar]
  50. International Monetary Fund. 2023. World Economic Outlook, April 2023. Washington, DC: International Monetary Fund. [Google Scholar]
  51. Jobst, Andreas, and Huidan Lin. 2016. Negative Interest Rate Policy (NIRP): Implications for Monetary Transmission and Bank Profitability in the Euro Area. IMF Working Paper, WP 16/172. Available online: https://www.imf.org/external/pubs/ft/wp/2016/wp16172.pdf (accessed on 8 May 2023).
  52. Jost, Cyrill, Vincent Kucholl, and Robert Middleton. 2020. The Swiss Economy in a Nutshell. Basel: Bergli. [Google Scholar]
  53. Kay, Benjamin S. 2018. Implications of Central banks’ negative policy rates on financial stability. Journal of Financial Economic Policy 10: 310–20. [Google Scholar] [CrossRef]
  54. Keynes, John M. 1936. The General Theory of Employment, Interest and Money. London: Macmillan. [Google Scholar]
  55. Khoury, Sarkis J., and Poorna Pal. 2020. Negative Interest Rates. Journal of Risk and Financial Management 13: 90. [Google Scholar] [CrossRef]
  56. Koo, Richard. 2008. The Holy Grail of Macroeconomics. Hoboken: Wiley. [Google Scholar]
  57. Kushnir, Ivan. 2019. Economy of Sweden. Independently published. [Google Scholar]
  58. Moon, Hwy-chang. 2015. Foreign Direct Investment: A Global Perspective. Singapore City: World Scientific. [Google Scholar]
  59. OECD. 2021. Economic Survey of Sweden. Paris: Organization for Economic Collaboration and Development. [Google Scholar]
  60. OECD. 2022. Economic Survey of Switzerland. Paris: Organization for Economic Collaboration and Development. [Google Scholar]
  61. OECD. 2023. Foreign Direct Investment. Available online: https://www.oecd-ilibrary.org/finance-and-investment/foreign-direct-investment-fdi/indicator-group/english_9a523b18-en (accessed on 8 May 2023).
  62. Otáhal, Tomáš, Milan Palát, and Petr Wawrosz. 2013. What is the Contribution of the Theory of Redistribution Systems to the Theory of Corruption? Národohospodářský obzor (Review of Economic Perspectives) 13: 92–107. [Google Scholar] [CrossRef]
  63. Priewe, Jan. 2020. Why 60 and 3 Percent? European Debt and Deficit Rules—Critique and Alternatives. Düsseldorf: IMK Studies. [Google Scholar]
  64. Pyka, Irene, and Alexsandra Nocon. 2019. Negative Interest Rate Risk. Atavism or Normalization of Central Banks’ Monetary Policy. Acta Universitatis Lodziensis Folia Oeconomica 3: 89–116. [Google Scholar] [CrossRef]
  65. Rasure, Erika, and Katarina Munichiello. 2022. What Is Quantitative Easing (QE), and How Does It Work? Available online: https://www.investopedia.com/terms/q/quantitative-easing.asp (accessed on 8 May 2023).
  66. Ruprecht, Romina. 2020. Negative Interest Rates, Capital Flows and Exchange Rates. University of Zurich Working Paper Series, Working Paper No. 351. Available online: https://www.econ.uzh.ch/static/wp/econwp351.pdf (accessed on 8 May 2023).
  67. Silva, Felipe B. G. 2021. Fiscal Deficits, Bank Credit Risk, and Loan-Loss Provisions. Journal of Financial and Quantitative Analysis 56: 1537–89. [Google Scholar] [CrossRef]
  68. Swedish Bankers’ Association. 2019. Competition in the Swedish Banking Sector 2019. Stockholm: Swedish Bankers’ Association. [Google Scholar]
  69. Swedish Bankers’ Association. 2023. The Swedish Financial Market. Available online: https://www.swedishbankers.se/en-us/reports/the-swedish-banking-market/the-swedish-financial-market/ (accessed on 8 May 2023).
  70. The Global Economy. 2023. GDP per Capita, PPP—Country Rankings. Available online: https://www.theglobaleconomy.com/rankings/gdp_per_capita_ppp/ (accessed on 8 May 2023).
  71. The Guardian. 2022. How Swiss Banking Secrecy Enabled an Unequal Global Financial System. TheGuardian.com. February 22. Available online: https://www.theguardian.com/news/2022/feb/22/how-swiss-banking-secrecy-global-financial-system-switzerland-tax-elite (accessed on 8 May 2023).
  72. The Swiss Stock Exchange. 2022. Six-group.com. Available online: https://www.six-group.com/en/products-services/the-swiss-stock-exchange.html (accessed on 8 May 2023).
  73. Thorbecke, Willem, and Atsuyuki Kato. 2018. Exchange rates and the Swiss economy. Journal of Policy Modeling 40: 1182–99. [Google Scholar] [CrossRef]
  74. Tradeclub. 2022. Foreign Direct Investment (FDI) in Switzerland. Available online: https://www.tradeclub.standardbank.com/portal/en/market-potential/switzerland/investment (accessed on 8 May 2023).
  75. Trading Economics. 2023. Sweden—Share of Trade with the EU: Share of Exports to EU. Available online: https://tradingeconomics.com/sweden/share-of-trade-with-the-eu-share-of-exports-to-eu-eurostat-data.html (accessed on 8 May 2023).
  76. Transparency International. 2023. Corruption Perception Index. Available online: https://www.transparency.org/en/cpi/2022 (accessed on 8 May 2023).
  77. Ullersma, C. A. 2002. The zero lower bound on nominal interest rates and monetary policy effectiveness: A survey. De Economist 150: 273–97. [Google Scholar] [CrossRef]
  78. Waller, Christopher J. 2016. Negative Interest Rates: A Tax in Sheep’s Clothing. St. Louis: Federal Reserve Bank of St. Louis. [Google Scholar]
  79. Wang, Olivier. 2020. Banks, Low Interest Rates, and Monetary Policy Transmission. European Central Bank Working Paper Series No. 2492. Available online: https://www.ecb.europa.eu/pub/pdf/scpwps/ecb.wp2492~8f029f769b.en.pdf (accessed on 8 May 2023).
  80. Wawrosz, Petr. 2019. Productive of the Service Sector: Theory and Practice of Corruption Declining. Marketing and Management of Innovations 9: 269–79. [Google Scholar] [CrossRef]
  81. Wawrosz, Petr, and Radim Valenčík. 2014. How to Describe Affinities in Redistribution Systems. In Current Trends in the Public Sector Research, Presented at the 18th International Conference “Current Trends in Public Sector Research”, 17–18th January 2014, Šlapanice, Czech Republic. Edited by Dagmar Špalková and Lenka Matějová. Brno: Masaryk University, pp. 212–19. [Google Scholar]
  82. Yates, Tony. 2004. Monetary policy and the zero bound to interest rates: A review. Journal of Economic Survey 18: 427–81. [Google Scholar] [CrossRef]
  83. Yesin, Pinar. 2015. Capital Flow Waves to and from Switzerland before and after the Financial Crisis. SNB Working Papers 1/2015. Available online: https://www.snb.ch/n/mmr/reference/working_paper_2015_01/source/working_paper_2015_01.n.pdf (accessed on 8 May 2023). SNB Working Papers 1/2015.
  84. Zaiontz, Charles. 2022. Correlation: Multiple Correlation. Available online: https://www.real-statistics.com/correlation/multiple-correlation/ (accessed on 8 May 2023).
  85. Ziegler-Hasiba, Elisabeth, and Ernesto Turnes. 2018. Negative Interest Rate Policy in Switzerland. Entrepreneurial Business and Economics Review 6: 103–28. [Google Scholar] [CrossRef]
Figure 1. Long-term (LT) quarterly interest rates in Sweden and Switzerland from 2008 to 2022. Source: own work based on Federal Reserve Economic Data (2022).
Ijfs 11 00069 g001
Figure 2. CHF exchange rate with EUR and USD. Source: www.xe.com, accessed on 8 May 2023.
Ijfs 11 00069 g002
Figure 3. Development of Swiss net exports during the period 2012–2019.
Ijfs 11 00069 g003
Figure 4. Long-term interest rates and foreign direct investments (net inflows) to Switzerland 2008–2020 (USD). Source: own work based on Federal Reserve Economic Data (2022).
Ijfs 11 00069 g004
Figure 5. Correlation of interest rates and FDI in Switzerland during the period 2008–2020, (USD). Source: own work based on Federal Reserve Economic Data (2022).
Ijfs 11 00069 g005
Figure 6. Interest rates and foreign direct investments (net inflows) in Sweden during the period 2008–2020. The left vertical axis describes the volume of FDO whilst the right vertical axis describes the level of the central bank interest rate. Source: own work based on Federal Reserve Economic Data (2022).
Ijfs 11 00069 g006
Table 1. Description of the used indicators.
Indicator Description
Bank deposits to GDP (%)The total value of demand, time and saving deposits in domestic deposit money banks as a share of GDP. Deposits include commercial banks and financial institutions that accept transferable deposits, such as demand deposits.
Bank net interest margin (%) The accounting value of the bank’s net interest revenue as a share of its average interest-bearing (total earning) assets.
Bank ROE (%)Return on the equity of banks in the country. Commercial banks’ net income to yearly averaged equity.
Bank ROA (%)Return on total assets of banks in the country. Commercial banks’ net income to yearly average assets.
Bank cost-to-income ratio (%)A bank’s operating costs are a share of the sum of interest revenue and other operating income.
This indicator is primarily used to determine the profitability of banks. It depicts the bank’s efficiency. The lower ratio, the better, and it indicates the greater profitability of banks.
Source: own processing based on Federal Reserve Economic Data (2022).
Table 2. Statistical data on interest rates and FDI (net inflows) in Switzerland from 2008 to 2020.
YearFDI (USD)Long-Term Interest Rates
20082,990,936,685.12.90
200947,658,570,354.72.20
201017,670,735,602.91.63
201120,764,483,834.51.47
201239,943,494,321.60.65
2013−24,926,465,856.60.95
201421,003,091,521.80.69
2015118,752,400,108.6−0.07
2016166,801,396,968.9−0.36
2017143,235,966,548.6−0.07
2018−160,387,834,479.00.03
20198,774,913,614.5−0.49
2020−257,336,256,171.4−0.52
Source: own work based on Federal Reserve Economic Data (2022).
Table 3. Data about the interest rates and banking financial indicators in Switzerland from 2008 to 2018.
DateInterest RatesBank Deposits to GDP (%)Bank Net Interest Margin (%)Bank ROE (%)Bank ROA (%)Bank Cost-to-Income Ratio (%)
20092.90116.60.5−42.1−1.7111.5
20102.20128.40.5−4.7−0.2106.9
20111.63131.30.65.60.396.4
20121.47139.60.68.10.475.3
20130.65150.20.7−4.6−0.399.4
20140.95160.00.95.20.380.7
20150.69163.70.95.20.481.2
2016−0.07164.30.99.20.790.8
2017−0.36167.40.82.20.291.6
2018−0.07165.81.22.70.282.7
The data regarding bank indicators are used with a 1-year delay, as described in the Materials and Methods section. That means that the interest rate of the t − 1 year and banking indicators of the year t are taken in the table. Source: own work based on Federal Reserve Economic Data (2022)
Table 4. Swedish inflation (average consumer prices, percentage change).
Year20102011201220132014201520162017201820192020
Inflation1.91.360.930.440.2090.701.131.862.031.720.65
Source: International Monetary Fund, World Economic Outlook.
Table 5. Statistical data on interest rates and FDI (net inflows) in Sweden from 2008 to 2020.
FDI (Net Inflows)Interest Rates
200841,436,553,9963.91
20098,960,871,6210.40
2010625,102,142.50.50
20116,979,353,7551.66
20124,273,531,5421.25
20131,316,837,6320.93
2014−8,624,292,9840.42
201510,254,328,595−0.29
201615,642,287,790−0.66
201728,405,674,155−0.70
2018−952,353,416.6−0.69
201916,986,432,797−0.42
202028,435,977,959−0.14
Source: own processing based on Federal Reserve Economic Data (2022).
Table 6. Data about interest rates and bank financial indicators in Sweden from 2008 to 2018.
YearInterest RateBank Deposits to GDP (%)Bank Net Interest Margin (%)Bank ROE (%)Bank ROA (%)Bank Cost-to-Income Ratio
20093.9152.011.047.100.59553,152
20100.4056.011.3511.070.34636,544
20110.5056.821.2510.340.53569,574
20121.6658.681.4817.300.50554,661
20131.2560.171.6612.100.90526,132
20140.9362.601.6814.440.65533,162
20150.4263.761.4514.110.81510,845
2016−0.2964.221.0813.130.85505,413
2017−0.6667.791.0613.600.77522,835
2018−0.7070.931.5213.450.81535,600
Source: own processing based on Federal Reserve Economic Data (2022).
Table 7. Fiscal deficit and government debt in Switzerland and Sweden.
Fiscal Deficit (−)/Surplus (+),Net Government DebtGross Government Debt
SwitzerlandSwedenSwitzerlandSwedenSwitzerlandSweden
20071.5753.33129,37813,52044,77438,977
20081.9361.92124,85214,37344,81837,511
20090.498−0.83623,33213,34943,10740,739
20100.354−0.09021,88211,65541,46638,066
20110.684−0.33822,09211,23941,89437,149
20120.235−1.11321,62511,38942,58137,499
2013−0.432−1.46320,69411,22441,96740,161
2014−0.247−1.52520,77011,14842,06944,872
20150.5460.01220,957888042,15643,739
20160.2381.03521,625660240,94642,255
20171.1301.42320,773586041,76640,730
20181.2900.81818,743431239,79038,908
20191.3410.56417,251857539,63834,894
2020−3.024−2.79120,466848743,33439,924
All indicators are in percentage of GDP. Source: International Monetary Fund, World Economic Outlook.
Disclaimer/Publisher’s Note: The statements, opinions and data contained in all publications are solely those of the individual author(s) and contributor(s) and not of MDPI and/or the editor(s). MDPI and/or the editor(s) disclaim responsibility for any injury to people or property resulting from any ideas, methods, instructions or products referred to in the content.

