Article

The Effects of Service Quality Performance on Customer Satisfaction for Non-Banking Financial Institutions in an Emerging Economy

1
College of Management, Chang Jung Christian University, Tainan City 71101, Taiwan
2
Graduate School of Business, Universiti Kebangsaan Malaysia, Bangi 43600, Malaysia
3
Arshad Ayub Graduate Business School, Universiti Teknologi MARA, Jalan Ilmu 1/1, Shah Alam 40450, Malaysia
4
Department of International Business, Chang Jung Christian University, Tainan City 71101, Taiwan
*
Authors to whom correspondence should be addressed.
Int. J. Financial Stud. 2023, 11(1), 33; https://doi.org/10.3390/ijfs11010033
Submission received: 8 November 2022 / Revised: 3 February 2023 / Accepted: 10 February 2023 / Published: 15 February 2023

Abstract

:
This study aims to explore the effects of service-quality dimensions on the customer satisfaction of non-banking financial institutions in an emerging economy by adopting the renowned SERVPERF model. To verify the proposed model, data was collected from thirteen non-banking financial institutions in Bangladesh using a questionnaire survey with a purposive random sampling method. Through the Smart PLS 2 software, the partial least squares structural equation modelling approach was used to analyze the collected data. Research findings reveal that, among the six dimensions of the revised SERVPERF model, assurance, reliability, responsiveness and tangibility have significant effects on customer satisfaction, but accessibility and empathy do not for the non-banking financial institutions in Bangladesh. According to the research results, implications and suggestions have been discussed for non-banking financial institution managers.

1. Introduction

A financial system is a mechanism to ensure economic growth in the integrated action of different financial institutions. Empirical works (Rioja and Valev 2004; Fase and Abma 2003) also support the increasing role of well-functioning and efficient financial firms in economic flourishment. In response, the financial ecosystem has been transformed more rapidly with the economy’s advancement over the past few decades. Banking and non-banking institutions have been an integral part of the financial system and play a key part in supplying the economy with financial services. Capital formations, financial liberalization, the inclusion of unaddressed communities and the widest menu of general services are the prime functions of these institutions. Although non-banks are somewhat different in the scope of their services from traditional banking institutions, they cater to diversified special financial services with a similar outlook on the public. The most lucrative services in the majority of the economy include merchant banking, green finance, Haj financing, syndicated financing and bridge financing. Unlike the bank, non-banking institutions do not rely on savings deposits but rather its loan and investment, mostly covered from other borrowed sources, including equity capital.
Non-banking financial institutions (NBFIs) can play an additional role in financial-system development compared to banks. Firstly, they could balance the maturity mismatch in the system regarding sources and uses of funds (Hossain and Shahiduzzaman 2002). Usually, banks mobilize their received short-term (liquid) deposits to the long-term (highly illiquid) funding of firms that may jeopardize the financial health and thereby the macroeconomic stability of the country. NBFIs help to correct inefficiencies in the marketplace as a remedy. Secondly, NBFIs provide special attention to the development of the capital market. Their merchant banking and bridge financing enhance the growing needs for equity/securities, which in turn increase the market capitalization and value traded compared to GDP and contributes significantly to enriching the health of the capital market (Vittas 1997). Thirdly, it positively affects price stability through governmental development efforts that are mainly sourced from captive savings, particularly in terms of provident funds and insurance. This fund is a non-inflationary that assists in eliminating stresses on the price of the economy. Finally, speedy growth in NBFIs can also affect growth in jobs, particularly through small- and medium-sized enterprises’ (SMEs’) expansion. Normally, SMEs have restricted access to bank credit because of strict collateral loan conditions. They also have limited access to the stock market. NBFIs can, on the one hand, relieve the financial constraints of small-sized loans, while on the other hand, help to increase business opportunities with an impact on job growth (Islam and Osman 2011).
In Bangladesh, the NBFI industry has been growing fast and changing the phenomenon of banking dominance. It operates 34 financial institutions in 2020, which counts for nearly half of its total size of 64. Among these NBFIs, two are wholly state-owned, one is a subsidiary of state-owned commercial banks, 15 are local (private), and the other 15 have joint ventures with foreign ownership. From December 2000 onwards, the Bangladesh Bank adopted a semi-annual loan and lease classification and provisioning scheme for NBFIs. Of the 34 financial institutions, 22 have been listed in stock exchanges so far (12 in 2006) to improve financial capacities. The total portfolio size of the NBFIs together stood at BDT670,000 million as of June 2019 (Othman and Owen 2001).
Though the numbers of NBFIs are increasing in number, there was no concomitant growth in the number of depositors in Bangladesh as expected. It is supposed to happen as the economy is growing and do so for the per capita income. Furthermore, some NBFIs are at risk of liquidation (at least one-third) due to their liquidity crunch (The Business Standard 2020). These institutions also have a problem with their sources of money. NBFIs have failed to take tangible measures to attract and satisfy customers by adopting a high-quality service approach focusing on loyal customers’ growth. Without delivering satisfactory services to the customers, NBFIs cannot create confidence in the customers.
There is a massive existing literature in various service sectors (Chonsalasin et al. 2021; Slack and Singh 2020; Peitzika et al. 2020; Phan et al. 2021; Shokouhyar et al. 2020; Umoke et al. 2020) including the banking service sector (Pooya et al. 2020; Sardana and Bajpai 2020; Fida et al. 2020; Haron et al. 2020; Khatoon et al. 2020) on service quality and customer satisfaction. Although some studies have been carried out in the Bangladeshi banking sector on the same issue (Jahan et al. 2020; Bashir et al. 2020; Rahman et al. 2020; Rashid et al. 2020), no comprehensive studies on service quality and customer satisfaction for non-banking financial institutions in Bangladesh have been found in the literature. As a result, this study aims to explore the determinants that influence customer satisfaction for the NBFIs in Bangladesh by integrating some new ideas with the existing theories. A modified model of SERVPERF for identifying links between the quality of service and the satisfaction of customers will be proposed in the study. In addition, this study also explores the link between quality of service and consumer satisfaction for the NBFIs in Bangladesh. The present research is supposed to provide a forum to address the quality-of-service problems in Bangladeshi NBFIs.
The following section will discuss the literature review and hypothesis development. The next two sections explain the research methodology and statistical analysis as well as key research results. The final section offers discussions and implications of research findings followed by limitations and suggestions for future studies.

2. Literature Review and Hypothesis Development

2.1. Service Quality

Perceived quality is a general decision or sentiment regarding service, which includes individuals’ emotional and relativistic reactions. It is a type of behavior linked to satisfaction, resulting in comparisons between expectations and insights of outcomes (Parasuraman et al. 1991). Some research suggests that quality of service can be regarded as the degree to which the company fulfils consumer requirements or desires (Barbara and Vincent 1990). It is also defined as the general belief that the programs are comparatively inferior or superior to the customer (Zeithaml et al. 1990).
The quality of goods/services is associated with the long-run performance of a company. By enhancing quality, a company expands and gains market share (Buzzel and Gale 1987). Service business requires proper delivery of customers’ experience for its development (Ali and Raza 2017). Prioritizing excellence in service could help customers be satisfied and sustained, along with empowerment and service innovation. Yet, service quality is not unidimensional but multidimensional (Amin and Isa 2008) with two underlying aspects: the core part of service and the service process component (Ali and Raza 2017). In particular, responsiveness, empathy, assurance and tangibility are related to service delivery, whereas reliability links, fundamentally, to the outcome of service (Parasuraman et al. 1991). This study assumes that service-quality dimensions are relevant and dynamic to predict customer satisfaction in the NBFI sector.

2.2. Underpinning Models of Service Quality

2.2.1. Gronroos Model

Gronroos (1988) developed a concept of service-quality paradigm, including three aspects of service quality. The first one is technical outcome, which means what customers get from contact with a service company. The second one is practical process, which implies how customers receive technical support, and the third one is the corporate image, which is the company vision perceived by customers. Customers’ expectations are informed by their opinions towards the firm and how customers view the firm’s services. Therefore, technological quality and process quality construct the image.

2.2.2. Gap Theory of SQ (SERVQUAL)

Based on Gronroos’ (1988) disconfirmation model, Parasuraman et al. (1985) proposed a new service-quality assessment model by comparing the perceived and planned service distance. They defined gaps as the differences between customer expectations and management perceptions, including the service expectations–specifications gap, service distribution gap, service information gap and consumer expectation–perception gap. Parasuraman et al. (1988) updated the model, branding it SERVQUAL. This model was updated in 1991 and 1994 but remained the same as the five dimensions initially implied.
SERVQUAL was designed to quantify gaps between client expectations and beliefs in their original model (Rashid et al. 2020; Parasuraman et al. 1991). The model is vital to measure the gaps in customer-centric quality measurement (Parasuraman et al. 2002). The most widely criticized quality of service sin academia (Babakus and Boller 1992; Cronin and Taylor 1992; Seth et al. 2005) has yet been received attention due to its ease of understanding and applicability (Schneider and White 2004). The following is the equation used in the model:
S Q i = j = 1 n ( P i j E i j )
where SQi = perceived service quality of individual ‘i’, k = a number of service items, P = perception of individual ‘i’ with respect to the performance of a service firm attribute ‘j’ and E = service quality expectation for attribute ‘j’ that is the relevant norm for individual ‘i’.

2.2.3. SERVPERF Model

Cronin and Taylor (1992) proposed a refined model in 1992, which sees performance as the only aspect to be assessed for service quality. They concluded that service quality is a customer mindset, and service efficiency (perceived service) is the only indicator of service quality. According to the research examining service quality relationships with customer satisfaction and purchasing intention, they think service quality is a precedent of consumer satisfaction. In this new paradigm, Cronin and Taylor (1992) continued to assess performance (perceived service) with the same measurements as reliability, responsiveness, assurance, tangibility and empathy for calculating service quality instead of “expectation-perception” discrepancy. The following is the equation used in the model:
S Q i = j = 1 n P i j
where SQi = service quality performance of individual ‘i’, k = a number of attributes/items and P = perception of individual ‘i’ with respect to the performance of a service firm on attribute ‘j’.
In terms of its methodology, the SERVPERF scale is a significant advancement over its predecessor, the SERVQUAL scale (Jain and Gupta 2004). Not only is the scale better because it cuts the number of things that need to be measured by 50%, but it has also been shown to be better than the SERVQUAL scale because it can explain more differences in the overall quality of service measured by a single-item scale (Jain and Gupta 2004). This helps to explain why there has been such a substantial amount of support developed over time in favor of the SERVPERF scale (Hartline and Ferrell 1996; Gotlieb et al. 1994).

2.2.4. CARTER Model

The six-dimensional CARTER model is the extension suggested by SERVQUAL (Parasuraman et al. 1988). Othman and Owen (2001) built a CARTER model to assess service quality against customer loyalty in the Islamic banking industry. The model has six dimensions: reliability, compliance, tangibility, assurance, responsiveness and empathy.
The present study will follow the SERVPERF model due to its suitability in collecting data only based on the performance of services and also its applicability in the financial service sector. This study also includes the accessibility dimension for a better understanding of the service quality and its effect on satisfaction.

2.3. Customer Satisfaction

One of the oldest and most commonly used words in marketing literature is customer satisfaction. Satisfaction is a positive reflection of the customer based on the consumption or use of a product or service (Boonlertvanich 2019). It tests consumer precision and expectation of the product or service consumed and determines whether the product or service output will meet customers’ expectations (Ong et al. 2017). If the product or service fails to satisfy the customer’s desires or wishes, the customer will remain disappointed, and alternatively, the customer will be pleased and fulfilled (Nguyen et al. 2020). Ultimately, customer satisfaction can help a company reach customer loyalty and goodwill (Anderson and Sullivan 1993).

2.4. Service Quality and Customer Satisfaction

The satisfaction of customers and quality of service are closely connected. Satisfaction is higher when the quality of service is high and vice versa. The level of service quality is the primary gateway to achieving customer satisfaction (Caruana et al. 2000; Devesh 2019). Cronin and Taylor (1992) suggested that customer satisfaction typically emerges before service quality, and quality of service is the only one factor contributing to customer satisfaction. The positive relationship between service quality (SQ) and customer satisfaction (CS) has been tested by several researchers in the service-quality domain, including banks (Peng and Moghavvemi 2015; Jamal and Naser 2002; Anderson and Sullivan 1993). As a result, the research framework of the present study is shown in Figure 1.
Although SERVQUAL and SERVPERF are identical in terms of dimensions and items, there are differences in their application in empirical research. SERVQUAL is an original model which is later adopted for developing SERVPERF. Unlike the SERVQUAL model, the SERVPERF model does not consider the gap identification (expectation–performance gap). It tested the service quality performance only excluding the expectation option in the questionnaire (Jain and Gupta 2004). Thus, the current study only used the performance of service referring to the SERVPERF model.
The ten dimensions, responsiveness, reliability, capacity, accessibility, courtesy, communication, credibility, tangibility, security and customer understanding, were initially used in SERVQUAL and later reduced into five from universal empirical experiments in the SERVPERF model (Parasuraman et al. 1988; Zeithaml et al. 1990). In this research, the accessibility dimension has been taken (Oppewal and Vriens 2000; Kamilia and Jacques 2000) as it seems important in financial service industries, particularly for developing economies like Bangladesh, where hassle-free accessibility to services is a fundamental issue. The adopted model not only follows the initial 22 SERVPERF items (Rasyida et al. 2016), but during the design of the test instrument, items were added and removed, resulting in 31 total items. The reason for experimenting with more items with 22 items is for the new contexts.
In Bangladesh, non-banking institutions are not well flourished compared to the banking streams. Many of the services are restricted to be rendered such as current deposits, FX services, no ATM services etc. In terms of facilities rendered to customers, it is not similar to developed countries and it is even insignificant compared to the banking sector in Bangladesh. Thus, it operates with limited resources. The employees are also underpaid (less skilled) and operate with minimal use of modern equipment. That is why we would like to experiment with new constructs and additional items to fit the situation that would better match to assess the service quality in the NBFIs.

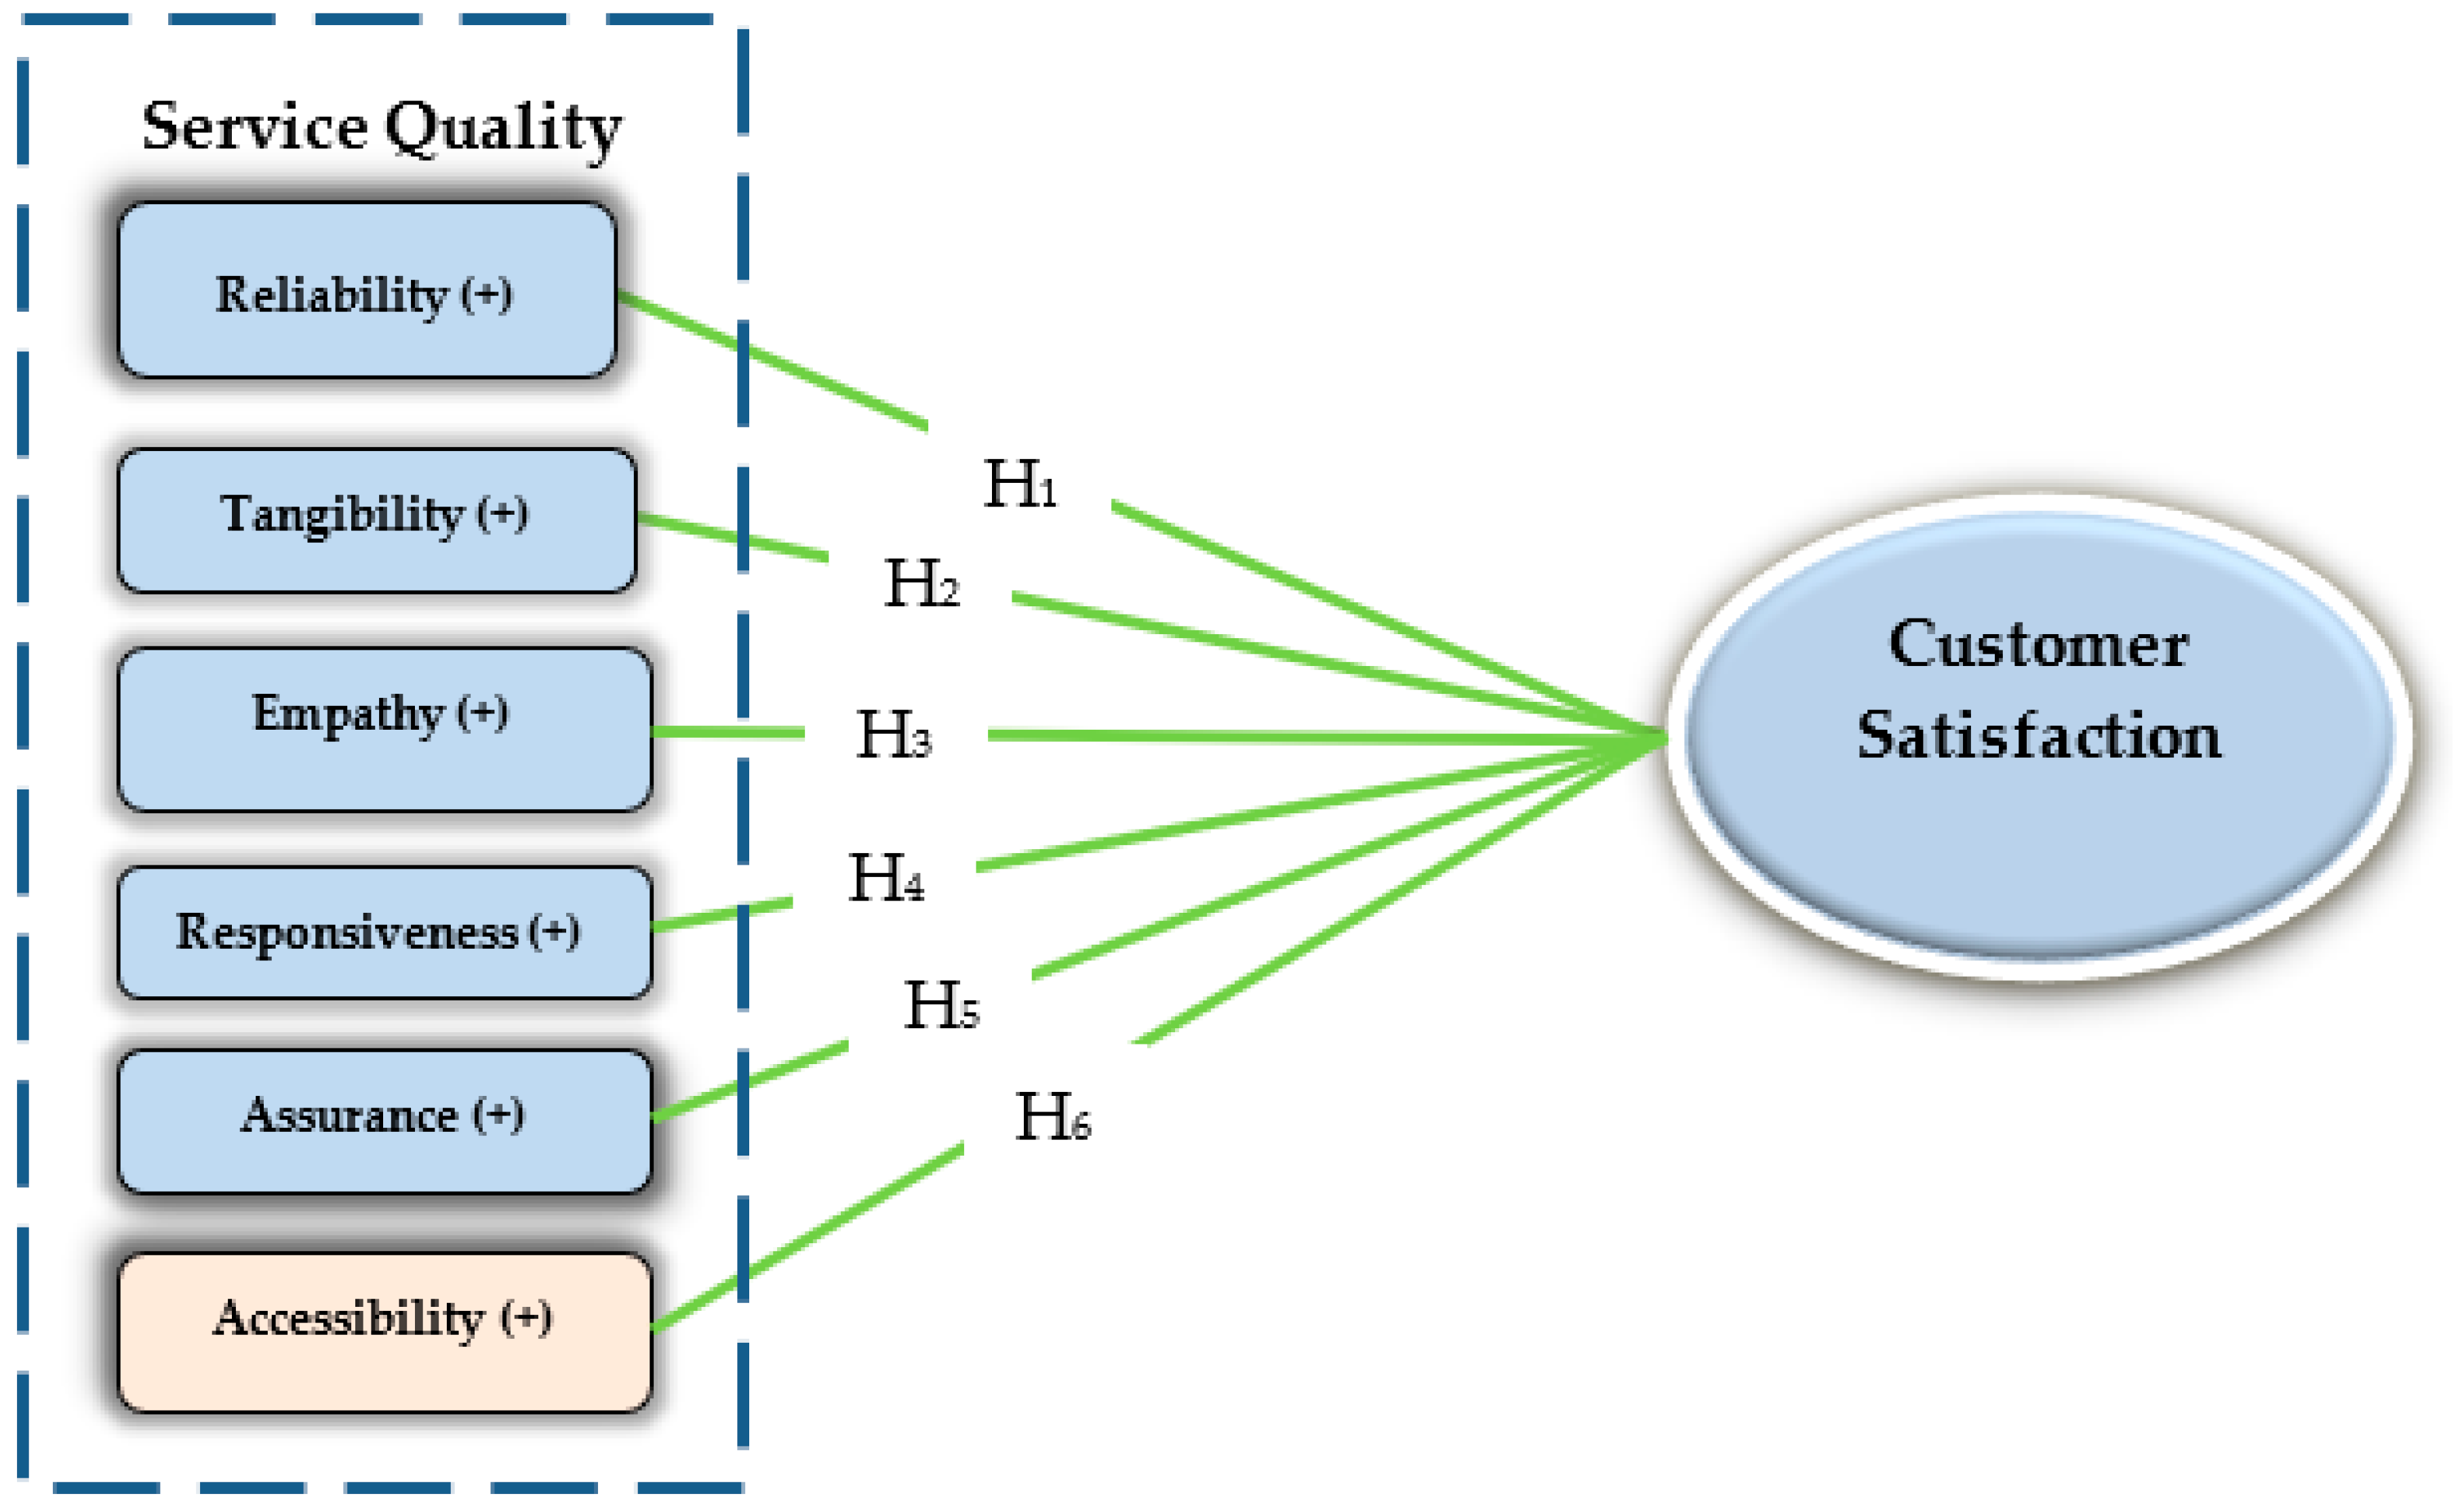
2.5. Hypothesis Development

2.5.1. Reliability

Reliability is regarded as one of the critical variables of customer-satisfaction levels under service-quality dimensions (Zhang et al. 2019). Reliability represents the willingness to deliver the services promised and complements operation accuracy (Devesh 2019). Accuracy and consistency of service delivery are the prime features of any reliable service (Blut 2016). Customers will not be subjected to service standards if they believe that the service is inadequate (Hamzah et al. 2017). As per Peng and Moghavvemi’s research (Peng and Moghavvemi 2015), the determining factors for maintaining customers in the banking industry are processing the customer order on time, keeping the customer’s financial records secure, supplying reliable financial reports and delivering guaranteed services; these are reliability’s basic qualities. The research conducted by Pakurár et al. (2019) established a strong connection between reliability and customer satisfaction in the Jordanian banking sector. Previous studies have demonstrated a positive correlation between dependability and customer satisfaction in the banking industry (Kant and Jaiswal 2017; Krishnamurthy et al. 2010; Peng and Moghavvemi 2015). Nonetheless, Islam et al. (2020) and Fida et al. (2020) found that there was no correlation between reliability and customer satisfaction. In Bangladesh, Khan et al. (2021) explored the positive relationship between the reliability of mobile-banking services and customer satisfaction. According to the above discussion, the following hypothesis is proposed:
H1. 
Reliability positively affects customer satisfaction in the NBFIs.

2.5.2. Tangibility

Tangible features of services, such as physical equipment, model equipment, dressed workers and aesthetically pleasing materials, can be used to describe the tangibility aspect of service quality (Parasuraman et al. 1985). According to (Gatari 2016), banks’ tangible structures include a bank lobby, customer seating arrangement, sitting rooms and buildings. These assets will have an impact on customer satisfaction with the bank’s quality of service. Studies have found that tangibility has a positive impact on customer satisfaction in the banking sector (Olorunniwo et al. 2006). It is widely acknowledged that tangibility has a significant effect on customer satisfaction in the banking industry (Kant and Jaiswal 2017). In addition, Krishnamurthy et al. (2010) and Selvakumar (2015) both noted that tangibility has a positive influence on customer satisfaction with banking services. Fida et al. (2020) investigated a significant association between tangibility and customer satisfaction in the Oman banking sector. On the contrary, Abdelhadi (2021) found no significant link between tangibility and customer satisfaction in the Tunisian Islamic banking context. According to the above discussion, the following hypothesis is proposed:
H2. 
Tangibility positively affects customer satisfaction in the NBFIs.

2.5.3. Empathy

Empathy prevails when banks understand, interact and provide customers with information (Gatari 2016). The SQ’s empathy dimension in the marketing of services focuses mainly on factors such as communication, consumer expectations and positive conduct (Ennew et al. 2013). The banking industry’s empathy factor is critical to satisfying retail-banking customers (Potluri et al. 2016). Empathy, as described by Murray et al. (2019), is “the capacity to share and respond to another person’s mental, emotional, behavioural, and experiential states and circumstances.” As a result, empathy is a multidimensional concept that requires observations on an emotive, cognitive and compassionate level (Powell and Roberts 2017). When staff in traditional service settings adopt empathic attitudes toward consumers, it leads to increased levels of customer satisfaction (Markovic et al. 2018). In addition, Lee et al. (2011) came to the conclusion that the empathy shown by employees has a direct influence on the pleasant emotions experienced by customers, and that there is a significant positive link between happy emotions and satisfaction with the employee relationship. Khan et al. (2021) also found similar results. On this basis, the following hypothesis is proposed:
H3. 
Empathy positively affects customer satisfaction in the NBFIs.

2.5.4. Responsiveness

The responsiveness dimension reflects workers’ speed to provide sufficient and timely assistance (Endara et al. 2019). The ability to execute assigned tasks manually and/or electronically on time is called responsiveness (Uddin et al. 2015). Vencataya et al. (2019) validated that responsiveness was an influential factor in forecasting customer satisfaction in Mauritius banking. The Sultanate of Oman has found a good relationship between responsiveness and customer loyalty to Islamic banking services (Fida et al. 2020). It might be argued that the responsiveness of the banking sector has a direct effect on the level of client satisfaction (Kant and Jaiswal 2017; Krishnamurthy et al. 2010; Selvakumar 2015; Khan et al. 2021). Abdelhadi (2021), in his study on Tunisian Islamic banks, found that responsiveness has a positive influence on customer satisfaction. However, Yun and Park (2022), Famiyeh et al. (2018) and Fida et al. (2020) found no significant association between responsiveness and customer satisfaction. Sardana and Bajpai (2020) reported that responsiveness was crucial in meeting customer standards (satisfaction) of e-banking in India. Thus, the following hypothesis is proposed:
H4. 
Responsiveness positively affects customer satisfaction in the NBFIs.

2.5.5. Assurance

Assurance is the expertise, courtesy and capacity of employees to express their trust and confidence (Zeithaml et al. 1990) and is an essential component in the high-risk industry (Andaleeb and Conway 2006). It is also related to how safe the customer is in the banking transactions (Ennew et al. 2013), and it prevails a direct and positive relationship with customer satisfaction in the banking field (Pakurár et al. 2019). Several researchers have concluded that there is a significantly positive relationship between assurance and satisfaction. There is a positive correlation between assurance and the level of satisfaction experienced by the consumer (Kant and Jaiswal 2017; Olorunniwo et al. 2006; Yarimoglu 2014). Fida et al. (2020) also investigated the impact of quality on clients’ happiness at four Islamic banks in Oman, and they came to the same conclusion that assurance matters a great deal. Khan et al. (2021) found a similar relationship in the case of the Bangladeshi mobile-banking sector. However, Famiyeh et al. (2018) found no significant relationship between assurance and customer satisfaction in the banking sector in Ghana. Negash (2021) confirmed a positive relationship between assurance and customer satisfaction at the Oromia international Bank in Ethiopia. On this basis, the following hypothesis is proposed:
H5. 
Assurance positively affects customer satisfaction in the NBFIs.

2.5.6. Accessibility

Accessibility refers to the ease with which facilities are obtained and reached promptly. In the case of NBFIs, accessibility denotes the clients having easy entrances, space for moving freely and comfortably, a branch location nearby, suitable transaction times and enough parking lots (Islam et al. 2020). Access to service ensures that the service can be conveniently accessible by telecommunications, that there is less waiting time, flexible operating hours and a suitable venue for the service facility (Yarimoglu 2014). Nazeri et al. (2019) observed that convenient Internet banking service connectivity favorably triggers a banking customer’s satisfaction. Shayestehfar and Yazdani (2019) also stated in their comparative analysis that accessibility was ranked as the highest measure of banking-service efficiency in the Iranian context. Khamis and AbRashid (2018) suggested that bank customers were attracted and intrigued by those Islamic banks that offer fast and affordable banking services in Tanzania. Kumar et al. (2018)’s research showed that easy service hours and accessible branch locations significantly affected recruiting new clients and maintaining existing ones. Alkhazaleh and Haddad (2021) found a relationship between the accessibility of fintech service and customer service for the Jordanian Banking sector. However, Islam et al. (2020) found no relationship between access to financial services and customer satisfaction. Based on the above arguments, the following hypothesis is proposed:
H6. 
Accessibility positively affects customer satisfaction in the NBFIs.

3. The Methodology of the Study

3.1. Research Design

This empirical study used a cross-sectional survey method. This indicates that the data collected from each respondent were taken only once, unlike the longitudinal research approach (Dabholkar et al. 2000) or sequential framework (Ashraf et al. 2022). To assess service quality and customer satisfaction, face-to-face and one-to-one interview techniques were used with closed-ended structured questionnaires developed according to the literature in this service-quality domain. We adopted face-to-face interviews as we could help respondents understand questions. The education of respondents is diversified as it also includes people with no education. The face-to-face interview technique suits well in such a phenomenon.
Among the total NBFIs (34) in Bangladesh, the study picked 13 non-banking institutions, representing 38% of the total NBFIs. The participants were selected from three big cities in Bangladesh, including Dhaka, Chittagong and Rajshahi, on the basis of the purposive random-sampling method. The sample frame choosing NBFIs’ services was adopted from the NBFI branch’s availability in all three cities. This means we picked customers from those NBFIs which are only located in the three cities in Bangladesh. This study recruited some university students equipped with interview training to conduct the face-to-face questionnaire survey on customers of the selected NBFIs. During May–June in 2021, a total of 217 respondents were collected. After the screening-out of incomplete responses, 205 samples were chosen for analysis. To verify the required sample size, the G*Power software (Powell and Roberts 2017) was used, which suggests that the minimum sample size is 153 (f2 = 0.15 for effect size, α = 0.05 for error type 1 and ß = 0.20 for error type 2) as there are seven constructs in the study. This means that 205 samples were enough for analysis.

3.2. Measurement Instrument

There were two segments in the questionnaire. The first part includes the demographic section where the age, gender, marital status and educational level and occupation were attributed in various scales like dichotomous, ordinal. In the second part, the service quality- and customer satisfaction-related questions were included. These questions, in the second part, were on a Likert scale with five-point, ranging 1 = strongly disagree and 5 = strongly agree. All the questions were closed-ended so the collected data can be analyzed statistically with ease. We also supplied Bengali-translated questions to the respondents who are interested. For such a questionnaire survey, the Bengali version of questions helped them understand the question properly and respond without leaving statements blank. These mixed approaches helped us to obtain sufficient responses.
The construct empathy and reliability (5 items) were sourced from Zia (2020). Out of five items of assurance, four items were adopted from Rasyida et al. (2016) and one is proposed by the authors of this study. Similarly, the construct responsiveness was taken from Zia (2020) (4 items), and one is newly proposed by the authors in this study. Tangibility, which contains 6 items, was adapted from Zia (2020) and Chatzoglou et al. (2014). Six items of customer satisfaction were extracted from Baqué et al. (2021), and five items of accessibility were used from Islam et al. (2020) and Oppewal and Vriens (2000).

4. Results

4.1. Respondents’ Profile

The respondents’ demographic profile indicates that 85.36% of the respondents were male and 14.64% were female. Out of the total respondents, 42.92% were in the 34–49-years range, 33.17% were 26–33 years range and 70.73% were married. Many respondents were businesspersons (48.78%) and private-service professionals (29.76%). Table 1 also reveals that a significant number of respondents (45.36%) are highly educated (graduates) followed by postgraduates (30.24%).

4.2. Assessment of the Measurement Model (Determinants) for Service Quality of NBFI

A reflective model was run in two stages for analyzing data using SmartPLS, that is, exploratory and confirmatory analysis (Ringle et al. 2015). In exploratory factor analysis (EFA), the measurement model is set followed by the structural model in the confirmatory factor analysis (CFA) model. PLS-SEM is comparatively superior to CB-SEM in smaller sample sizes, and data normality is not needed (Reinartz et al. 2009; Hui and Wold 1982). Figure 2 shows the measurement model (determinants) of service quality using the SmartPLS 2.0.
The measurement model was tested using both the reliability and validity of the constructs. For indicator reliability (Table 2), the factor loading out of 37 items of the constructs, 26 items are qualified for the constructs based on a thumb value of 0.5 or above (Henseler et al. 2015). In addition, the composite reliability is above the threshold value of 0.70 (Shi et al. 2022), indicating the adequate reliability of the constructs. Cronbach’s Alpha represents within the range of 0.797 to 0.896, which is within the standard of 0.5 (Hair et al. 2014). Thus, reliability is achieved in this study.
In terms of validity, the convergent validity indicator, such as average variance extracted (AVE), must also be 0.5 or more (Barclay et al. 1995) and these study results (Table 2) comply with the standards. Similarly, all the measurement-model constructs were found with discriminant validity (Table 3) using the Fornell–Larker criterion as all the square roots of the AVE (off-diagonal values) are higher than the respective correlation values (Fornell and Larcker 1981). Therefore, all the respective constructs in the model are reliable and valid for structural modelling.

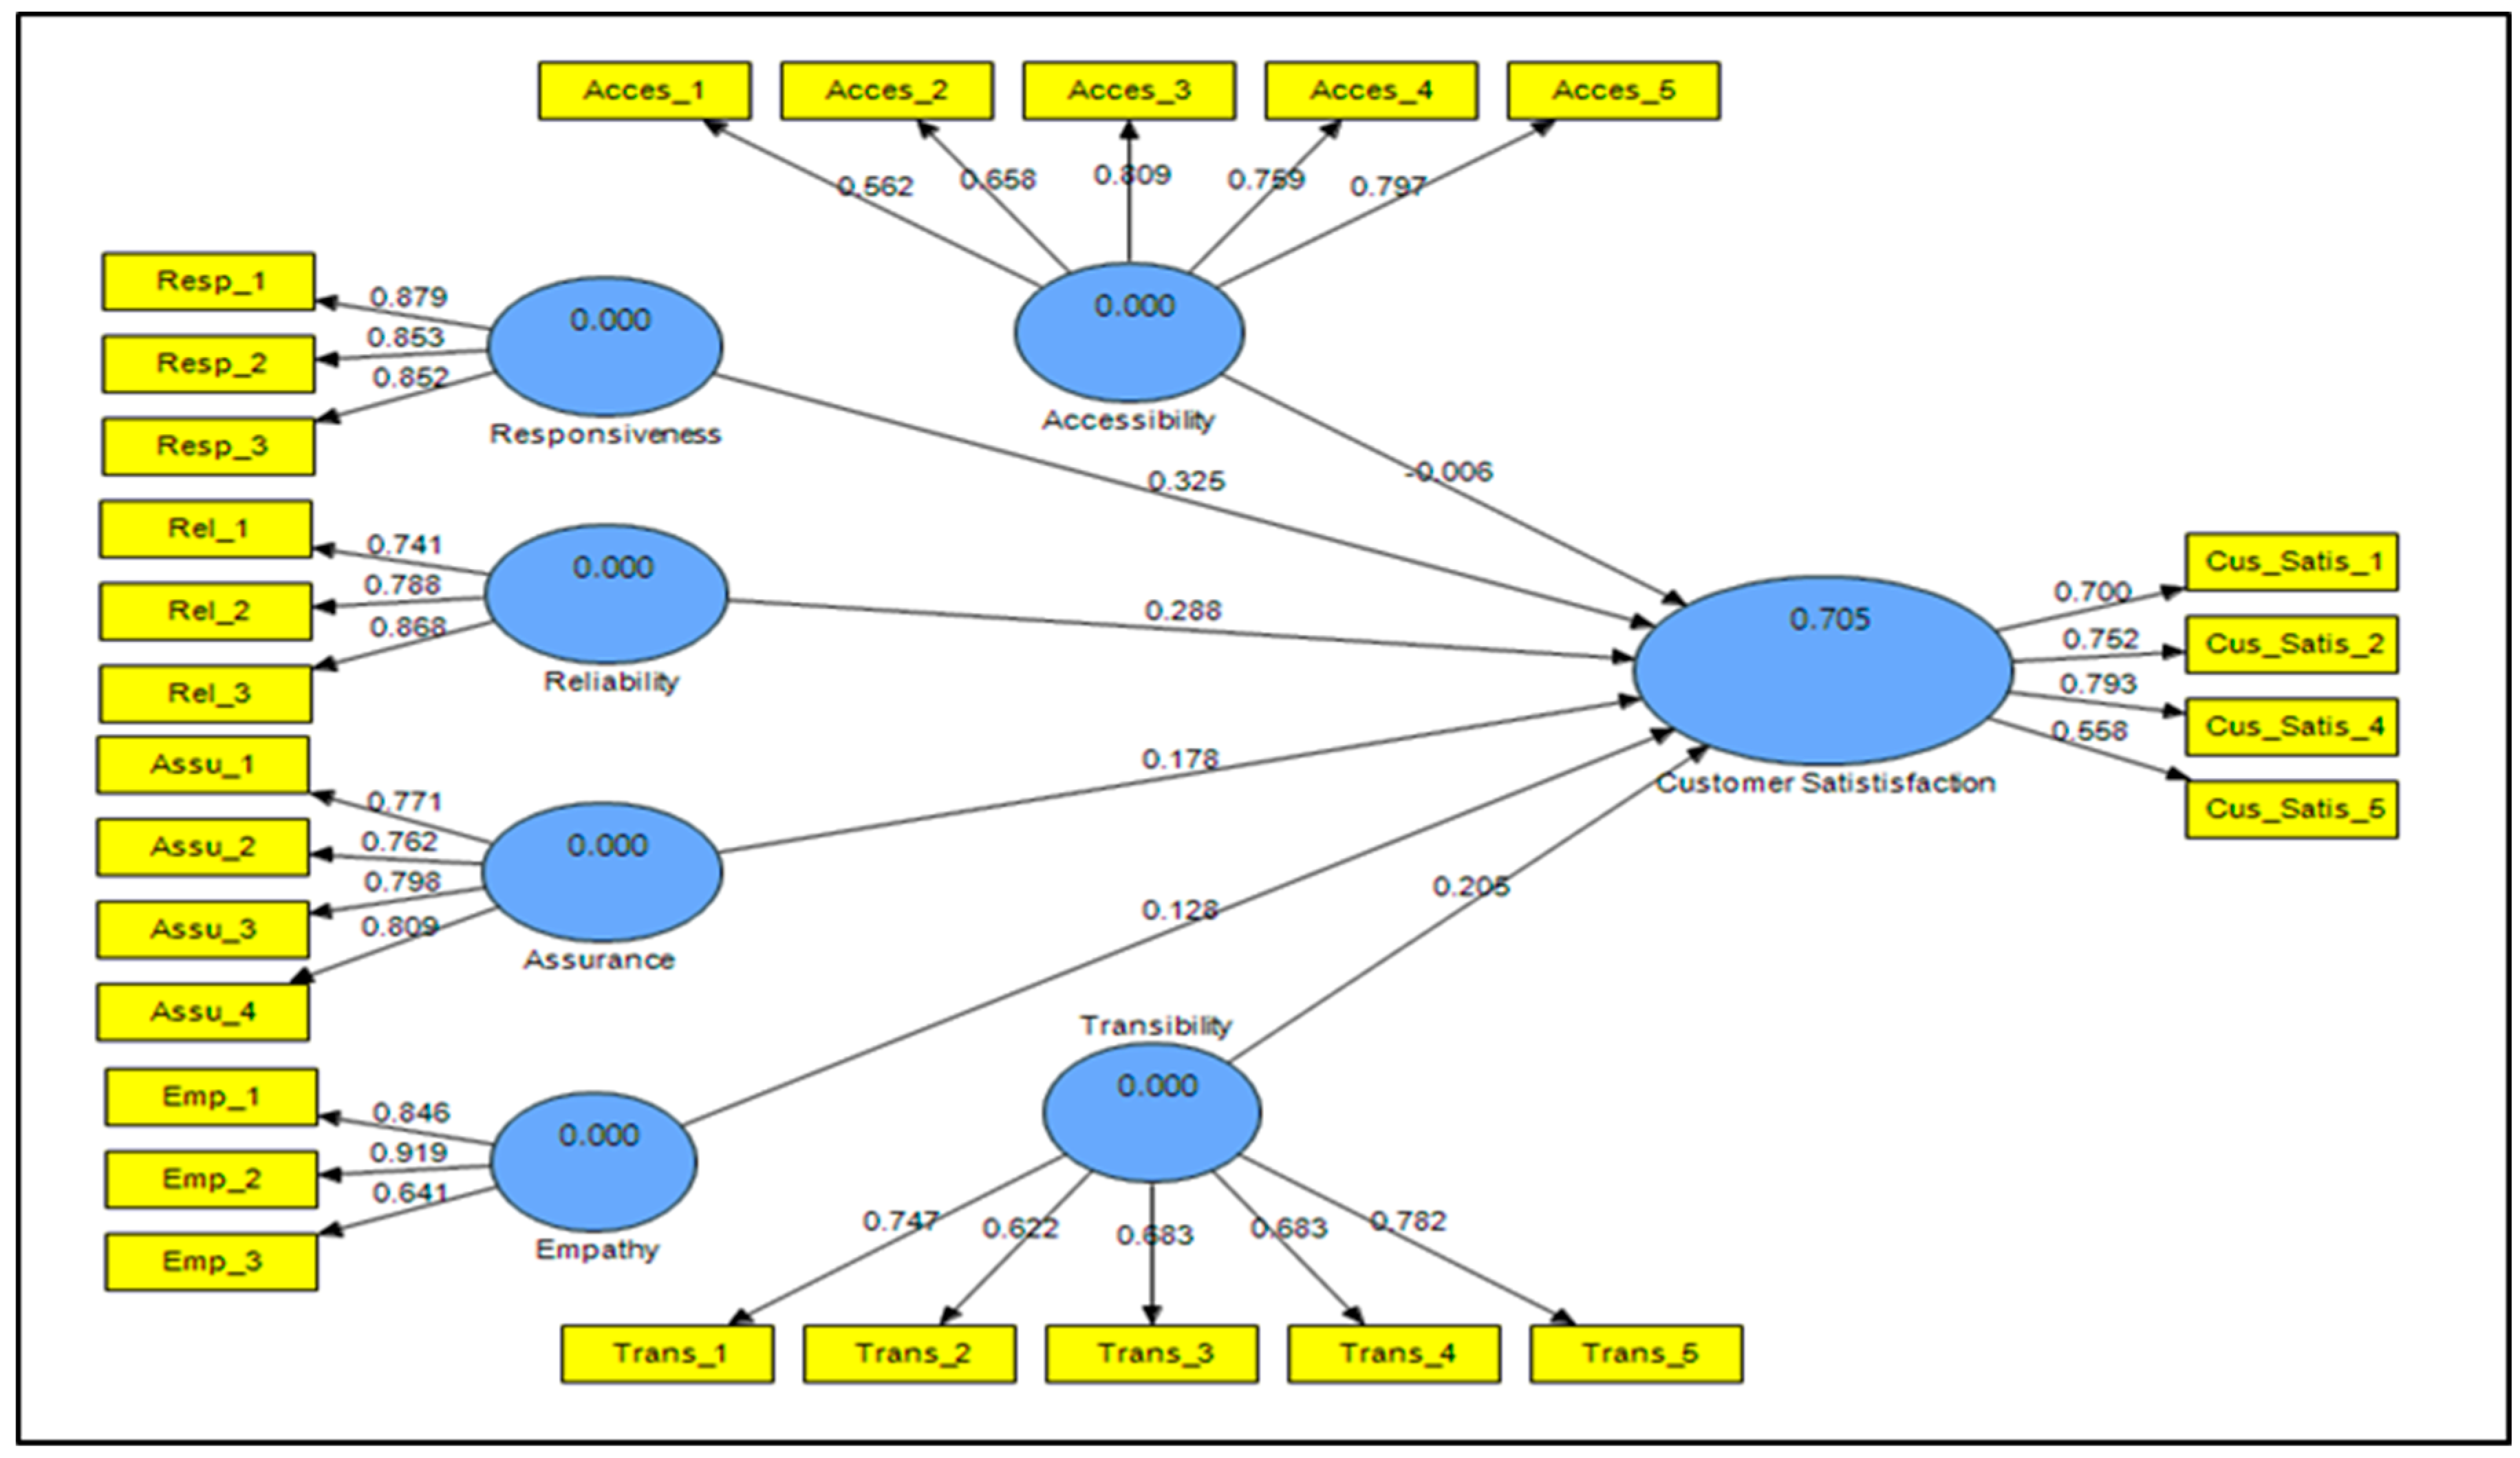
4.3. Assessment of the Structural Equation Model for Service Quality of NBFI

The tolerance of the predictor variable, VIF, is expected to be higher than 0, 20 and less than 5, otherwise to be deleted or combined with other variables (Hair et al. 2011). The coefficient of determination appears to be sound for the model as a whole; R2 values (0.705), evaluate forecasting ability and the effect of a dependent by the independent variable is moderate. According to the standard, the R2 values of 0.75, 0.50 or 0.20, respectively, for the latent dependent factor (Henseler et al. 2015; Hair et al. 2011) imply substantial, moderate and weak.
As per the bootstrapping results (Table 4), hypotheses H1, H2, H4 and H5 are supported, and H3 and H6 are not supported. It means that there is a direct effect of reliability (T = 3.4281, p = 0.001 < 0.01), responsiveness (T = 3.3711, p = 0.001 < 0.01), assurance (T = 2.084, p = 0.040 < 0.05) and tangibility (T = 2.1732, p = 0.032 < 0.05) on the customer satisfaction at a significance level of 1% and 5%, respectively. The dimensions, empathy (T = 1.8352, p = 0.069 < 0.10) and accessibility (T = 0.0723, p = 0.943 < 0.10) do not have significantly direct influences on CS. The path coefficient value indicates the relationship strength, and it finds that responsiveness (0.3248) has a greater relationship than reliability (0.2879) though they have the same significance value. The other dimensions, assurance (0.1776) and tangibility (0.2054), have relatively moderate relationships with customer satisfaction.
Depending only on R2 can also be deceptive as R2 is tolerant to variable numbers, which increases its value if any insignificant variable adds to any model. We should choose an alternative analysis in the model assortment for many constructs to be bias-free. This measurement technique comprises an f2 influence level test. These measures attributed the f2 effect size test with an independent variable’s effect, while the Q2 effect-size-test technique quantifies predictive relevance.
F2 values greater than zero and 0.02, 0.15 and 0.35 denote a small, average or extensive exogenous effect on an endogenous variable, accordingly (Cohen 1988), and these standards are similar for the q2 influence-level test based on the set of rules. In this study, the f2 and q2 values suggest specific predictive relevance except for the construct accessibility that is just or below zero, and empathy is also the lowest (f2 = 0.027 and q2 = 0) among the significant constructs. For the constructs fitted in the model, the higher values of tangibility (f2 = 0.047 and q2 = 0.006) and assurance (f2 = 0.035 and q2 = 0.001) justify the previous prediction path coefficients and T statistics (Table 5). Reliability construct is the highest proof of satisfaction among the four constructs with statistical significance.

5. Discussion

This study empirically tested the SERVPERF model to integrate an additional dimension in the non-banking service industry. Four dimensions were verified except accessibility and empathy and thus supported the study of Cronin and Taylor (1992). Our research framework may also sum up various informative findings explained below.
Firstly, the findings indicate that reliability affects customer satisfaction positively and significantly (H1). Among the six SQ dimensions for NBFIs, reliability has been found to be the most important predictor of CS. The belief at the bank is that customers will be compassionate and that bank records are well kept. The results show that the clients of Bangladeshi NBFIs are pleased with the dimensions of reliability, including maintaining reliable records and providing promised service on time. These results align with existing works (Haron et al. 2020; Kant and Jaiswal 2017; Peng and Moghavvemi 2015). Parasuraman et al. (1985) concluded that reliability is the client’s capacity to deliver services. This signifies that the higher the reliability of NBFI services for customers, the higher the chances to satisfy them.
Secondly, tangibility has a positive influence on customer satisfaction (H2). The empirical findings confirm that tangibility affects consumer satisfaction positively and substantially. The results also postulated that the most immediate aspect, after the responsive dimension, was tangibility. These results align with prior research (Choudhury 2014; Arasli et al. 2005; Haron et al. 2020; Kant and Jaiswal 2017) and are incompatible with a study (Wang et al. 2004) which indicates that the opposite is valid regarding customer satisfaction. This indicates that customers of Bangladeshi NBFIs are pleased when they find it easy to use the physical appearance of the operation, including employee outfits, smart equipment and related products. Some studies have reported tangibility as the location, facilities, staff and communication aspects (Parasuraman et al. 1991, 1988). This indicates that the greater the physical appearance and employee outfits with smart equipment in providing service to consumers, the greater the propensity to satisfy customers of NBFIs.
Thirdly, the predicted positive relationship between empathy and customer satisfaction (H3) is not supported. That is empathy did not positively influence CS, which is against the results of some past studies (Ross and Venkatesh 2015; Umoke et al. 2020; Slack and Singh 2020). Proper communication, a strong insight into customer preferences and friendly behavior ensure empathy. This means that customers’ empathy of Bangladeshi NBFIs are not satisfied possibly due to branches not being convenient, having unreasonable hours of service and not satisfying their needs. These results are in accordance with past studies (Krishnamurthy et al. 2010; Donthu and Yoo 1998), but against the study of Derksen et al. (2013).
Fourthly, the responsiveness of employees has significant influence on customer satisfaction (H4). This result revealed that responsiveness is the second most influential (after reliability) predictor of CS. The results corroborate that staff response can meet customer satisfaction, similar to earlier research (Baghla and Garai 2016; Collis and Hussey 2013; Fida et al. 2020; Sardana and Bajpai 2020; Vencataya et al. 2019; Parasuraman et al. 1988). Employees must be eager to assist clients. NBFI staff should answer questions and have the faith to alert clients once services are given. Thus, responsiveness is integral to being prepared to offer support and service to the customers because the time customers have to wait for assistance and response is a vital issue for customers. Enhanced promptness and quick customer responses lead to customer satisfaction.
Fifthly, assurance is a key factor in SQ dimensions, which refers to employees’ knowledge and gentleness and their capacity to express faith and confidence (Parasuraman et al. 1985). In NBFIs, the assurance dimension had a positive and solid impact on customer satisfaction. Several published works (Munusamy et al. 2010; Donthu and Yoo 1998; Haron et al. 2020) support such results. This research also supports this argument. The concept is that NBFIs concentrate more on assurance in SQ and are therefore more capable of building confidence and loyalty among customers of the non-banking sector in Bangladesh. Customers would presume service operators to display respect and attention to them, and they would thus concentrate more on the assurance provided by the service providers.
Finally, accessibility is not significantly associated with customer satisfaction (H6). Accessibility indicates that customers pursue simple ways to access services, additional reception options and the facility to receive the assistance they requested in the desired location, time and manner. The present study did not strongly support the impact of access on CS in the NBFIs in Bangladesh. The findings are in line with Cronin and Taylor (1992), but are opposite to some studies (Ladhari et al. 2011; Pakurár et al. 2019; Khamis and AbRashid 2018; Nazeri et al. 2019; Shayestehfar and Yazdani 2019). In this way, from the customer’s standpoint, the accessibility could be redundancy in NBFIs. The reason could be that consumers are still treating the excellent accessibility facility of NBFIs as basic requirements for the banking sector. The customers’ expectations are far more. Moreover, this non-significant result can also be induced by a small area surveyed in metropolitan towns with adequate NBFI outfits and facilities.

6. Conclusions

The study aims to identify the relationship between service-quality dimensions and customer satisfaction for NBFIs in Bangladesh. Employing an extended SERVPERF model, the empirical investigation confirms that the four dimensions, assurance, tangibility, responsiveness and reliability, are significant predictors of customer satisfaction. The other dimensions, accessibility and empathy, did not significantly fit in the Bangladeshi NBFI context. The research results also demonstrate that reliability is the most crucial dimension in the model for NBFIs in Bangladesh. The independent factors of assurance, tangibility, responsiveness and reliability explain 70.5% of the variance in customer satisfaction, validating the model as well-fitted and validated. The following are the implications of the study that could have an impact on the industry, if carefully considered.

6.1. Policy Implications

Firstly, the model’s confirmation will help managers understand that service-quality factors associated with NBFIs are different from the traditional banking industry. This indicates what should be given priority and what should be kept in order to keep customers satisfied. The quality indicators determined in this study are analogous to customer satisfaction and therefore recommend that managers pay equal attention to quality considerations.
Secondly, empathy is the care for customers’ feelings that contributes to their bank satisfaction. While technology can provide various ways to improve services in institutions, such as ATM and internet banking, these services are essential for users to understand. The outcomes also show that the participants stress the firm’s ability to discuss and communicate its needs. For NBFIs, they also need to be more responsive to customer sentiments and enhance their employee empathy, as personal relationships are relevant for direct transactions. Thus, given previous research findings (Jianu et al. 2015) the idea of sustainable marketing (referring to an eco-friendly way of the financial transaction such as online operations), should be addressed when looking at customer satisfaction. These offerings comply with the tangibility dimension, allow businesses to be precise, be paperless, reduce queues, be useful and operate for longer hours.
Thirdly, an up-gradation program for employees could help to reach its efficient way of delivering services. Given the highly dynamic nature of employee–customer relations, the Bangladeshi non-banking sector can provide service excellence by arranging its employees in a structured and upgraded training program. To recognize the need for customized programs, the training curriculum should also concentrate on staff communication abilities and customer psychology. Policymakers need to reassess their customers’ desired level of service quality. This will facilitate non-banking institutions to efficiently and effectively handle their clients.
Fourthly, the study found the highest influence on customer satisfaction by the reliability dimension. This refers to the NBFIs being genuine in solving problems and delivering consistent and accurate services. NBFIs should boost their service reliability to draw the customer’s attention.

6.2. Contribution to the Theory

This study extends the literature on CS and SQ. The previous empirical research covers service sectors like consumer goods, higher education, hospitals and the tourism and travel sectors in Bangladesh. Several studies were performed in traditional banks; but NBFIs, in particular, remained untouched. This research expands the current knowledge paradigm by providing evidence-based information on SQ and CS in non-bank institutions in Bangladesh. Although the proposed extension of the SERVPERF model with accessibility was not supported by the findings, this experience can encourage future academics to incorporate new constructs in new contexts. The applicability of a theory across different settings enhances its level of validity. This study validated the existing model in a new context. This can supplement future research by replicating the present study in other contexts.
Additionally, the present study adds to the literature with new findings. For example, while the significant effect of empathy was previously assumed in multiple studies (Slack and Singh 2020; Umoke et al. 2020; Zia 2020), we found an insignificant relationship between empathy and customer satisfaction in the context of NBFIs in a developing economy. Future research can benefit from this illustration as a motivation for more systematic investigations.

6.3. Limitations and Future Direction of the Study

The study is limited in terms of sample size, although it is suitable for PLS-SEM analysis. It is also limited only to metropolitan cities, even though the growth of NBFIs is happening beyond these cities. So, for future research, it could be extended with a greater sample size and sample areas to generalize the result to a greater extent. Future studies could come up with a different data analysis technique for analyzing SEM, such as, they could use the covariance-based SEM (using AMOS) which will provide a more validated result with this model.
This study only portrayed the direct relationship between customer satisfaction and service quality. It lacked the inclusion of indirect relationships, including mediation and moderation effects on the dependent variable. This creates an opportunity for further advanced research to fill the gap in NBFI settings.

Author Contributions

Conceptualization, C.-K.W., M.M., S.S.A. and I.A.; methodology, C.-K.W., S.S.A. and C.-Y.L.; software, M.M.; validation, C.-K.W., S.S.A., I.A. and Y.-H.H.; resources, I.A. and Y.-H.H.; writing—original draft preparation, C.-K.W., M.M., S.S.A., I.A., C.-Y.L. and Y.-H.H.; writing—review and editing, C.-Y.L. and Y.-H.H.; project administration, S.S.A. All authors have read and agreed to the published version of the manuscript.

Funding

This research received no external funding.

Institutional Review Board Statement

Not applicable.

Informed Consent Statement

Informed consent was obtained from all subjects interviewed and involved in this study.

Data Availability Statement

The data that support the findings of this study are available from the corresponding authors upon reasonable request.

Acknowledgments

The authors wish to thank the anonymous reviewers for improving the standard of this article.

Conflicts of Interest

The authors declare no conflict of interest.

References

  1. Abdelhadi, Abdelhakim. 2021. Patients’ Satisfactions on the Waiting Period at the Emergency Units. Comparison Study before and during COVID-19 Pandemic. Journal of Public Health Research 10: 1956. [Google Scholar] [CrossRef]
  2. Ali, Muhammad, and Syed Ali Raza. 2017. Service Quality Perception and Customer Satisfaction in Islamic Banks of Pakistan: The Modified SERVQUAL Model. Total Quality Management & Business Excellence 28: 559–77. [Google Scholar]
  3. Alkhazaleh, Ayman Mansour Khalaf, and Hossam Haddad. 2021. How Does the Fintech Services Delivery Affect Customer Satisfaction: A Scenario of Jordanian Banking Sector. Strategic Change 30: 405–13. [Google Scholar] [CrossRef]
  4. Amin, Muslim, and Zaidi Isa. 2008. An Examination of the Relationship between Service Quality Perception and Customer Satisfaction. Management 1: 191–209. [Google Scholar] [CrossRef] [Green Version]
  5. Andaleeb, Syed Saad, and Carolyn Conway. 2006. Customer Satisfaction in the Restaurant Industry: An Examination of the Transaction-Specific Model. Journal of Services Marketing 20: 3–11. [Google Scholar] [CrossRef]
  6. Anderson, Eugene W., and Mary W. Sullivan. 1993. The Antecedents and Consequences of Customer Satisfaction for Firms. Marketing Science 12: 125–43. [Google Scholar] [CrossRef]
  7. Arasli, Huseyin, Salime Mehtap-Smadi, and Salih Turan Katircioglu. 2005. Customer Service Quality in the Greek Cypriot Banking Industry. Managing Service Quality: An International Journal 15: 41–56. [Google Scholar] [CrossRef]
  8. Ashraf, Dawood, Mohsin Khawaja, and M Ishaq Bhatti. 2022. Raising Capital amid Economic Policy Uncertainty: An Empirical Investigation. Financial Innovation 8: 1–32. [Google Scholar] [CrossRef]
  9. Babakus, Emin, and Gregory W. Boller. 1992. An Empirical Assessment of the SERVQUAL Scale. Journal of Business Research 24: 253–68. [Google Scholar] [CrossRef]
  10. Baghla, Aditi, and Amandeep Garai. 2016. Service Quality in the Retail Banking Sector-A Study of Selected Public and New Indian Private Sector Banks in India. IJAR 2: 598–603. [Google Scholar]
  11. Baqué, Nils, Alban Ferati, and Rahul Singh. 2021. Customer Satisfaction in the Cooperative Banking Industry: A Quantitative Approach. Available online: https://www.diva-portal.org/smash/get/diva2:1574507/FULLTEXT01.pdf (accessed on 3 February 2023).
  12. Barbara, R Lewis, and W Mitchell Vincent. 1990. Defining and Measuring the Quality of Customer Service. Marketing Intelligence & Planning 8: 11–17. [Google Scholar]
  13. Barclay, Donald, Clarence Higgings, and Ronald Thompson. 1995. The Partial Least Squares (PLS) Approach to Casual Modeling: Personal Computer Adoption and Use as an Illustration. Technology Studies 2: 285–309. [Google Scholar]
  14. Bashir, Md Abdul, Mass Hareeza Ali, Lam Mun Wai, Mohammad Imtiaz Hossain, and Md Shumonur Rahaman. 2020. Mediating Effect of Customer Perceived Value on the Relationship between Service Quality and Customer Satisfaction of E-Banking in Bangladesh. International Journal of Advanced Science and Technology 29: 3590–606. [Google Scholar]
  15. Blut, Markus. 2016. E-Service Quality: Development of a Hierarchical Model. Journal of Retailing 92: 500–17. [Google Scholar] [CrossRef] [Green Version]
  16. Boonlertvanich, Karin. 2019. Service Quality, Satisfaction, Trust, and Loyalty: The Moderating Role of Main-Bank and Wealth Status. Marketing 37: 278–302. [Google Scholar] [CrossRef]
  17. Buzzel, Robert. D., and Bradley. T. Gale. 1987. The PIMS Principles. New York: The Free Press, chp. 6. [Google Scholar]
  18. Caruana, Albert, Arthur H. Money, and Pierre R. Berthon. 2000. Service Quality and Satisfaction ą the Moderating Role of Value. European Journal of Marketing 34: 1338–53. [Google Scholar] [CrossRef]
  19. Chatzoglou, Prodromos, Dimitrios Chatzoudes, Eftichia Vraimaki, and Eleni Leivaditou. 2014. Measuring Citizen Satisfaction Using the SERVQUAL Approach: The Case of the ‘Hellenic Post’. Procedia Economics and Finance 9: 349–60. [Google Scholar] [CrossRef] [Green Version]
  20. Chonsalasin, Dissakoon, Sajjakaj Jomnonkwao, and Vatanavongs Ratanavaraha. 2021. Measurement Model of Passengers’ Expectations of Airport Service Quality. International Journal of Transportation Science and Technology 10: 342–52. [Google Scholar] [CrossRef]
  21. Choudhury, Koushiki. 2014. The Influence of Customer-Perceived Service Quality on Customers’ Behavioural Intentions: A Study of Public and Private Sector Banks, Class and Mass Banking and Consumer Policy Implications. International Review on Public and Nonprofit Marketing 11: 47–73. [Google Scholar] [CrossRef]
  22. Cohen, Jacob. 1988. Statistical Power Analysis for the Behavioral Sciences. Cambridge: Academic Press. [Google Scholar]
  23. Collis, Jill, and Roger Hussey. 2013. Business Research: A Practical Guide for Undergraduate and Postgraduate Students: Macmillan International Higher Education. London: Palgrave Macmillan. [Google Scholar]
  24. Cronin, J. Joseph, Jr., and Steven A. Taylor. 1992. Measuring Service Quality: A Reexamination and Extension. Journal of Marketing 56: 55–68. [Google Scholar] [CrossRef]
  25. Dabholkar, Pratibha A., C. David Shepherd, and Dayle I. Thorpe. 2000. A Comprehensive Framework for Service Quality: An Investigation of Critical Conceptual and Measurement Issues through a Longitudinal Study. Journal of Retailing 76: 139–73. [Google Scholar] [CrossRef]
  26. Derksen, Frans, Jozien Bensing, and Antoine Lagro-Janssen. 2013. Effectiveness of Empathy in General Practice: A Systematic Review. British Journal of General Practice 63: e76–e84. [Google Scholar] [CrossRef] [Green Version]
  27. Devesh, Sonal. 2019. Service Quality Dimensions and Customer Satisfaction: Empirical Evidence from Retail Banking Sector in Oman. Total Quality Management & Business Excellence 30: 1616–29. [Google Scholar]
  28. Donthu, Naveen, and Boonghee Yoo. 1998. Cultural Influences on Service Quality Expectations. Journal of Service Research 1: 178–86. [Google Scholar] [CrossRef]
  29. Endara, Yousef Mohamed, Asbi B. Ali, and Mohd Shukri Ab Yajid. 2019. The Influence of Culture on Service Quality Leading to Customer Satisfaction and Moderation Role of Type of Bank. Journal of Islamic Accounting and Business Research 10: 134–54. [Google Scholar] [CrossRef]
  30. Ennew, Christine, Nigel Waite, and Róisín Waite. 2013. Financial Services Marketing: An International Guide to Principles and Practice. Abingdon-on-Thames: Routledge. [Google Scholar]
  31. Famiyeh, Samuel, Disraeli Asante-Darko, and Amoako Kwarteng. 2018. Service Quality, Customer Satisfaction, and Loyalty in the Banking Sector: The Moderating Role of Organizational Culture. International Journal of Quality & Reliability Management 35: 1546–67. [Google Scholar]
  32. Fase, Martin MG, and R C N Abma. 2003. Financial Environment and Economic Growth in Selected Asian Countries. Journal of Asian Economics 14: 11–21. [Google Scholar] [CrossRef]
  33. Fida, Bashir Ahmad, Umar Ahmed, Yousuf Al-Balushi, and Dharmendra Singh. 2020. Impact of Service Quality on Customer Loyalty and Customer Satisfaction in Islamic Banks in the Sultanate of Oman. SAGE Open 10: 2158244020919517. [Google Scholar] [CrossRef]
  34. Fornell, Claes, and David F. Larcker. 1981. Evaluating Structural Equation Models with Unobservable Variables and Measurement Error. Journal of Marketing Research 18: 39–50. [Google Scholar] [CrossRef]
  35. Gatari, Eva Nyawira. 2016. Factors Influencing Customer Satisfaction in the Banking Industry in Kenya: A Case Study of Investments and Mortgages (I&M) Bank Ltd. Ph.D. thesis, United States International University Africa, Nairobi, Kenya. [Google Scholar]
  36. Gotlieb, Jerry B., Dhruv Grewal, and Stephen W Brown. 1994. Consumer Satisfaction and Perceived Quality: Complementary or Divergent Constructs? Journal of Applied Psychology 79: 875. [Google Scholar] [CrossRef]
  37. Gronroos, Christian. 1988. Service Quality: The Six Criteria of Good Perceived Service. Review of Business 9: 10. [Google Scholar]
  38. Hair, Joe F., Christian M. Ringle, and Marko Sarstedt. 2011. PLS-SEM: Indeed a Silver Bullet. Journal of Marketing Theory and Practice 19: 139–52. [Google Scholar] [CrossRef]
  39. Hair, Joseph F., Jr., G. Tomas M. Hult, Christion M. Ringle, and Marko Sarstedt. 2014. A Primer on Partial Least Squares Structural Equation Modeling (PLS-SEM). New York: Sage Publications. [Google Scholar]
  40. Hamzah, Zalfa Laili, Siew Peng Lee, and Sedigheh Moghavvemi. 2017. Elucidating Perceived Overall Service Quality in Retail Banking. International Journal of Bank Marketing 35: 781–804. [Google Scholar] [CrossRef]
  41. Haron, Razali, Noradilah Abdul Subar, and Khairunisah Ibrahim. 2020. Service Quality of Islamic Banks: Satisfaction, Loyalty and the Mediating Role of Trust. Islamic Economic Studies 28: 3–23. [Google Scholar] [CrossRef]
  42. Hartline, Michael D., and Orville C. Ferrell. 1996. The Management of Customer-Contact Service Employees: An Empirical Investigation. Journal of Marketing 60: 52–70. [Google Scholar] [CrossRef]
  43. Henseler, Jörg, Christian M. Ringle, and Marko Sarstedt. 2015. A New Criterion for Assessing Discriminant Validity in Variance-Based Structural Equation Modeling. Journal of the Academy of Marketing Science 43: 115–35. [Google Scholar] [CrossRef] [Green Version]
  44. Hossain, Monzur, and Md Shahiduzzaman. 2002. Development of Non Bank Financial Institutions to Strengthen the Financial System of Bangladesh. Quarterly Journal of Bangladesh Institute of Bank Management 28: 1–21. [Google Scholar]
  45. Hui, Baldwin S., and Herman Wold. 1982. Consistency and Consistency at Large of Partial Least Squares Estimates. Systems under Indirect Observation, Part II 131: 119–30. [Google Scholar]
  46. Islam, Mohd Aminul, and Jamil Bin Osman. 2011. Development Impact of Non-Bank Financial Intermediaries on Economic Growth in Malaysia: An Empirical Investigation. International Journal of Business and Social Science 2: 187–98. [Google Scholar]
  47. Islam, Rafikul, Selim Ahmed, Mahbubar Rahman, and Ahmed Al Asheq. 2020. Determinants of Service Quality and Its Effect on Customer Satisfaction and Loyalty: An Empirical Study of Private Banking Sector. The TQM Journal 33: 1163–82. [Google Scholar] [CrossRef]
  48. Jahan, Nasrin, Md Julfikar Ali, and Ahmed Al Asheq. 2020. Examining the Key Determinants of Customer Satisfaction Internet Banking Services in Bangladesh. Academy of Strategic Management Journal 19: 1–6. [Google Scholar]
  49. Jain, Sanjay K., and Garima Gupta. 2004. Measuring Service Quality: SERVQUAL vs. SERVPERF Scales. Vikalpa 29: 25–38. [Google Scholar] [CrossRef]
  50. Jamal, Ahmad, and Kamal Naser. 2002. Customer Satisfaction and Retail Banking: An Assessment of Some of the Key Antecedents of Customer Satisfaction in Retail Banking. International Journal of Bank Marketing 20: 146–60. [Google Scholar] [CrossRef] [Green Version]
  51. Jianu, Ionel, Carmen Ţurlea, and Ionela Guşatu. 2015. The Reporting and Sustainable Business Marketing. Sustainability 8: 23. [Google Scholar] [CrossRef] [Green Version]
  52. Kamilia, Bahia, and Nantel Jacques. 2000. A Reliable and Valid Measurement Scale for the Perceived Service Quality of Banks. The International Journal of Bank Marketing 18: 84–91. [Google Scholar]
  53. Kant, Rishi, and Deepak Jaiswal. 2017. The Impact of Perceived Service Quality Dimensions on Customer Satisfaction: An Empirical Study on Public Sector Banks in India. International Journal of Bank Marketing 35: 411–30. [Google Scholar] [CrossRef]
  54. Khamis, Fauz Moh, and Rosemaliza AbRashid. 2018. Service Quality and Customer’s Satisfaction in Tanzania’s Islamic Banks: A Case Study at People’s Bank of Zanzibar (PBZ). Journal of Islamic Marketing 9: 884–900. [Google Scholar] [CrossRef]
  55. Khan, Abdul Gaffar, Reshma Pervin Lima, and Md Shahed Mahmud. 2021. Understanding the Service Quality and Customer Satisfaction of Mobile Banking in Bangladesh: Using a Structural Equation Model. Global Business Review 22: 85–100. [Google Scholar] [CrossRef]
  56. Khatoon, Sadia, Xu Zhengliang, and Hamid Hussain. 2020. The Mediating Effect of Customer Satisfaction on the Relationship between Electronic Banking Service Quality and Customer Purchase Intention: Evidence from the Qatar Banking Sector. SAGE Open 10: 2158244020935887. [Google Scholar] [CrossRef]
  57. Krishnamurthy, Ravichandran, B. Tamil Mani, S. Arun Kumar, and Sandhya Prabhakaran. 2010. Influence of Service Quality on Customer Satisfaction Application of Servqual Model. International Journal of Business and Management 5: 117. [Google Scholar] [CrossRef] [Green Version]
  58. Kumar, Mukesh, K. Sukumaran Sujit, and Vincent Charles. 2018. Deriving Managerial Implications through SERVQUAL Gap Elasticity in UAE Banking. International Journal of Quality & Reliability Management 35: 940–64. [Google Scholar]
  59. Ladhari, Riadh, Nizar Souiden, and Ines Ladhari. 2011. Determinants of Loyalty and Recommendation: The Role of Perceived Service Quality, Emotional Satisfaction and Image. Journal of Financial Services Marketing 16: 111–24. [Google Scholar] [CrossRef] [Green Version]
  60. Lee, Sanghyun, Lucette B. Comer, Alan J. Dubinsky, and Kai Schafer. 2011. The Role of Emotion in the Relationship Between Customers and Automobile Salespeople1. Journal of Managerial Issues 23: 206. [Google Scholar]
  61. Markovic, Stefan, Oriol Iglesias, Jatinder Jit Singh, and Vicenta Sierra. 2018. How Does the Perceived Ethicality of Corporate Services Brands Influence Loyalty and Positive Word-of-Mouth? Analyzing the Roles of Empathy, Affective Commitment, and Perceived Quality. Journal of Business Ethics 148: 721–40. [Google Scholar] [CrossRef]
  62. Munusamy, Jayaraman, Shankar Chelliah, and Hor Wai Mun. 2010. Service Quality Delivery and Its Impact on Customer Satisfaction in the Banking Sector in Malaysia. International Journal of Innovation, Management and Technology 1: 398. [Google Scholar]
  63. Murray, John, Jonathan Elms, and Mike Curran. 2019. Examining Empathy and Responsiveness in a High-Service Context. International Journal of Retail & Distribution Management 47: 1364–78. [Google Scholar]
  64. Nazeri, Ali, Rahman Soofifard, Mohsen Ebrahimi, and Ladan Babayof. 2019. The Effect of the Internet Banking Service Quality on Customer Satisfaction (Case Study: Refah Bank in Tehran). International Journal of Services and Operations Management 34: 65–80. [Google Scholar] [CrossRef]
  65. Negash, Geleta Etana. 2021. Impact of Service Quality Performance on Customer Satisfaction: A Case of Oromia International Bank (OIB), Ambo Branch, West Shoa Zone, Oromia Regional State, Ethiopia. African Journal of Marketing Management 13: 12–24. [Google Scholar]
  66. Nguyen, Do Thanh, Van Thanh Pham, Dung Manh Tran, and Duyen Bich T. Pham. 2020. Impact of Service Quality, Customer Satisfaction and Switching Costs on Customer Loyalty. The Journal of Asian Finance, Economics and Business 7: 395–405. [Google Scholar] [CrossRef]
  67. Olorunniwo, Festus, Maxwell K. Hsu, and Godwin J. Udo. 2006. Service Quality, Customer Satisfaction, and Behavioral Intentions in the Service Factory. Journal of Services Marketing 20: 59–72. [Google Scholar] [CrossRef]
  68. Ong, Khian Sin, Bang Nguyen, and Sharifah Faridah Syed Alwi. 2017. Consumer-Based Virtual Brand Personality (CBVBP), Customer Satisfaction and Brand Loyalty in the Online Banking Industry. International Journal of Bank Marketing 35: 370–90. [Google Scholar] [CrossRef]
  69. Oppewal, Harmen, and Marco Vriens. 2000. Measuring Perceived Service Quality Using Integrated Conjoint Experiments. The International Journal of Bank Marketing 18: 154–69. [Google Scholar] [CrossRef]
  70. Othman, AbdulQawi, and Lynn Owen. 2001. Adopting and Measuring Customer Service Quality (SQ) in Islamic Banks: A Case Study in Kuwait Finance House. International Journal of Islamic Financial Services 3: 1–26. [Google Scholar]
  71. Pakurár, Miklós, Hossam Haddad, János Nagy, József Popp, and Judit Oláh. 2019. The Service Quality Dimensions That Affect Customer Satisfaction in the Jordanian Banking Sector. Sustainability 11: 1113. [Google Scholar] [CrossRef] [Green Version]
  72. Parasuraman, Ananthanarayanan, Valarie A. Zeithaml, and Leonard L. Berry. 1988. SERVQUAL: A Multiple-Item Scale for Measuring Consumer Perceptions of Service Quality. Journal of Retailing 64: 12–40. [Google Scholar]
  73. Parasuraman, Ananthanarayanan, Leonard Berry, and Valerie Zeithaml. 2002. Refinement and Reassessment of the SERVQUAL Scale. Journal of Retailing 67: 114. [Google Scholar]
  74. Parasuraman, Anantharanthan, Valarie A. Zeithaml, and Leonard L. Berry. 1985. A Conceptual Model of Service Quality and Its Implications for Future Research. Journal of Marketing 49: 41–50. [Google Scholar] [CrossRef]
  75. Parasuraman, Arun, Leonard L. Berry, and Valarie A. Zeithaml. 1991. Understanding Customer Expectations of Service. Sloan Management Review 32: 39–48. [Google Scholar]
  76. Peitzika, Eirini, Sofia Chatzi, and Dimitra Kissa. 2020. Service Quality Expectations in the Fitness Center Context: A Validation of the Expectations Component of the SERVQUAL Scale in Greece. Services Marketing Quarterly 41: 89–104. [Google Scholar] [CrossRef]
  77. Peng, Lee Siew, and Sedigheh Moghavvemi. 2015. The Dimension of Service Quality and Its Impact on Customer Satisfaction, Trust, and Loyalty: A Case of Malaysian Banks. Asian Journal of Business and Accounting 8: 91–121. [Google Scholar]
  78. Phan, Tien, Vinh Thai, and Thao Vu. 2021. Port Service Quality (PSQ) and Customer Satisfaction: An Exploratory Study of Container Ports in Vietnam. Maritime Business Review 6: 72–94. [Google Scholar] [CrossRef]
  79. Pooya, Alireza, Mehran Abed Khorasani, and Simin Gholamian Ghouzhdi. 2020. Investigating the Effect of Perceived Quality of Self-Service Banking on Customer Satisfaction. International Journal of Islamic and Middle Eastern Finance and Management 13: 263–80. [Google Scholar] [CrossRef]
  80. Potluri, Rajasekhara Mouly, Srinivas Rao Angati, and M Srinivasa Narayana. 2016. A Structural Compendium on Service Quality and Customer Satisfaction: A Survey of Banks in India. Journal of Transnational Management 21: 12–28. [Google Scholar] [CrossRef]
  81. Powell, Philip A., and Jennifer Roberts. 2017. Situational Determinants of Cognitive, Affective, and Compassionate Empathy in Naturalistic Digital Interactions. Computers in Human Behavior 68: 137–48. [Google Scholar] [CrossRef] [Green Version]
  82. Rahman, Md Atikur, Md Julfikar Ali, Zhang Kejing, Rupali Dilip Taru, and Zahidur Rahman Mamoon. 2020. Investigating the Effect of Service Quality on Bank Customers’ Satisfaction in Bangladesh. The Journal of Asian Finance, Economics and Business 7: 823–29. [Google Scholar] [CrossRef]
  83. Rashid, Md Harun Ur, Mohammad Nurunnabi, Mahfuzur Rahman, and Md Abdul Kaium Masud. 2020. Exploring the Relationship between Customer Loyalty and Financial Performance of Banks: Customer Open Innovation Perspective. Journal of Open Innovation: Technology, Market, and Complexity 6: 108. [Google Scholar] [CrossRef]
  84. Rasyida, Dyah R., M. Mujiya Ulkhaq, Priska R. Setiowati, and Nadia A. Setyorini. 2016. Assessing Service Quality: A Combination of SERVPERF and Importance-Performance Analysis. In MATEC Web of Conferences, the 3rd International Conference on Industrial Engineering and Applications (ICIEA 2016). Les Ulis: EDP Sciences, vol. 68, p. 06003. [Google Scholar] [CrossRef] [Green Version]
  85. Reinartz, Werner, Michael Haenlein, and Jörg Henseler. 2009. An Empirical Comparison of the Efficacy of Covariance-Based and Variance-Based SEM. International Journal of Research in Marketing 26: 332–44. [Google Scholar] [CrossRef] [Green Version]
  86. Ringle, Christian M., Sven Wende, and A. S. Will. 2015. SmartPLS. 2.0 (M3) Beta. Hamburg: University of Hamburg. [Google Scholar]
  87. Rioja, Felix, and Neven Valev. 2004. Finance and the Sources of Growth at Various Stages of Economic Development. Economic Inquiry 42: 127–40. [Google Scholar] [CrossRef]
  88. Ross, Dhyana Sharon, and Ramesh Venkatesh. 2015. An Empirical Study of the Factors Influencing Quality of Healthcare and Its Effects on Patient Satisfaction. International Journal of Innovative Research in Science, Engineering and Technology 4: 54–59. [Google Scholar]
  89. Sardana, Shivani, and Venkata N. Bajpai. 2020. E-Banking Service Quality and Customer Satisfaction: An Exploratory Study on India. International Journal of Services and Operations Management 35: 223–47. [Google Scholar] [CrossRef]
  90. Schneider, Benjamin, and Susan S. White. 2004. Service Quality: Research Perspectives. Thousand Oaks: Sage Publication. [Google Scholar]
  91. Selvakumar, J. Joshua. 2015. Impact of Service Quality on Customer Satisfaction in Public Sector and Private Sector Banks. Purushartha: A Journal of Management, Ethics and Spirituality 8: 1–12. [Google Scholar]
  92. Seth, Nitin, Sanjeev Gopalrao Deshmukh, and Prem Vrat. 2005. Service Quality Models: A Review. International Journal of Quality & Reliability Management 22: 913–49. [Google Scholar]
  93. Shayestehfar, Reza, and Bita Yazdani. 2019. Bank Service Quality: A Comparison of Service Quality between BSI Branches in Isfahan and Dubai. The TQM Journal 31: 28–51. [Google Scholar] [CrossRef]
  94. Shi, Yan, Abu Bakkar Siddik, Mohammad Masukujjaman, Guangwen Zheng, Muhammad Hamayun, and Abdullah Mohammed Ibrahim. 2022. The Antecedents of Willingness to Adopt and Pay for the IoT in the Agricultural Industry: An Application of the UTAUT 2 Theory. Sustainability 14: 6640. [Google Scholar] [CrossRef]
  95. Shokouhyar, Sajjad, Sina Shokoohyar, and Sepehr Safari. 2020. Research on the Influence of After-Sales Service Quality Factors on Customer Satisfaction. Journal of Retailing and Consumer Services 56: 102139. [Google Scholar] [CrossRef]
  96. Slack, Neale J., and Gurmeet Singh. 2020. The Effect of Service Quality on Customer Satisfaction and Loyalty and the Mediating Role of Customer Satisfaction: Supermarkets in Fiji. The TQM Journal 32: 543–58. [Google Scholar] [CrossRef]
  97. The Business Standard. 2020. Six More Non-Bank Financial Institutions in Trouble. Available online: https://tbsnews.net/economy/banking/six-more-non-bank-financial-institutions-trouble (accessed on 3 February 2023).
  98. Uddin, K. M. Salah, Nymatul Jannat Nipa, and Mamunur Rashid. 2015. Identification the Factors Influencing Customer Satisfaction on Service Quality in Jamuna Bank. International Journal of Business and Economic Research 4: 30–35. [Google Scholar] [CrossRef] [Green Version]
  99. Umoke, MaryJoy, Prince Christian Ifeanachor Umoke, Ignatius O. Nwimo, Chioma Adaora Nwalieji, Rosemary N. Onwe, Nwafor Emmanuel Ifeanyi, and Agbaje Samson Olaoluwa. 2020. Patients’ Satisfaction with Quality of Care in General Hospitals in Ebonyi State, Nigeria, Using SERVQUAL Theory. SAGE Open Medicine 8: 2050312120945129. [Google Scholar] [CrossRef]
  100. Vencataya, Lomendra, Sharmila Pudaruth, Roubina Juwaheer, Ganess Dirpal, and Nebeelah Sumodhee. 2019. Assessing the Impact of Service Quality Dimensions on Customer Satisfaction in Commercial Banks of Mauritius. Studies in Business and Economics 14: 259–70. [Google Scholar] [CrossRef] [Green Version]
  101. Vittas, Dimitri. 1997. The Role of Non-Bank Financial Intermediaries in Egypt and Other MENA Countries. Washington, DC: Development Research Group, World Bank. Available online: https://papers.ssrn.com/sol3/Delivery.cfm/698.pdf?abstractid=620529&mirid=1 (accessed on 3 February 2023).
  102. Wang, Yonggui, Hing-Po Lo, and Yongheng Yang. 2004. An Integrated Framework for Service Quality, Customer Value, Satisfaction: Evidence from China’s Telecommunication Industry. Information Systems Frontiers 6: 325–40. [Google Scholar] [CrossRef]
  103. Yarimoglu, Emel Kursunluoglu. 2014. A Review on Dimensions of Service Quality Models. Journal of Marketing Management 2: 79–93. [Google Scholar]
  104. Yun, Jeewoo, and Jungkun Park. 2022. The Effects of Chatbot Service Recovery with Emotion Words on Customer Satisfaction, Repurchase Intention, and Positive Word-of-Mouth. Frontiers in Psychology 13: 2912. [Google Scholar] [CrossRef] [PubMed]
  105. Zeithaml, Valarie A., Ananthanarayanan Parasuraman, Leonard L. Berry, and Leonard L. Berry. 1990. Delivering Quality Service: Balancing Customer Perceptions and Expectations. New York: Simon and Schuster. [Google Scholar]
  106. Zhang, Min, Xueping He, Fang Qin, Wenbiao Fu, and Zhen He. 2019. Service Quality Measurement for Omni-Channel Retail: Scale Development and Validation. Total Quality Management & Business Excellence 30: S210–S226. [Google Scholar]
  107. Zia, Adil. 2020. Discovering the Linear Relationship of Service Quality, Satisfaction, Attitude and Loyalty for Banks in Albaha, Saudi Arabia. PSU Research Review 6: 90–104. [Google Scholar] [CrossRef]
Figure 1. A research framework for service quality and customer satisfaction. Source: Modified from Cronin and Taylor (1992).
Ijfs 11 00033 g001
Figure 2. The measurement model (determinants) of service quality. Source: SmartPLS 2.0 outputs.
Ijfs 11 00033 g002
Table 1. Demographic profile of the respondents (n = 205).
AspectsClassificationFrequencyPercentage
GenderMale17585.36%
Female3014.64%
Age≤25 years3818.54%
26–33 years6833.17%
34–49 years8842.92%
≥50 years115.36%
Marital statusMarried14570.73%
Unmarried6029.27%
Education LevelNo Education125.85%
SSC94.39%
HSC2914.14%
Graduate9345.36%
Postgraduate6230.24%
OccupationPrivate Service6129.76%
Government service2512.19%
Business10048.78%
Housewife73.41%
Student/unemployed136.34%
Table 2. The EFA of service quality and customer satisfaction.
ConstructNo. of ItemsIndicatorsLoadingsComposite ReliabilityAverage Variance Extracted (AVE)
Accessibility5Acces_1NBFIs have enough seats0.5620.8440.520
Acces_2Moving inside is easy and comfortable0.658
Acces_3The location is suitable to access0.809
Acces_4NBFIs have an easy parking area0.759
Acces_5Office and transaction hours are suitable0.797
Assurance5Assu_1NBFIs’ employees provide trustworthy, consistent and efficient service to clients0.7710.8660.620
Assu_2NBFIs ensure a complete and safe transaction0.762
Assu_3NBFIs’ staff courteously talk with their customers0.798
Assu_4Staff have sufficient expertise to answer customers’ questions0.809
Assu_5Bank employees’ information is clear and comprehensible0.135 *
Empathy5Emp_1The employees of NBFIs give special attention to the customer0.8460.8490.660
Emp_2Staff offer customers guidance and suggestions0.919
Emp_3Employees understand the clients’ needs0.641
Emp_4NBFIs have my best interests at heart 0.267 *
Emp_5NBFIs give me individual attention −0.1 *
Reliability5Rel_1NBFIs are genuine in solving claims 0.7410.8420.640
Rel_2NBFIs complete service at the promised time0.788
Rel_3Clients’ records always come free of errors0.868
Rel_4The NBFI periodically sends financial records to my current address to inform balance0.088 *
Rel_5The staff of the NBFI is deeply concerned about the settlement of my bank-related issues0.12 *
Responsive-ness5Resp_1Clients are always informed when their service is done spontaneously 0.8790.8960.740
Resp_2NBFIs are always ready to keep requests0.853
Resp_3Employees serve the client without delay or hesitation0.852
Resp_4Staff at the bank answer my requests quickly0.037 *
Resp_5Bank staff adjust any mistakes rapidly−0.03 *
Tangibility6Trans_1NBFIs have modern equipment0.7470.8310.500
Trans_2NBFIs’ layout is nicely done0.622
Trans_3Employees are well dressed0.683
Trans_4NBFIs are neat and clean0.683
Trans_5NBFIs’ accounting system is good0.782
Trans_6Hard copies such as forms, monthly reports, flyers and transaction cards are very lucrative0.032 *
Customer Satisfaction6Cus_Satis_1I’m satisfied with the facilities of the NBFs0.7300.7970.500
Cus_Satis_2My NBFI meets my specifications0.700
Cus_Satis_3Overall, my NBFI provides good value for money0.437
Cus_Satis_4In comparison with others, my NBFI offers excellent service quality0.752
Cus_Satis_5Overall, I hold a good impression of my NBFI0.472
Cus_Satis_6I recommend my friends and relatives to take service from NBFIs0.793
Threshold point: loadings and AVE > 0.50, CR value > 0.70 and DV = Yes. * Items are removed from the model due to having a lower value than 0.5.
Table 3. Discriminant validity confirmation based on the Fornell–Larcker method (service quality).
AccessibilityAssuranceEmpathyReliabilityResponsivenessCustomer SatisfactionTangibilityDiscriminant Validity
Accessibility0.7240000000Yes
Assurance0.47180.785200000Yes
Empathy0.65160.19130.81090000Yes
Reliability0.37420.3660.18800.7862000Yes
Responsiveness0.47450.62740.17160.71770.861200Yes
Customer Satisfaction0.70230.60660.52020.26440.43570.76260Yes
Tangibility0.62020.63070.43400.20550.45400.68650.7077Yes
Note: The bold and diagonal values indicate the Fornell–Larker patterns, and the underlined value denotes the value of the maximum correlation per construct.
Table 4. Path coefficient and significance level by the bootstrapping test.
Path Coeffi#CientT StatisticsSig. Levelp Values90% Confidence IntervalResult
H1: Reliability → CS0.28793.4281***0.0010.150.43Supported
H2: Tangibility → CS0.20542.1732**0.0320.050.36Supported
H3: Empathy → CS0.12851.8352NS0.0690.010.24Not Supported
H4: Responsiveness → CS0.32483.3711***0.0010.170.48Supported
H5: Assurance → CS0.17762.0840**0.0400.040.32Supported
H6: Accessibility → CS−0.00640.0723NS0.943−0.150.14Not supported
Note: ** p < 0.05. *** p < 0.01. CS = Customer Satisfaction.
Table 5. The path coefficient, VIF, R2, Q2, f2 and q2 value of dimensions of service quality.
Collinearity:
VIF (Tolerance)
f2 Effect Sizeq2 Effect Size
Accessibility2.551 (0.392)0.000−0.001
Assurance2.153 (0.464)0.0350.001
Empathy1.823 (0.548)0.0270.000
Reliability2.294 (0.436)0.1190.020
Responsiveness3.38 (0.296)0.0920.017
Tangibility2.163 (0.462)0.0470.006
Customer SatisfactionR2 = 0.705, Q2 = 0.3233
Disclaimer/Publisher’s Note: The statements, opinions and data contained in all publications are solely those of the individual author(s) and contributor(s) and not of MDPI and/or the editor(s). MDPI and/or the editor(s) disclaim responsibility for any injury to people or property resulting from any ideas, methods, instructions or products referred to in the content.

