1. Introduction
Consonants are produced differently in different phonetic environments. For example, /b, d, ɡ/, in most if not all Spanish dialects, are produced as voiced stops [b, d, ɡ] after a pause, a homorganic nasal, and in the case of /d/, after a lateral /l/ (
Navarro Tomás 1977;
Hammond 2001;
Hualde 2005), but as voiced fricatives (i.e., voiced continuants) [β, ð, ɣ] in other contexts. These include intervocalic and postvocalic syllable-onset positions, both within and across word boundaries. For example, [bas] ‘you go’, [das] ‘you give’, and [ɡ as] ‘gas’, but [aβas] ‘beans’, [aðas] ‘fairies’, and [aɣas] ‘you do (subjunctive)’ (
González 2002). The weakening of an underlying stop consonant to a voiced continuant demonstrated by these examples is commonly referred to as spirantization, one of the most widely studied phonological phenomena of Spanish. In turn, spirantization belongs to a broader class of a phonological process known as lenition, which also includes degemination, [tt → t]; deaspiration, [t
h] → [t]; voicing, [t] → [d]; flapping, [t, d] → [ɾ]; debucalization, [t] → [ʔ, h]; gliding, [t] → [j]; and deletion or loss, [ʔ, h, j] → [ø] (
Gurevich 2011).
Despite having been traditionally described as having a continuant and a non-continuant realization in complementary distribution, phonetic studies revealed a more varied and gradient distribution of the surface, lenited forms of Spanish voiced stops. For instance, continuant realizations, previously characterized as fricatives (i.e., produced with turbulent airflow) (e.g.,
Navarro Tomás 1977;
Harris 1969;
Lozano 1978;
Mascaró and Aronoff 1984), have been shown to be phonetically closer to approximants [
,
,
] (i.e., produced without turbulent airflow) (e.g.,
Celdrán 1984;
Romero 1995). Phonetic investigations also revealed large phonetic variability and gradience among continuant realizations conditioned by various factors, including surrounding vowel quality, stress, and speaking rate (e.g.,
Cole et al. 1999;
Ortega-Llebaria 2004) suggesting a continuum rather than a fixed degree of constrictions across environments. Furthermore, the degree of constriction shows an effect on the place of articulation and surrounding vowel height (
Ortega-Llebaria 2004;
Carrasco et al. 2012;
Simonet et al. 2012). Besides voiced stops, voiceless stops in Spanish also undergo lenition (e.g.,
Broś et al. 2021). The goal of this study is to compare lenition quantification metrics of lenited Argentinian Spanish stops consonants in intervocalic positions.
1.1. Acoustic Correlates of Lenition
The degree of lenition has been acoustically quantified along several acoustic dimensions, including intensity, duration, spectral (e.g., spectral peak, mean, standard deviation, and kurtosis), and periodic acoustic measures (e.g., harmonic-to-noise ratio), of which intensity, calculated as a difference or as a ratio, is the most prevalent (
Cole et al. 1999;
Ortega-Llebaria 2004;
Soler and Romero 1999;
Hualde et al. 2011). For example,
Martínez-Celdrán and Regueira (
2008),
Figueroa and Evans (
2015), and
Broś et al. (
2021) used intensity difference (preceding segment’s maximum intensity minus minimum intensity of the target consonant) as a lenition marker. Similarly,
Hualde et al. (
2011) used the difference between the maximum intensity value during the vowel following the target consonant and the minimum value during the target consonant portion to quantify the degree of lenition. The more open the constriction of the target consonant (i.e., the more lenited the target consonant), the smaller the difference is expected to be.
The second intensity measure previously used to quantify the degree of lenition is the maximum rising velocity from the midpoint of the target consonant to the midpoint of the following vowel (
Hualde et al. 2011,
2012;
Kingston 2008). The more lenited the consonant is, the less abrupt the transition in intensity is and, thus, the smaller the maximum rising velocity value. Lastly, the mean intensity of the target sounds could also indicate their degree of lenition: the higher the mean intensity, the more advanced their degree of lenition. However, since this measure could vary greatly with speaking volume, it may not be as reliable as relative intensity measures.
Besides relative intensity, the relative duration of the target consonant (target sound duration divided by the total duration of the preceding sound + target sound + following sound) correlates negatively with the degree of consonant weakening and has been used as a reliable lenition marker (e.g.,
Dalcher 2008). This measurement is usually used when the target consonant occurs intervocalically but can be adapted to other contexts. For example, an alternative relative duration ratio was calculated by dividing the target-sound duration by the total duration of the preceding sound + target sound in
Broś et al. (
2021) because the segment following the target sound was not always a vowel in their data. The more lenited the target consonant, the shorter its duration is expected to be, thus the smaller the duration ratio.
The harmonics-to-noise ratio (HNR) is another lenition marker first employed by
Broś et al. (
2021). HNR is a measure of the proportion of acoustic periodicity (harmonic) to aperiodicity (noise) of a given sound and is expressed in decibels (dB). A HNR of 0 dB indicates equal energy in harmonics (periodicity) and noise. A positive HNR value indicates higher harmonic energy relative to noise energy, while a negative HNR value indicates higher noise energy relative to harmonic energy. For example, a HNR of 3 dB means that the harmonic energy is twice the noise energy (10 × log
10 (2/1)), but a HNR of −3 dB HNR (10 × log
10 (1/2)) indicates the opposite.
Broś et al. (
2021) reasoned that the more lenited a segment, the more vowel-like it is, hence the higher the HNR.
An alternative method of measuring the degree of periodicity, called ‘Noise’, was proposed by
Harris et al. (
forthcoming), which builds on
Harris and Urua (
2001). Noise is computed using a three-step algorithm that combines measurements of amplitude and aperiodicity within a VCX analysis frame. First, the algorithm computes the aperiodicity of the signal using an autocorrelation measure. Second, it locates the target consonant within the frame using the minimum amplitude. Third, it searches forward within the frame until it finds the point with the maximum product of aperiodicity and normalized amplitude values, which yields a Noise score. The higher the Noise score, the greater the degree of aperiodic energy in the signal. One of its advantages over the HNR measure is that Noise can investigate a wider set of lenition phenomena, such as the release properties of final stops, which does not exist in Spanish.
The goal of this study is to compare a new approach to quantify the degree of lenition known as ‘Phonet’ to the traditional acoustic markers such as those described above. Phonet is a deep learning model. Unlike the quantitative acoustic approach, where values along different acoustic dimensions are directly used to estimate lenition, in the Phonet model, the degree of lenition is estimated from the posterior probabilities of sonorant and continuant phonological features computed directly from the input signals by bidirectional recurrent neural networks (RNNs). Specifically, the approach projects gradient surface acoustic parameters onto two phonological features, continuant and sonorant, to capture both categorical and gradient realizations of lenition. Additionally, it is largely automatic and can be customized for a specific language investigated. The basis for this approach is outlined in the following sections.
1.2. Lenition and Phonological Features
Phonemes are classified into broad categories or classes based on their common phonological features (
Jakobson et al. 1951;
Chomsky and Halle 1968). The broadest class is [consonantal]. In most, if not all, languages, phonemes are either [+consonantal] or [−consonantal]. [+consonantal] sounds are produced with varying degrees of constriction of articulators in the vocal tract, while [−consonantal] phonemes are produced with no oral constriction. Stops, fricatives, affricates, nasals, and liquids belong to the first category of phonemes, while the second category is restricted to vowel and glide phonemes in most languages. [syllabic] is another main phonological feature in languages. [+syllabic] phonemes are the most sonorous segments of a language and are permitted to occupy the nucleus position of a syllable, whereas [−syllabic] phonemes are not. Vowels and syllabic consonants (ɹ̩, l̩, n̩, m̩ etc.) are [+syllabic] while consonants including glides are [−syllabic].
The second major class is [sonorant] and its inverse [obstruent]. [+sonorant] includes phonemes produced with little to no constriction in the oral cavity, hence: relatively free airflow and the ability to sustain resonance. Nasals, liquids, glides, and vowels are [+sonorant], while stops, fricatives, and affricates which are produced with complete or substantial airflow obstruction are [−sonorant] or [+obstruent].
The third phonological class relevant to our study is [continuant]. This feature describes the sustenance of airflow through the oral cavity. [+continuant] phonemes are produced with continual airflow through an incomplete closure between articulators. For example, fricatives are classified as [+continuant] because they are articulated with only partial oral occlusion, and airflow is permitted to flow continuously during their articulation. Other [+continuant] phonemes are liquids, glides, and vowels. For nasals, they are classified by some as [−continuant] because of airflow blockage through the oral cavity during their production, but as [+continuant] because continuous airflow is allowed through the nasal cavity. In this study, nasals are specified as [−continuant]. See
Hayes (
2008) for an introduction to other phonological features.
The distribution of phonological features allows us to group phonemes into natural classes (groups of phonemes that share one or a set of phonological features). Phonemes belonging to the same natural class pattern together when undergoing various phonological processes. For example, in English, /p, t, k/ are [−syllabic, −voice, −continuant, −sonorant, −delayed release] and form a natural class. They all become aspirated when they occur as an onset of a stressed syllable. [−delayed release] is characterized by an abrupt release of occluded airflow, while [+delayed release] is characterized by a gradual release of airflow following the opening of an oral closure. In Spanish, /b, d, ɡ/ are [−syllabic, +voice, −continuant, −sonorant, −delayed release] and form a natural class. As discussed above, they undergo lenition and are realized as fricatives [+continuant] or approximants [+sonorant] in an intervocalic position, for example. In other words, the lenition of Spanish-voiced stops can be simplistically described as involving categorical changes of the [continuant] and the [sonorant] features. However, to capture the highly varied and gradient degree of lenition, it is necessary that we look beyond categorical manifestations of lenition changes and beyond the binary nature of phonological features.
1.3. Posterior Probability and Gradience
Computational approaches have been used in several studies of phonetic variations whose aim was to measure gradient variations. Many of these studies have relied on forced alignment systems to determine pronunciation variations (e.g., [dʒ]-[z] and [pʰ]-[f] variations in Hindi English code-mixed speech (
Pandey et al. 2020), ‘g’-dropping in English (
Kendall et al. 2021;
Yuan and Liberman 2011), ‘th’-fronting, ‘t, d’-deletion, and ‘h’-dropping in English (
Bailey 2016). The forced alignment systems typically take word-level orthographic transcriptions as the input making reference to a pronunciation dictionary with phone-level transcription. Importantly, multiple pronunciations can be assigned to each word entry in the dictionary. For instance, to model ‘th’ fronting, two pronunciations, one with [θ] and one with [f], could be given to all word entries that may undergo ‘th’-fronting. Based on each word token’s acoustic properties, a trained forced aligner can automatically determine which of the two pronunciations has the highest probability. However, since a forced alignment model contains an acoustic model for each phone type defined in the pronunciation dictionary, the degree of variation could not be determined beyond the granularity of the phone set (e.g., as either [θ] or [f]).
An innovative method to obtain a more gradient measure of variations (e.g., degree of ‘th’-fronting) as opposed to simply coding a token as [θ] or [f]) was proposed by
Yuan and Liberman (
2009) in their investigation of the degree of /l/-darkness in American English. In this study, instead of relying on phone labels outputted by the forced alignment procedure, probability scores extracted during the forced alignment procedure were used as a measure of variation. The probability score is defined as the log probability (log probability density) of the aligned segment to be a particular phone. More specifically, all /l/ tokens from a corpus of American English were forced aligned twice: first by a model trained on light /l/s (word-initial) and second by a model trained on dark /l/s (word-final and word-final consonant clusters), and degree of /l/-darkness was indicated by the difference between the log probability scores from the dark /l/ alignment and the light /l/ alignment. The method was extended to examine the finer variation of both types of /l/s by
Yuan and Liberman (
2011). Their results demonstrated the categorical distinction between dark (in syllable coda) and light /l/ (in syllable onset) while also revealing that intervocalic dark /l/ is less dark than canonical syllable-coda dark /l/, and its degree of darkness depends on the stress of the flanking vowels. Intervocalic light /l/ is always light and is lighter than canonical syllable-onset /l/. This method was also applied to investigate gradient variation of /t/-/d/ affrication in English by
Magloughlin (
2018). In this case, the degree of affrication is the log probability scores from the /tʃ, dʒ/ alignment and the /tɹ, dɹ/ alignment using acoustic models of /tʃ/ and /dʒ/, and /t/ and /d/, respectively.
Besides acoustic models in a forced alignment system, the probability estimates from token classification can be obtained from other methods. For instance, in their investigation of the degree of r-lessness of postvocalic /r/ in English,
McLarty et al. (
2019) trained the Support Vector Machines (SVM) model to classify the canonical r-less tokens (oral vowels that are not preceding a liquid or a nasal) and the canonical r-full tokens (prevocalic /r/) using Mel-Frequency Cepstral Coefficients (MFCCs) as the acoustic representations. Once successfully trained (mean classification accuracy of 98.95%), the model was applied to ambiguous tokens (postvocalic /r/) to obtain a probability estimate of being r-less as opposed to r-full. A similar approach was used by
Villarreal et al. (
2000) in their examination of two English sociophonetic variables (non-prevocalic /r/ and word-medial intervocalic /t/). However, instead of SVM, the random forest classification method was used to automate coding categorical manifestations of the two variables. Note that the classification method used by most of these studies is trained on surface segments that are not necessary surface realizations of the segment undergoing variation of interest. It simply relies on acoustic similarities between these surface segments and the possible canonical realizations of a variation. For instance, in the case of ‘th’-fronting, the model was trained to classify tokens that are either canonically [θ] or canonically [f], and these canonical tokens themselves are not subjected to ‘th’-fronting. However, their acoustic characteristics would capture the range of possible surface realizations of ‘th’-fronting. In the case of /l/-darkening, canonical light /l/s, and dark /l/s are used in the training phase, and the trained model is then applied to /l/s that exhibit variable degrees of darkening.
The viability of this approach to estimate the categorical manifestation of lenition is demonstrated by the results of
Cohen Priva and Gleason (
2020). In this study, a range of processes commonly recognized as lenition was modeled using a spoken corpus of American English. Specifically, three types of modeling methods that differ in the underlying representation of the surface segments were examined. The first method compared the surface forms of two segment types (e.g., [t] and [d] for the lenition process /t/→ [d]) regardless of whether their underlying form was the segment in question (e.g., the [t] and [d] tokens do not need to share the underlying form /t/). The second method compared only the surface forms of two segment types that share the same underlying form (e.g., /t/ is the underlying form for both [t] and [d]). The third method compared only segments that surfaced unchanged (e.g., the [t] tokens realized from /t/ and the [d] tokens from /d/). Of significance is the finding that all three modeling approaches yielded the same results, suggesting that the various acoustic manifestations of a given lenition process (/t/→ [d] in this case) can be captured by comparing relevant pairs of surface segments, regardless of their underlying form.
The Phonet approach targets a whole class of lenition. Therefore, unlike
Cohen Priva and Gleason (
2020), we must go beyond classifying pairs of segments that are relevant to a lenition process, but rather two groups of segments that are categorized by a binary phonological feature. Specifically, we focus on the probability of the phonological feature [continuant], which differentiates stops from non-stops (e.g., stops lenited as a fricative), and the phonological feature [sonorant], which differentiates stops and fricatives from non-stops and non-fricatives (e.g., stops lenited as an approximant) because they capture the two categorical realizations of stop lenition in Spanish. A high [continuant] probability but a low [sonorant] probability would indicate a fricative-like realization, while a high [continuant] probability and a high [sonorant] probability would suggest an approximant-like realization of lenition. Unlike
Yuan and Liberman (
2009,
2011), where the degree of phonetic variation was estimated from the difference between the log probability scores of the two forced-alignment models (dark /l/ and light /l/), the degree of lenition is reflected in the probability of each phonological feature estimated from acoustic properties of the input signals.
1.4. Phonet
First proposed by
Vásquez-Correa et al. (
2019), Phonet estimates posterior probabilities of phonological features using bi-directional recurrent neural networks (RNNs) with gated-recurrent units (GRUs). Inputs to Phonet are feature sequences based on log energy distributed across triangular Mel filters computed from 25 ms windowed frames of each 0.5 s chunk of the input signal. These feature sequences are processed by two bidirectional GRU layers, so information from the past (backward) and future (forward) states of the sequence are modeled simultaneously. The output sequences of the second bidirectional GRU layer are then passed through a time-distributed, fully connected hidden dense layer, producing an output sequence of the same length as the input. Finally, a phonological class associated with the feature sequence from the input is produced by the connected time-distributed output layer with a softmax activation function. Phonet has been found to be highly accurate in detecting phonemes and phonological classes in Spanish (
Vásquez-Correa et al. 2019) and modeling the speech impairments of patients diagnosed with Parkinson’s disease (
Vásquez-Correa et al. 2019). The architecture of Phonet is described in detail in
Vásquez-Correa et al. (
2019).
In our study, twenty-three phonological classes of Spanish were trained by a bank of twenty-three Phonet networks and 26 phonemes by one network using an Adam optimizer (
Kingma and Ba 2014). Following
Vásquez-Correa et al. (
2019), to avoid the unbalance of the classes in the training process, a weighted categorical cross-entropy loss function, defined according to Equation (1), was used.
The weight factors wi for each class i = {1…C} are defined based on the percentage of samples from the training set that belong to each class. To improve the generalization of the networks, dropout and batch normalization layers were considered.
The use of MFCC-based acoustic features was motivated by how they are known to provide a good overall representation of the acoustic signal, as they often provide a wider range of acoustic information than individual acoustic features (
Davis and Mermelstein 1980;
Huang et al. 2001). In addition, MFCCs have been successfully used as acoustic representations in previous studies of phonetic variations (
Kendall et al. 2021;
Yuan and Liberman 2009,
2011;
McLarty et al. 2019). A comparison between our approach using MFCCs and the quantitative acoustic approach using various acoustic dimensions would allow us to consider alternative acoustic representations to improve our model.
In sum, Phonet is a phonologically motivated, language-specific, and largely automatic model. It is trained to recognize input phones as belonging to different groups, defined by their phonological features. Once trained, posterior probabilities for different phonological features of the target segments are computed by the model. It relies on a phonological concept in phonological analyses of lenition and can capture both categorical and gradient surface manifestations of lenition. Input to the model is log energy distributed across triangular Mel filters computed from 25 ms windowed frames of each 0.5 s chunk of the input of the target language phones, thus using acoustic information for a given phonological feature of the target language. Phonological feature sets can be customized for a given target language with different assumptions of their underlying specifications (
Lahiri and Reetz 2002;
Lahiri and Reetz 2010) and physical correlates (
Jakobson et al. 1951;
Chomsky and Halle 1968;
Backley 2011). Lastly, it only requires a phonological feature set and a segmentally-aligned acoustic corpus which can be obtained using forced alignment (see
Ennever et al. 2017 for an automated segmentation method).
3. Results
3.1. Mean HNR
The best regression model for HNR yielded marginal R2 and conditional R2 values of 0.575 and 0.657, respectively, suggesting that the fixed factors in the model explained 57.5% of the total variance while 65.7% of the variance is explained when all factors are included.
The results reveal the significant role of voicing, place of articulation, flanking vowel height, and speaking rate. As shown in
Table 2, the model yielded significant main effects of voicing: higher mean HNR for voiced stops than voiceless stops [
β = 10.433,
t = 54.976,
p < 0.001]; place of articulation: bilabial < dental [
β = −1.232,
t = −3.129,
p = 0.002], no significant difference between dental and velar; preceding vowel: close > mid > open [
βs = 1.164, 1.004;
ts = 3.347, 7.822;
ps = 0.001, <0.001]; following vowel: close > mid > open [
βs = 1.430, 0.595;
ts = 3.312, 1.989;
ps = 0.001, 0.047]; and speaking rate: the higher the speaking rate, the higher the mean HNR [
β = 0.124,
t = 5.063,
p < 0.001]. These results suggest that, overall, voiced stops are more lenited than voiceless stops [e.g., /b/ in
de boˈ
leto vs. /p/ in
lo poˈdés], dental stops are more lenited than bilabial stops [e.g., /d/ in
deˈdatos vs. /b/ in
mi ˈ
base], the less open the flanking vowels are, the more lenited the stops are (e.g., /b/ in
tu ˈvida vs. /b/ in
habla ˈvarios], and the faster the speaking rate, the higher the degree of lenition based on HNRs.
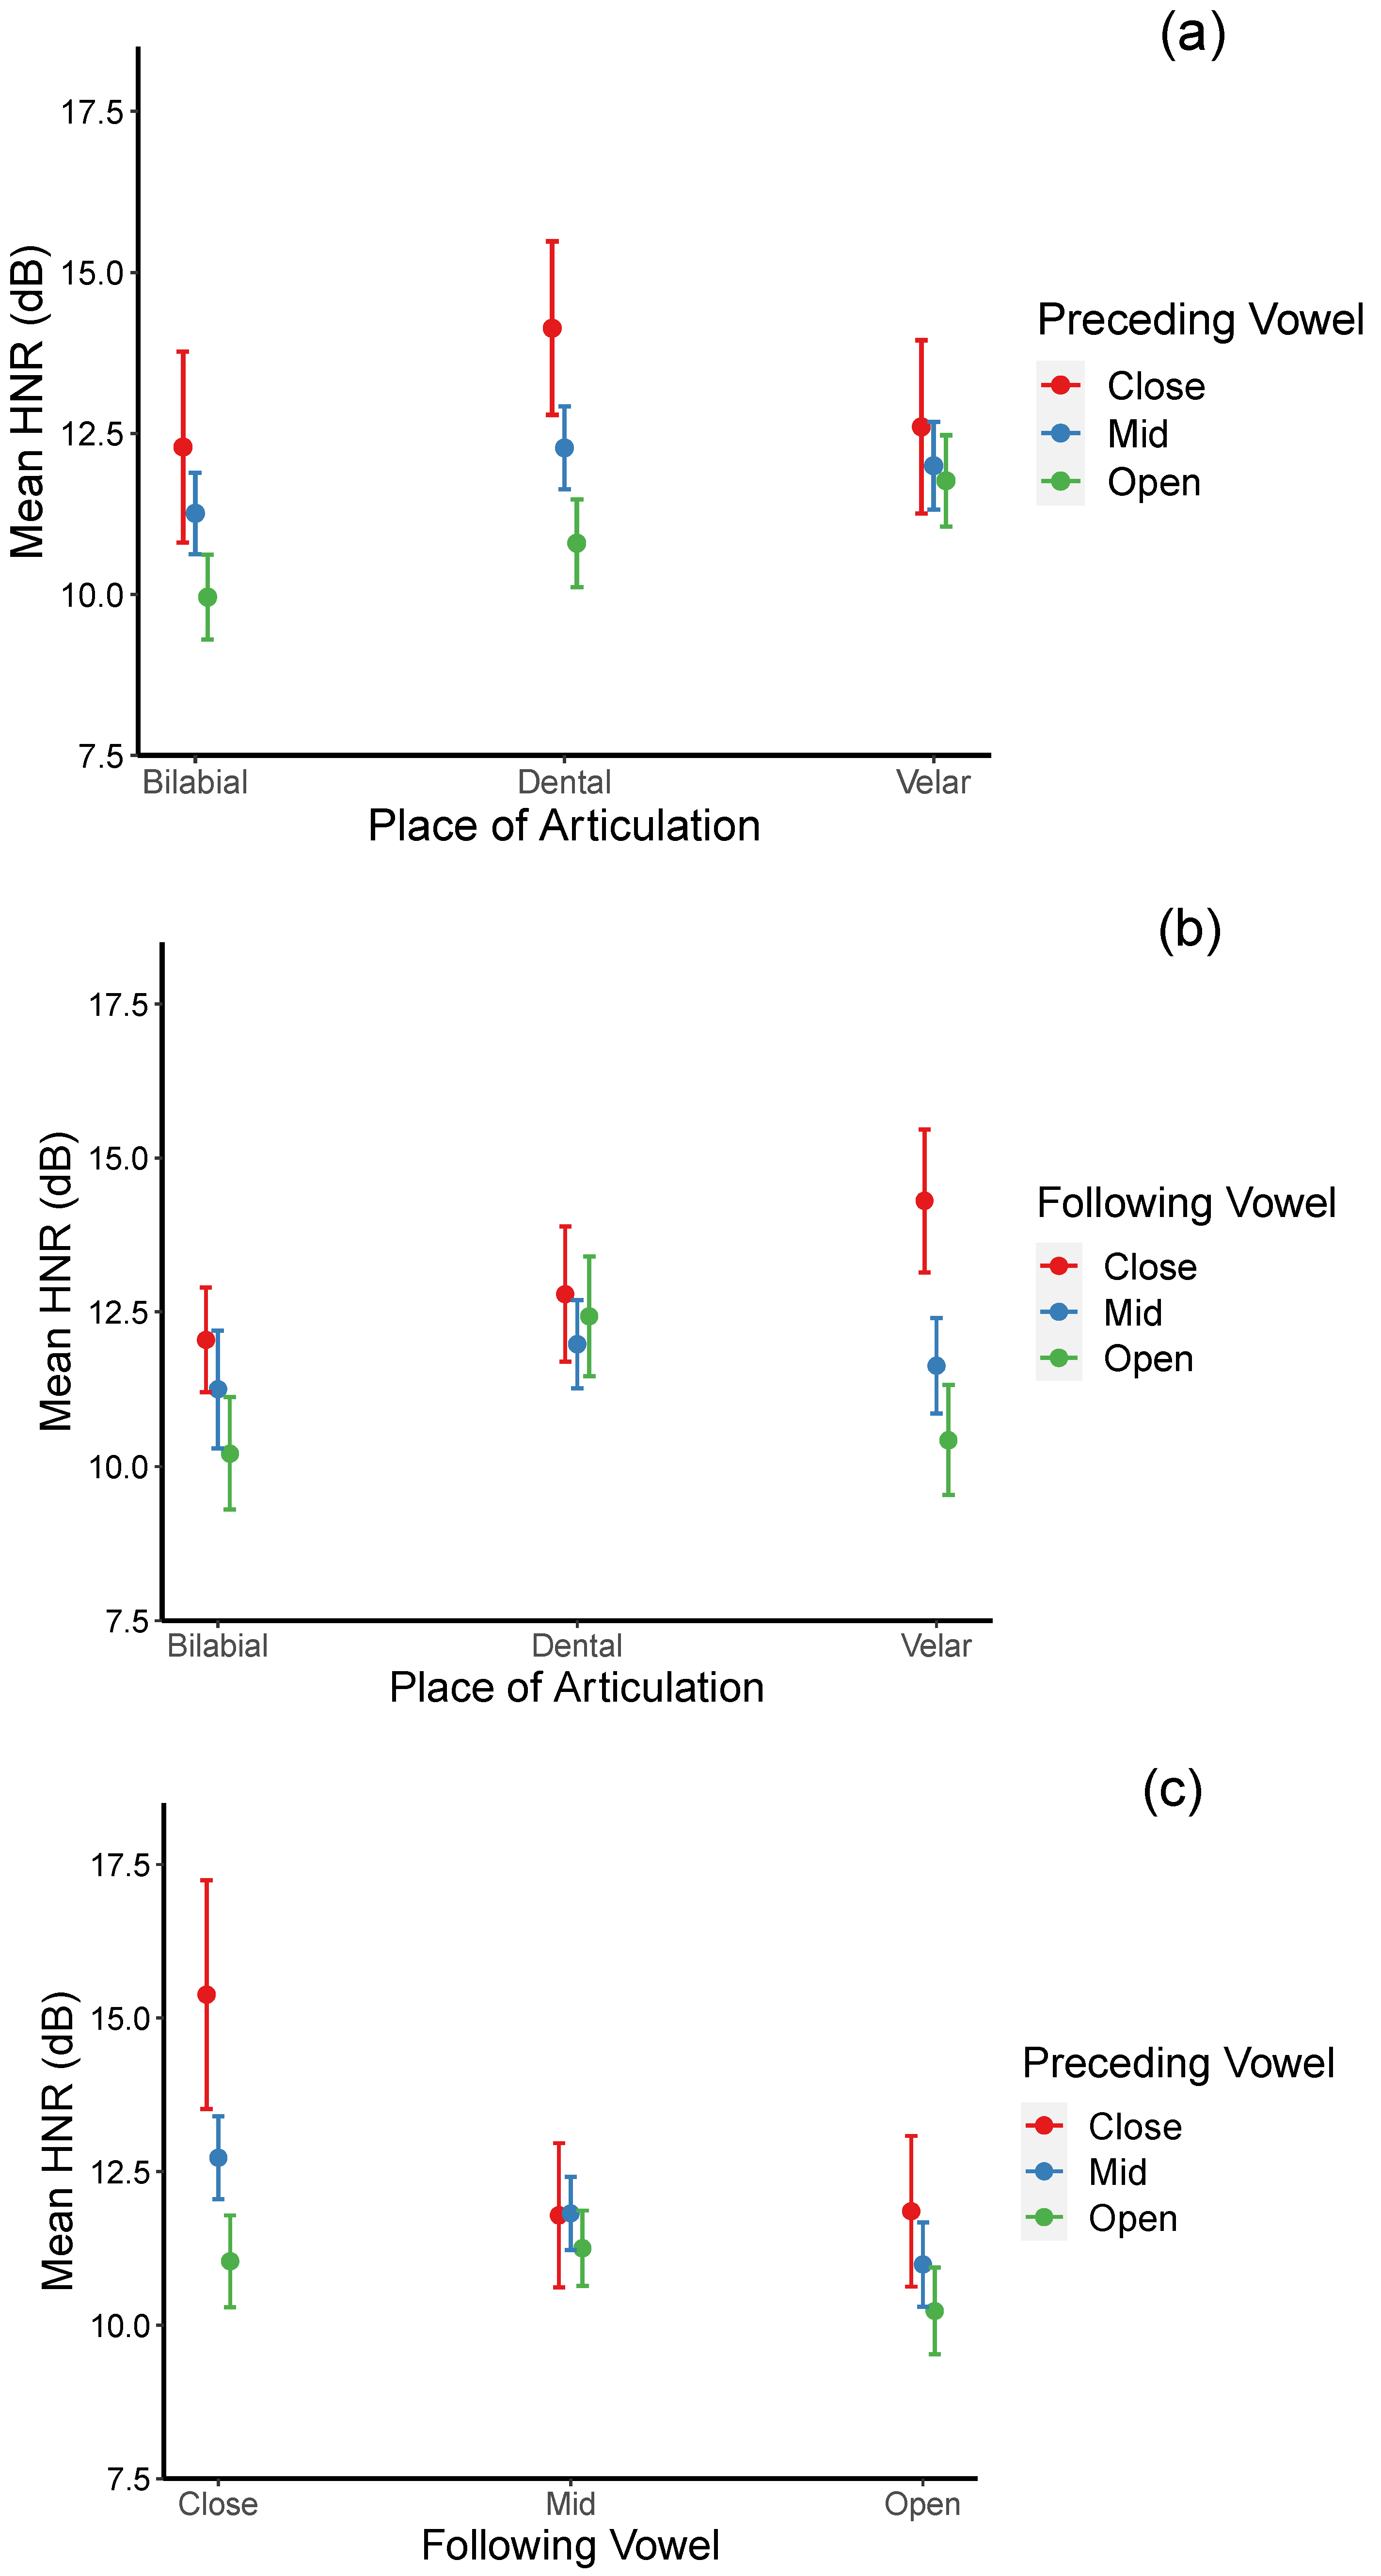
Significant interactions are also found between the place of articulation and the following vowel; between the place of articulation and the preceding vowel; and between the preceding vowel and the following vowel. For the place of articulation x preceding vowel interaction (see
Figure 1a), post hoc pair-wise comparisons using the Tukey method indicate no significant difference in HNR values of velar stops when preceded by different vowels. However, for bilabial and dental stops, their mean HNR values are significantly higher when they occur after close vowels than after open vowels [
βs = 2.330, 3.340;
ts = 3.257, 5.338;
p = 0.031, <0.001, for bilabial and dental stops, respectively]. In addition, mean HNR values for bilabial stops are significantly lower than those of dental stops when they are preceded by mid vowels [
β = −1.014,
t = −4.339,
p = 0.0006]. Interestingly, HNRs for both bilabial and dental stops are significantly lower than those of velar stops when preceded by open vowels [
βs = −1.806, −0.970;
ts = −6.535, −3.302;
ps < 0.001, =0.027 for bilabial and dental stops, respectively]. These results indicate that HNRs are affected by different vowels for different stops: for bilabial and dental stops, HNRs increase after close vowels, while those for velar stops increase after low vowels.
For the place of articulation × following vowel interaction (see
Figure 1b), post hoc analyses suggest that mean HNR values for bilabial stops are significantly higher when they are followed by close than by open vowels [
β = 1.838,
t = 3.969,
p = 0.003]. For velar stops, HNR values are significantly higher when they are followed by close than by both mid and open vowels [
βs = 2.677, 3.878;
ts = 4.828, 6.935;
ps < 0.001] for mid and open vowels, respectively]. On the other hand, no significant difference across different vowel types was found for dental stops. When HNR values of the three places of articulation were compared for each vowel context, it was found that HNR values for bilabial stops were significantly lower than those for velar stops [
β = −2.258,
t = −4.156,
p = 0.001] when they are followed by close vowels. When followed by open vowels, HNRs for bilabial and velar stops are significantly lower than those of dental stops [
βs = −2.223, 2.005;
ts = −4.196, 4.062;
ps = 0.001, 0.002 for bilabial and velar stops, respectively]. These results suggest that the following close vowels have a boosting effect on HNR values of all stops while the following open vowels depress HNRs, particularly for bilabial and velar stops. For the preceding vowel × following vowel interaction (see
Figure 1c), results of the post hoc analyses suggested that when the following vowels are close, mean HNR values were significantly higher when the preceding vowels are also close or mid than when they are open [
βs = 4.342, 1.686;
ts = 4.711, 6.120;
p = 0.0001, <0.001 for preceding close and mid vowels, respectively]. Similarly, when the following vowels are mid, HNRs were significantly higher when the preceding vowels are also mid than when they are open [
β = 0.568,
t = 3.969,
p = 0.002]. When the following vowels are open, HNRs were significantly higher in the context of the preceding mid vowels than the preceding low vowels [
β = 0.758,
t = 3.208,
p = 0.037]. Similarly, when the preceding vowels are close, HNRs were significantly higher when the following vowels are also close than when they are open [
β = 3.527,
t = 3.180,
p = 0.040]. When the preceding vowels are mid, HNRs were significantly higher when the following vowels are close than when they are mid or open [
βs = 0.907, 1.738;
ts = 3.839, 6.300;
p = 0.004, <0.001 for mid and open vowels, respectively]. When the preceding vowels are open, HNRs were higher when the following vowels are mid than when they are open [
β = 1.021,
t = 3.943,
p = 0.003]. Overall, these results suggested that HNRs increase when followed by relatively less open vowels than by relatively more open vowels. In addition, except for following open vowels, this boosting effect was more likely to occur when the flanking vowels are of the same or different in degree of openness by no more than one step from each other.
3.2. Relative Duration
The best regression model for the relative duration (duration of the target sound/sum of the duration of the preceding sound, the target sound, and the following sound) showed that only 8.7% of the total variance was explained by the fixed factors (marginal R2 = 0.087), but approximately 21% of the variance was additionally explained by the full mode (Conditional R2 = 0.301).
Like HNR, the results reveal the significant role of voicing, place of articulation, flanking vowel height, and speaking rate. As shown in
Table 3, the model revealed significant main effects of voicing: higher duration ratio for voiceless stops [
β = −0.045,
t = −9.131,
p < 0.001]; place of articulation: bilabial > dental [
β = 0.039,
t = 4.314,
p < 0.001], dental < velar [
β = −0.020,
t = −2.471,
p = 0.013]; preceding vowel: close < mid [
β = −0.039,
t = −5.30,
p < 0.001], no significant difference between mid and open vowels; following vowel: close < mid [
β = −0.030,
t = −3.134,
p = 0.002], mid > open [
β = 0.027,
t = 3.787,
p < 0.001]; and speaking rate: the higher the speaking rate, the lower the duration ratio [
β = −0.004,
t = 7.381,
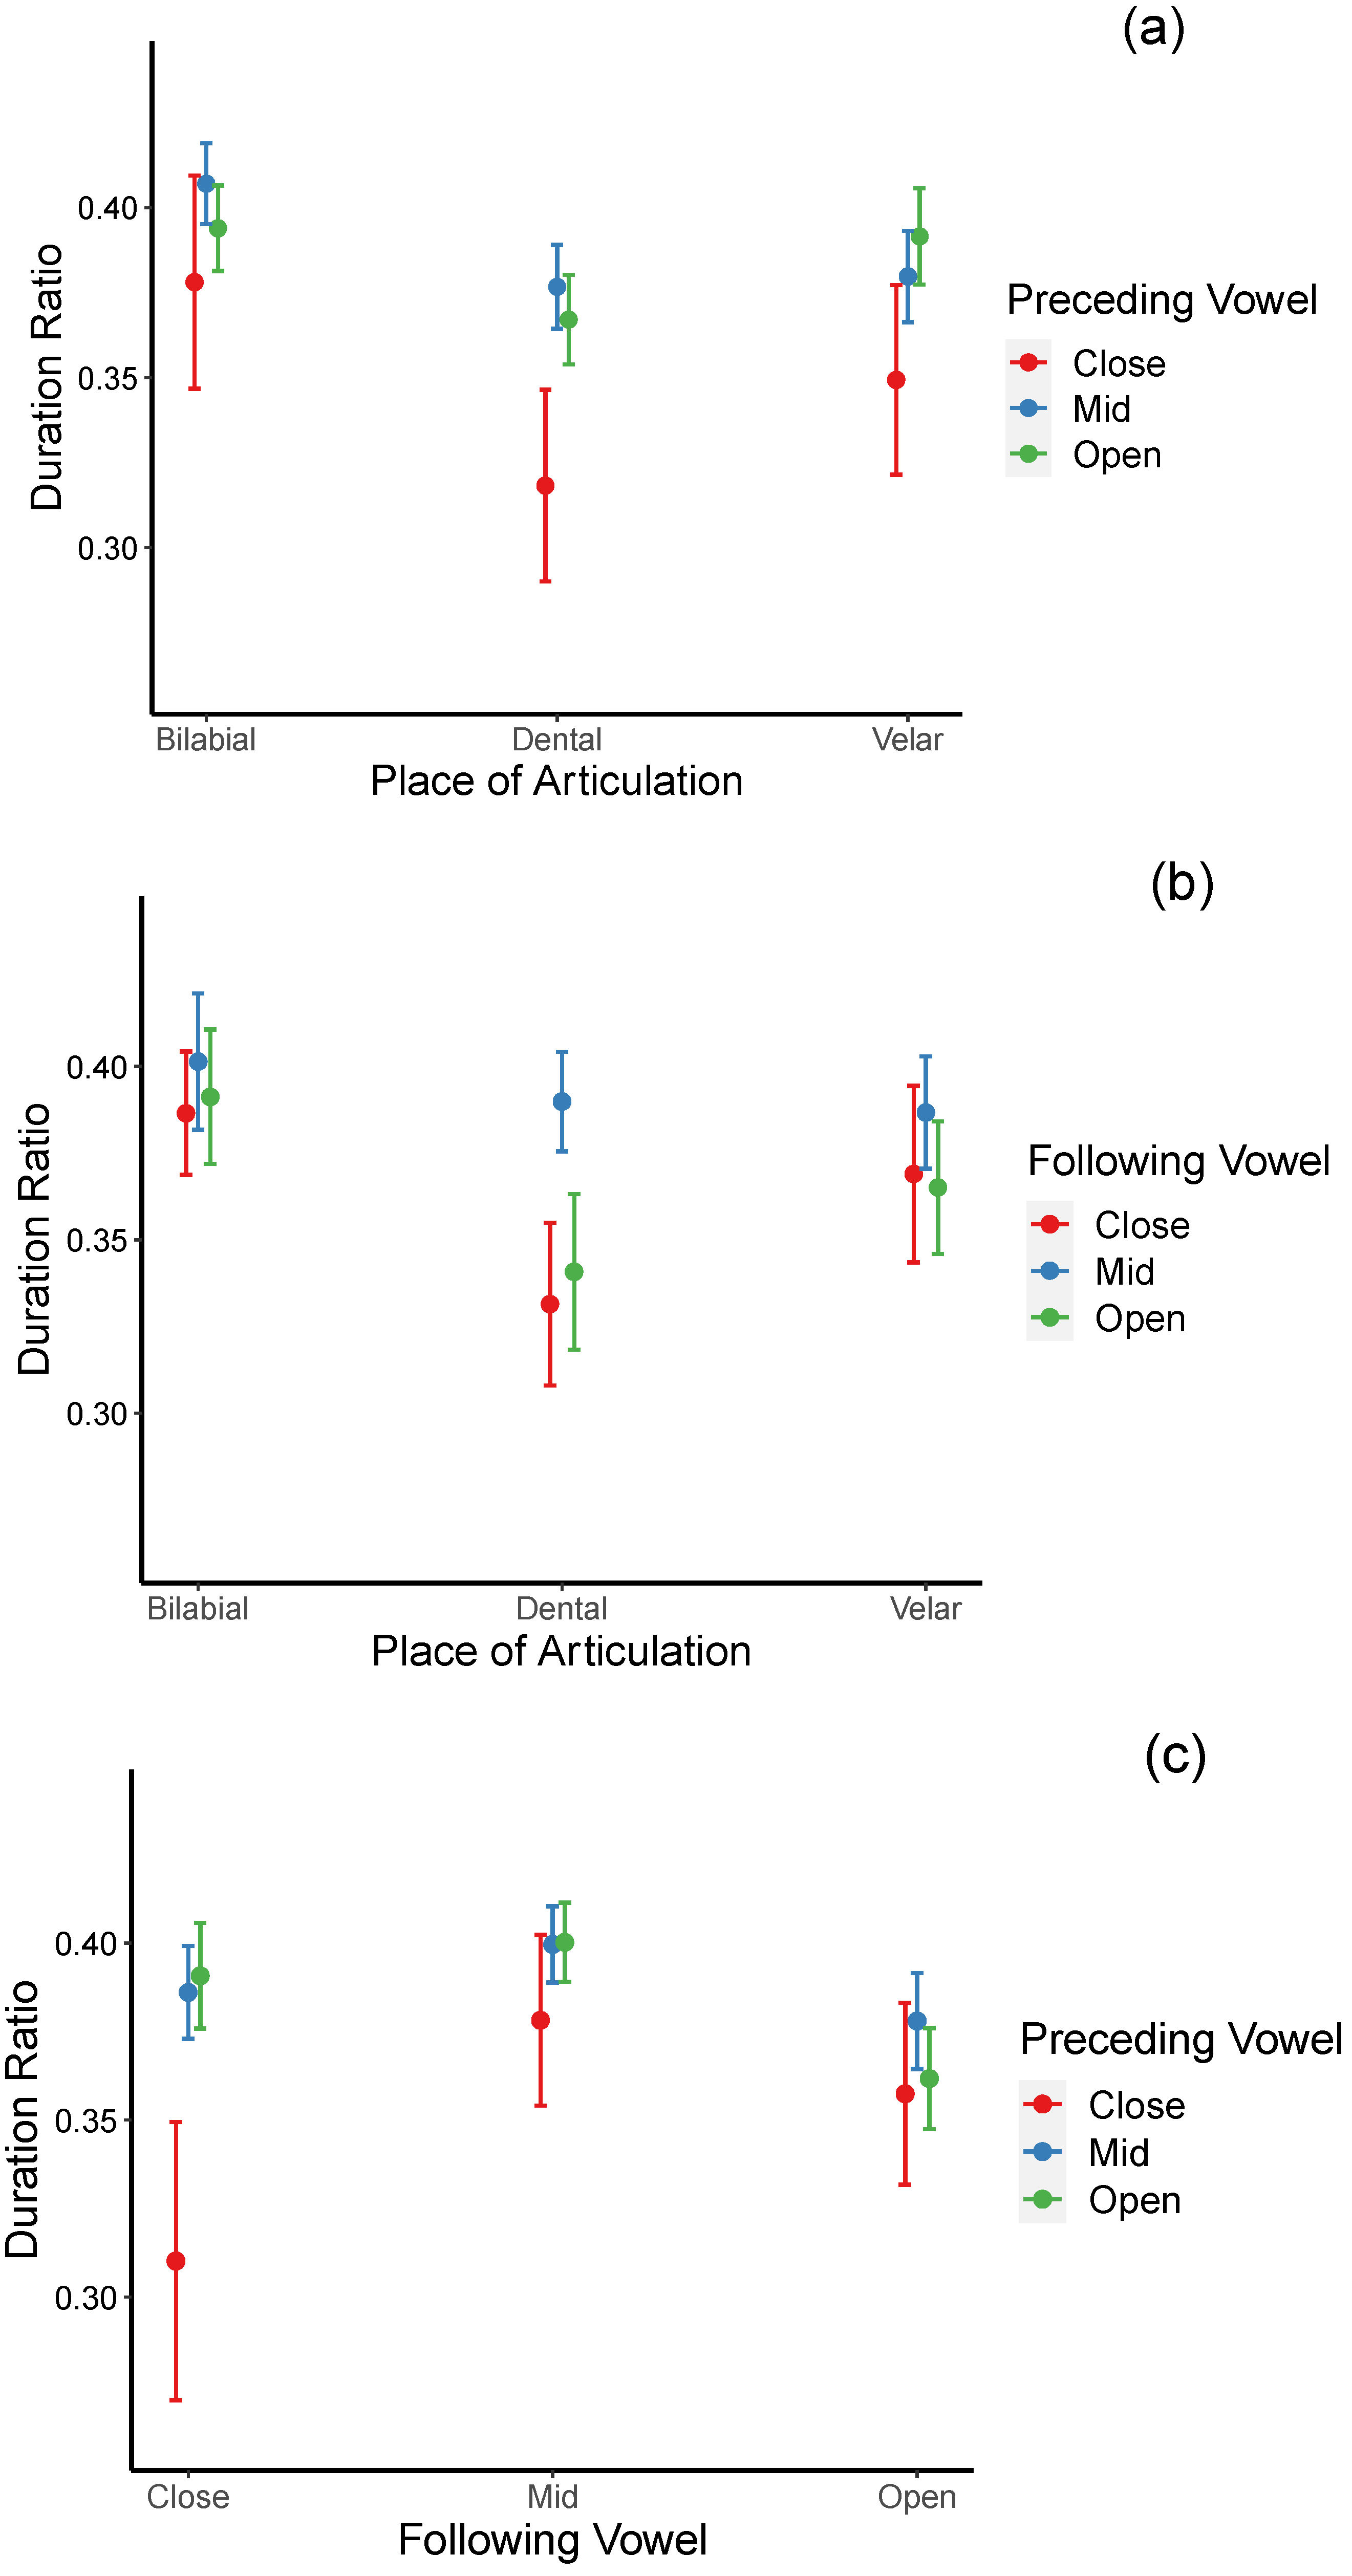
p < 0.001]. These results indicated that voiced stops are more lenited (shorter relative duration) than voiceless stops; dental stops are more lenited than bilabial and velar stops; a higher degree of lenition occurs when the preceding vowels are close relative to mid and when the following vowels are close or open relative to mid. In addition, lenition degree positively correlates with speaking rate. Significant interactions between the place of articulation and the following vowel, between the place of articulation and the preceding vowel, and between the preceding vowel and the following vowel were also found.
For the place of articulation × preceding vowel interaction (see
Figure 2a), relative durations of dental stops were found to be significantly shorter (more lenited) when preceded by close than by mid and open vowels [
βs = −0.058, 0.049;
ts = −4.342, −3.678;
ps = 0.0005, 0.007, respectively). Similarly, relative durations of velar stops were significantly shorter when the preceding vowels were close than when they were open [
β = −0.042,
t = −3.287,
p = 0.028]. Across place of articulation comparison for each vowel context revealed that when preceded by close and open vowels, relative durations of bilabial stops are significantly higher (less lenited) than dental stops [
βs = 0.055, 0.050;
ts = 4.678, 3.814;
ps = 0.0001, 0.005 for close and open vowels, respectively]. Dental stops’ relative durations are also shorter than those of velar stops when preceded by open vowels [
β = −0.025,
t = −3.374,
p = 0.022]. These results suggested that dental stops are more lenited than bilabial and velar stops, particularly when they occur after open vowels.
For the place of articulation × following vowel interaction (see
Figure 2b), post hoc pair-wise comparison indicated that relative durations of dental stops were significantly shorter when the following vowels are close vowels than when they are mid vowels [
β = −0.058,
t = −4.870,
p < 0.0001), suggesting that they are more lenited in the following close vowel than in the following mid vowel context. No effects of vowel openness for bilabial and velar stops were indicated. When the three places of articulation were compared for each vowel context, the results suggested that relative durations of the dental stops were significantly shorter than those of bilabial stops in the close and open vowel contexts, suggesting that dental stops are, more lenited than bilabial stops when they are followed by these vowels [
βs = −0.055, 0.050;
ts = −4.678, −3.814,
ps = 0.0001, 0.005 for close and open following vowel context, respectively]. The differences between dental and velar stops did not reach significance in any of the following vowel contexts.
For the preceding × following vowel interaction (see
Figure 2c), post hoc analyses indicated that when followed by close vowels, relative durations are significantly shorter when the preceding vowels are close than when they are mid or open [
βs = −0.076, −0.081;
ts = −3.918, −4.100;
ps = 0.003, 0.002 for preceding mid and open vowels, respectively]. However, the effects of preceding vowel openness were not significant when the following vowels were either mid or open. Regarding the effects of the following vowels on the preceding vowels, it was found that when the mid vowels precede, relative durations are significantly shorter when the following vowels are open than when they are mid [
β = −0.022,
t = −3.658,
p = 0.008]. However, when preceded by open vowels, relative durations are significantly shorter when the following vowels are also open rather than close or mid [
βs = −0.029, −0.038;
ts = −3.622, −5.994;
ps = 0.009, <0.001 for following close and open vowels, respectively]. No effects of the following vowels were found when the preceding vowels were close. Together, these results suggest that lenition is the most advanced when flanking vowels are close and that the lenition degree is stronger with either preceding or following open vowels relative to mid vowels.
3.3. Intensity Difference Relative to the Preceding Vowel
The more lenited the consonants are, the lower the intensity difference between the target stops and the preceding vowel is expected. For this dependent variable, the best regression model yielded marginal R
2 and conditional R
2 values of 0.744 and 0.806, suggesting that 74.4% of the total variance of intensity difference (relative to the preceding vowel) was accounted for by the model’s fixed factors and that 80.6% of the total variance was explained by the full model. Unlike HNR and relative duration, stress along with voicing, place of articulation, surrounding vowel height, and speaking rate emerged as significant predictors of lenition degree for this variable. As shown in
Table 4, the model’s significant main effects included the effects of stress: higher intensity difference for stressed syllables than unstressed syllables [
β = −2.231,
t = −7.556,
p < 0.001]; voicing: higher intensity difference for voiceless stops than voiced stops [
β = −23.623,
t = −72.992,
p < 0.001]; place: bilabial > dental > velar [
βs = 1.762, 1.409;
ts = 2.872, 2.664;
ps = 0.004, 0.008]; preceding vowel: open > mid > close [
βs = −2.092, −1.456;
ts = −4.066, −7.475;
ps < 0.001]; following vowel: no significant difference between close and mid, mid > open [
β = 1.900,
t = 3.974,
p < 0.001]; and speaking rate: the higher the speaking rate, the lower the intensity difference [
β = −0.862,
t = −23.499,
p < 0.001].
These results suggested that stops weakened to a significantly higher degree when they are voiced than when they are voiceless, and when the syllables are unstressed than when they are stressed (e.g., /b/ in que ˈbueno vs. /b/ in para busˈcar). In addition, velar stops are lenited to a greater degree than dental stops, and, in turn, dental stops are more lenited than bilabial stops. Additionally, both preceding and following vowels affected the degree of lenition. Specifically, lenition appears to be negatively correlated with the degree of openness of the preceding vowels: the less open the preceding vowels, the more weakened the stops are. However, the following vowel environments exert the opposite pattern of effects on stop lenition, and the difference reached significance only between the mid and the open vowels. More specifically, unlike preceding vowel contexts, the lenition degree is stronger when the following vowels are open than mid. Finally, as expected, the lenition degree increases when the speaking rate increases.
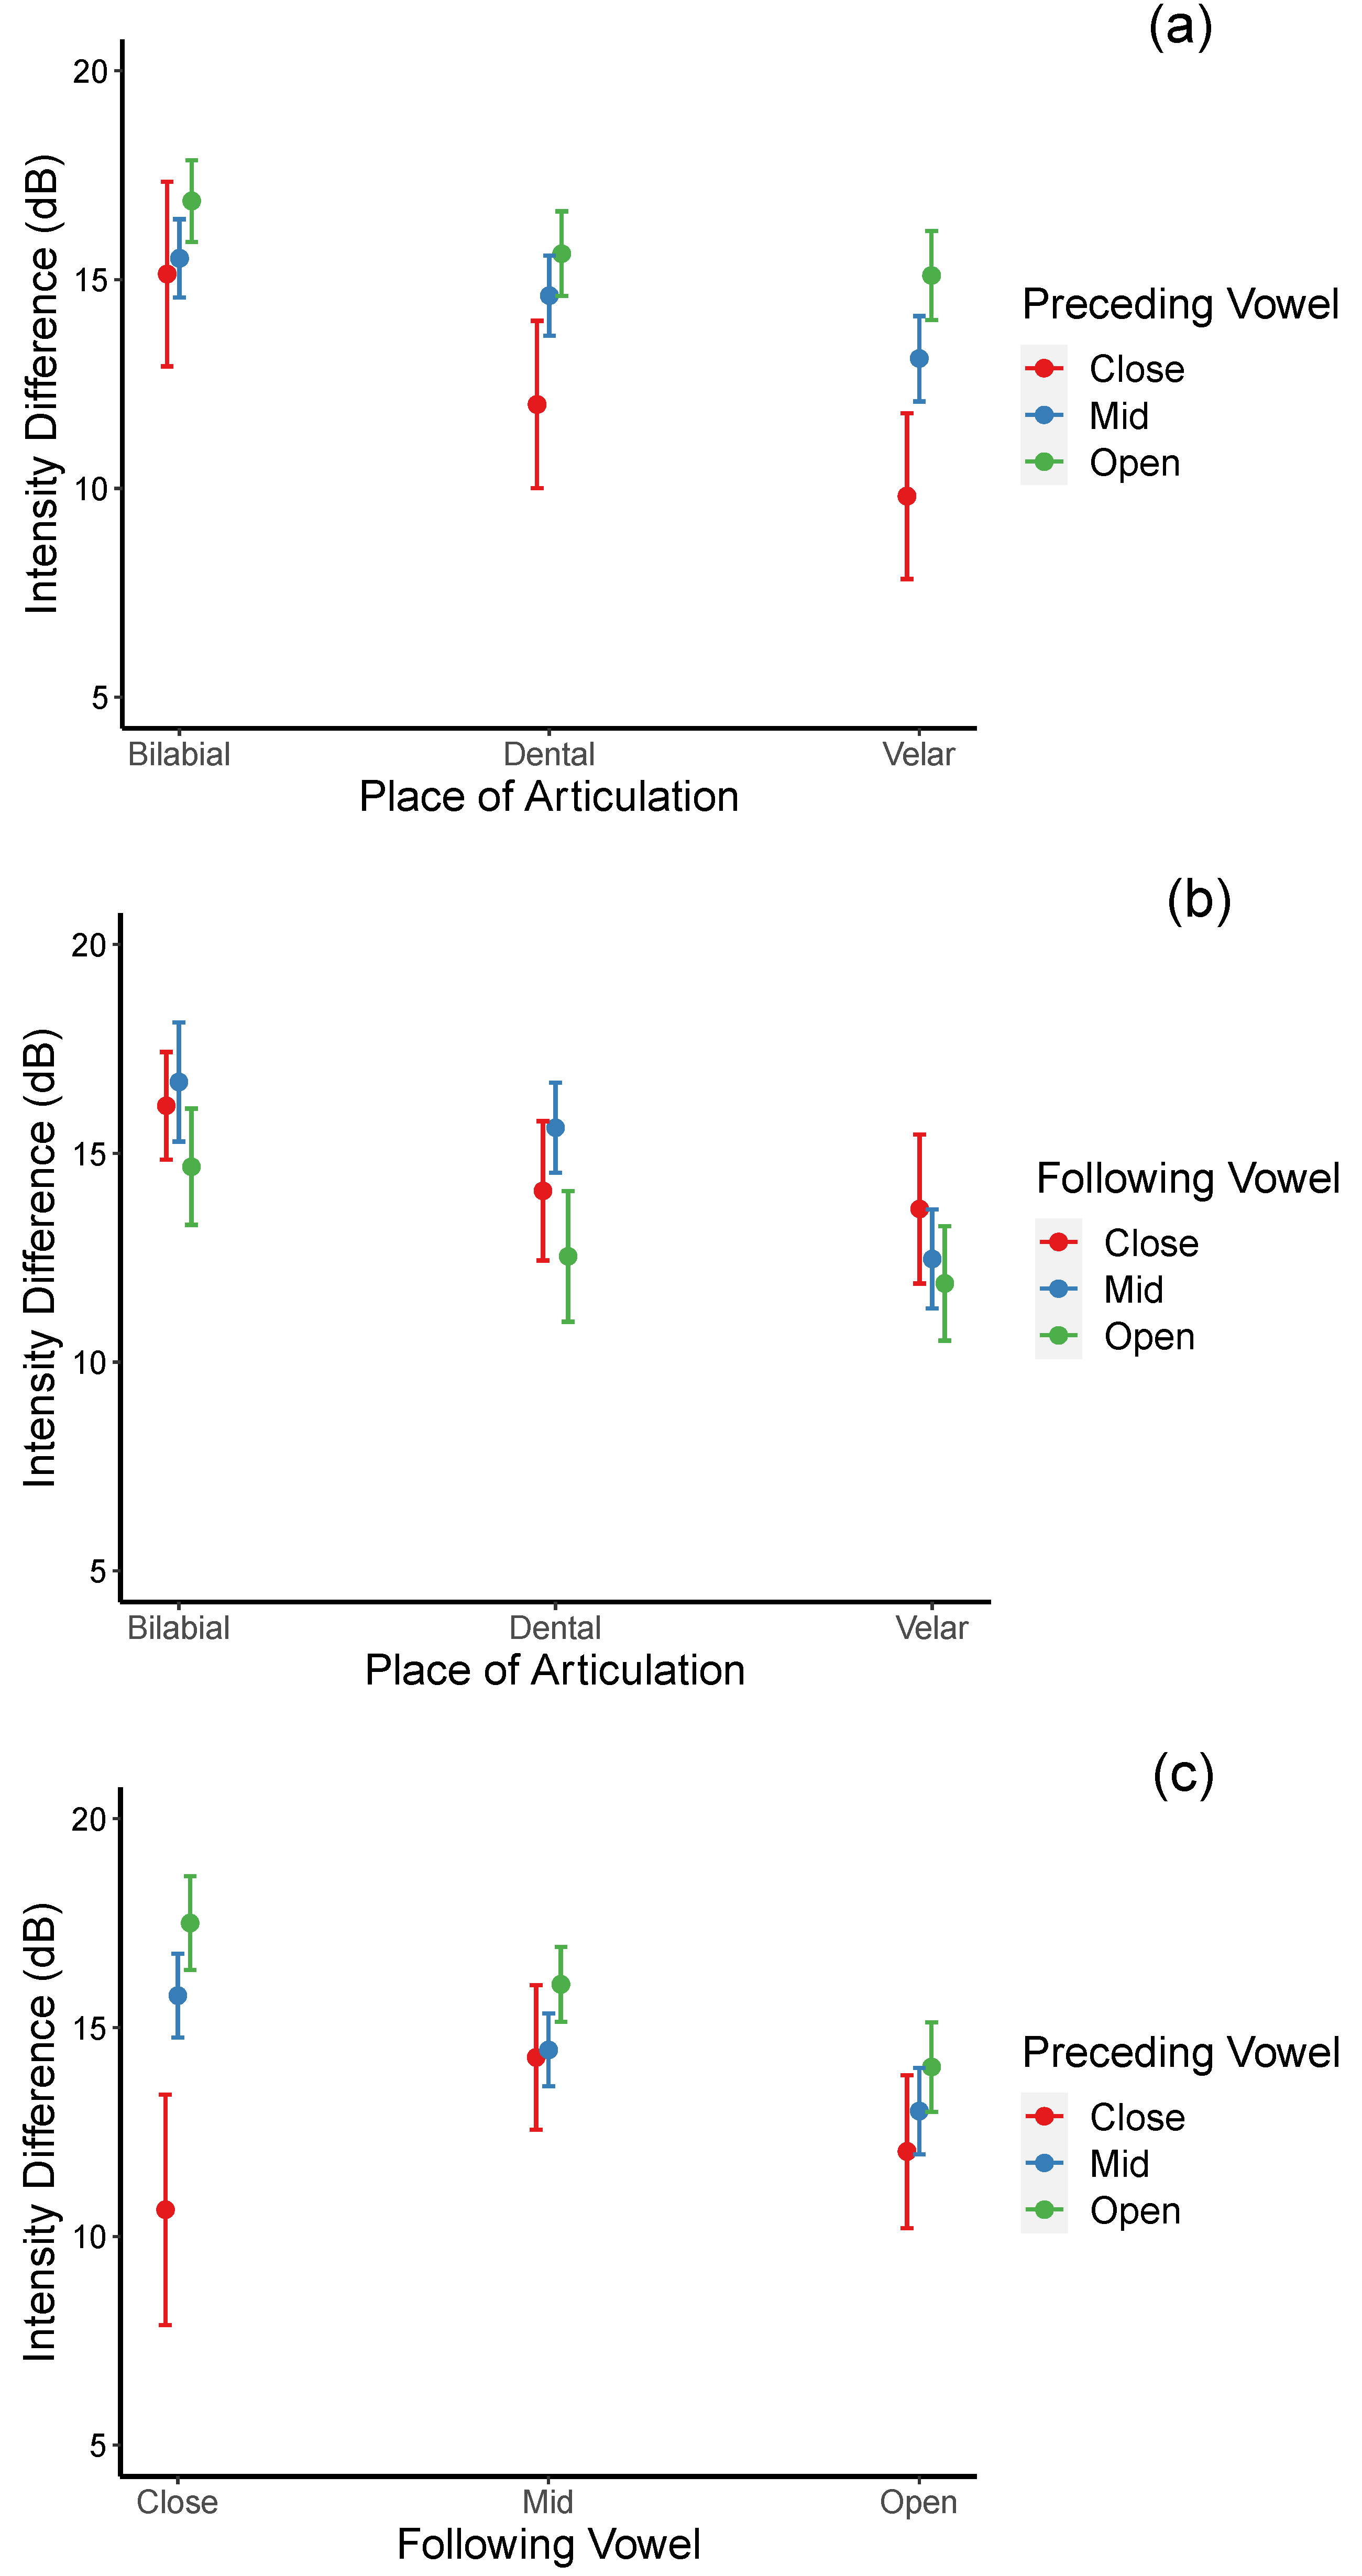
Significant interactions between the place of articulation and the preceding vowel (see
Figure 3a), between the place of articulation and the following vowel (see
Figure 3b), and between the preceding vowel and the following vowel (see
Figure 3c) were also found.
For the place of articulation × preceding vowel interaction, smaller intensity differences are observed in the preceding close vowel context for stops at all three places of articulation. However, the effects are significant for dental and velar stops only. Specifically, post hoc pair-wise comparisons suggested that intensity difference was significantly smaller for dental consonants in the close vowel context relative to the open vowel context [β = −3.612, t = −3.912, p = 0.003], and for velar consonants in the close vowel than in both the mid and open vowel contexts [βs = −3.294, −5.285; ts = −3.630, −5.900; ps = 0.009, <0.0001, respectively]. For each preceding vowel context, the results revealed that velar consonants are more lenited than bilabial consonants in all three vowel contexts [βs = −5.323, −2.402, −1.786; ts = −3.440, −5.894, −3.958; ps = 0.017, <0.001, = 0.003 for the close, mid, and open vowel contexts, respectively) and dental consonants in the mid vowel context [β = −1.509, t = −3.407, p = 0.020]. Together, these results suggested that velar stops are more lenited than dental and bilabial stops and that preceding vowels with a lesser degree of openness induce a higher degree of weakening.
A different pattern emerges for the effects of the following vowels: relatively more open rather than more close vowels appear to trigger a higher degree of weakening, particularly for the velar stops. Specifically, post hoc pair-wise comparisons suggested that velar stops are more lenited than bilabial stops when followed by mid and open vowels [βs = −4.240, −2.798; ts = −6.012, 3.710; ps = 0.0001, 0.007, respectively]. However, no effects on the degree of openness of the following vowel within each place of articulation.
For the preceding × following vowel interaction, overall, regardless of the following vowels’ height, a higher degree of weakening is observed when the preceding vowels are close. However, the effects of preceding vowel height reached significance only when the following vowels were also close. Specifically, post hoc pair-wise comparisons indicated that when the following vowel is close, the degree of lenition is highest when both the preceding vowels are also close relative to when they are mid or open [βs = −5.130, −6.868; ts = −3.814, −5.034; p = 0.004, <0.001]. No significant difference across the preceding vowels’ height when the following vowels are either mid or open. These results suggest that preceding close + following close vowel context triggers the highest degree of stop weakening. In addition, when the preceding vowels are mid or low, the degree of weakening becomes greater (smaller intensity difference) as the following vowels change from close to mid and to open. For the preceding mid vowels, the difference reaches significance between the following close and the following mid vowels [β = 1.300, t = 3.345, p = 0.024] but not between the following mid and the following open vowels. For the preceding open vowels, the difference reaches significance between the following mid and the following open vowel context [β = 1.979, t = 4.644, p = 0.0001]. Together, these results suggest that the optimal lenition triggering environment is when both flanking vowels are close and that preceding mid and open vowels progressively increase the degree of lenition as the height of the following vowels increases.
3.4. Intensity Difference Relative to the Following Vowel
Similar to the intensity difference between the target stops and the preceding vowels, it is assumed that smaller intensity differences between the target stop and the following vowels would indicate a stronger degree of lenition. The best regression model for this dependent variable indicated that the model’s fixed factors accounted for 72.9% of the total variance and that the full model explained 80.3% of the variance (marginal R
2 = 0.729, Conditional R
2 = 0.803). Like intensity difference relative to the preceding vowel, stress along with voicing, place of articulation, and speaking rate play a significant role in the lenition degree based on this dependent variable. However, unlike the intensity difference relative to the preceding vowel, the effect of the preceding vowel height is non-significant. Specifically, the model yielded significant main effects of stress: higher intensity difference for stressed syllables relative to unstressed syllables [
β = −3.741,
t = −11.423,
p < 0.001]; voicing: higher intensity difference for voiceless stops than voiced stops [
β = −23.604,
t = −65.454,
p < 0.001]; place of articulation: bilabial > dental > velar [
βs = 1.838, 1.416;
ts = 2.837, 2.594;
ps = 0.005, 0.010]; following vowel: close < mid [
β = −1.563,
t = −2.231,
p = 0.026]; and speaking rate: the higher the speaking rate, the lower the intensity difference [
β = −0.918,
t = −23.732,
p < 0.001] (see
Table 5). These results suggested that stops are more lenited in unstressed syllables than in stressed syllables, and when they are voiced than when they are voiceless. In addition, velar stops are more lenited than bilabial and dental stops. Furthermore, the degree of stop lenition increases when the following vowels are close and when the speaking rate increases.
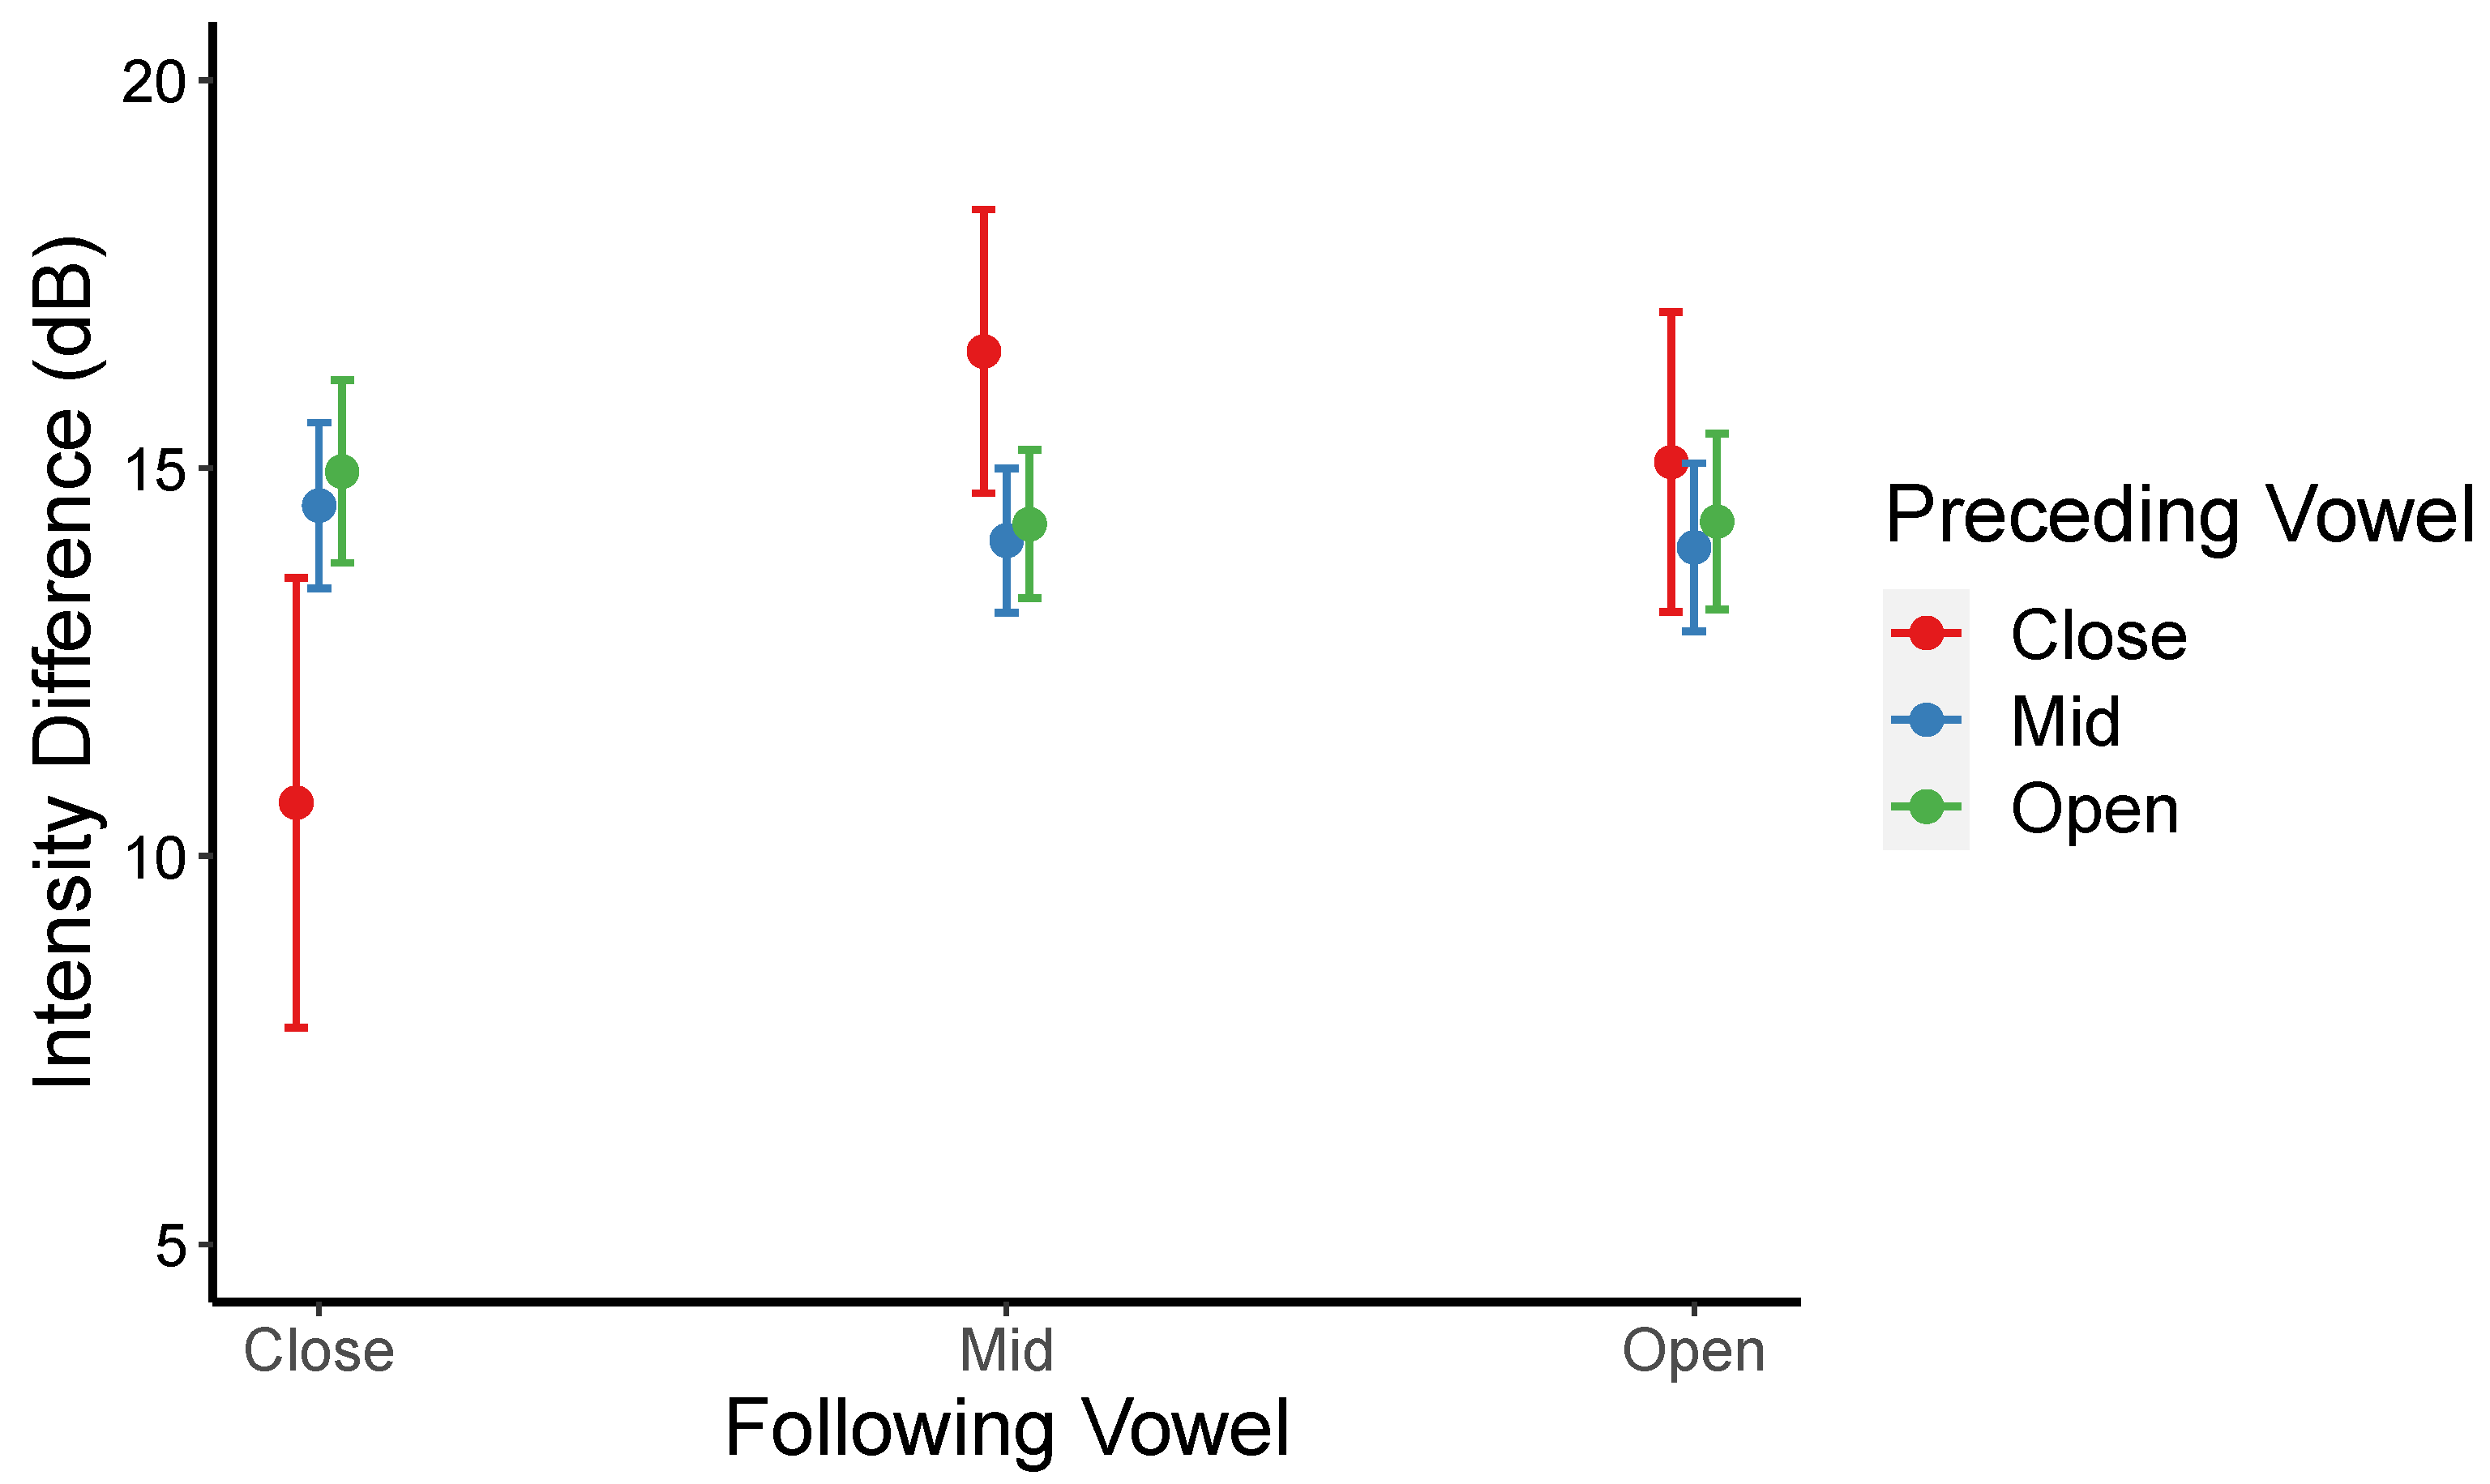
A significant interaction between the preceding vowel and the following vowel (see
Figure 4) was also obtained. Post hoc analyses indicate that the significant interaction stemmed from the fact that intensity differences were smaller (higher degree of lenition) when the preceding and the following vowels are close compared to when the following vowels are close, but the preceding vowels are mid [
β = −5.816,
t = −3.148,
p = 0.043].
3.5. Mean Intensity
For the mean intensity of the target stops (in dB), the greater the mean intensity, the higher the degree of lenition. According to the best regression model, 65.9% (marginal R
2 = 0.659) of the total variance was explained by the fixed factors, and an additional 11.4% of the variance was accounted for by the random factors (condition R
2 = 0.773). Like relative intensity difference to the following vowel measure, stress, voicing, following vowel height, and speaking rate are strong predictors of lenition degree for this variable, while the role of place of articulation and preceding vowel height is minimal. Specifically, the model revealed significant main effects of stress: higher mean intensity for unstressed syllables [
β = 1.149,
t = 5.449,
p < 0.001]; voicing: higher mean intensity for voiced stops [
β = 15.063,
t = 65.316,
p < 0.001]; following vowel: close < mid < open [
βs = −1.587, −1.277,
ts = −6.271, −5.162,
ps < 0.001]; and speaking rate: the higher the speaking rate, the higher the mean intensity [
β = 0.605,
t = 22.507,
p < 0.001] (see
Table 6). These results indicated that intervocalic stops are weakened to a significantly higher degree in unstressed syllables relative to the stressed syllables; when they are voiced than when they are voiceless; when the following vowels are relatively more open, and when the speaking rate increases.
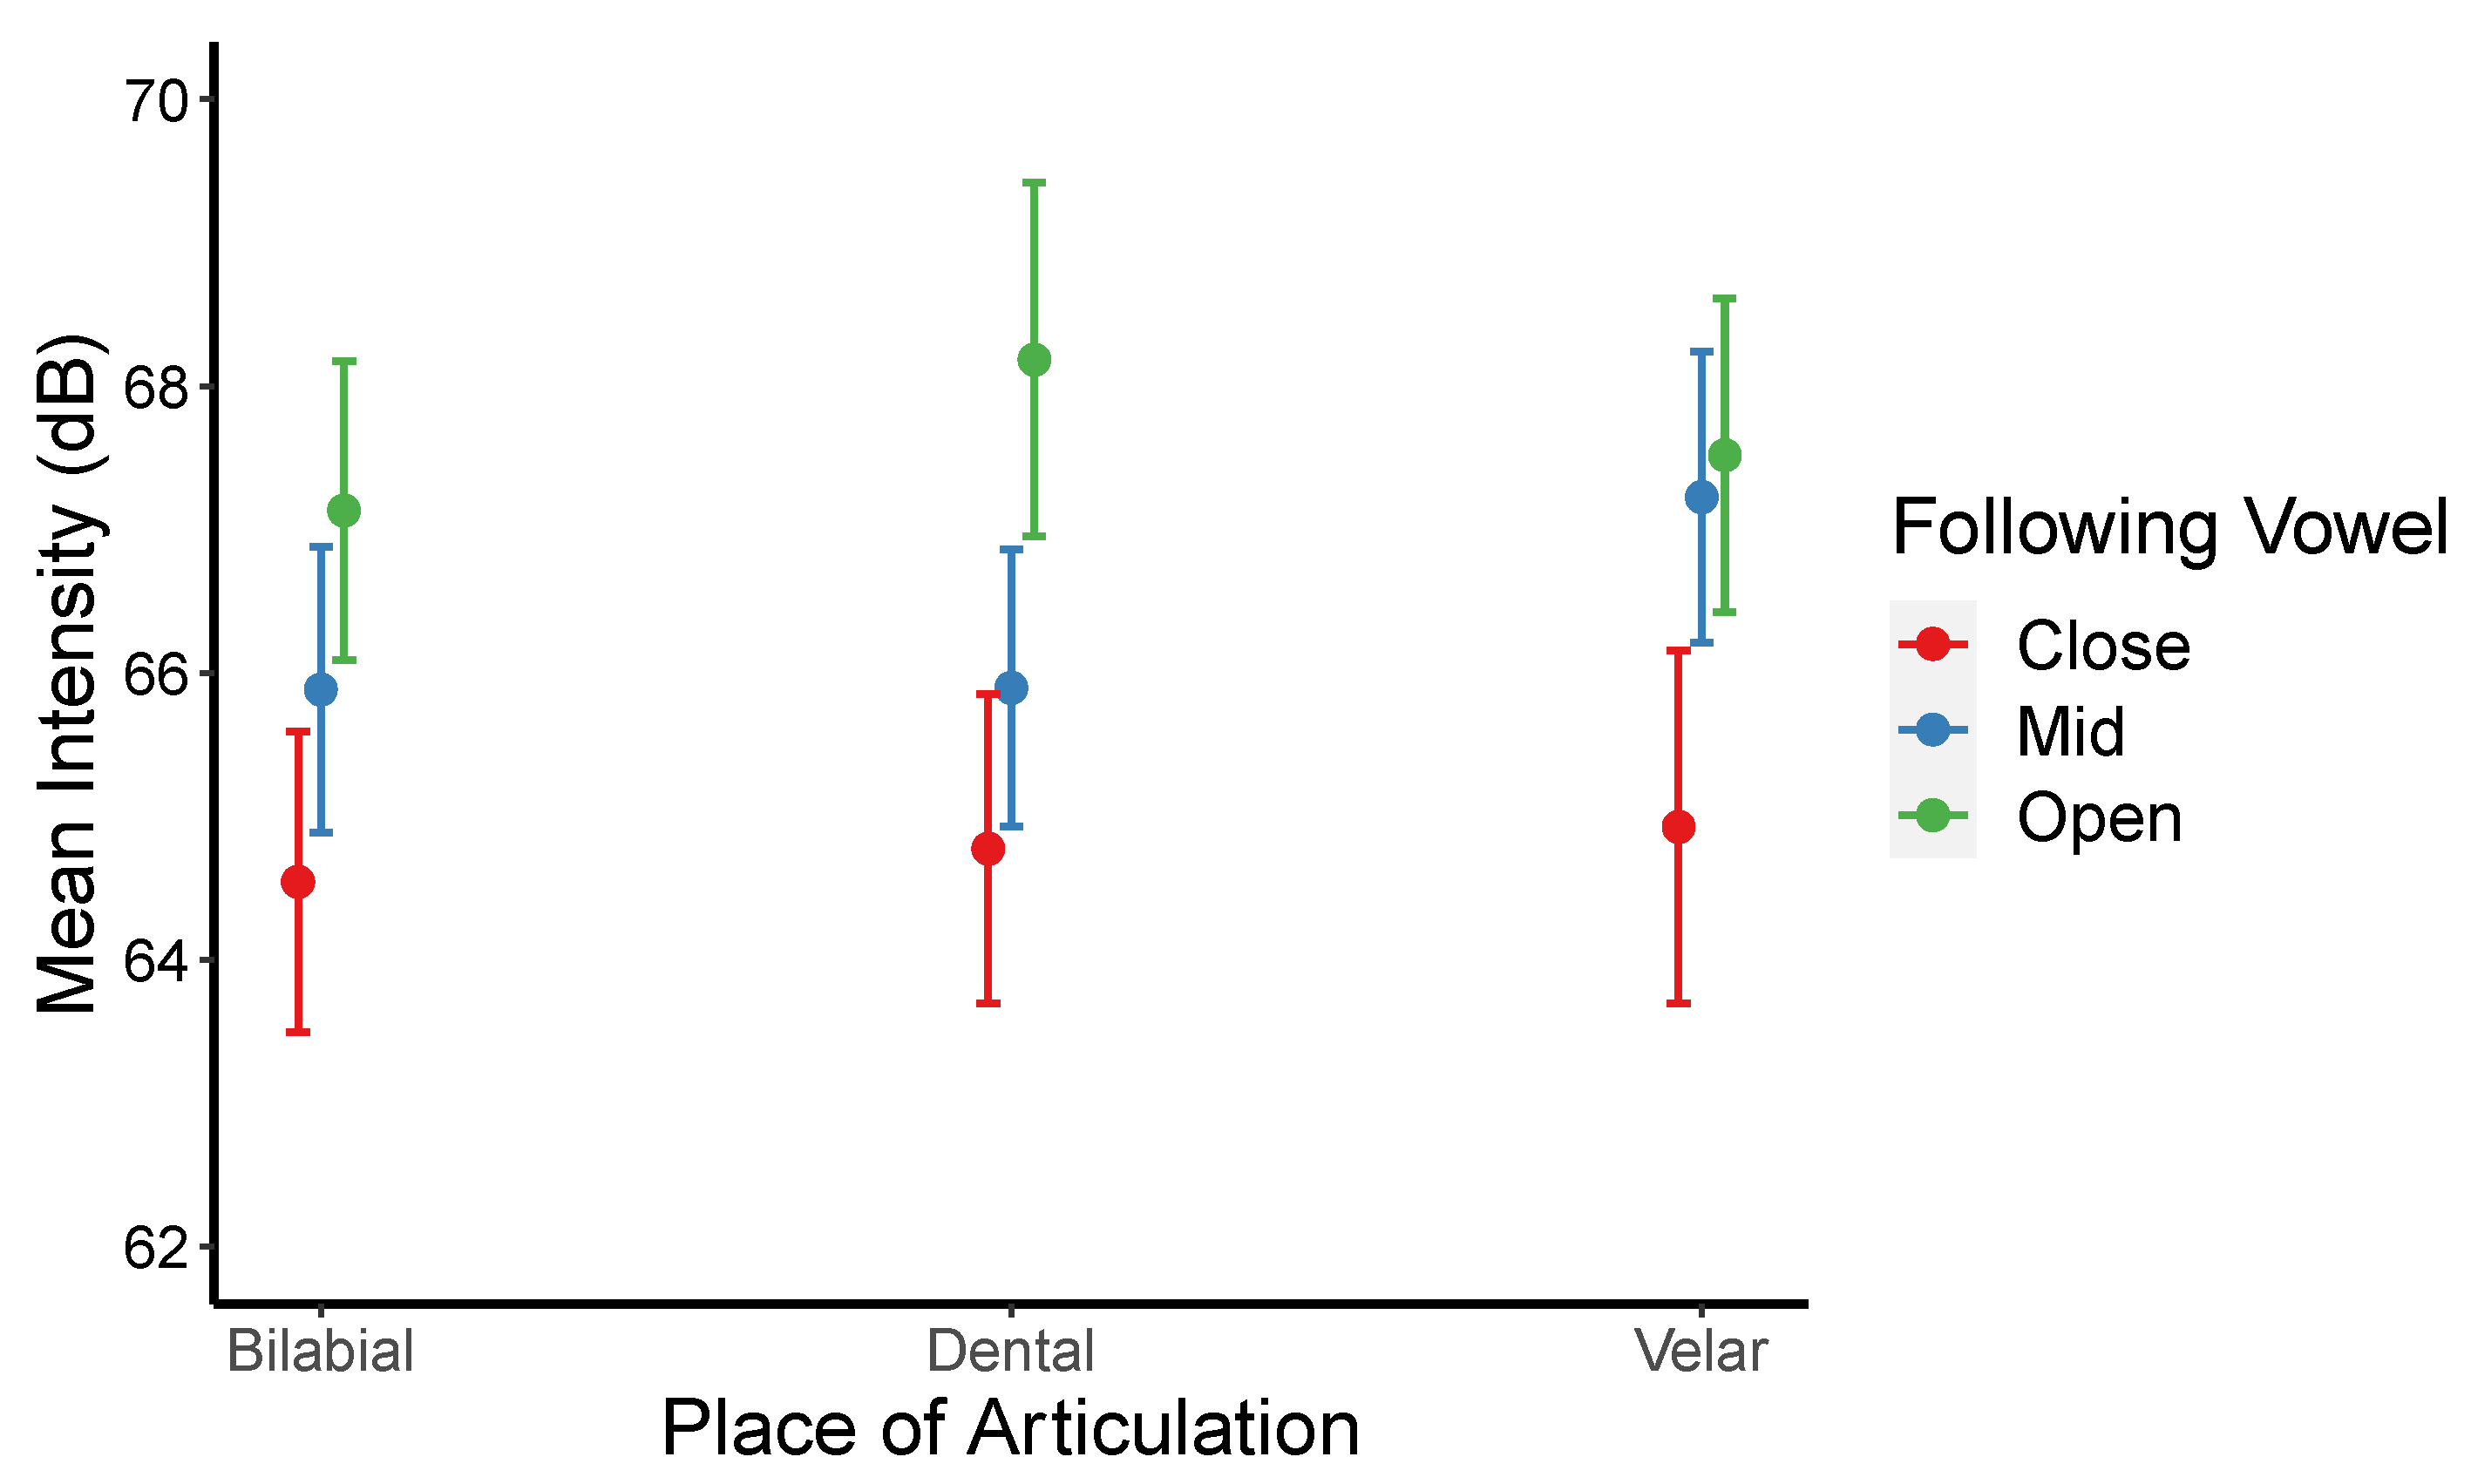
A significant interaction between the place of articulation and the following vowel (see
Figure 5) was also found. Post hoc analysis confirmed that bilabials and velars were lenited when the following vowels were close than when they were mid and open [for bilabials:
βs = −1.340, −2.588;
ts = −3.592, −6.541;
p = 0.01, <0.0001; for velars:
βs = −2.300, −2.592;
ts = −4.627, −4.964;
ps = 0.0002, <0.001]. However, dental stops are more lenited only when close instead of open vowels followed (for dentals;
β = −3.411,
t = −6.181,
p < 0.001]. These results suggest that the lenition degree of each stop negatively correlates with the degree of the following vowel’s openness and that the effects are more pronounced for bilabial than for velar stops.
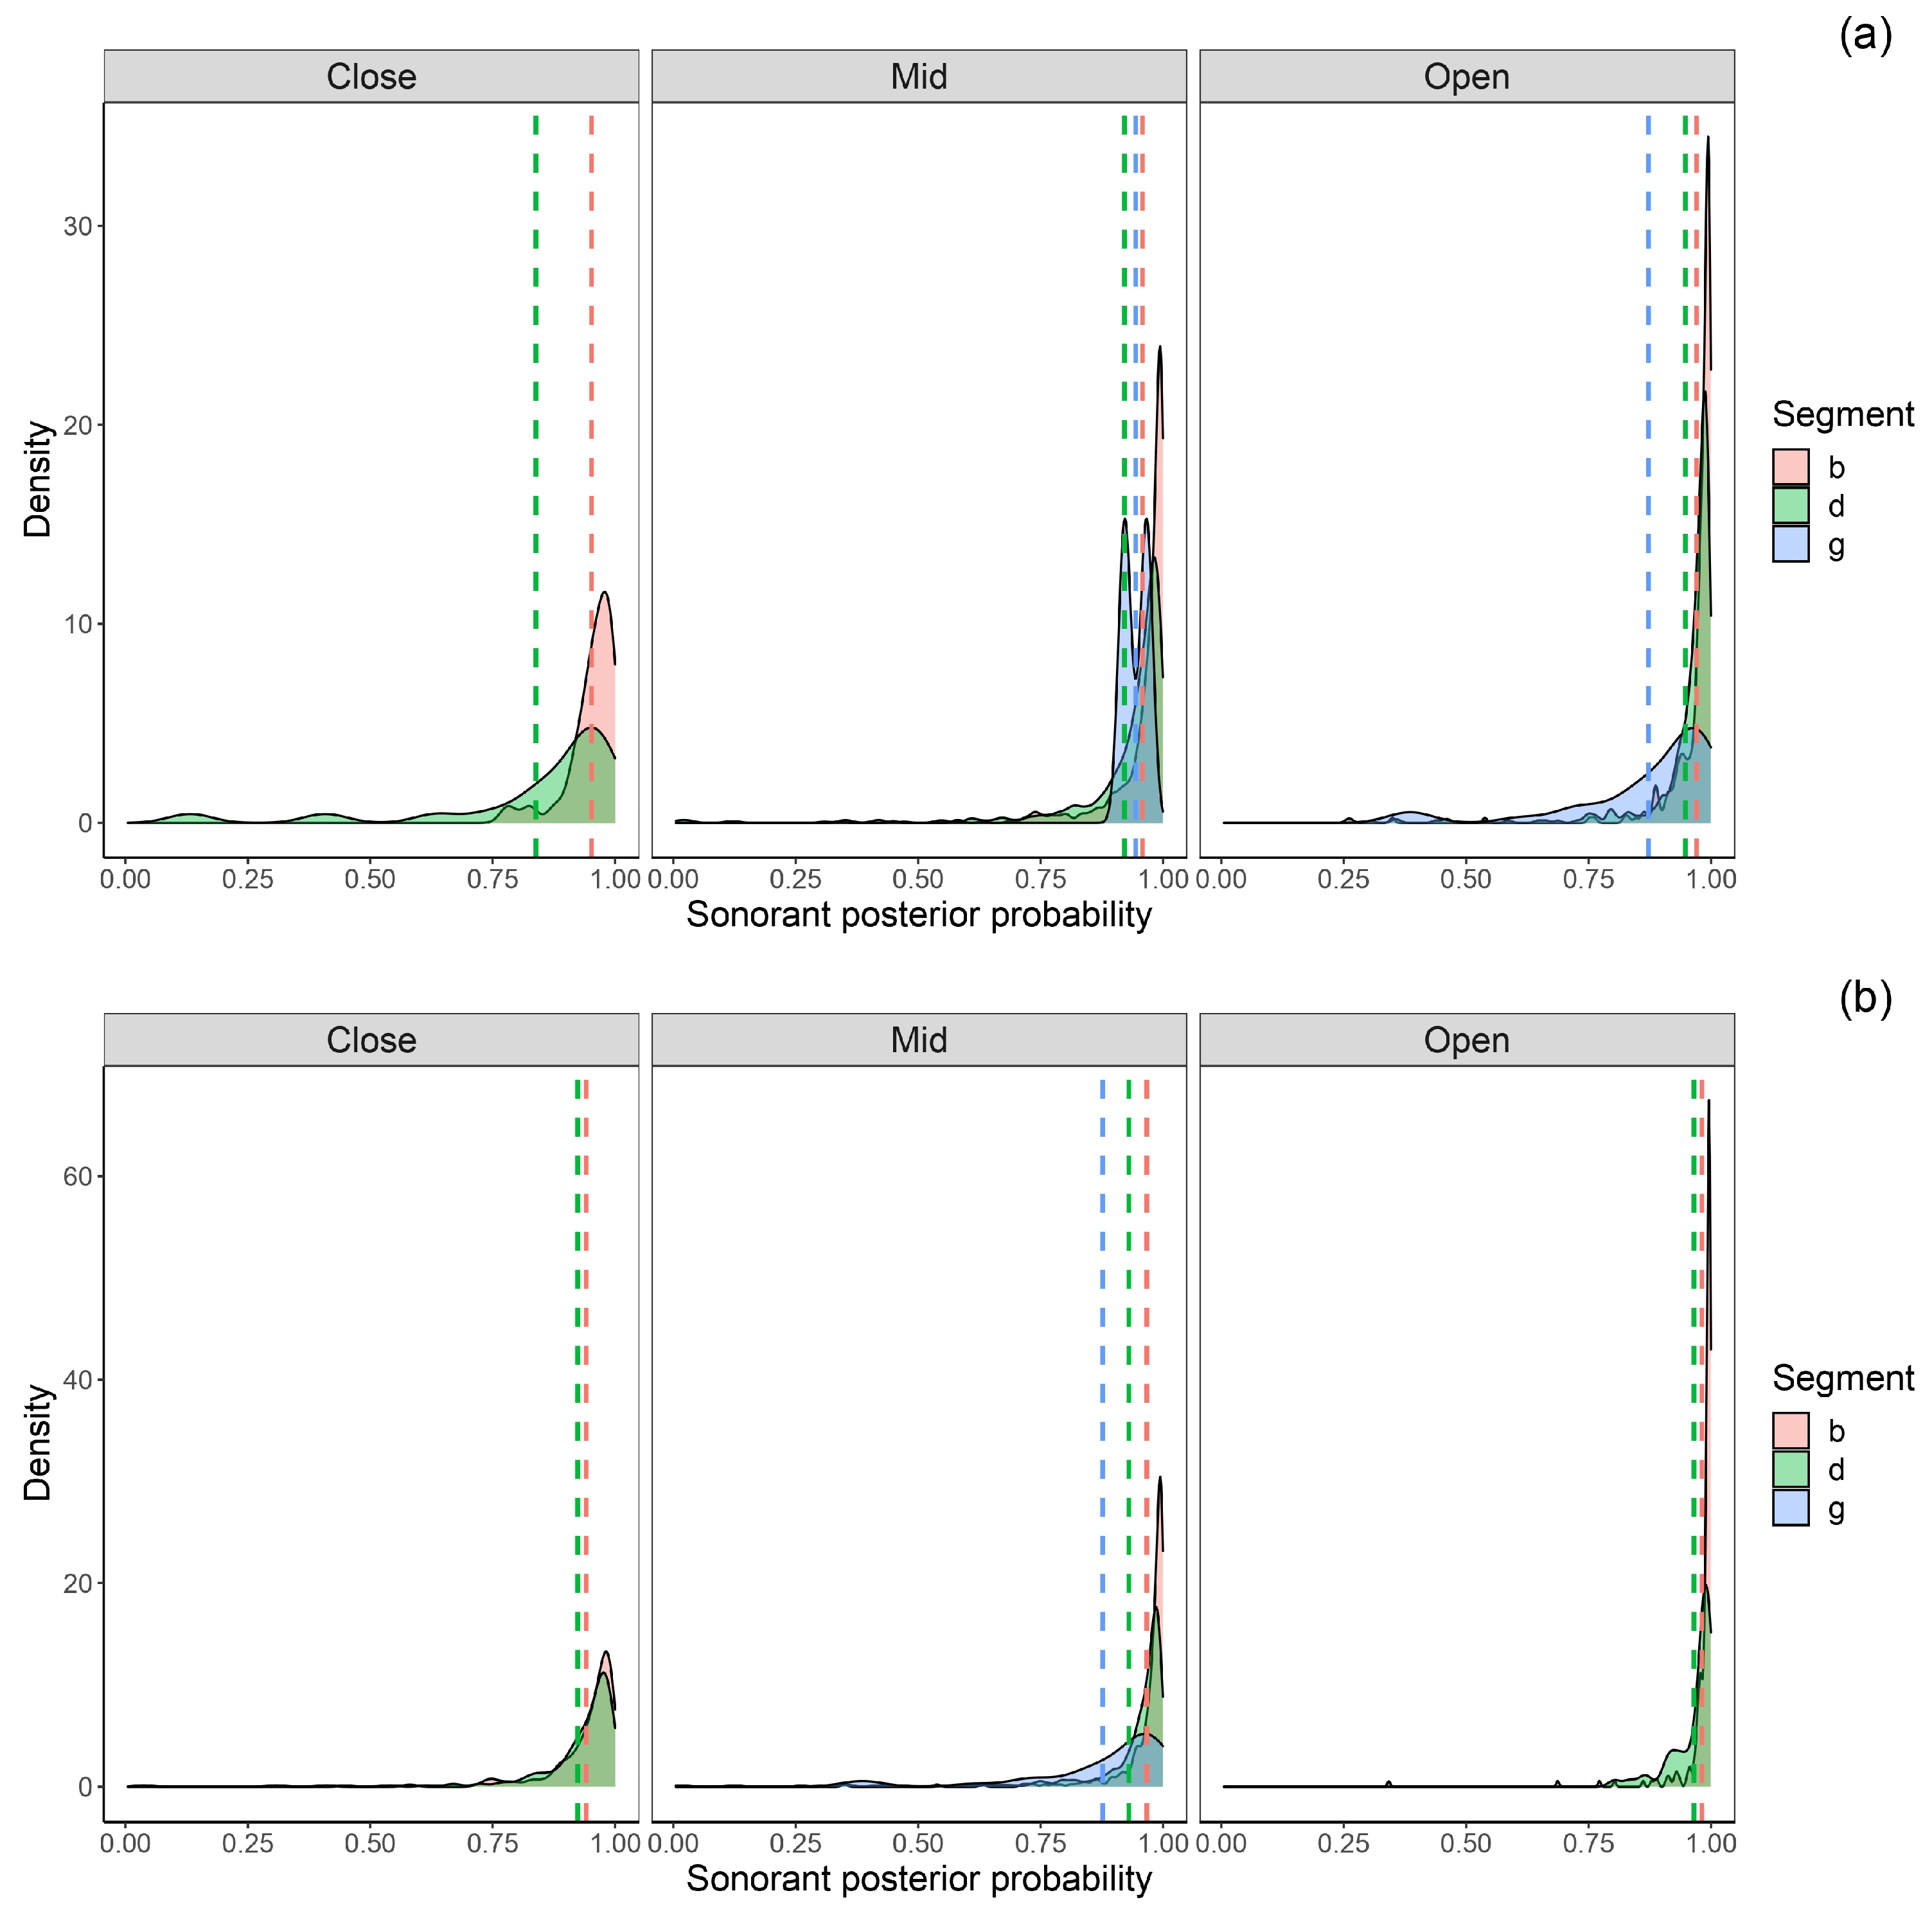
3.6. Sonorant Posterior Probability
Figure 6 shows the sonorant posteriors probabilities of intervocalic bilabial, dental, and velar voiced stops before (see
Figure 6a) and after (see
Figure 6b) close, mid, and open vowels in stressed and stressed syllables.
The best regression model for sonorant posterior probabilities showed that 52.4% of the total variance was explained by the fixed factors (marginal R
2 = 0.524), while the full model accounted for 60.9% of the variance (conditional R
2 = 0.609). The model revealed significant main effects of stress: unstressed > stressed syllables [
β = 0.039,
t = 3.109,
p = 0.002; voicing: voiced stops > voiceless stops [
β = 0.660,
t = 48.32,
p < 0.001]; place of articulation: bilabials > dental [
β = 0.060,
t = 2.237,
p = 0.025], but dental < velars [
β = −0.107,
t = −4.668,
p < 0.001]; preceding vowel: close < mid [
β = −0.051,
t = −2.196,
p = 0.028], mid < open [
β = −0.077,
t = −8.881,
p < 0.001]; and speaking rate: the faster the speaking rate, the higher the sonorant posterior probabilities [
β = 0.013,
t = 8.056,
p < 0.001] (see
Table 7).
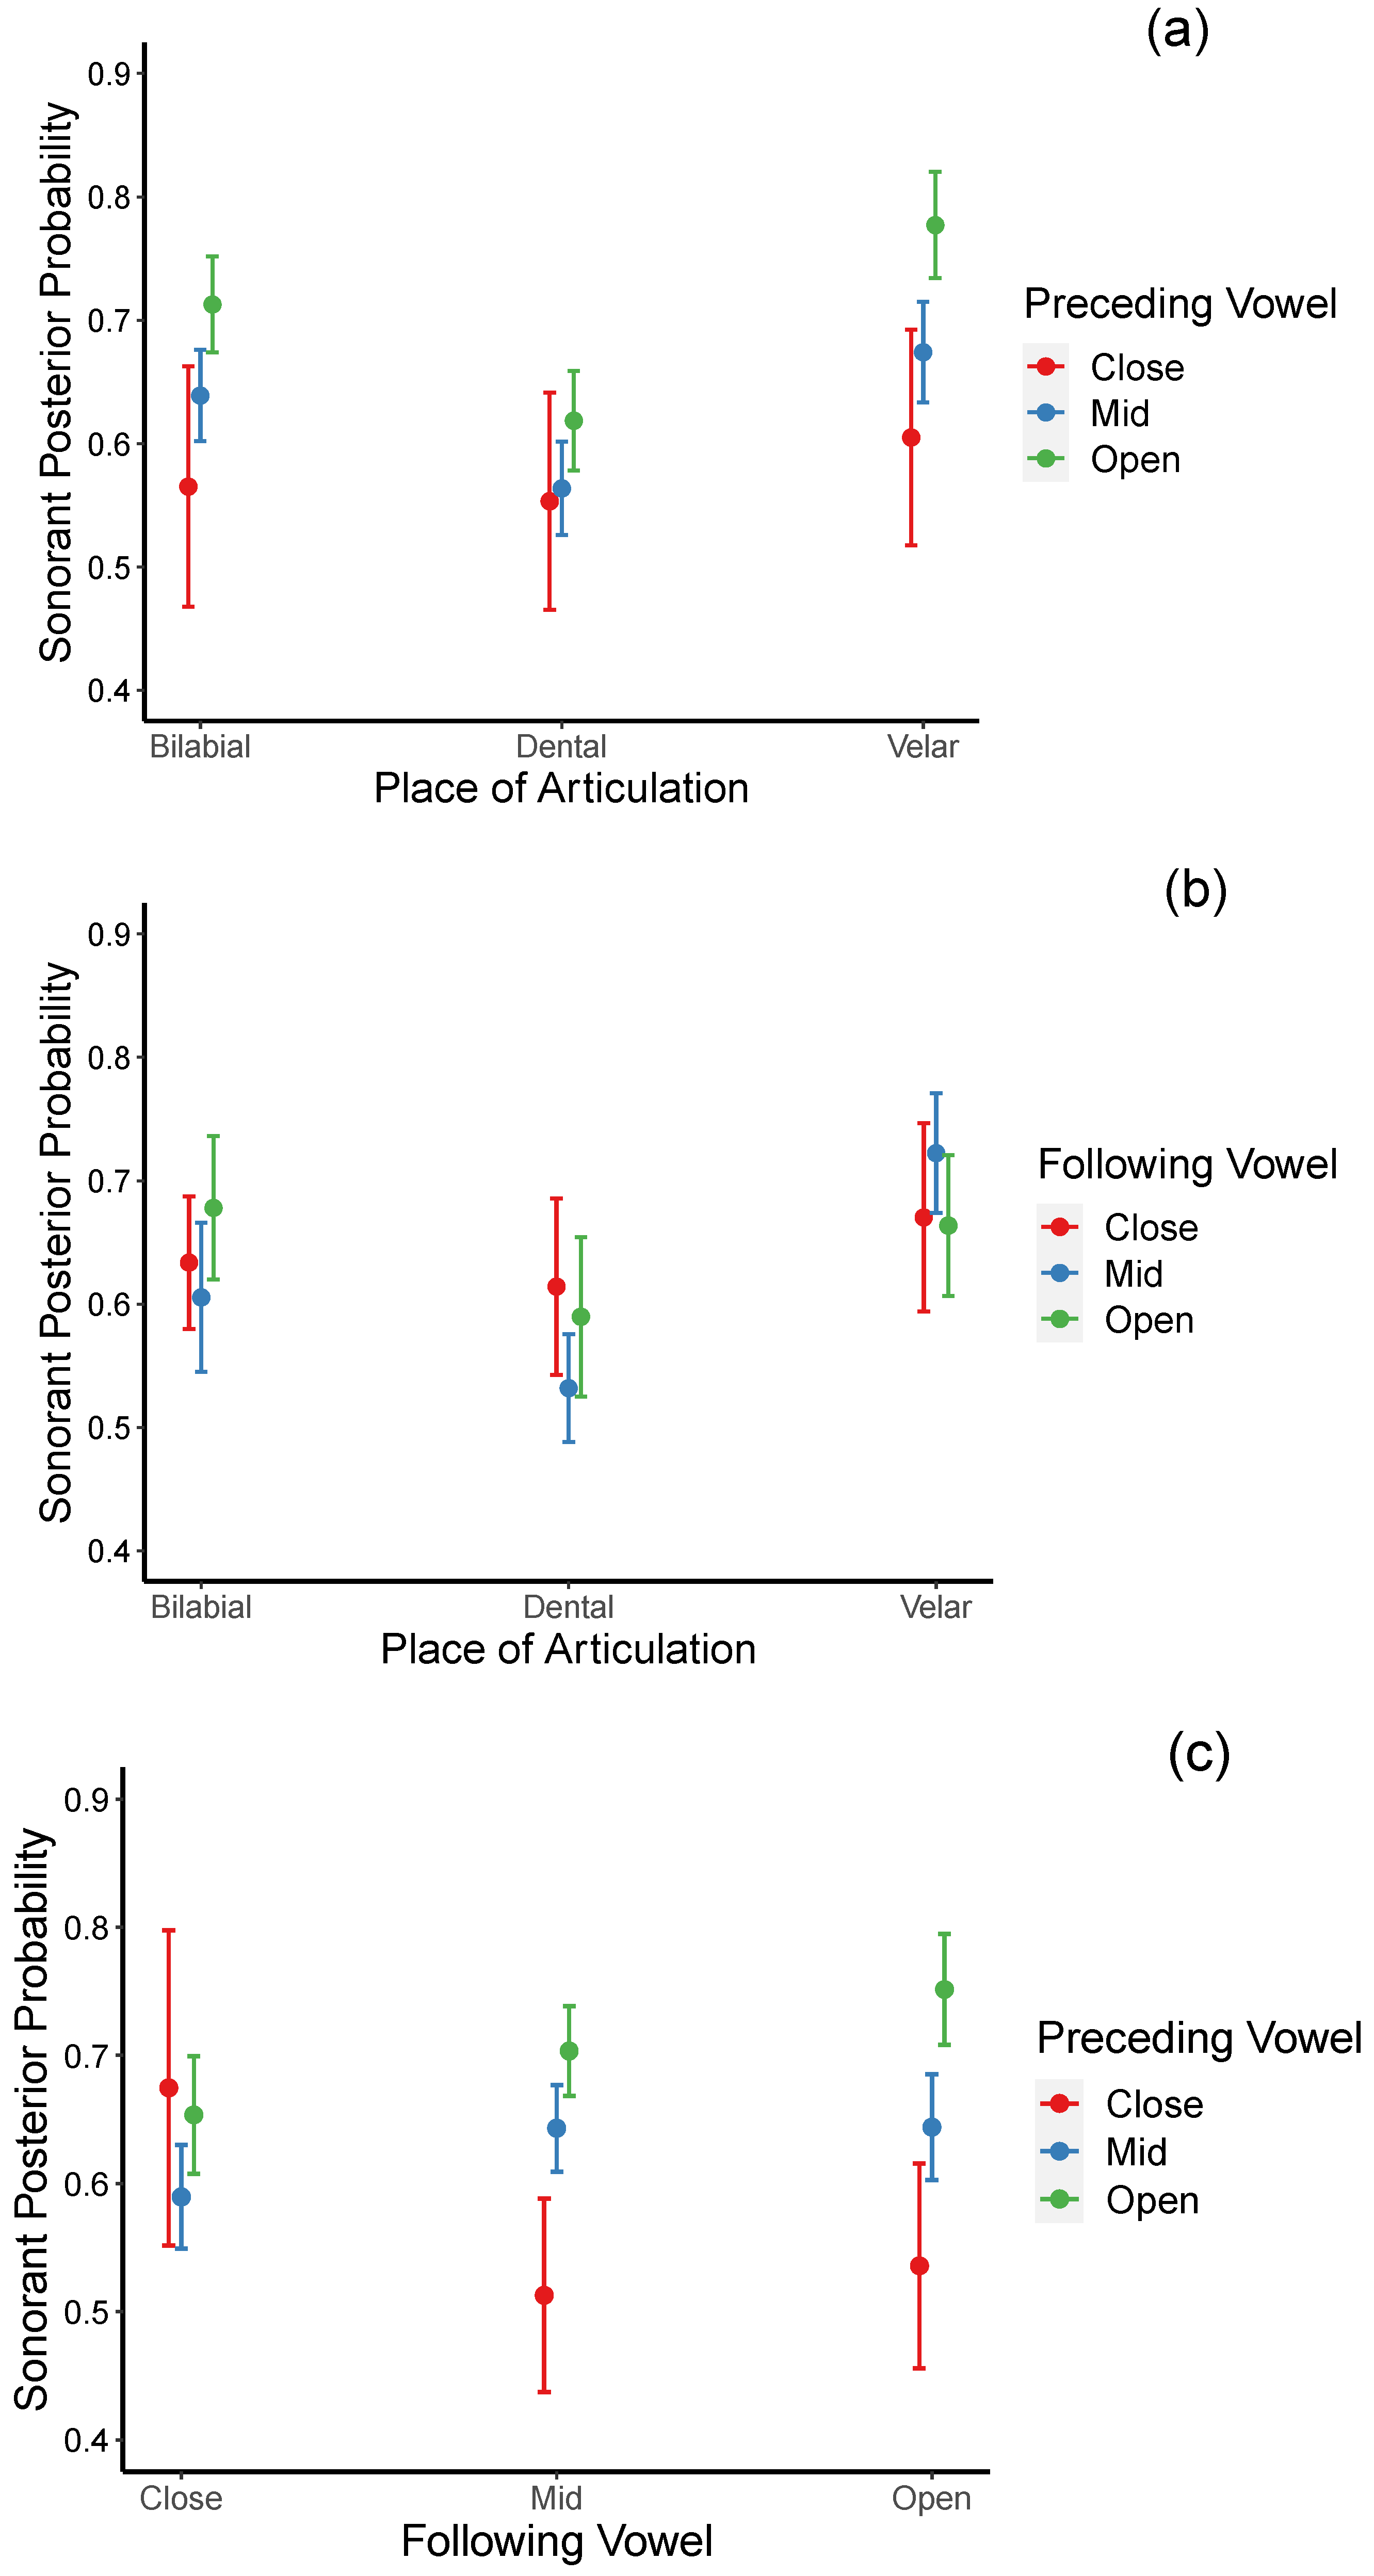
These results suggested that, like the quantitative acoustic metrics, sonorant posterior probabilities exhibit effects of known lenition factors, including stress, voicing, place of articulation, the openness of preceding vowels, and speaking rate. Specifically, sonorant posterior probabilities suggested that the degree of stop lenition is greater in unstressed syllables than in stressed syllables when the stops are voiced than when they are voiceless, when preceding vowels are lesser in the degree of openness, and when the speaking rate increases. Regarding the effects of place of articulation, the sonorant’s posterior probabilities indicate that both bilabial and velar stops are more lenited than dental stops.
Interactions between place × preceding and place × following vowels, as well as between preceding × following vowels, were also significant (see
Table 7). For the significant interaction between place and preceding vowel (see
Figure 7a), post hoc analyses indicate that sonorant posterior probabilities were lowest when the preceding vowels are close relative to when they are mid and open, but the difference reached significance only for velar stops. Specifically, sonorant posteriors probabilities for velar stops following open vowels are significantly higher (more lenited) than when they occur after close vowels [
β = 0.172,
t = 4.229,
p = 0.0008). In addition, when preceded by mid vowels, bilabial and velar stops are more lenited (higher sonorant posterior probabilities) than dental stops [
βs = 0.075, 0.110;
ts = 4.540, 5.862;
ps = 0.0002, <0.001]. Similarly, when preceded by open vowels, bilabial and velar stops were more lenited than dental stops [
βs = 0.094, 0.159;
ts = 4.936, 7.660;
ps < 0.001, <0.001], but bilabial stops were less lenited than velar stops [
β = −0.064,
t = −3.311,
p = 0.027].
For the significant interaction between the place and the following vowel (see
Figure 7b), post hoc analyses revealed no effects of the following vowel’s openness on any of the three types of stops. However, when followed by open vowels, bilabial and dental stops were less lenited (lower sonority posterior probabilities) than velar stops [
βs = −0.117, −0.191;
ts = −3.796, −7.535;
ps = 0.005, <0.001].
For the significant interaction between preceding and following vowels (see
Figure 7c), post hoc analyses suggested that when followed by mid vowels, posterior sonority probabilities were significantly higher when the preceding vowels are mid or open than when they are close [
βs = 0.130, 0.191;
ts = 3.655, 5.294,
ps = 0.008, <0.001). Similarly, when followed by open vowels, posterior sonority probabilities were significantly higher when the preceding vowels were also open rather than close [
β = 0.216,
t = 5.933,
p < 0.001). Interestingly, no effects of the preceding vowel’s openness when the following vowels are close. With the exception of close vowels, these results suggested that, stronger lenition occurs when the following and the preceding vowels are equal or greater in openness.
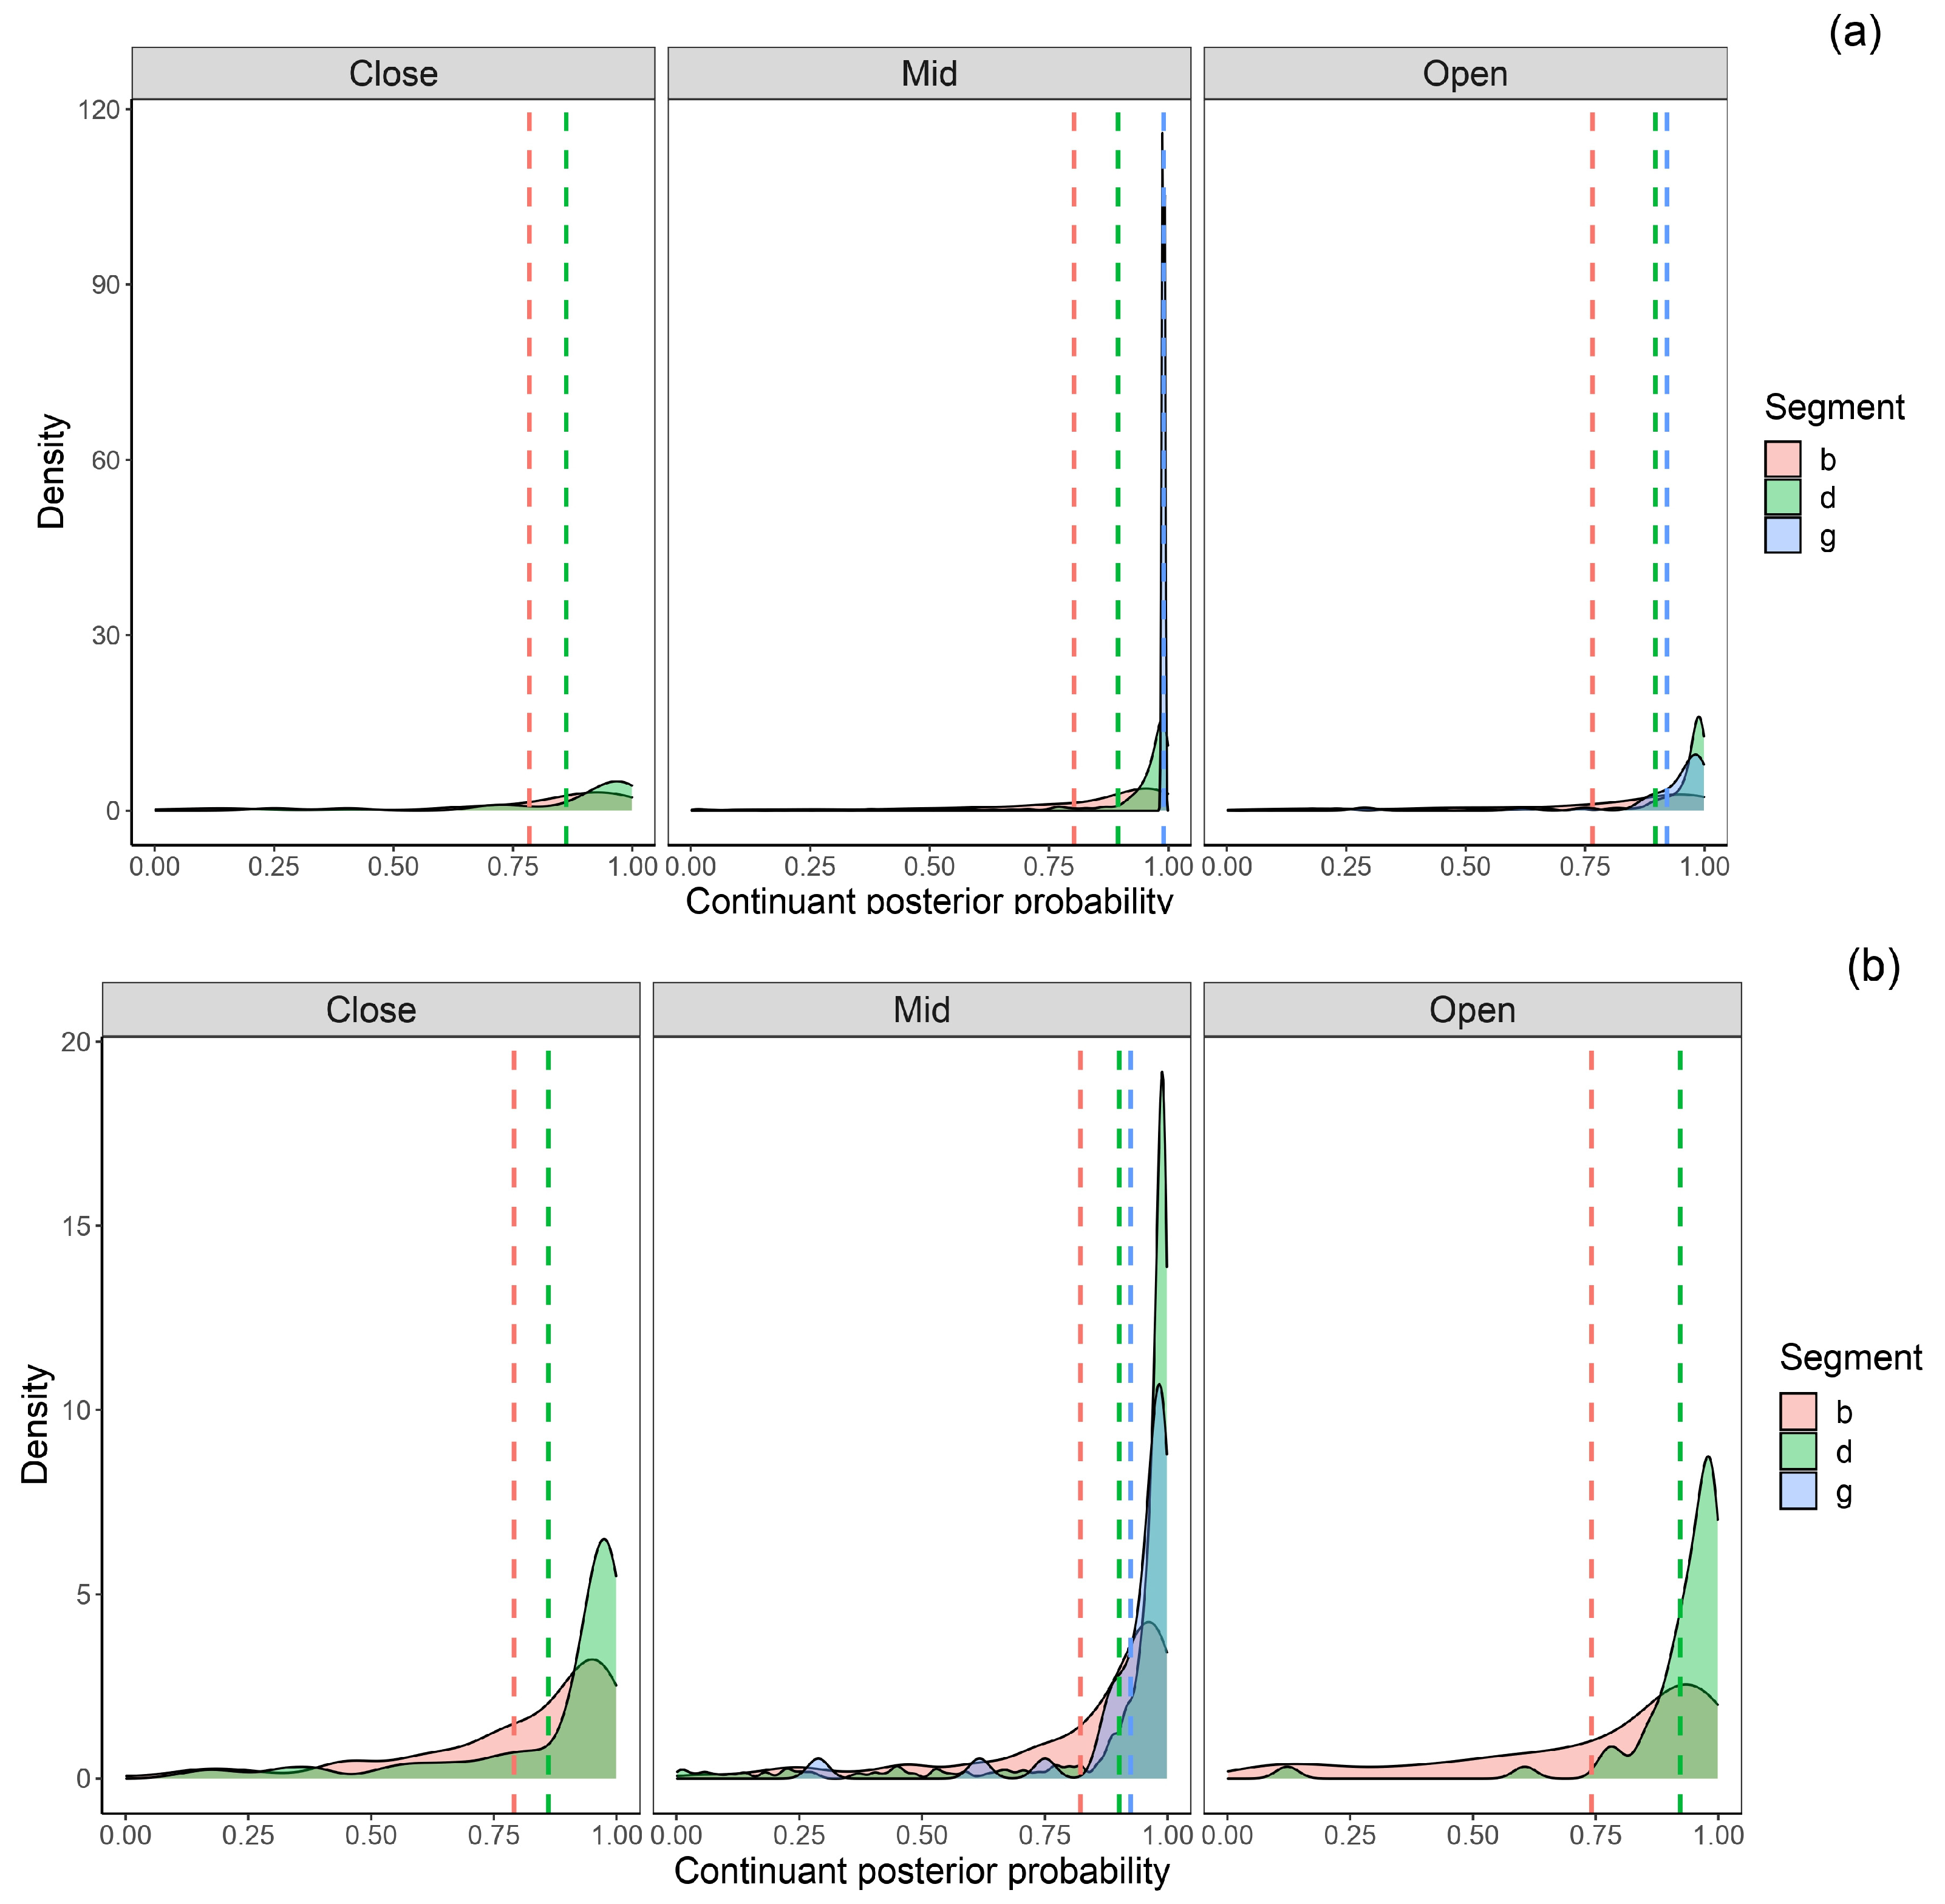
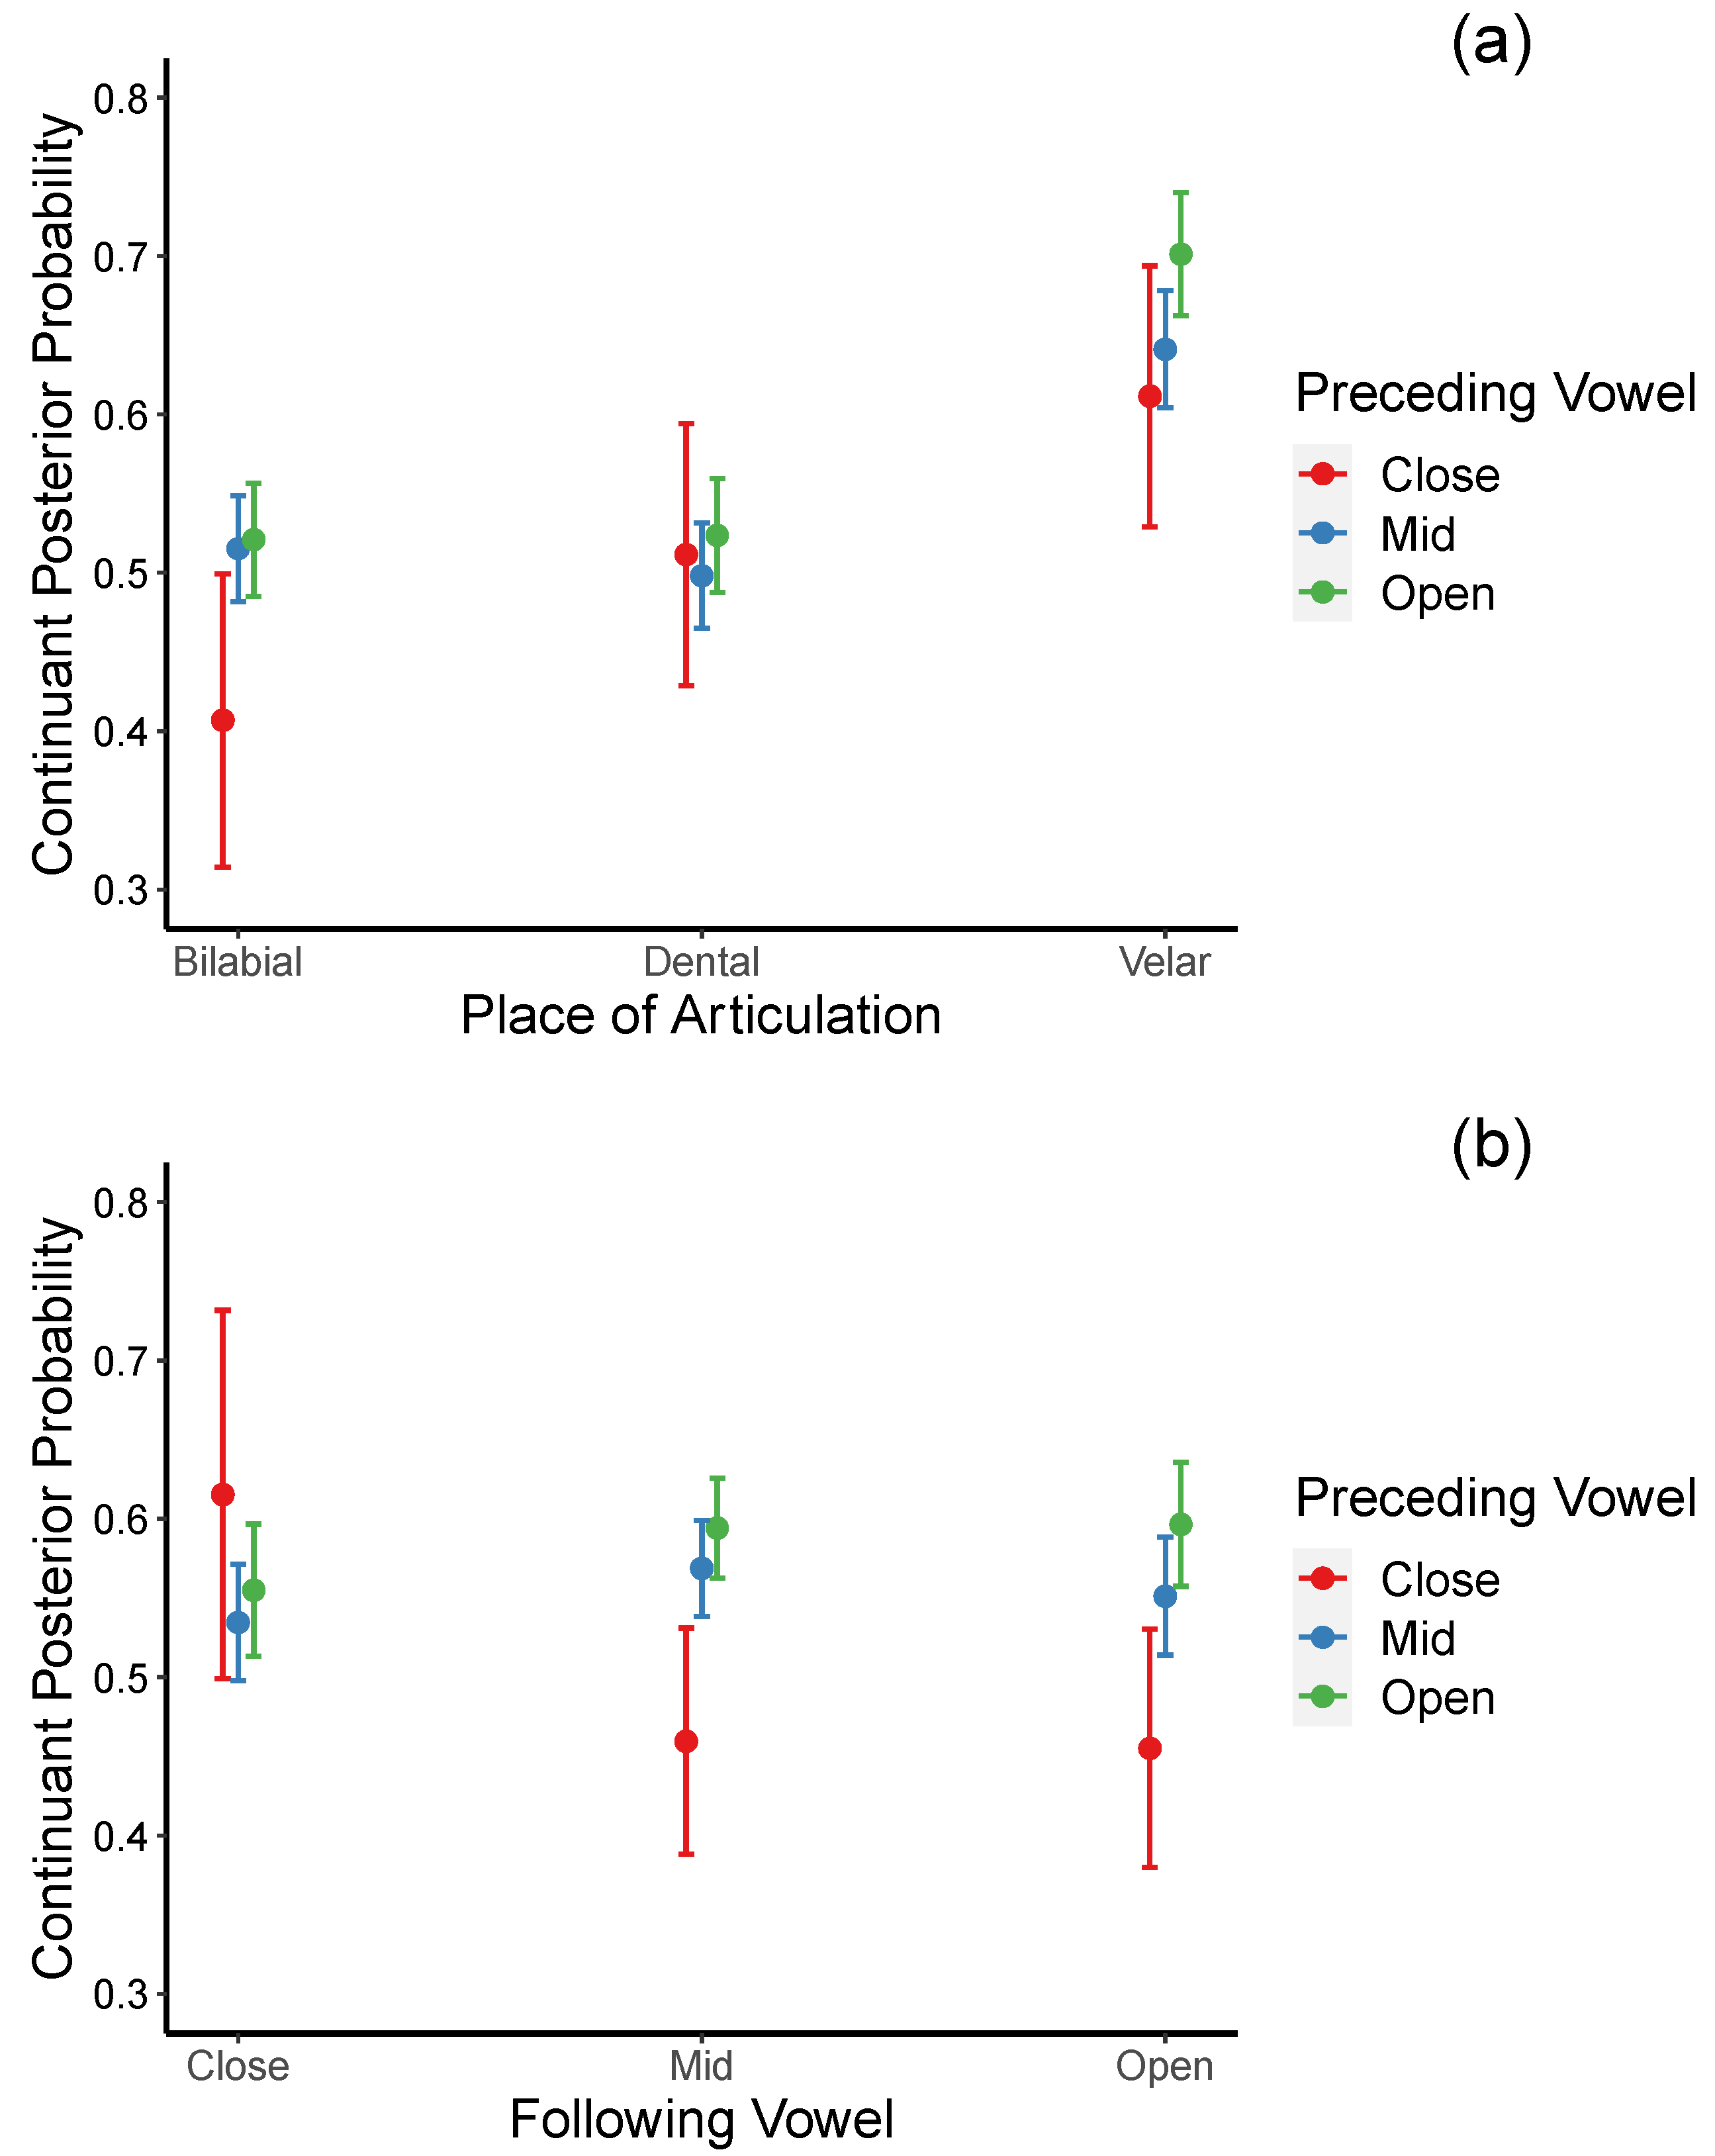
3.7. Continuant Posterior Probability
Figure 8 shows the sonorant posteriors probabilities of intervocalic bilabial, dental, and velar voiced stops before (see
Figure 8a) and after (see
Figure 8b) close, mid, and open vowels in stressed and stressed syllables.
52.5% of the total variance of continuant posterior probabilities was explained by the fixed factors in the regression model (marginal R
2 = 0.525), while the full model accounted for 61.3% of the variance (conditional R
2 = 0.613). The model yielded significant main effects for voicing: voiced > voiceless stops [
β = 0.637,
t = 46.833,
p < 0.001); place of articulation: dental < velar [
β = −0.140,
t = −6.591,
p < 0.001; preceding vowel: mid < open [
β = −0.030,
t = −3.632,
p < 0.001], and speaking rate: the faster the speaking rate, the higher the continuant posterior probabilities [
β = 0.007,
t = 4.468,
p < 0.001]. In addition, a significant interaction between place and preceding vowel and between preceding and following vowel contexts were also obtained (see
Table 8).
Post hoc, follow-up tests revealed that a significant interaction between place and preceding vowel (see
Figure 9a) stemmed from the fact that continuant posterior probabilities for bilabial and dental stops were significantly lower (less lenited) than those of velar stops when preceded by the mid and open vowels [
βs = −0.126, 0.180;
ts = −7.600, −9.833;
ps ≤ 0.0001 for bilabials;
βs = −0.143, −0.178;
ts = −8.140, −9.322;
ps < 0.001, for dentals). In the preceding close vowel context, the difference between the velar stops and the bilabial stops, but not between the velar stops and the dental stops, almost reached a significant level [
β = −0.205,
t = −3.073,
p = 0.055 for bilabials;
β = −0.100, 0.047;
t = −2.125,
p = 0.4563). These results suggested the following ranking from most lenited to least lenited: velar > dental > labial in postvocalic position.
For the significant interaction between the preceding and following vowels (see
Figure 9b), post hoc analyses revealed the following. When followed by mid vowels, continuant posterior probabilities were significantly lower (less lenited) when the preceding vowels were close rather than mid [
β = −0.109,
t = −3.207,
p = 0.036] or open [
β = −0.135,
t = −3.914,
p = 0.003]. When followed by open vowels, continuant posterior probabilities are significantly lower only when the preceding vowels are close rather than mid [
β = −0.142,
t = −4.077,
p = 0.002]. On the other hand, when the following vowels are close, continuant posterior probabilities across the three preceding vowel contexts did not reach significance. These results suggest that continuant posterior probabilities are more likely to increase when the preceding and the following vowels are relatively more open (e.g., mid or open, not close). When mid vowels precede the target stops, continuant posterior probabilities increase when the following vowels are of the same or one step higher in the degree of openness. However, the open vowels precede the target stops, and continuant posterior probabilities increase when the following vowels are one step lower in openness.
4. Results, Summary and Discussion
The degree of lenition of Spanish voiced stop varies as a function of several factors, including stress, place of articulation, quality of surrounding vowels, word status (content or function), and speaking rate. Despite extensive research, no standard method to quantify the degree of lenition has emerged. Under the quantitative acoustic approach, different acoustic dimensions have been employed by different researchers as correlates of lenition. In this study, we compared five acoustic indices of lenition of stops in an Argentinian Spanish corpus (harmonic-to-noise ratio (HNR), duration of the target stops relative to the sum duration of the preceding vowel + target stop + following vowel, intensity difference between the target stops and their preceding and following vowels and mean intensity of the target stops) to the posterior probabilities of the sonorant and continuant phonological features derived from Phonet, a deep recurrent neural network model. The seven lenition metrics are entered as the dependent variables in a series of linear mixed-effect regression models with known factors of lenition, including stress, place of articulation, voicing, preceding and following vowel height/openness, word status (function or content) and speaking rate, as fixed factors. The degree of lenition is predicted to be higher (e.g., higher HNR, lower duration ratio, lower relative intensity differences, higher mean intensity, higher sonorant posterior probability, and higher continuant posterior probability values) in unstressed syllables relative to stressed syllables. Similarly, a higher degree of lenition is predicted for voiced stops relative to voiceless stops, for function words relative to content words, and for a faster speaking rate relative to a slower speaking rate (
Broś et al. 2021). Regarding the place of articulation and flanking vowels, mixed results have been reported. For example,
Simonet et al. (
2012) reported that /d/ is more lenited after a low vowel than after a higher vowel among (Iberian, Majorcan) Spanish, and (Majorcan) Catalan bilinguals. In contrast,
Cole et al. (
1999) and
Ortega-Llebaria (
2004) found Spanish /ɡ/ to be less lenited between low vowels than between high vowels, while no effect of vowel height was found for /b/ (
Ortega-Llebaria 2004,
2003).
Table 9 summarizes the significant main effects of the seven regression models, one for each dependent variable. As shown in this table, all seven metrics predicted that intervocalic voiced stops in Argentinian Spanish are lenited to a significantly higher degree than voiceless stops and that the lenition degree increases when the speaking rate becomes faster. Interestingly, unlike
Broś et al. (
2021), who found that lenition is more likely in function words relative to content words in Spanish stops spoken in the Canary Islands when relative duration is a dependent variable, word status is not predictive of lenition advancement along any of the seven metrics we examined, including relative duration. Besides dialectal differences, the right context of the stops examined in
Broś et al. (
2021) is not limited to vowels but also includes consonants. These or other currently unknown factors may account for this discrepant finding. Crucially, these results suggest that sonorant and continuant posterior probabilities share a predictive pattern of lenition with the five quantitative acoustic metrics.
A similar predictive pattern of lenition between sonorant posterior probability and all three intensity measurements is also observed. Specifically, all four metrics predict the degree of lenition in the expected direction: more advanced in unstressed than in stressed syllables. Interestingly, values along all five acoustic metrics, but not the sonorant and continuant posteriors probabilities, significantly vary according to the following vowels. Crucially, the behavior of the sonorant and continuant posteriors probabilities is consistent with the finding that the height of the preceding vowels rather than the height of the following vowels introduced a varying degree of constriction, at least for /d/, in intervocalic context (
Simonet et al. 2012). Moreover, inconsistent effects of the following vowels are observed across the five acoustic measurements. Specifically, HNR, relative duration, and relative intensity (to the following vowel) values predicted a lower degree of stop constriction (higher degree of lenition) when the following vowels are relatively close than when they are relatively more open. However, the opposite pattern was suggested by the relative intensity (to the preceding vowel) and mean intensity values: a more advanced degree of lenition when the following vowels are relatively more open.
However, like three of the acoustic metrics, namely HNR, relative duration, and relative intensity (to the preceding vowel), sonorant and continuant posterior probabilities vary significantly but differently as a function of preceding vowel height. That is, while values along the three acoustic metrics suggest a higher degree of weakening when the preceding vowels are relatively more close, the opposite is indicated by the sonorant and the continuant posterior probabilities: the more open the preceding vowels are, the greater the degree of lenition. Note, however, that the predictive pattern of sonorant and continuant posterior probabilities, but not of the three acoustic dimensions, is consistent with the articulatory effort-based view of lenition (
Kirchner 1998,
2013). More specifically, since the distance that the articulators will travel from (and possibly also to) a lower vowel is likely reduced relative to a higher vowel, lenition should be more prevalent after a more open than a more close vowel.
Place of articulation of the stops exerts influence on four acoustic metrics: HNR, relative duration, relative intensity (to the preceding vowel), relative intensity (to the following vowel), as well as on the sonorant and the continuant posterior probabilities. While the pattern of the influence is similar for the sonorant and the continuant posterior probabilities, it differs across the four acoustic metrics. Like sonorant and continuant posterior probabilities, the two acoustic intensity measures indicate that velar stops are more lenited than dental and bilabial stops. This lenition pattern is consistent with that of
Kingston’s (
2008) finding on Spanish stops produced by two female speakers from Ecuador and Peru. He reasoned that velar stops are more lenited perhaps “because velar closures are more often incomplete” (footnote 20, p. 21).
However, the two sets of measures (two acoustic intensity measures vs. sonorant and continuant posterior probabilities) differ in their ranking of the bilabial and the dental stops. Consistent with
Kingston (
2008)’s prediction, dentals are more lenited than bilabials according to the two acoustic intensity measures, while the opposite is predicted by the sonorant and the continuant posterior probabilities. Alternatively, contrary to Kingston’s prediction, it is possible that bilabial closures are less complete than dental closures and are thus more lenited. The fact that the two intensity measures are computed relative to their immediately preceding and following vowels only while sonorant and continuant posterior probabilities are estimated globally based on all sonorant, and continuant segments in the corpus may also explain their differing predictive pattern. On the other hand, HNR and relative duration measures suggest that dental stops are (non-significantly) more lenited than velar stops and significantly more lenited than bilabial stops, while relative duration indicates that dental stops are significantly more lenited than both bilabial velar stops. These results are inconsistent with the effort-based account of lenition (
Kirchner 1998,
2013) and
Kingston’s (
2008) findings.
In addition to significant main effects, our regression models also yielded significant interactions mainly between the place of articulation and the preceding and following vowels as well as between preceding and following vowels. The significant place × preceding vowel interaction was found for HNR, relative duration, relative intensity (to the preceding vowel), as well as for sonorant and continuant posterior probabilities. Post hoc pair-wise comparisons indicated different interaction patterns for different metrics, with the patterns for sonorant and continuant posteriors probabilities being more uniform and consistent with previous findings (e.g.,
Kingston 2008) than the three acoustic metrics. More specifically, the more open the preceding vowels are, the more lenited the velar stops are predicted by the sonorant posterior probabilities. Further, velar stops are predicted to be more lenited than bilabial and dental stops when preceded by open vowels. Similarly, continuant posterior probabilities predicted that velar stops are more lenited than bilabial and dental stops when preceded by mid and open vowels but not close vowels. On the other hand, HNRs predicted a higher degree of lenition for dental and bilabial stops after close vowels, while preceding low vowels trigger a higher degree of lenition for velar stops. Relative duration predicts a higher degree of lenition for dental stops compared to bilabial and velar stops after open vowels, while relative intensity (to the preceding vowels) predicts a more advanced degree of lenition of velar stops relative to bilabial and dental stops when the preceding vowels are relatively more close than open.
Significant place × following vowel interactions are found for every metric, except for mean intensity and continuant posterior probabilities. Overall, post hoc analyses suggested that following close vowels introduced a higher degree of variation in the acoustic metric values and predicted a higher degree of lenition of stops in this context. On the other hand, sonorant posterior probabilities are more affected by following open vowels and predicted higher degrees of lenition of velar stops in this environment.
Significant preceding × following vowel interactions are found for HNR, relative duration, relative intensity (to the preceding vowel), relative intensity (to the following vowels), and sonorant and continuant posterior probabilities. Post hoc analyses indicated that a higher degree of lenition is predicted by all acoustic metrics when flanking vowels are relatively close in height and when they are relatively more close than relatively more open. On the other hand, relatively more open flanking vowels are predicted to trigger a higher degree of lenition, particularly for velar stops, by the sonorant posterior probabilities. On the contrary, continuant posterior probabilities predicted a higher degree of lenition when either the preceding or the following vowel height is relatively high. This finding may be explained by the fact that smaller oral opening is more conducive to friction generation, characteristics of fricatives, and members of the [+continuant] phonological class.
In conclusion, the degree of lenition predicted by different lenition metrics vary. However, lenition patterns predicted by the sonorant and continuant posterior probabilities are more consistent and in the direction expected by previous findings and the effort-based view of lenition. As far as the main effects are concerned, lenition patterns predicted by sonorant and continuant posterior probabilities are largely consistent with the relative acoustic intensity measures. This is not surprising given that inputs to the Phonet model that generate the sonorant and continuant posterior probabilities are feature sequences based on log energy distributed across 33 triangular Mel filters of each 0.5 s chunk of the input signals. Some differences between these two sets of metrics may lie in the fact that acoustic intensity measures are relative to the target stops immediate left and right contexts, while sonorant and posterior probability estimates are relative to the whole class of sonorant and continuant segments in the corpus. Sonorant and continuant posterior probabilities relative to the preceding and following segment only could be used in future research to see if minor discrepancies in lenition predictive patterns found between these two sets of metrics could be eliminated. In addition, the approach could be further improved by replacing forced alignment with the automated segmentation method proposed by (
Ennever et al. 2017).


