
Identification and Quantification of Contributing Factors to the Criticality of Aircraft Loss of Separation

 , , ,
, , ,
Abstract
:1. Introduction
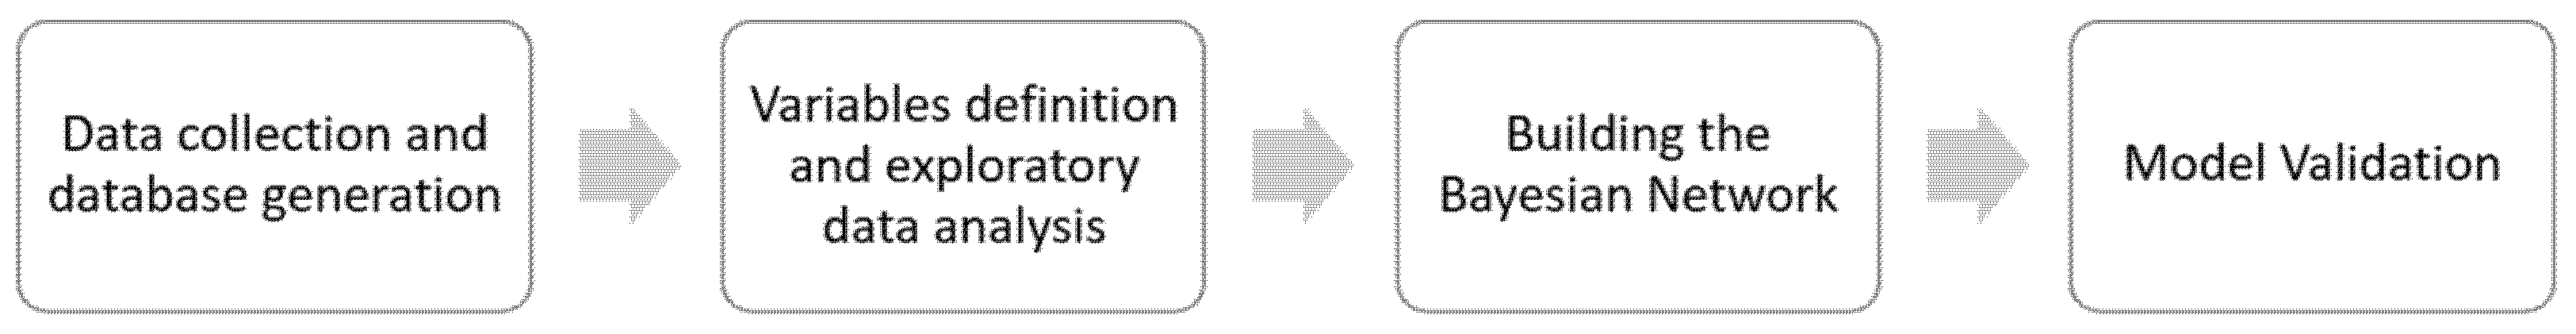
2. Methodology
2.1. Data Collection and Database Generation
- Scenario-related information (date and time, airspace where it occurred, meteorological conditions, aircraft models, etc.), communications (crew—ATCo) and radar traces.
- Extracts of the testimonial reports of the agents involved: crew and ATCo.
- Rating of the incident (severity and frequency), conclusions and recommendations.
2.2. Definition of the Research Variables and Exploratoy Data Analysis
2.2.1. Definition of the Research Variables
- Month: in which the incident occurred.
- Year: in which the incident occurred.
- Time slot: time period during the day in which the incident occurred (UTC time).
- Weather conditions: existing when the incident occurred.
- Airspace: ACC where the incident took place (ACC 1, ACC 2, ACC 3 and ACC 4). The name of the ACC is ordered from 1 to 4 according to the traffic volume in each ACC, with ACC 1 being the one with the highest traffic and ACC 4 the one with the lowest traffic during the study period.
- Communication issues: technical failure or error related to the communication system, such as frequency failure (connection of Push to Talk pedal, PTT), poor transmission/reception quality, congestion, etc.
- ATCS ergonomics: Automated Air Traffic Control System ergonomics. This software is used by ANSP for air traffic management through the provision of air traffic services (ATS). This factor refers to the range of colors in which information is presented by Automated Air Traffic Control System in the screen of the ATCo work position. It is considered because it has been proven during the incident analysis that the ergonomic configuration of the system sometimes leads to confusion for the ATCo (e.g., the color of the labels for aircraft assumed, not assumed, transferred, etc.). This is mentioned several times by ATCos in the testimonial part of the incident reports. Therefore, no value judgments have been made for the recording of this variable.
- STCA: Short Term Conflict Alert Tool for conflict detection by ATCo. It is a system which supports ATCo to detect conflicts (a situation in which separation minima could be compromised) and separation infringements. The system issues a conflict alert (PAC) based on predictions and a violation LOS alarm (VAC) when the separation infringement has taken place.
- TCAS: Traffic and Collision Avoidance System. On-board system which issues a TA alert (Traffic Advisory) and a RA alarm (Resolution Advisory).
- ATC error: it refers to an error made by ATC that contributed to the occurrence of the LOS. It has been extracted from the analysis and investigation of the reports applying the SOAM methodology.
- Crew error: it refers to an error made by the crew that contributed to the occurrence of the LOS. It has been extracted from the analysis and investigation of the reports applying the SOAM methodology.
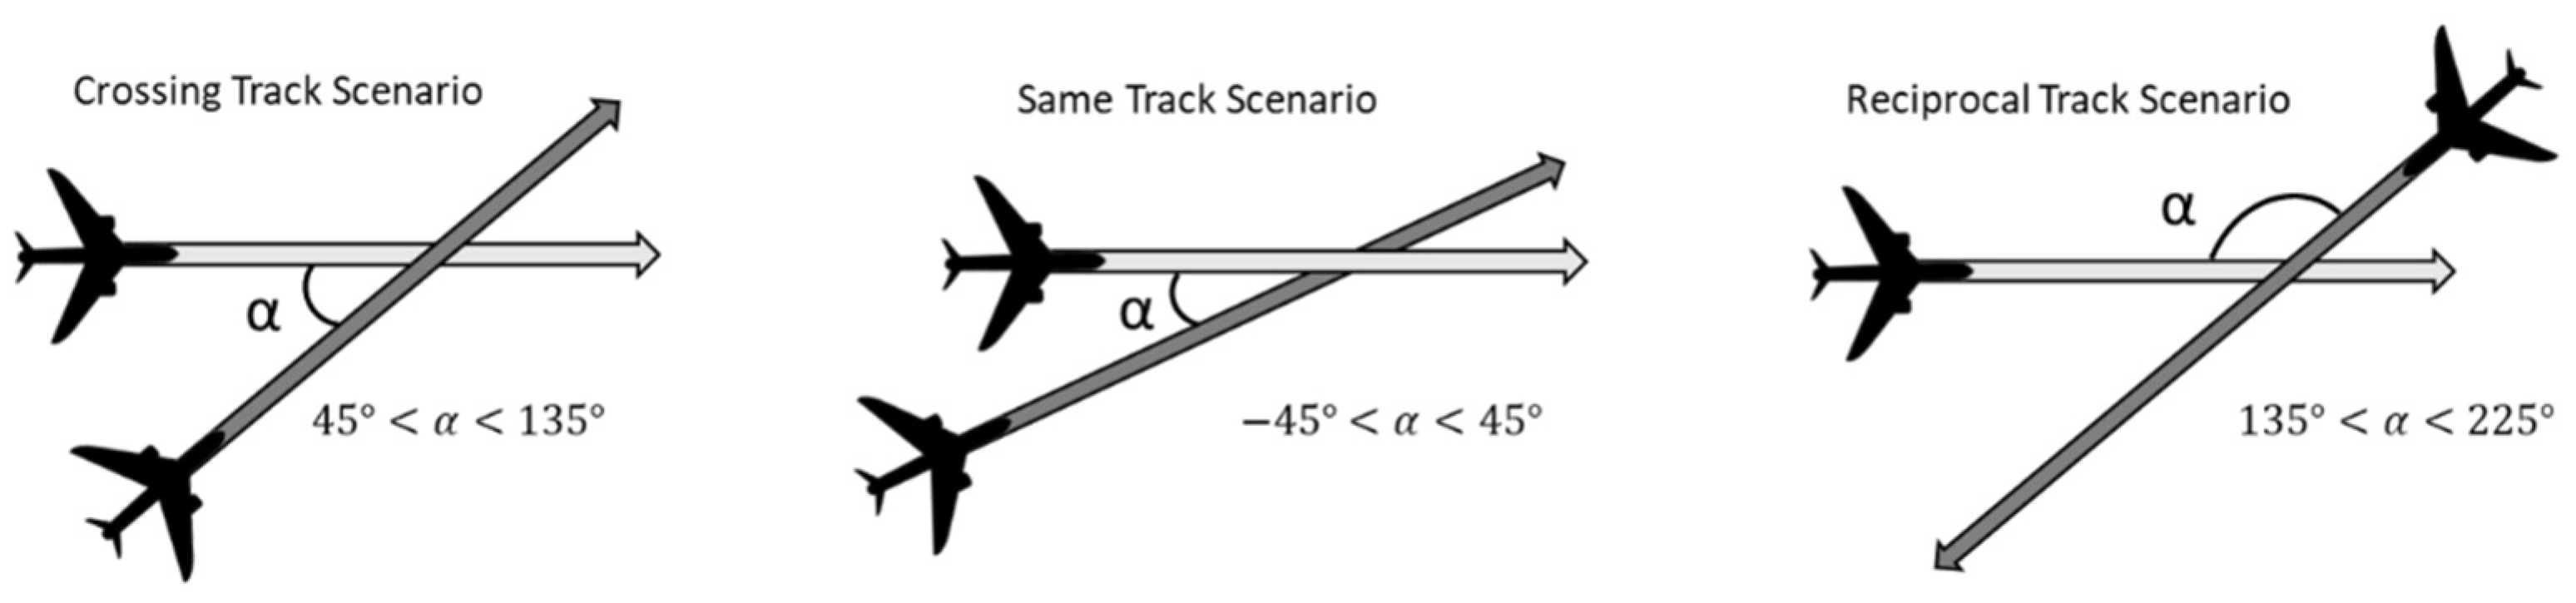
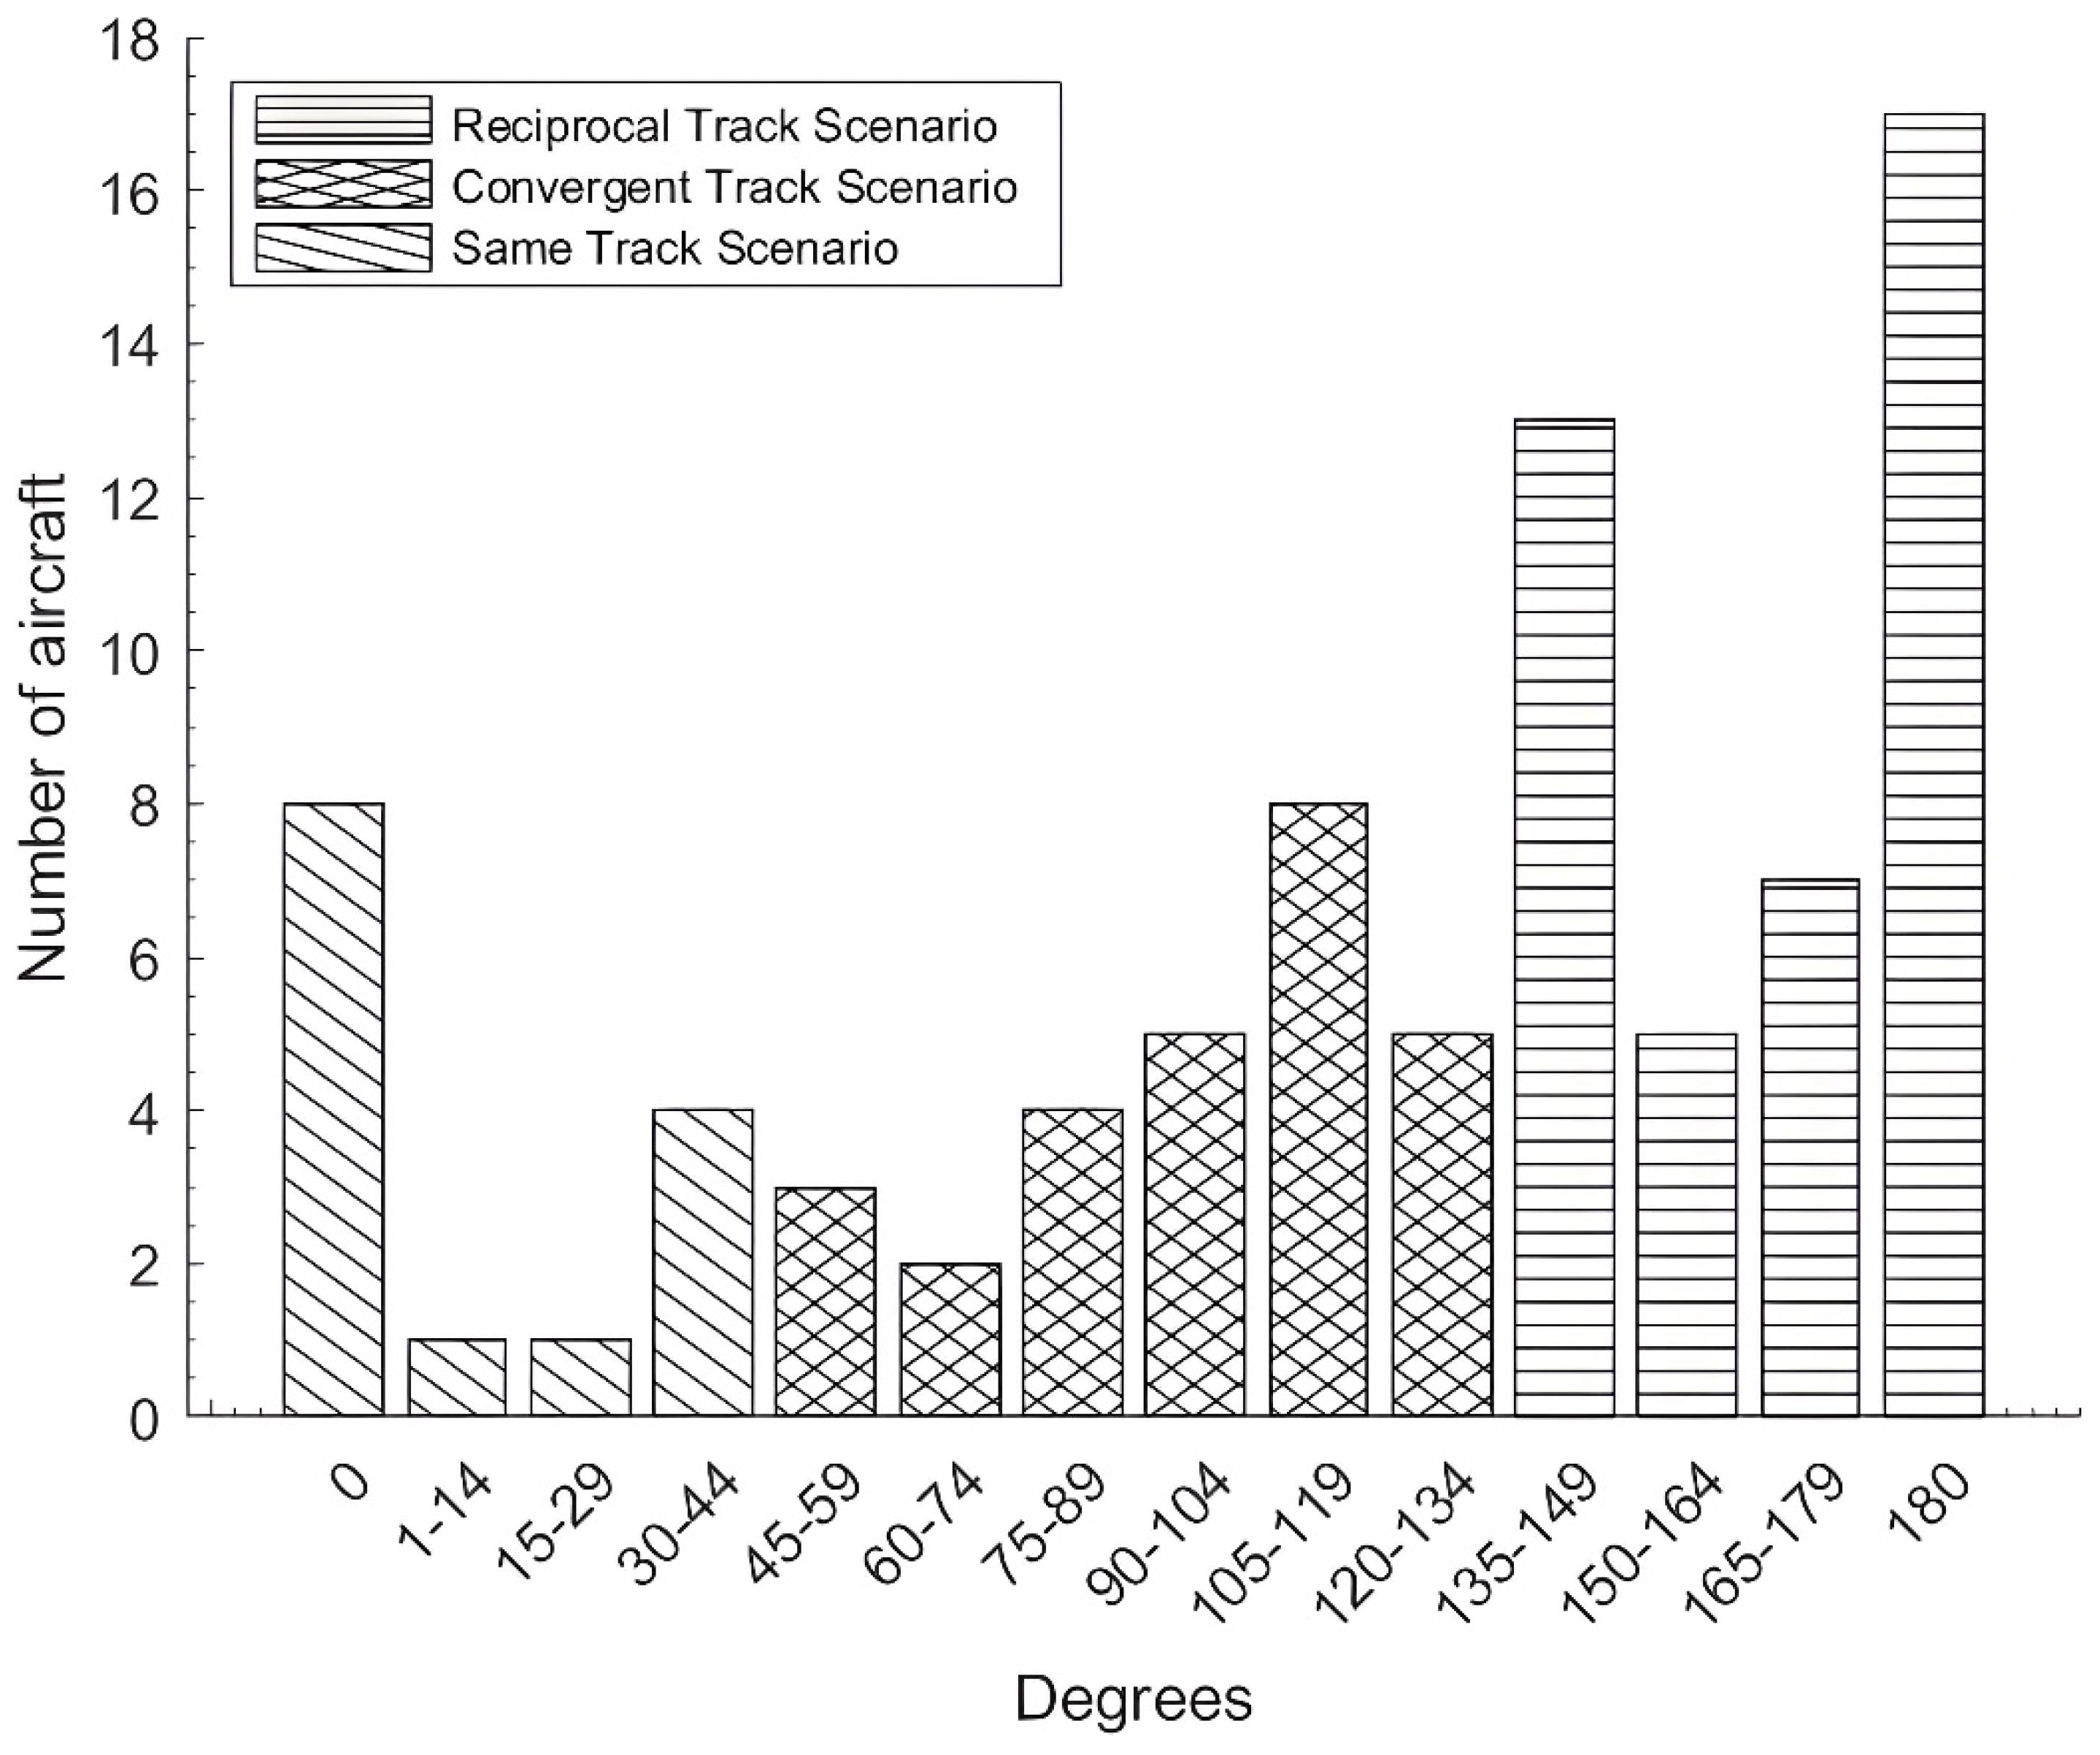
- Encounter geometry: as a function of the angle between aircraft tracks (Figure 2). There are three possible geometries, according to the ICAO PANS-ATM document [20]: same tracks, opposite tracks or convergent tracks. Since this information is vague in the reports and the geometry between aircraft is only mentioned theoretically as “crossing, same or reciprocal track”, the angle between tracks has been studied to validate the classification, based on the trajectories simulated by RAMS Plus software [26].
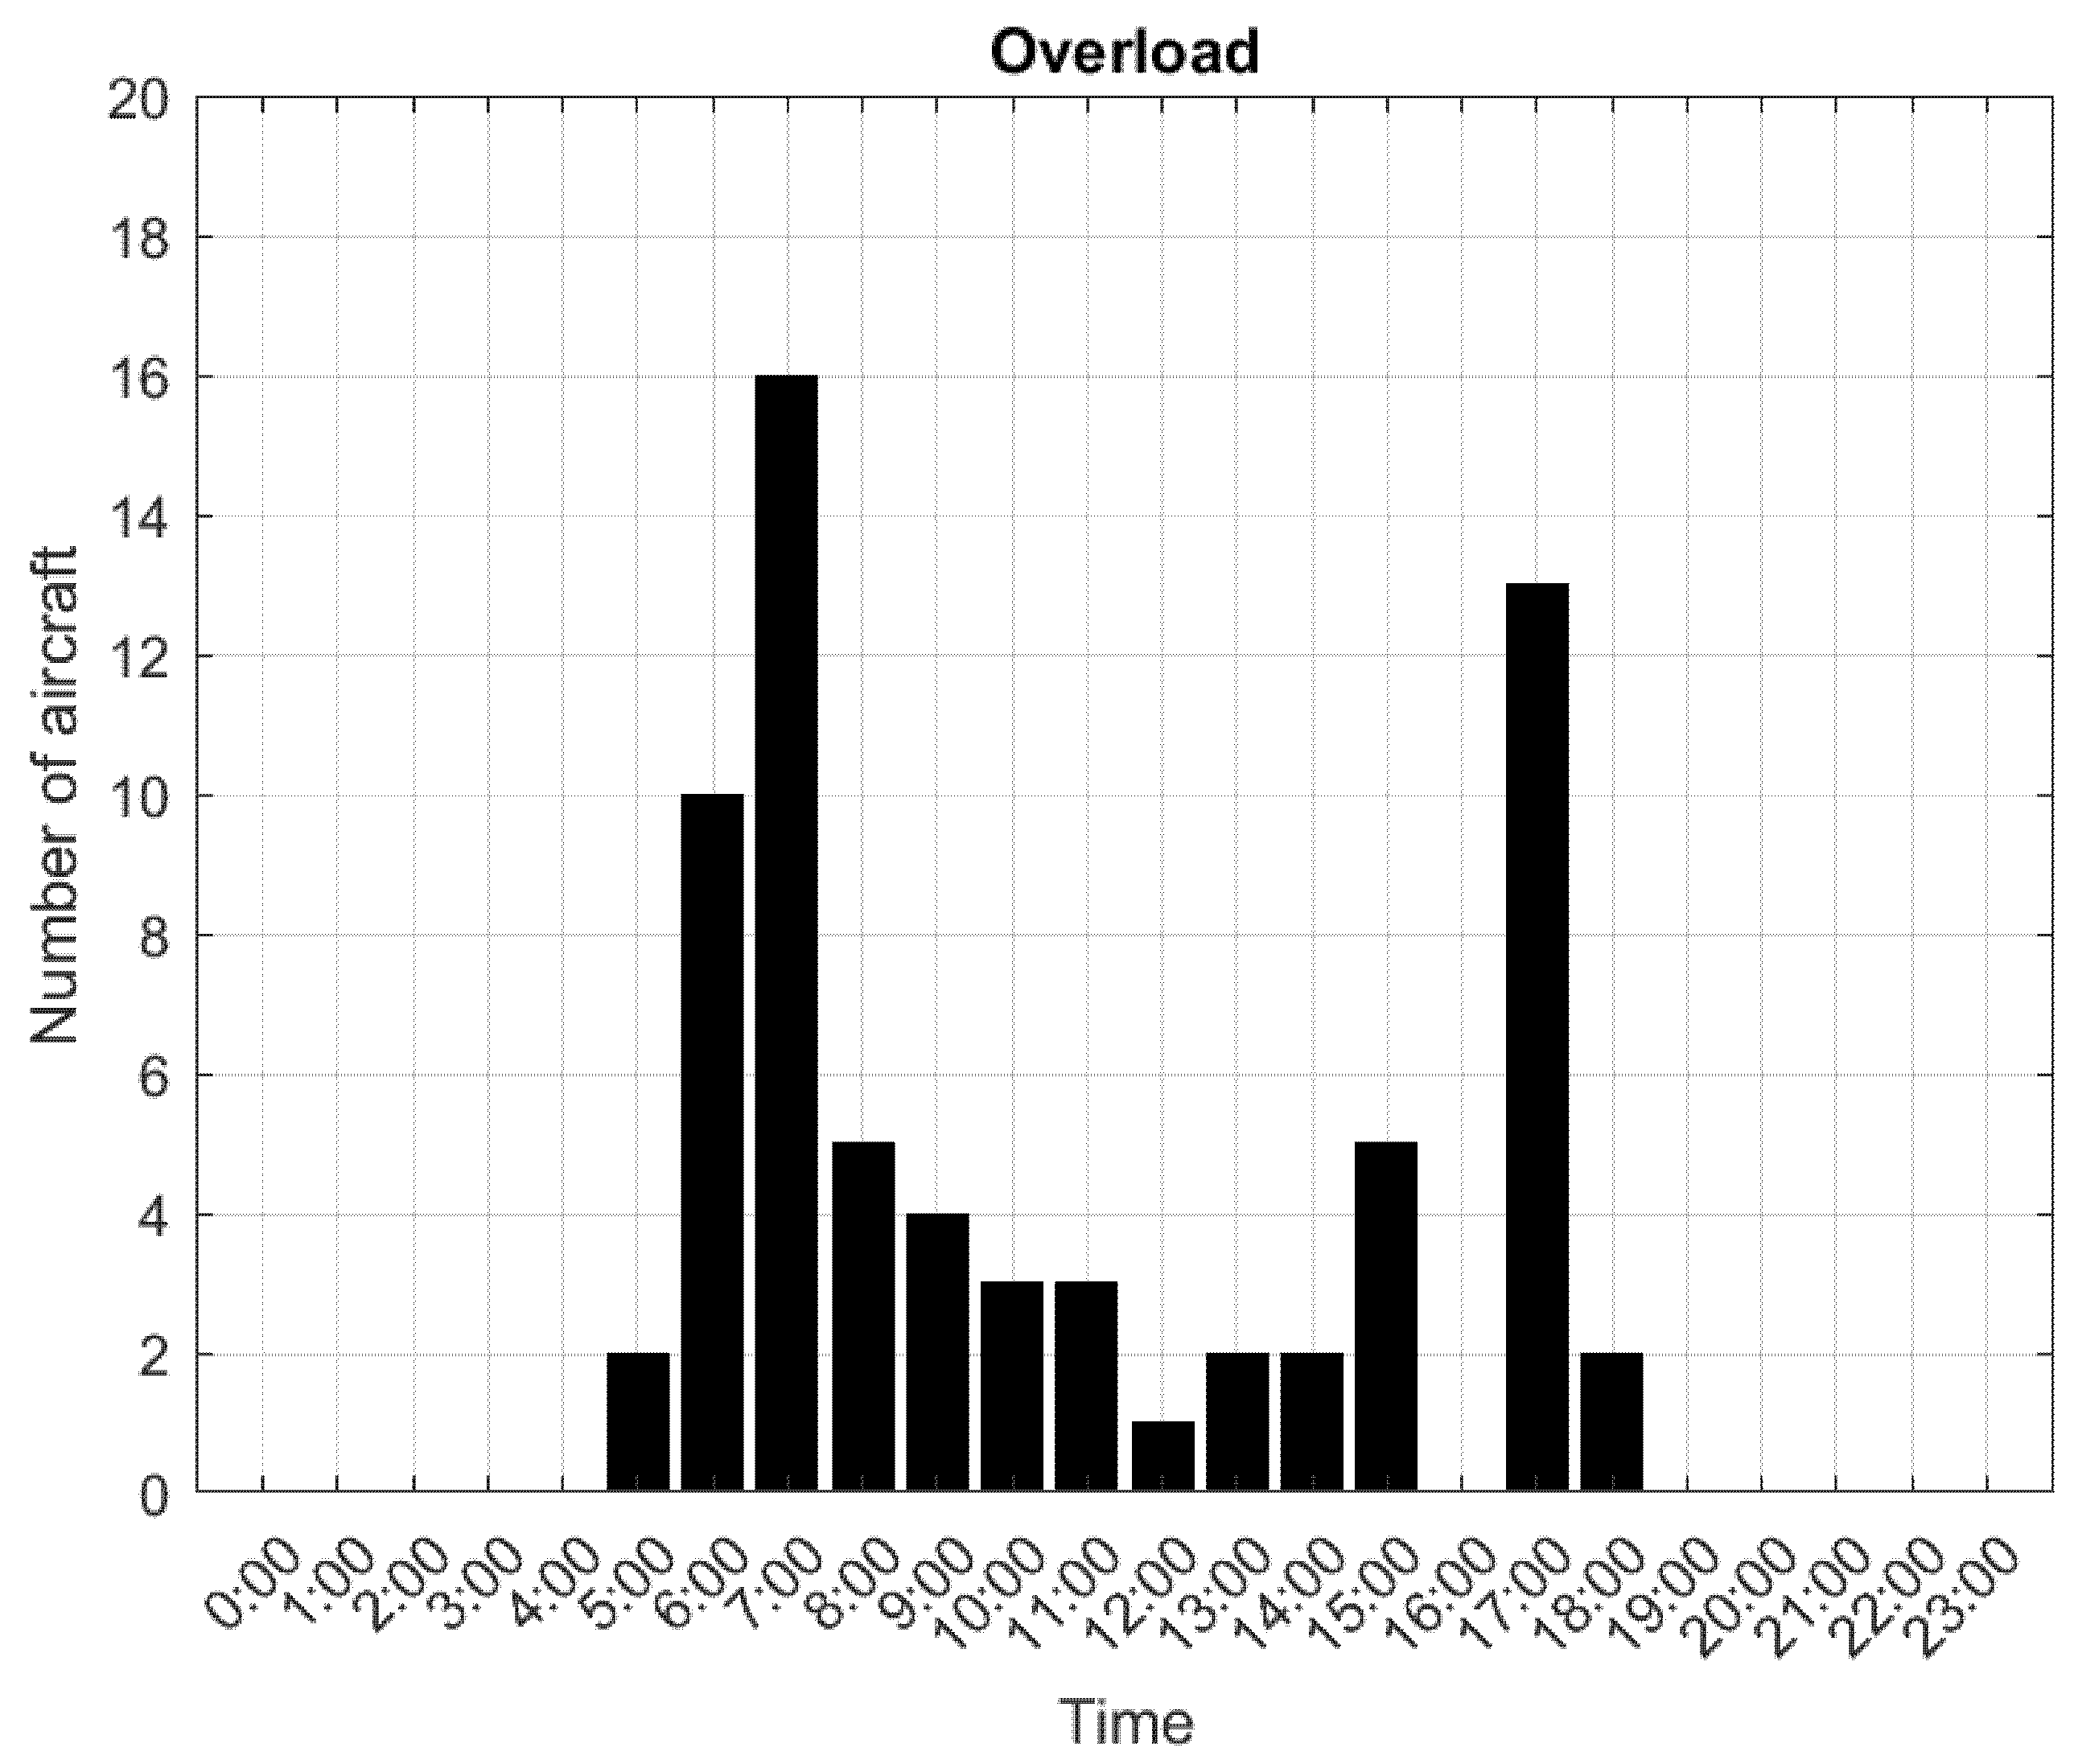
- Sector overload: situation in which the number of aircraft in the sector, at the time of the incident, exceeded the declared capacity of the sector. This information has been extracted from the ATCos’ testimonial extracts from the incident reports analyzed. In order to make this variable more objective, this information has been contrasted with that obtained in NEST tool [27], a simulation software developed by EUROCONTROL, on the state of the sector at the time of the incident. Only those cases in which NEST showed that the sector was overloaded were recorded in the dataset. In Figure 3, it can be seen that in several periods throughout the day the number of entries in the sector (one of the ACC 1 sectors) exceeded the declared capacity. The graph below shows the overload of the sector by hours (number of aircraft in excess of the declared capacity) on the day of the LOS.
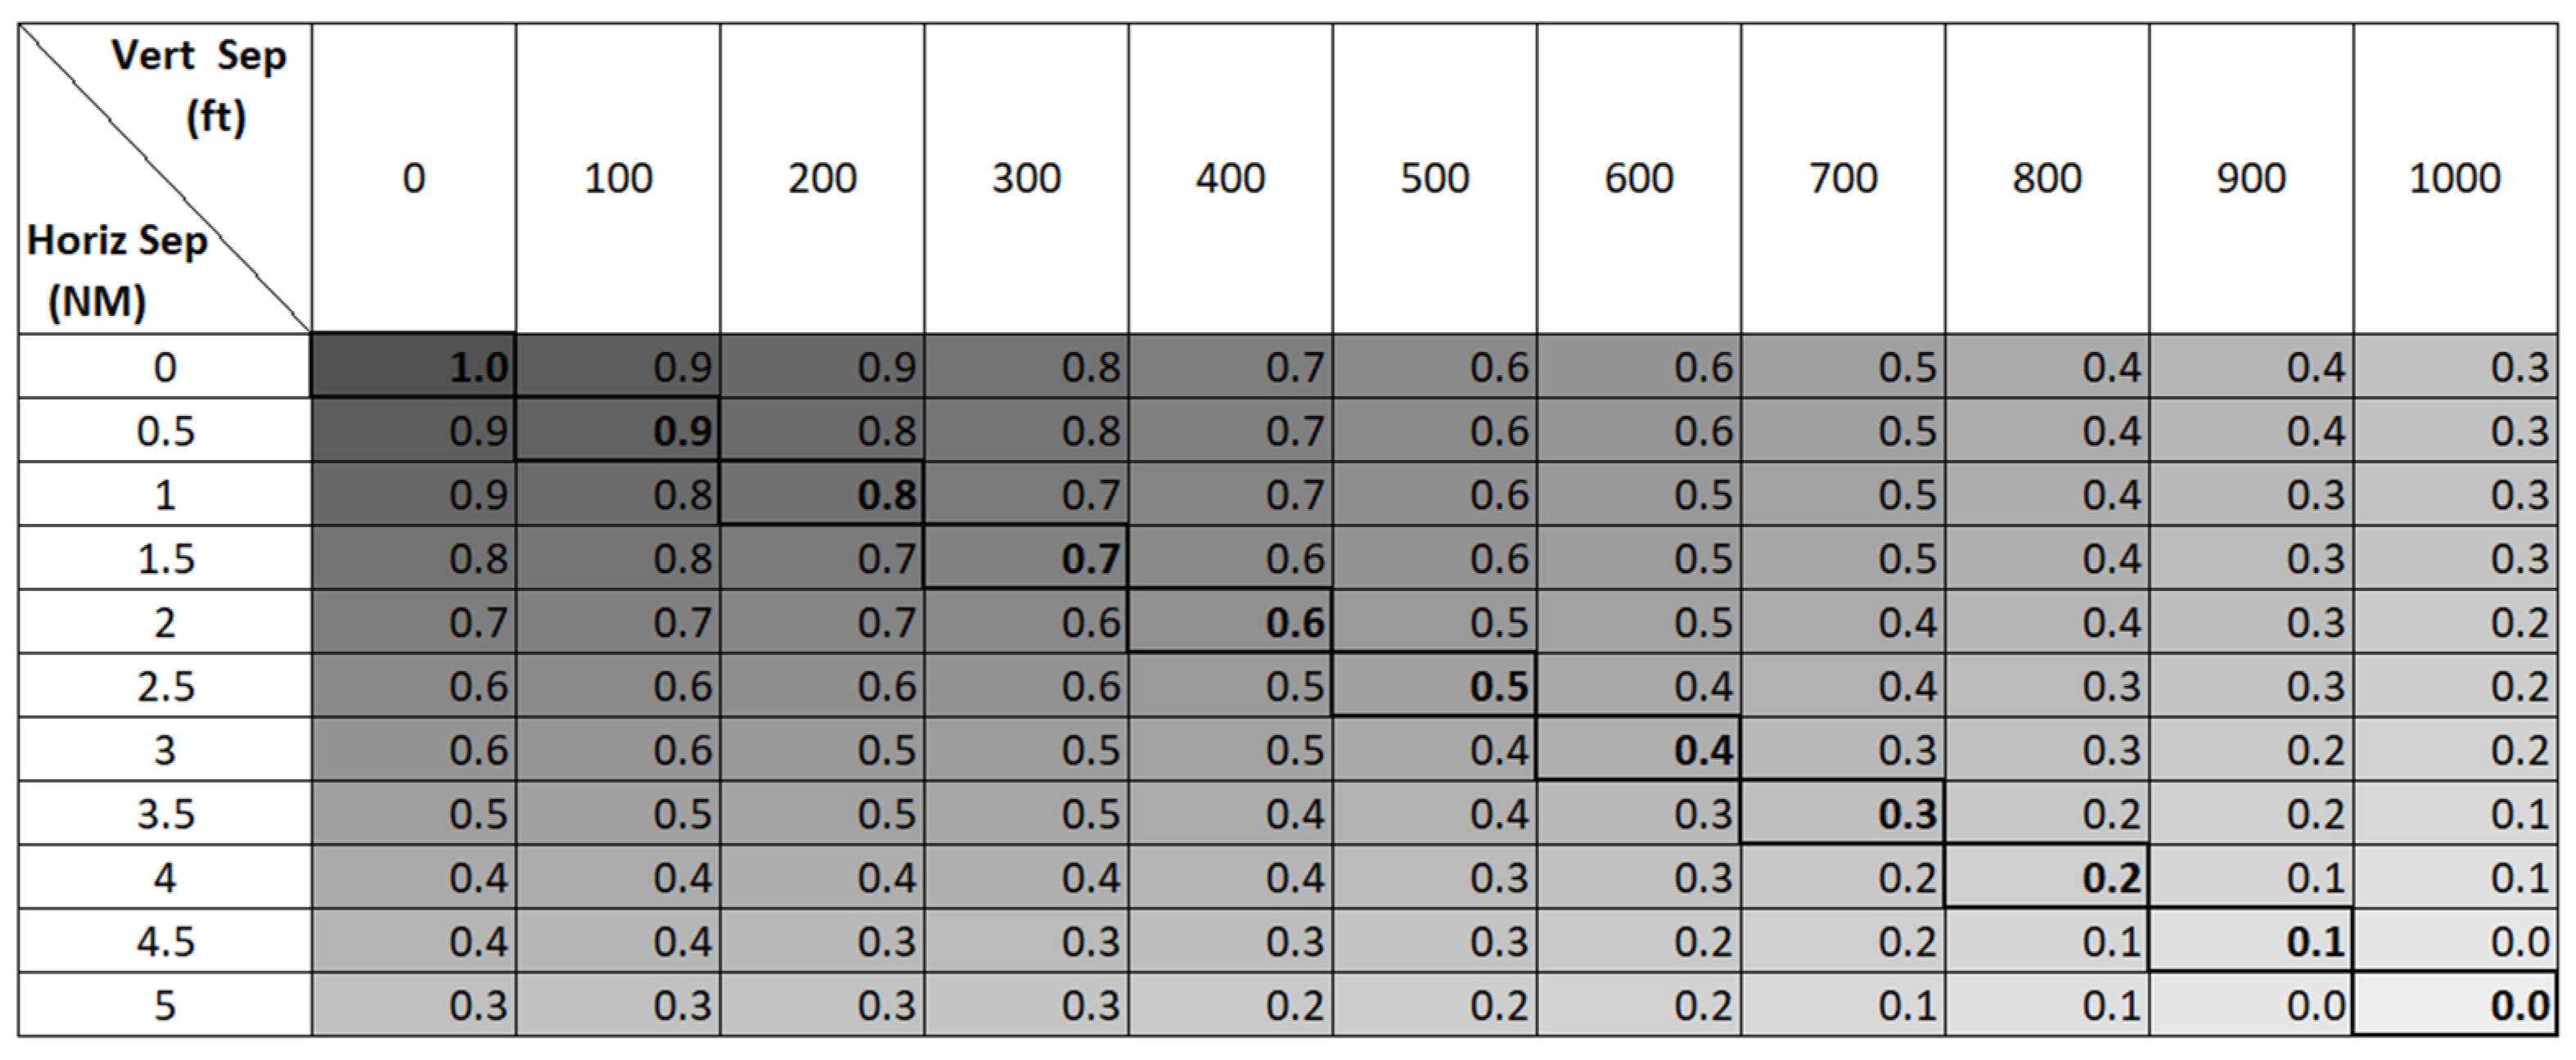
- LOS Criticality: metric related to the severity of the loss of separation. This variable refers to how close the LOS has come to being a collision. It is an indicator associated with the minimum horizontal and vertical separation reached in the conflict, with values ranging from 0 to 1. The steps followed for the definition of this metric were:
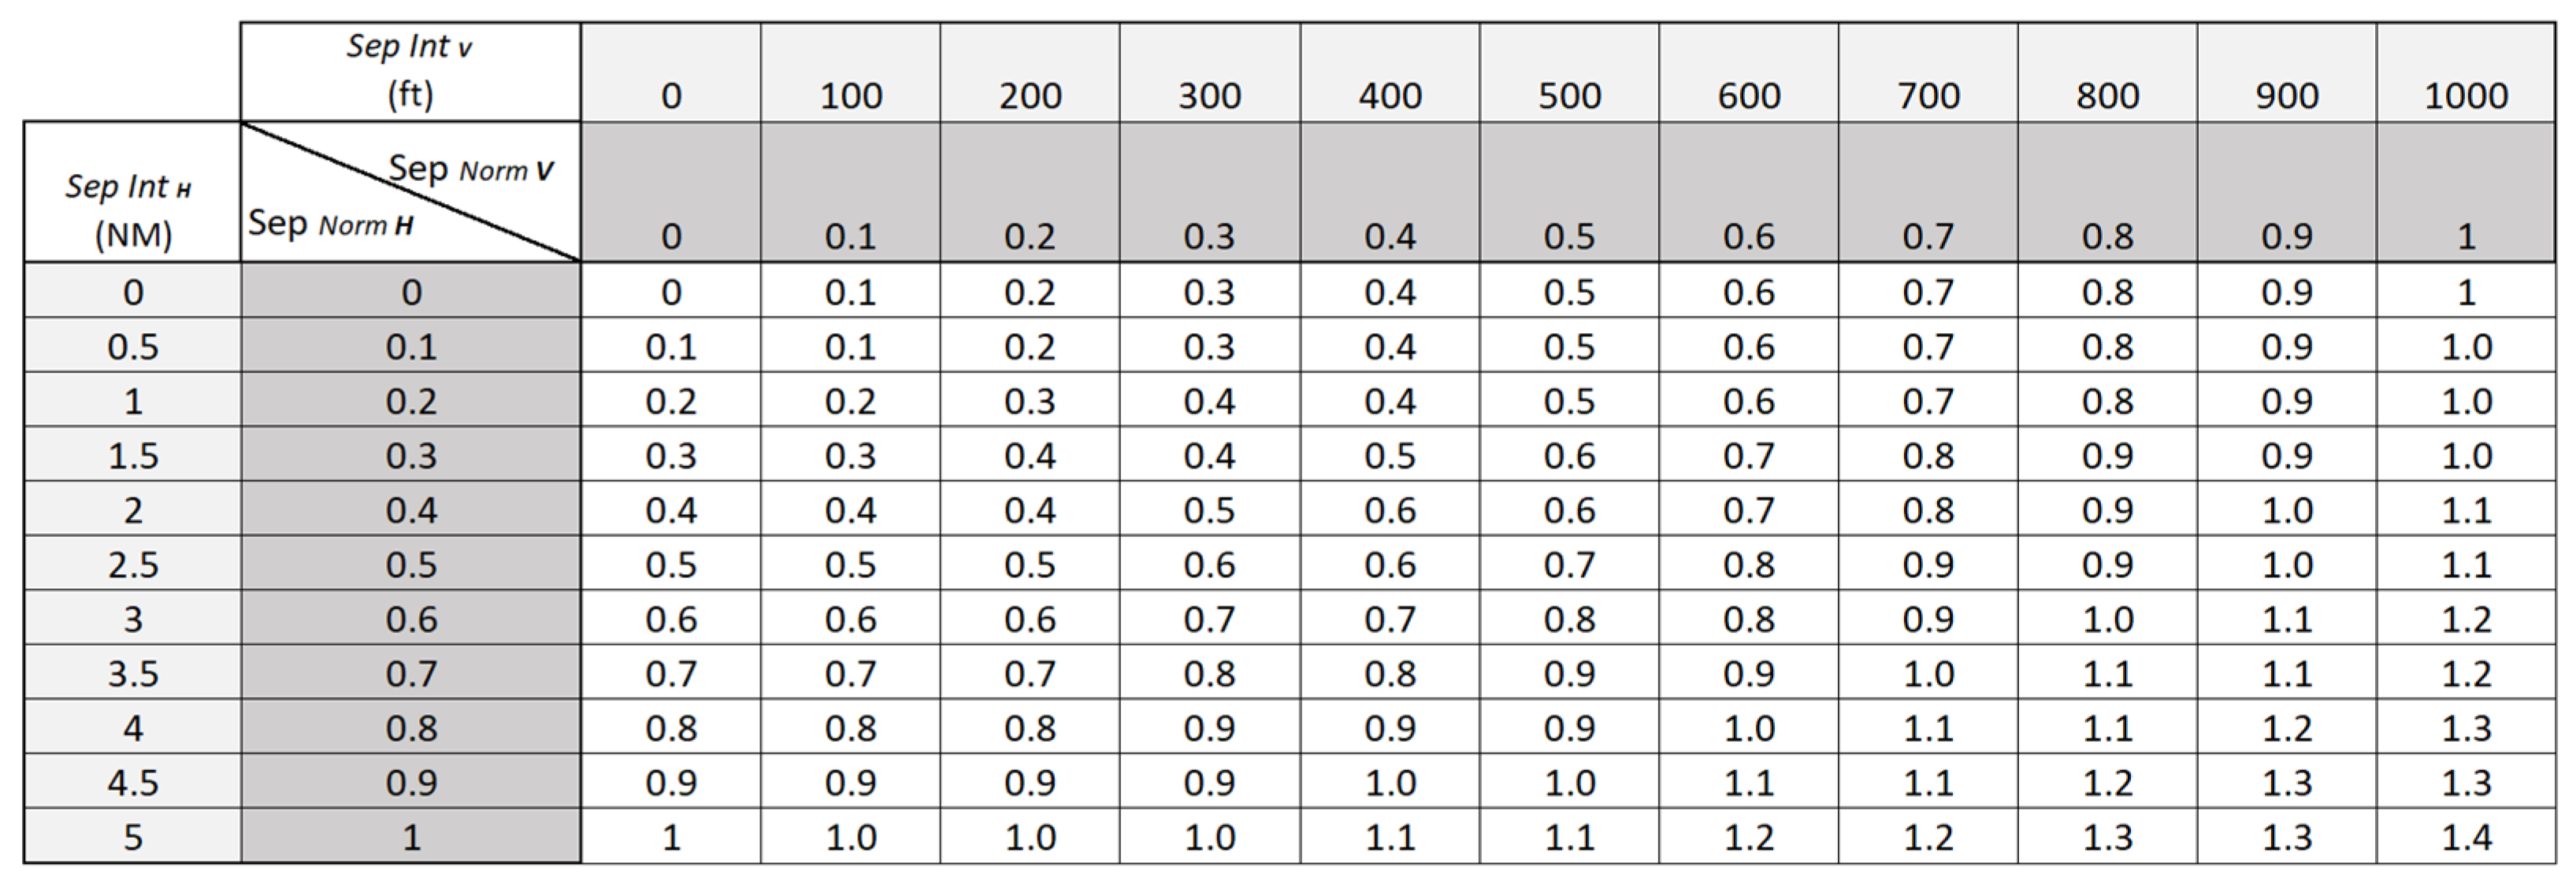
- Definition of ten equal length intervals in the ranges 0–5 NM and 0–1000 ft. The lower limit of the range refers to the distance of 0 (NM or ft) between aircraft (collision) while the upper limit corresponds to the separation minima values in the horizontal (5 NM) and vertical (1000 ft) dimensions for en-route airspace. In the horizontal dimension the intervals are in 0.5 NM increments, while in the vertical dimension they are 100 ft.
- Normalization (scale of 0–1) of the horizontal intervals () and vertical intervals () (Equation (1)).where:= upper limit value of the interval (first column of Figure 4) in the horizontal dimension.= upper limit value of the interval (first row of Figure 4) in the vertical dimension.Separation minima in the horizontal dimension (5 NM).Separation minima in the vertical dimension (1000 ft).
- Calculation of the oblique distance, from Equation (2), between the values obtained in the previous step. These values are shown in Figure 4.
- The criticality array is obtained by normalizing the array obtained in step 3 (since the highest value is 1.4 (), this is the one used for normalization) and subtracting unity from all values, according to Equation (3).where:= obtained in the previous step1.4 = value used to normalize the array, as a result of
Major − [0.30, 0.49] Catastrophic − [0.70, 1.00]
2.2.2. Exploratory Data Analysis
- Study of the frequency of the states of some variables
- Temporal and spatial distribution of incidents
- Incident analysis by sector in the studied ACCs
- Analysis of incident encounter geometry
2.3. Building the Bayesian Network (BN)
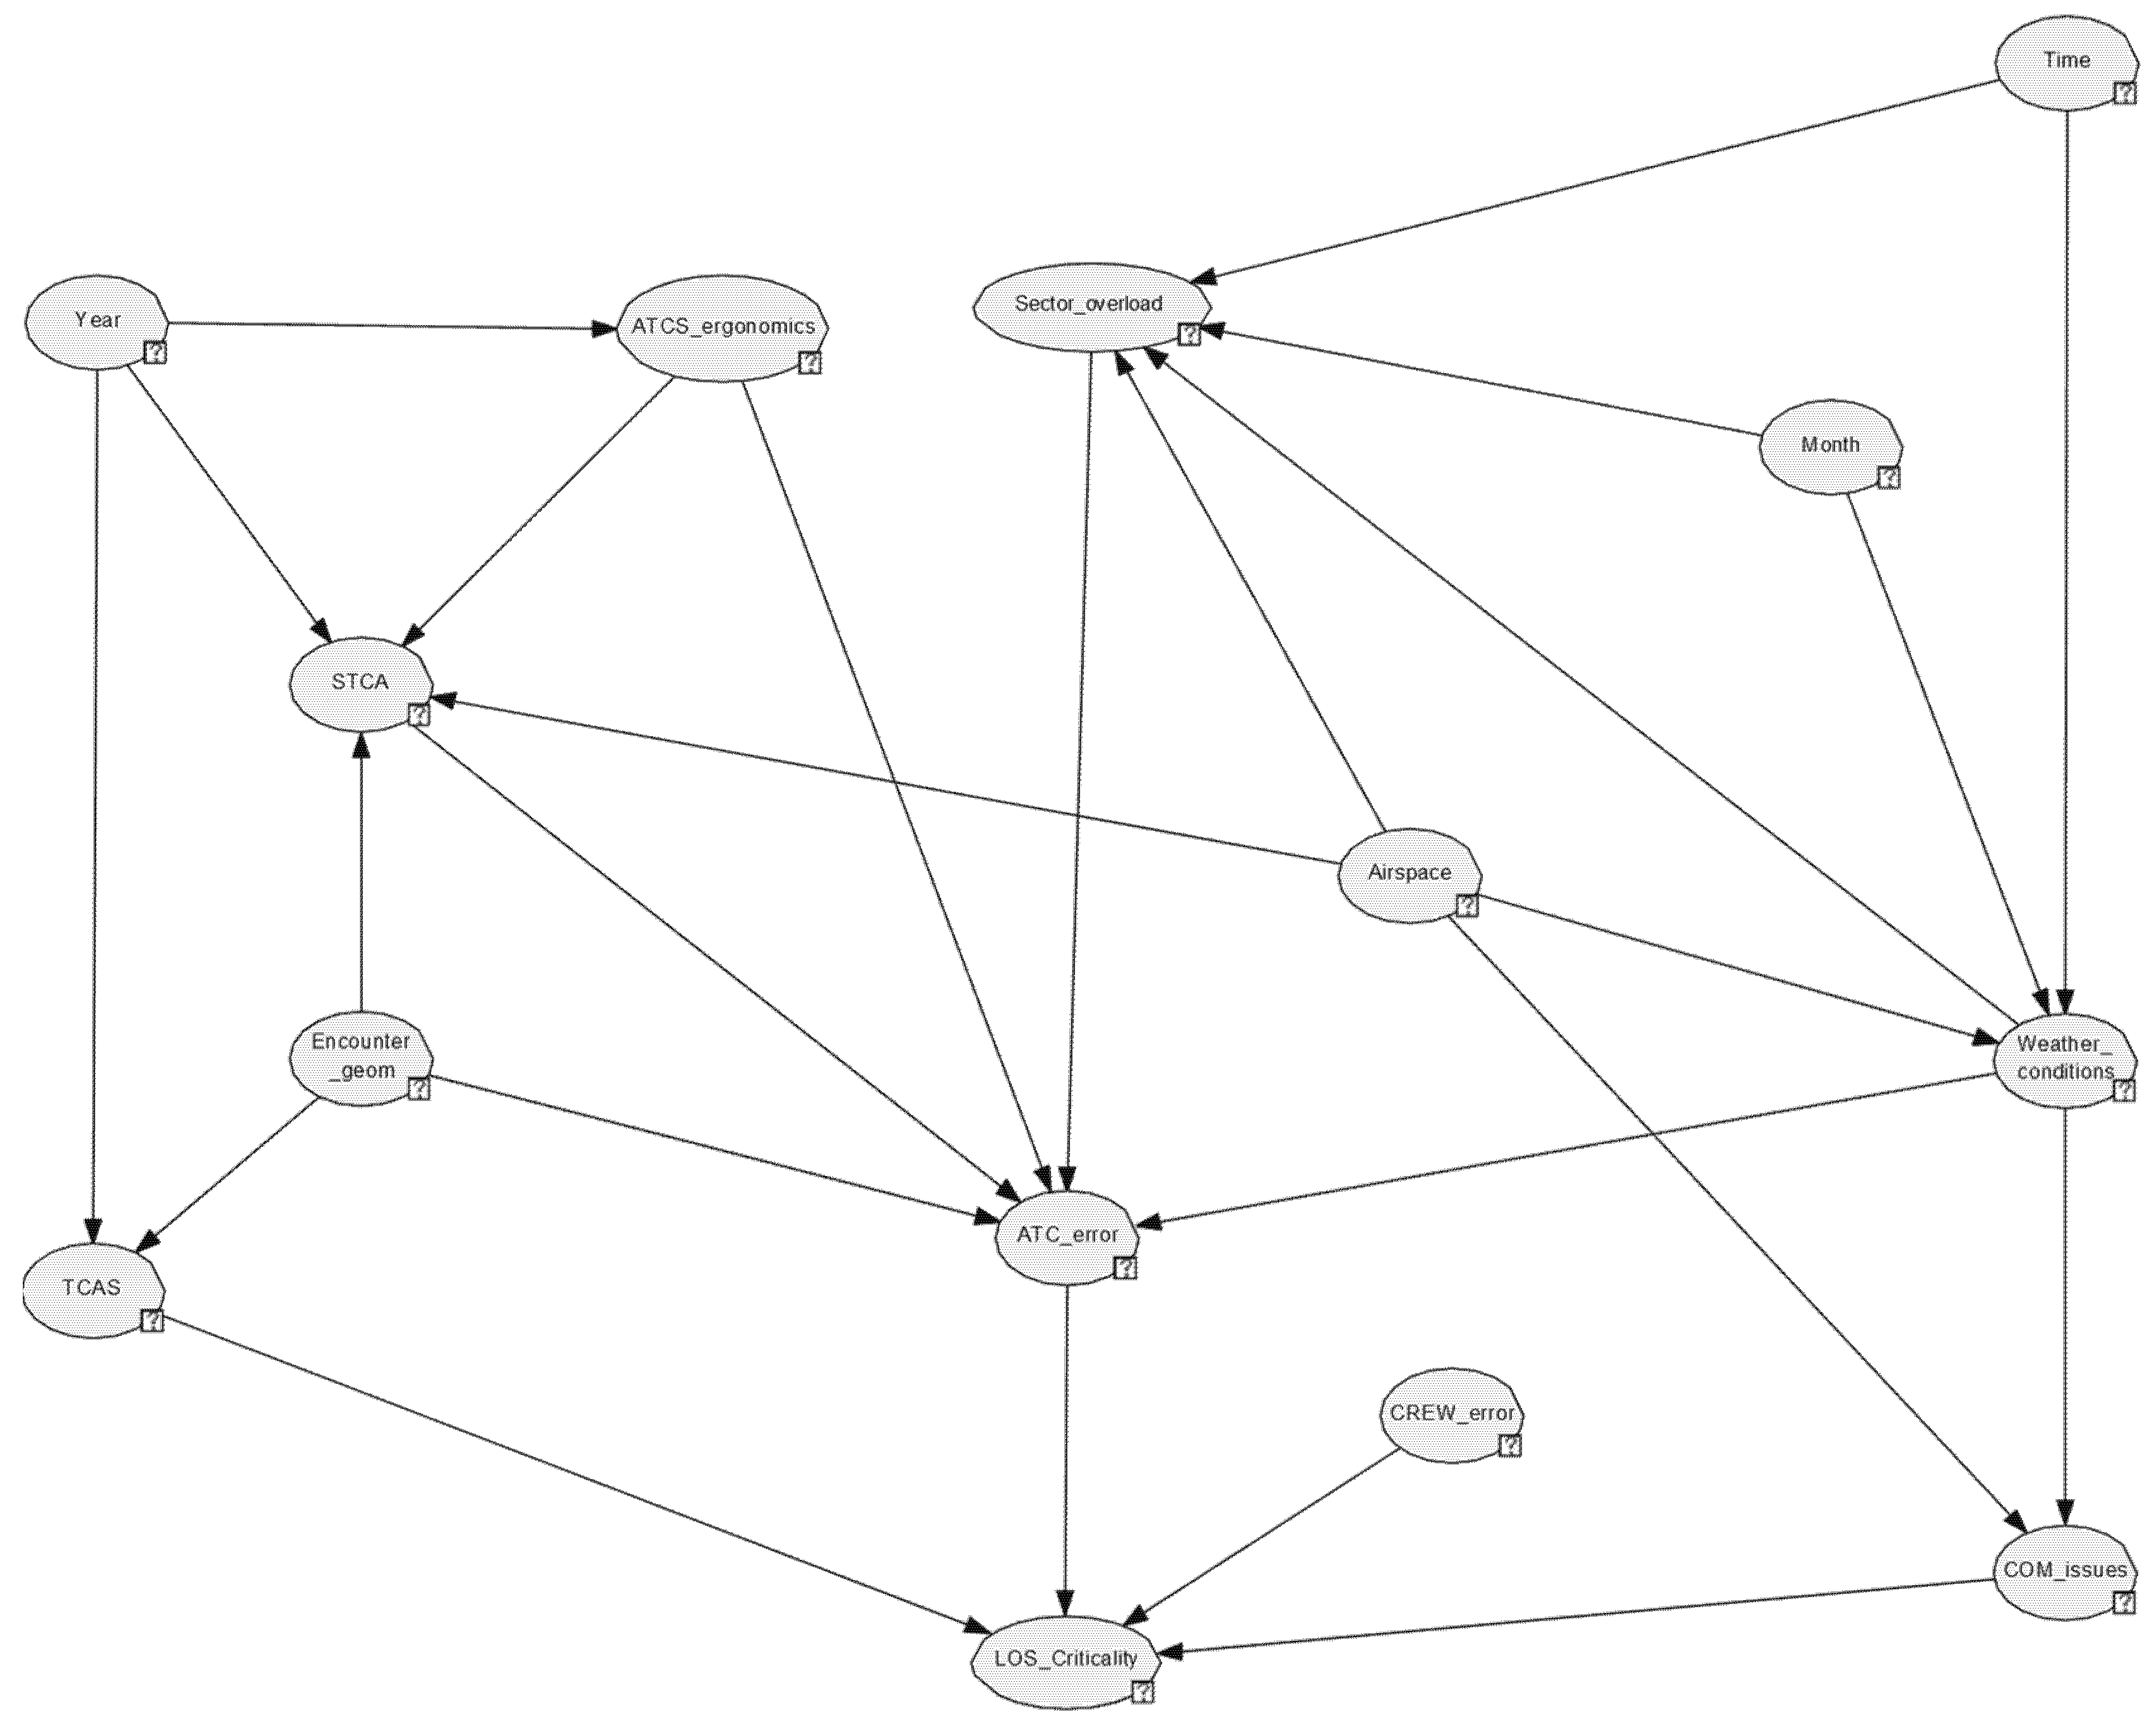
- Expert-based structure building provides the identification of all variables and causal correlations between them, as well as their states, that can be taken. Based on the identification of the variables by the experts, the list of research variables defined in the previous section is generated. This means that a part of the research variables has been obtained directly from the incident reports, and other variables, such as those related to Human Errors or LOS Criticality, have been identified or generated by expert knowledge. The identification of the causal correlation by expert knowledge among defined research variables has been considered a fundamental step for posterior Bayesian Network building in GeNIe software [30], particularly in definition of the BN architecture. This identification process has been repeated several times until the experts removed the inconsistencies and discrepancies, as explained in [9,29]. From this step, 14 variables have been considered relevant for the model building. Table 7 shows, in summary form, for each variable chosen as a node in the model, the number of states and their descriptions. As a result, the Bayesian Network structure was built as shown in Figure 8.
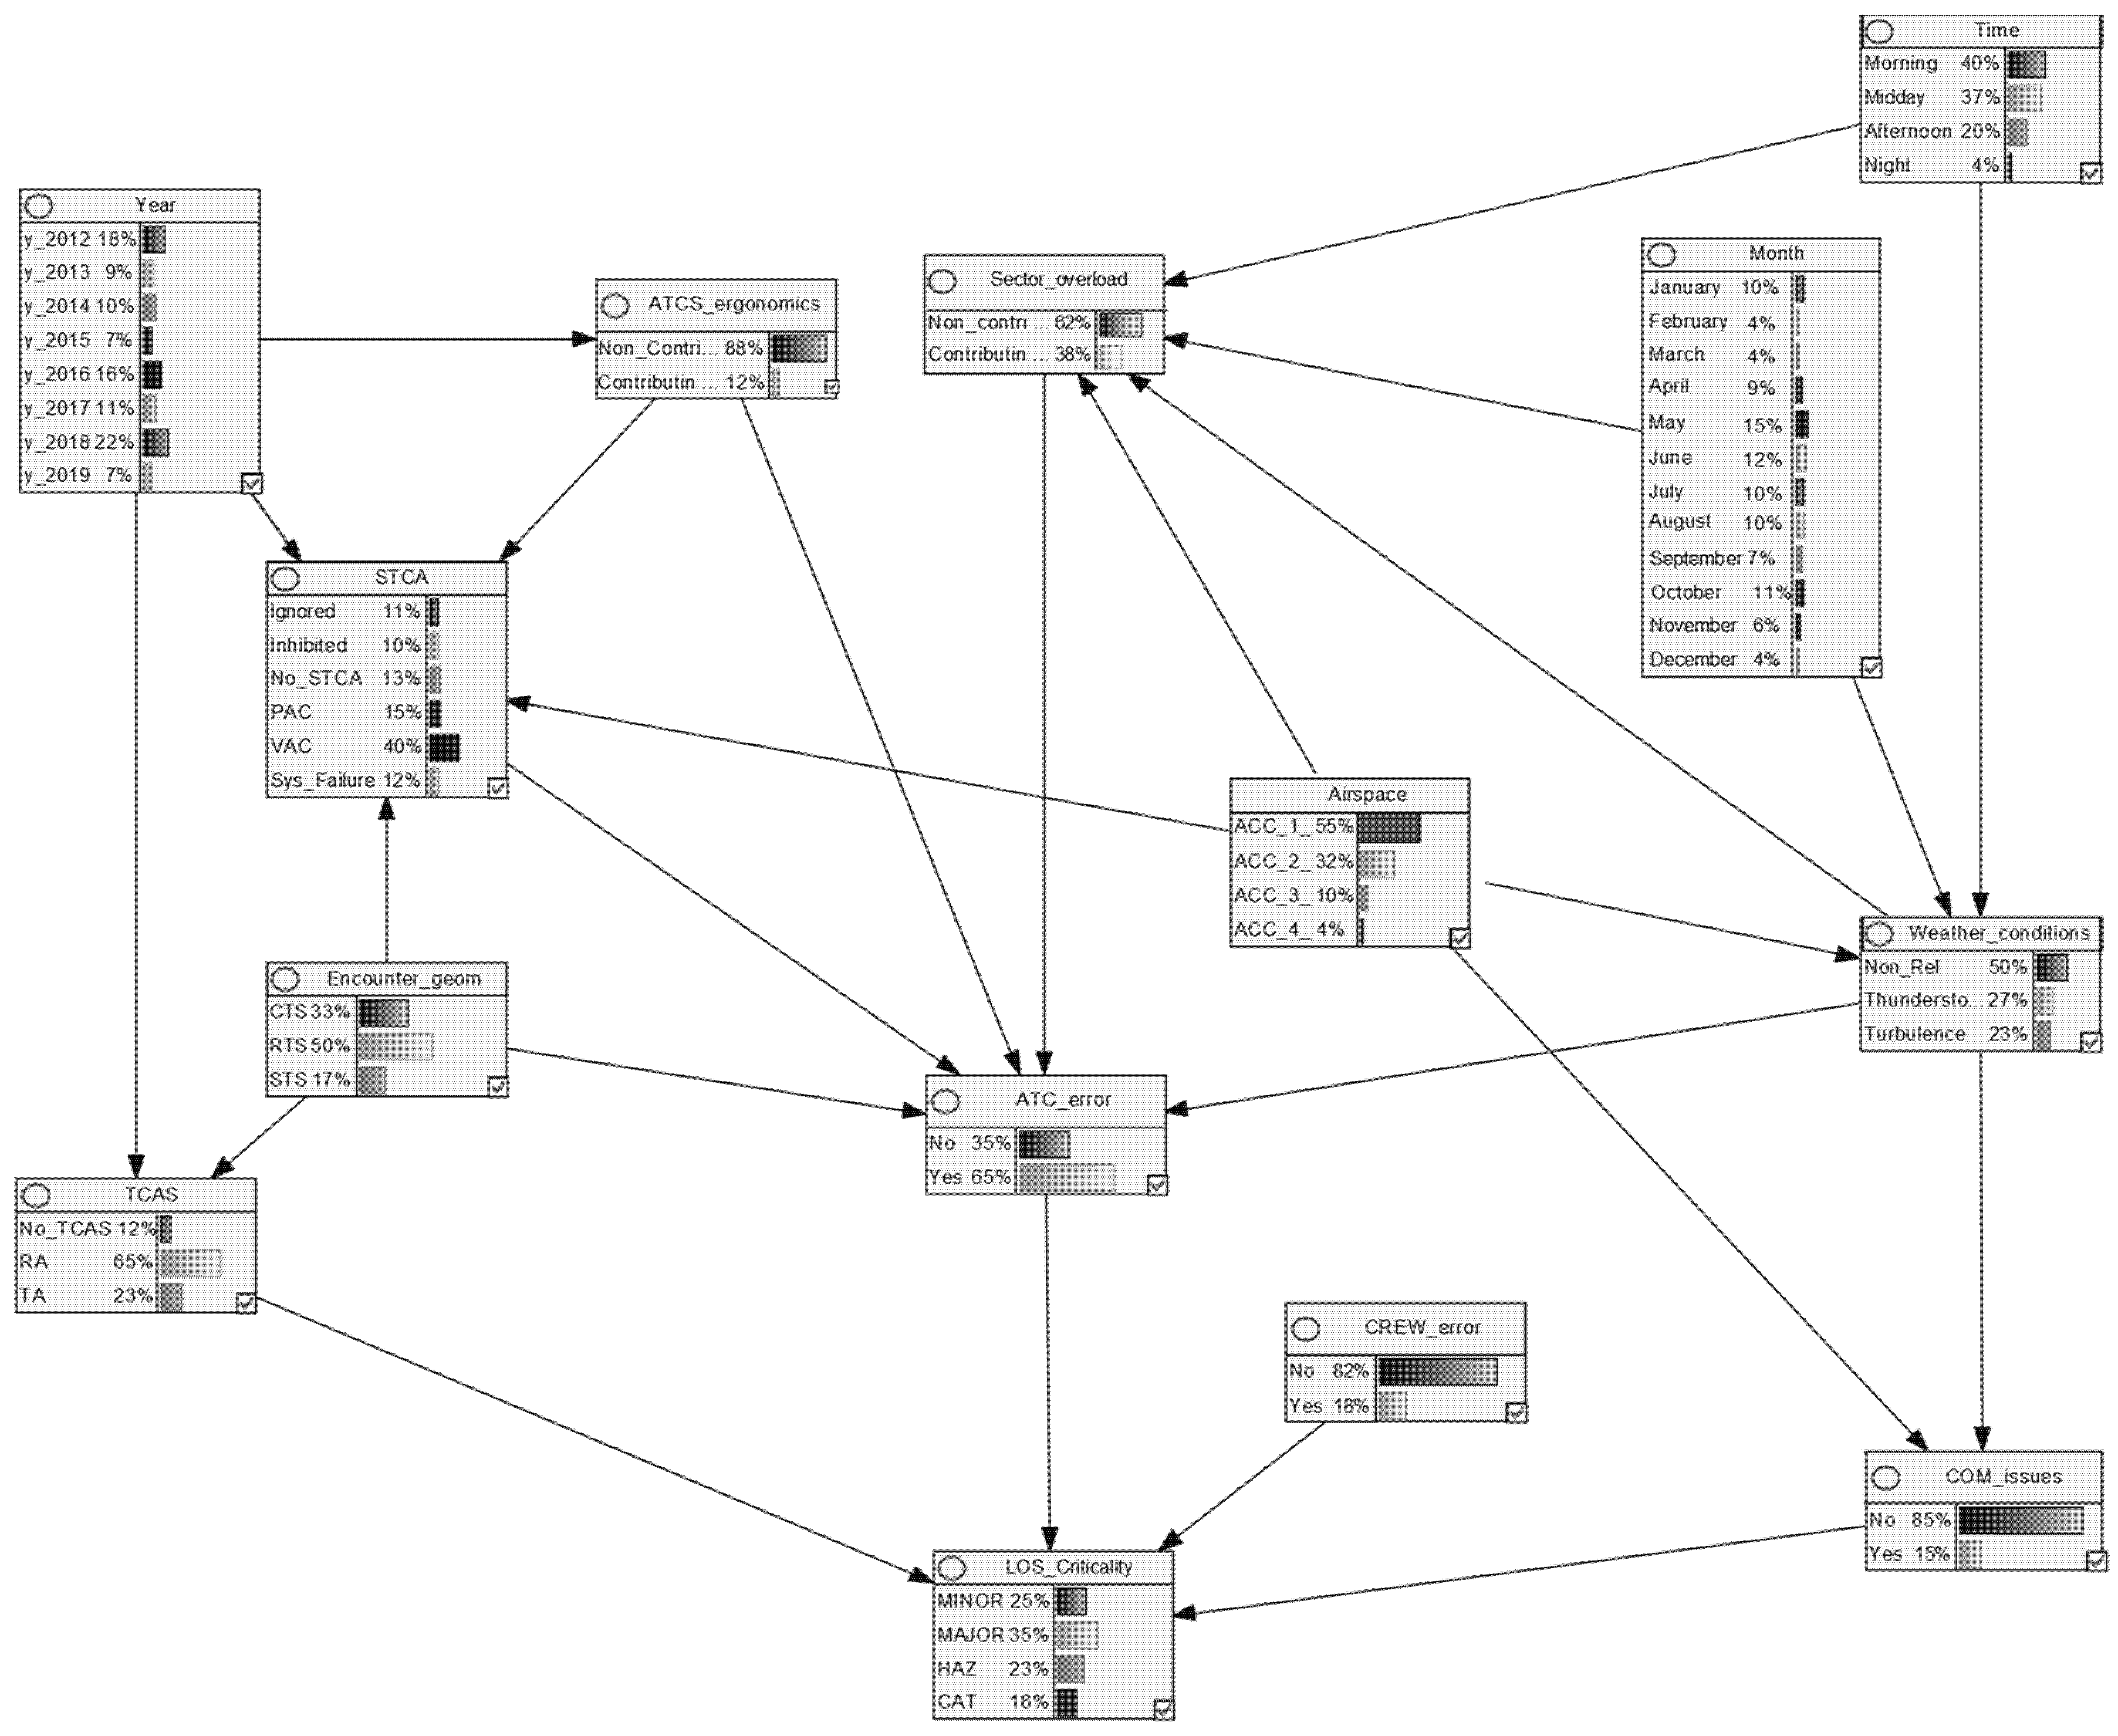
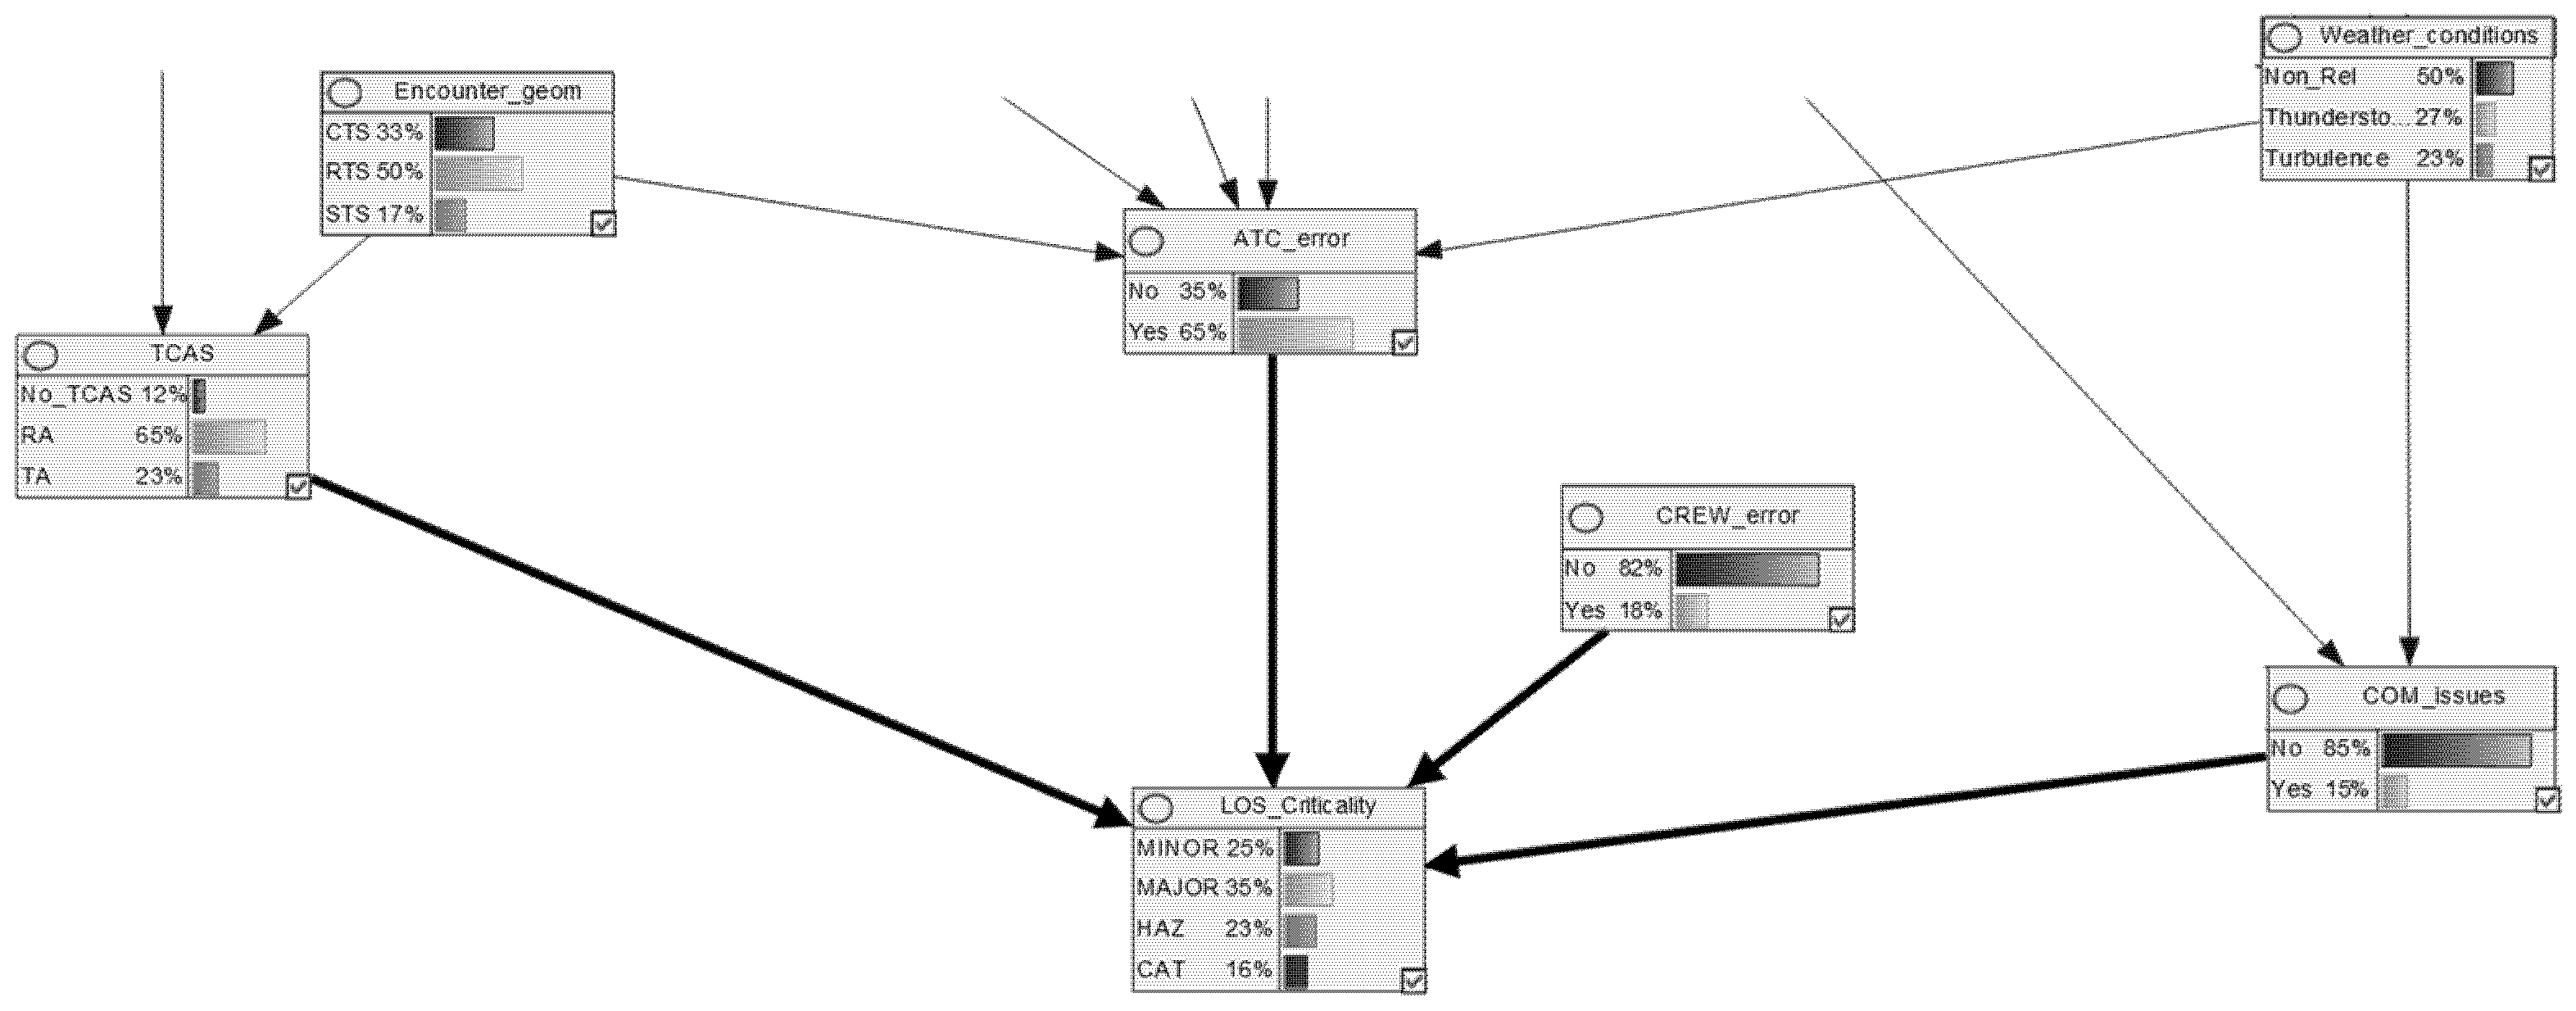
- Incidents database feeding uncertainty quantification basically deals with the Conditional Probability Tables (CPT) estimation combining incidents database with expert-based BN architecture approach. In contrast to other similar research works like [31,32,33], this CPT estimation has proceeded directly with the incidents database applying the Bayesian Search algorithm provided in GeNIe. The algorithm follows essentially a hill climbing procedure (guided by a scoring heuristic, which in GeNIe is the log likelihood function) with random restarts [34]. The estimated BN, which depicts the nodes, their levels and probabilities, is shown in Figure 9.
2.4. Model Validation
- (1)
- Test only validation for expert-based and data-driven consistency in the BN model.
- (2)
- Expert-based final validation.
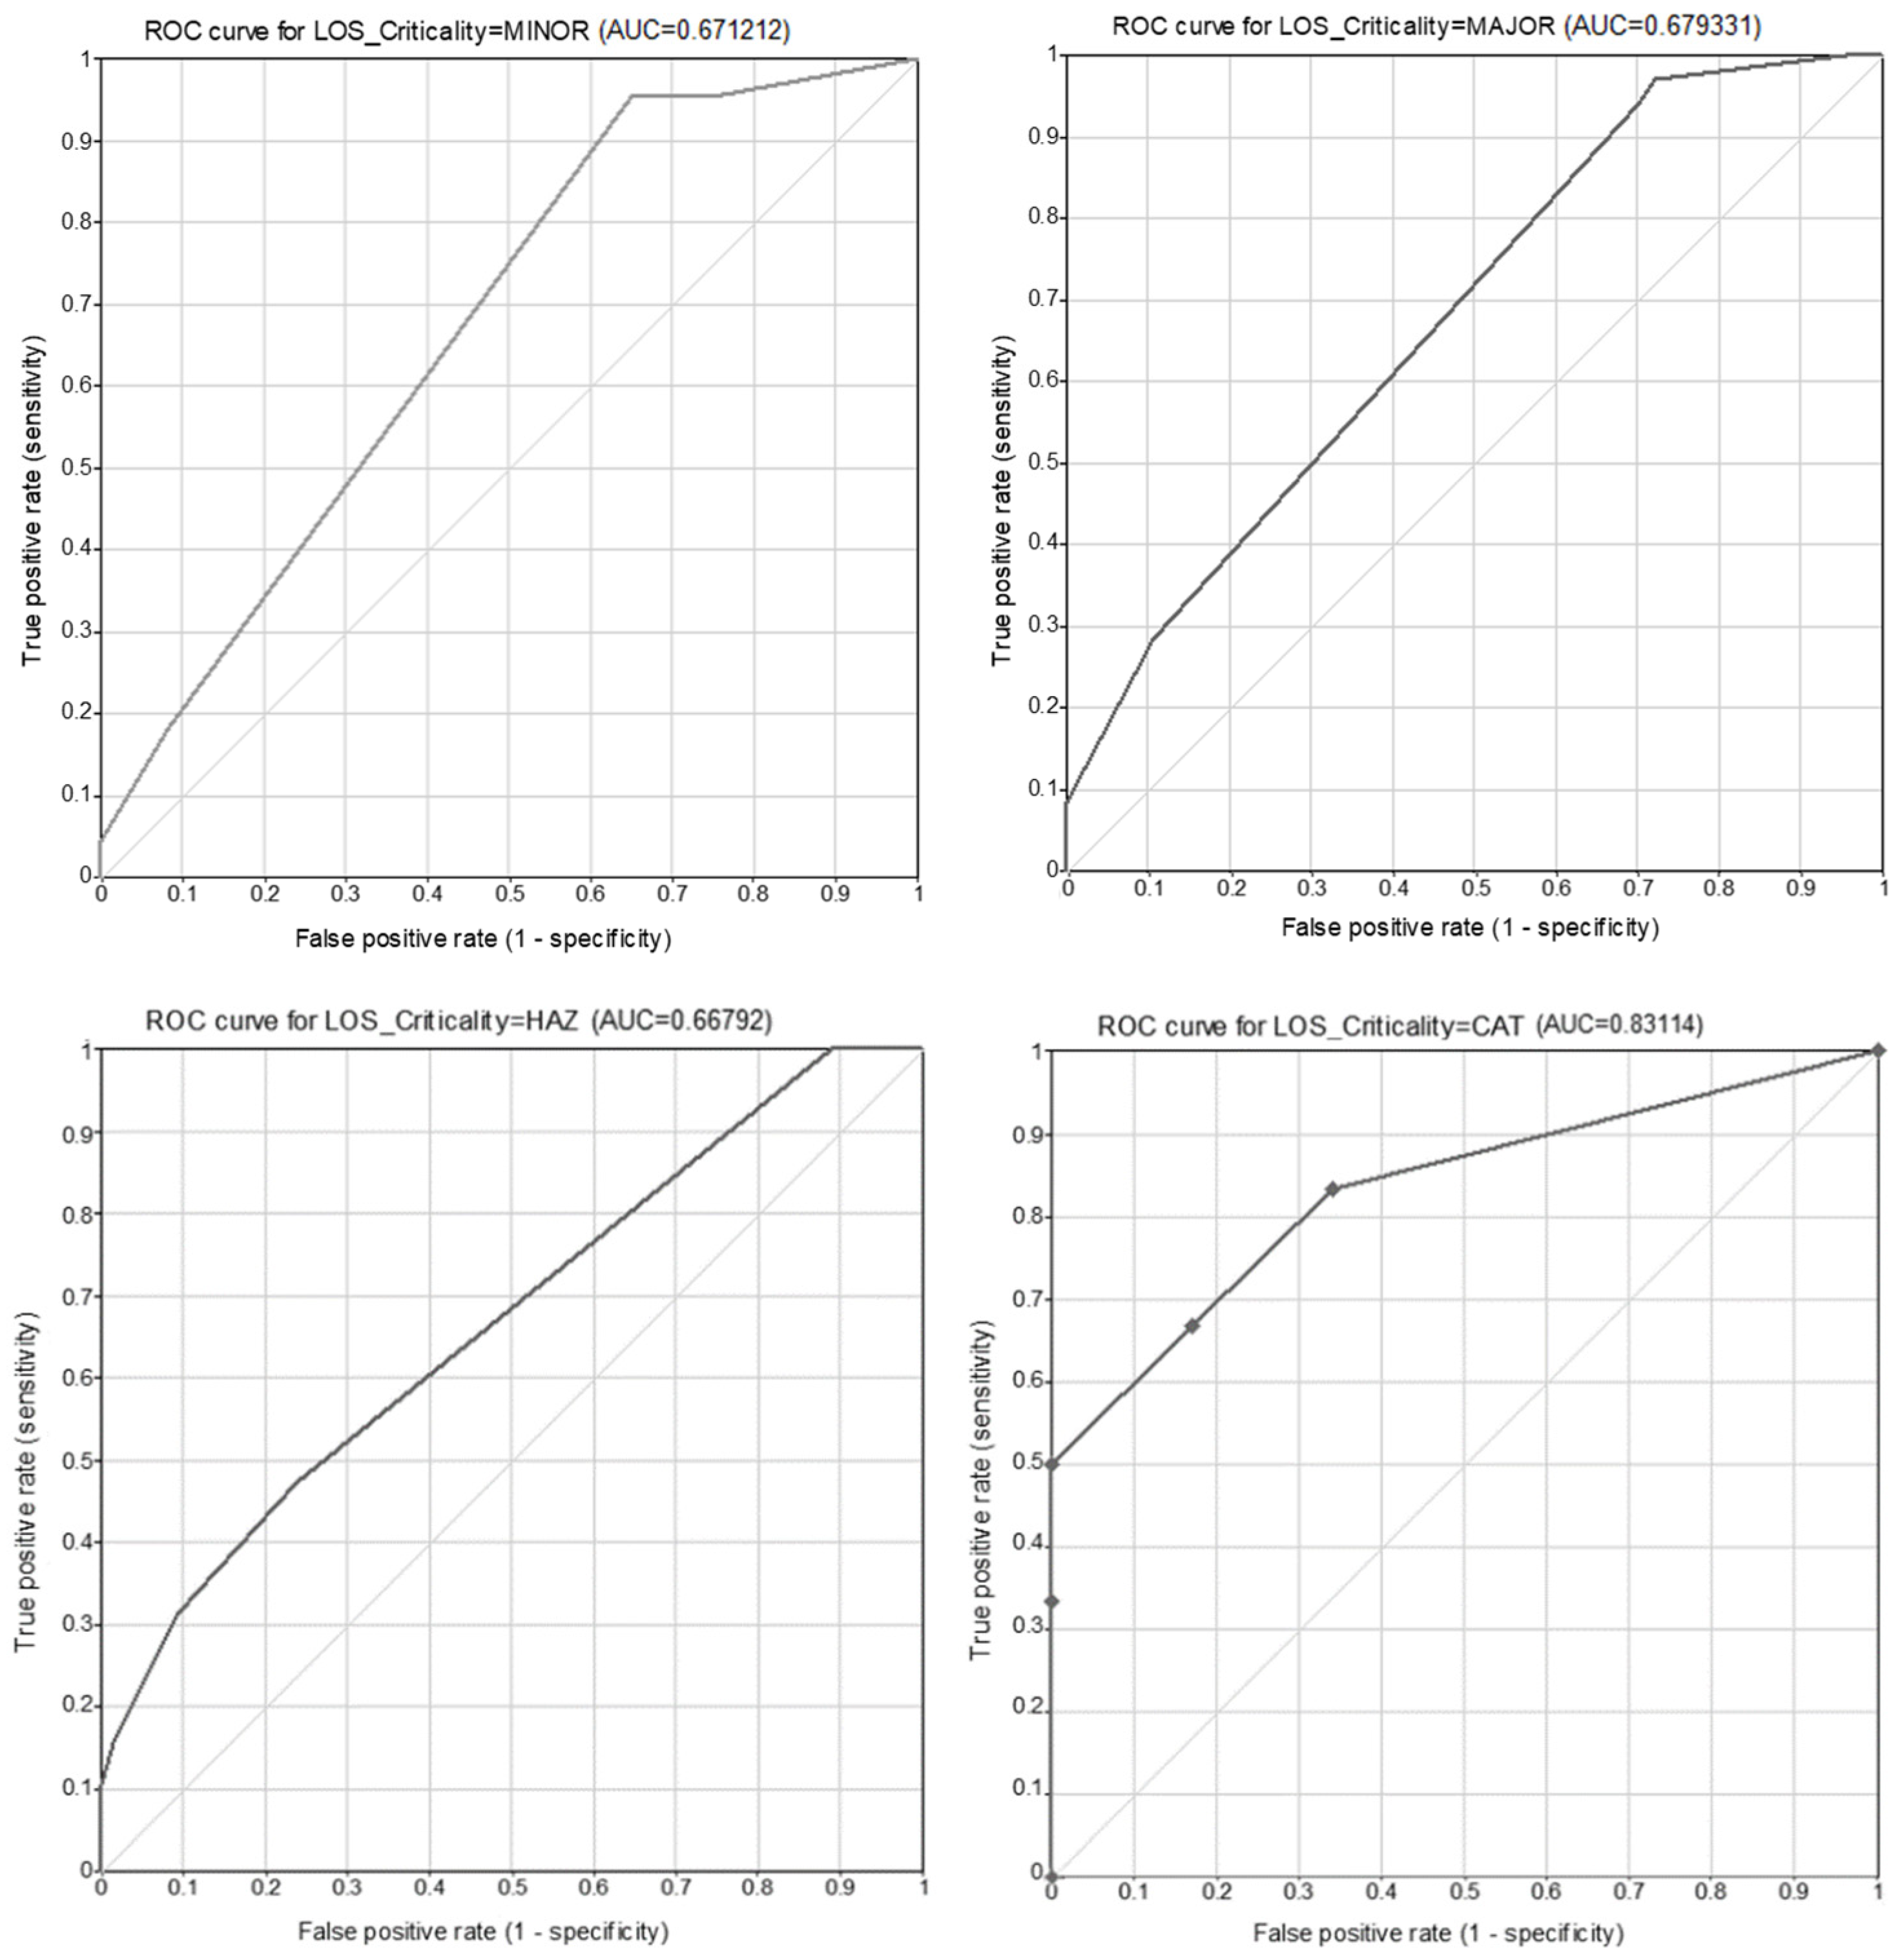
- Test only validation is a GeNIe software algorithm used specifically to validate expert-based BN models [30,34]. Particularly, this method has been applied to the BN model in order to check the consistency between expert-based architecture and data-driven modelling results. Receiver Operating Characteristic curve (ROC) and the Area Under the ROC Curve (AUC) in the target variable (LOS_Criticality) have been calculated to assess the accuracy of this consistency.In BN, the ROC curves are generally used to depict the model performance [35]. A ROC curve is a graphical tool defined by True Positive Rate (TPR, also called sensitivity) on the vertical axis and the False Positive Rate (FPR, also called specificity) on the horizontal axis. The TPR (Equation (6)) is defined as the ratio between the total number of correctly identified positive cases (True Positive, TP) and the total number of positive cases (True Positive (TP) + False Negative (FN)), while the FPR (Equation (7)) is defined as the ratio of the total number of negative cases incorrectly identified as positive cases (False Positive, FP) and the total number of negative cases (False Positive (FP) + True Negatives (TN)). The results obtained from validating the model are shown in Figure 10.It is observed that the highest AUC value is obtained for the CAT (Catastrophic) state of the target variable. This state is the critical one (representing the transition from a LOS scenario to a MAC scenario); its value is close to 0.85, while for the rest of the states the AUC value is close to 0.7. According to [36,37], these scores are high (around 70~80%). This check result shows the high consistency between expert knowledge and data-driven for the CAT state, which allows us to better understand which factors contribute to a more critical incident (near-collision). And, ultimately, based on this information it is possible to exclude the irrelevant factors and to prioritize future work on the most important ones in order to increase ATM safety.
- Expert-based final validation consists of the validation of BN architecture (previous to applying the incidents database for CPT estimation) and the verification of the BN model once the Test only validation is concluded.The validation of BN architecture has been concluded as the last step of expert-based structure building described previously. Rather than an isolated validation process, it has been performed as part of the BN structure building process. The experiences of aeronautical engineers, pilots and air traffic controllers aided in achieving this definitive BN architecture.In addition to the validation of the model with the specific functionality of the software, expert verification has been applied to the results obtained, which will be presented in the following section. Since the results obtained from the model are consistent with the expectations of the experts, it is possible to validate the model on the basis of these results.
3. Results
- From the data analysis it is noteworthy that the probability of the LOS occurrence is proportional to the traffic volume density, as expected. The results show that probability of LOS per movement is greater in those ACC with more traffic. The highest number of LOS took place during the summer season when traffic volume reaches its peak value, according to EUROCONTROL statistics [25]. On the daily time horizon, LOS likelihood is higher in the morning and midday periods (almost 80% of LOS) when the traffic volume far exceeds those of the afternoon and night. Such data were provided by EUROCONTROL AIRAC publications and were visualized in NEST.
- In relation to the target node, by setting the evidence in each of its states it is possible to know the contributing factors to minor, major, hazardous and catastrophic criticality of LOS. It can be shown that the probability of an incident occurring as a result of ATC error is much higher than due to crew error or communications issues in each scenario (Minor, Major, Hazardous and Catastrophic), as indicated in Table 8. Due to the BN characteristics and properties, these results must be interpreted independently for each scenario. Results obtained are in accordance with the roles established in a scenario with surveillance: the separation responsibility lies with the ATCo, while the crew is limited to executing the clearances issued by the ATCo. The probability of a LOS as a result of crew error or due to a communications issue is roughly similar, with the communications issues being slightly lower. However, these results need to be contextualized as they are events with a low probability of occurrence. The current ATM system architecture is configured in a way that minimizes system errors: redundancy of equipment, mandatory and recommended required performances, certification of equipment, certification of manufacturing companies, etc. Furthermore, it is worth considering that in this study, after analyzing the incidents that constitute the database, no variables relating to surveillance or navigation have been established because no technical errors in these systems have been found to have given rise to a LOS.
- Focusing on the above contributing factors (setting evidence on ATC_error, CREW_error and COM_issues), it is possible to know the probability of different LOS Criticality scenarios as a consequence of them and the rest of the network. As can be seen (Table 9), when an ATC error takes place, the LOS criticality generally has a low probability of being catastrophic. However, when a crew error or communication failure takes place, the LOS criticality is slightly more severe (hazardous and catastrophic). Therefore, it can be stated that the probability of ATC error is more frequent, but its criticality is generally less severe in comparison with other contributing factors. From all these probabilistic results it can be concluded that the influence of technical means is negligible. Therefore, mitigating measures to reduce the risk of a MAC should focus on the human factor, and particularly on ATC.
- The BN model shows the relation between weather conditions, communication issues and sector overload and the influence on ATC performance. When there are storms or turbulence phenomena, there are, generally, congestion problems; aircraft deviate from their planned routes, producing an overload in certain areas of the sector. Therefore, there is an overload of communications. In these situations, it is observed that while the probability of communications issues increases considerably (compared to when there are no relevant weather phenomena), and the probability of sector overload increases considerably, ATC error decreases moderately (Table 10). This contrast occurs especially with the occurrence of turbulence. Contrary to what might be expected with respect to ATC error, the model shows that it seems that ATCos perform better when the situation is more adverse, with the probability of a LOS as a result of the ATC error being lower than in ordinary situations, where overconfidence may occur. Expert opinion (ATCos and flight crews) confirmed that the most demanding scenarios require maximum concentration, thus reducing the probability of error. Therefore, on the basis of these model results, possible safety-enhancing measures should be aimed at encouraging the human factor during the working period, and during normal situations to try to pay more attention and to maintain it during the working time.
- Regarding the STCA, it is observed that when the system issues the VAC alarm on the ATCo display the probability of a catastrophic criticality LOS is lower than when this alarm is not issued. Moreover, the probability of failure of STCA alerting a LOS increases considerably (more than 20%) when the factor of the ergonomics of the Automated Air Traffic Control System is present. As explained above, the ergonomics factor refers to the range of colors in which information is presented in the Automated Air Traffic Control System. However, indirectly this factor refers to the transfer of aircraft between sectors. Therefore, what is highlighted in the relationship between these two nodes is that, on the basis of the STCA functionality, it seems that when aircraft are transferred to other sectors, the STCA does not always detect that a LOS may occur between an assumed aircraft and a transferred aircraft (which is still flying within the boundaries of the sector under consideration). Therefore, the system does not alert controllers of the conflict. This result is consistent with the development of the STCA that, in some versions, it does not detect LOS between aircraft assumed by nearby control sectors. Not all ANSPs have the same support systems or the same degree of evolution in them. Therefore, this STCA limitation is a hot spot for the occurrence of aircraft separation losses in inter-sector coordination situations and may be considered by those ANSPs that do not have this system functionality as a mitigating measure for LOS occurrence. Technical reports from the ANSP managing the airspace where the incidents analyzed occurred have been investigated. These reports indicate that there was a system upgrade in 2020 by which this gap has been resolved. Therefore, this output validates the results emerging from the network for this node.
- Concerning the other safety net considered in this study and from the BN, it is observed (Table 11) that when the TCAS system issues a RA, the probability of occurrence of a catastrophic incident decreases considerably, by more than half, in comparison to when this anti-collision system does not issue any alert. The higher probabilities correspond to a lower criticality, which means that when the TCAS RA is activated, the separation breach is resolved correctly and promptly (without escalating to a more critical category). As expected, this result demonstrates that the TCAS system reduces the risk of MAC occurrence and demonstrates the effectiveness of this barrier. The activation of this system, in particular the resolution warning, implies a low probability that the LOS will be of catastrophic criticality.
4. Conclusions
Author Contributions
Funding
Conflicts of Interest
References
- ICAO. Doc.10004 Global Aviation Safety Plan 2020–2022. 2019. Available online: https://www.icao.int/safety/GASP/Documents/Doc.10004%20GASP%202020-2022%20EN.pdf (accessed on 23 May 2022).
- EASA. The European Plan for Aviation Safety (EPAS 2022–2026); EASA: Cologne, Germany, 2021. [Google Scholar]
- EASA. Annual Safety Review 2021; EASA: Cologne, Germany, 2021. [Google Scholar] [CrossRef]
- EUROCONTROL. ESARR 2. Reporting and Assessment of Safety Occurrences in ATM. 2009. Available online: www.eurocontrol.int/src (accessed on 13 May 2022).
- ICAO. Annex-13. Aircraft Accident and Incident Investigation; ICAO: Montreal, QC, Canada, 2016. [Google Scholar]
- EUROCONTROL. ESARR Advisory Material/ESSAR 2 Guidance to ATM Safety Regulations; Severity Classification Scheme for Safety Occurrences in ATM; EUROCONTROL: Brussels, Belgium, 1999; pp. 1–18. [Google Scholar]
- Ale, B.; Bellamy, L.; Cooke, R.; Duyvis, M. Causal model for air transport safety. Final. Rep. 2009, 1–277. Available online: http://repository.tudelft.nl/view/ir/uuid:e4c5e6b0-9e20-4e61-993e-1d9bd0e23d07/ (accessed on 17 April 2022).
- Ayra, E.S.; Insua, D.R.; Cano, J. Bayesian network for managing runway overruns in aviation safety. J. Aerosp. Inf. Syst. 2019, 16, 546–558. [Google Scholar] [CrossRef]
- Comendador, V.F.G.; Valdés, R.M.A.; Diaz, M.V.; Parla, E.P.; Zheng, D. Bayesian network modelling of ATC complexity metrics for future SESAR demand and capacity balance solutions. Entropy 2019, 21, 379. [Google Scholar] [CrossRef] [PubMed]
- Rodríguez-Sanz, Á.; Comendador, F.G.; Valdés, R.A.; Pérez-Castán, J.; Montes, R.B.; Serrano, S.C. Assessment of airport arrival congestion and delay: Prediction and reliability. Transp. Res. Part C Emerg. Technol. 2019, 98, 255–283. [Google Scholar] [CrossRef]
- Weibel, R.E.; Edwards, M.W.M.; Fernandes, C.S. Establishing a risk-based separation standard for unmanned aircraft self separation. In Proceedings of the 11th AIAA Aviation Technology, Integration, and Operations (ATIO) Conference, Virginia Beach, VA, USA, 20 September 2011; pp. 261–267. [Google Scholar]
- Kochenderfer, M.J.; Kuchar, J.K.; Espindle, L.P.; Griffith, J.D. Correlated Encounter Model for Cooperative Aircraft in the National Airspace System; MIT Lincoln Laboratory Report ATC-344; MIT Lincoln Laboratory: Lexington, MA, USA, 2008. [Google Scholar]
- Kochenderfer, M.J.; Kuchar, J.K.; Espindle, L.P.; Griffith, J.D. Uncorrelated Encounter Model of the National Airspace System; MIT Lincoln Laboratory Report ATC-345; MIT Lincoln Laboratory: Lexington, MA, USA, 2008. [Google Scholar]
- Brooker, P. Experts, Bayesian Belief Networks, rare events and aviation risk estimates. Saf. Sci. 2011, 49, 1142–1155. [Google Scholar] [CrossRef]
- Luxhøj, J.T.; Coit, D.W. Modeling low probability/high consequence events: An aviation safety risk model. In Proceedings of the RAMS’06. Annual Reliability and Maintainability Symposium, Newport Beach, CA, USA, 23–26 January 2006; pp. 215–221. [Google Scholar] [CrossRef]
- Pan, W.; Yang, C.; Shi, H. Research on Civil Aviation Emergency Decision-making Based on System Dynamics. Adv. Comput. Sci. Res. 2016, 58, 151–154. [Google Scholar] [CrossRef]
- Zhang, X.; Mahadevan, S. Bayesian network modeling of accident investigation reports for aviation safety assessment. Reliab. Eng. Syst. Saf. 2021, 209, 107371. [Google Scholar] [CrossRef]
- Valdés, R.M.A.; Cheng, S.Z.Y.L.; Comendador, V.F.G.; Nieto, F.J.S. Application of Bayesian networks and information theory to estimate the occurrence of mid-air collisions based on accident precursors. Entropy 2018, 20, 969. [Google Scholar] [CrossRef] [PubMed]
- Cheng, S.Z.Y.L.; Valdés, R.M.A.; Comendador, V.F.G.; Nieto, F.J.S. A case study of fishbone sequential diagram application and ADREP taxonomy codification in conventional ATM incident investigation. Symmetry 2019, 11, 491. [Google Scholar] [CrossRef] [Green Version]
- ICAO. Doc 4444. Air Traffic Management. PANS-ATM; ICAO: Montreal, QC, Canada, 2016. [Google Scholar]
- ICAO. Manual of Aircraft Accident and Incident Investigation Part IV-Reporting; ICAO: Montreal, QC, Canada, 2020. [Google Scholar]
- EUROCONTROL. Guidelines on the Systemic Occurrence Analysis Methodology (SOAM). Available online: https://www.eurocontrol.int/sites/default/files/2019-06/eam2-gui8-e1.0.pdf (accessed on 10 October 2021).
- Reason, J. Human Error; Cambridge University Press: Cambridge, UK, 1990. [Google Scholar]
- Licu, T.; Cioran, F.; Hayward, B.; Lowe, A. EUROCONTROL-Systemic Occurrence Analysis Methodology (SOAM)-A ‘Reason’-based organisational methodology for analysing incidents and accidents. Reliab. Eng. Syst. Saf. 2007, 92, 1162–1169. [Google Scholar] [CrossRef]
- EUROCONTROL. Data Statistics. Available online: https://ansperformance.eu/data/ (accessed on 29 May 2022).
- ISA Software. RAMS Plus—Gate-to-Gate ATM/Airport Fast-Time Simulator. Available online: https://www.ramsplus.com/ (accessed on 29 May 2022).
- EUROCONTROL. Network Strategic Tool (NEST). Available online: https://www.eurocontrol.int/model/network-strategic-modelling-tool (accessed on 30 May 2022).
- Pearl, J. Causal inference in statistics: An overview. Stat. Surv. 2009, 3, 96–146. [Google Scholar] [CrossRef]
- Mendes, E. Expert-Based Knowledge Engineering of Bayesian Networks. Pract. Knowl. Represent. 2014, 1, 73–105. [Google Scholar] [CrossRef]
- BayesFusion, LLC. GeNIe Modeler. 2022. Available online: https://www.bayesfusion.com/genie/ (accessed on 27 April 2022).
- Stroeve, S.H.; Som, P.; Van Doorn, B.A.; Bakker, G.J. Strengthening air traffic safety management by moving from outcome-based towards risk-based evaluation of runway incursions. Reliab. Eng. Syst. Saf. 2016, 147, 93–108. [Google Scholar] [CrossRef]
- Hänninen, M. Bayesian networks for maritime traffic accident prevention: Benefits and challenges. Accid. Anal. Prev. 2014, 73, 305–312. [Google Scholar] [CrossRef] [PubMed]
- Hänninen, M.; Valdez Banda, O.A.; Kujala, P. Bayesian network model of maritime safety management. Expert Syst. Appl. 2014, 41, 7837–7846. [Google Scholar] [CrossRef]
- BayesFusion, LLC. GeNIe Modeler User Manual. Version 3.0.R2. 2020. Available online: https://support.bayesfusion.com/docs/ (accessed on 27 August 2021).
- Sevinc, V.; Kucuk, O.; Goltas, M. A Bayesian network model for prediction and analysis of possible forest fire causes. For. Ecol. Manag. 2020, 457, 117723. [Google Scholar] [CrossRef]
- Pan, Q.; Tezuka, T. Prior Knowledge on the Dynamics of Skill Acquisition Improves Deep Knowledge Tracing. In Proceedings of the Proceedings of the 29th International Conference on Computers in Education, Bangkok, Thailand, 22–26 November 2021; Volume 1, pp. 201–211. [Google Scholar]
- Bradley, A.; Van der Meer, R.; McKay, C.J. A prognostic Bayesian network that makes personalized predictions of poor prognostic outcome post resection of pancreatic ductal adenocarcinoma. PLoS ONE 2019, 14, e0222270. [Google Scholar] [CrossRef] [PubMed] [Green Version]


| Airspace | Average Flight Time (min) | No. of Flights (2012–2019) | Flight Time (2012–2019) (h) | No. of LOS | Odds (LOS/Flight) | Odds (LOS/Flight Hour) |
|---|---|---|---|---|---|---|
| ACC 1 | 27.8 | 8,144,489 | 3,773,613 | 45 | ||
| ACC 2 | 19.9 | 6,852,789 | 2,272,841 | 26 | ||
| ACC 3 | 22.8 | 2,893,771 | 1,099,632 | 8 | ||
| ACC 4 | 18.7 | 2,452,293 | 764,297 | 3 |
| Airspace | Frequency | % |
|---|---|---|
| ACC 1 | 45 | 54.8 |
| ACC 2 | 26 | 31.7 |
| ACC 3 | 8 | 9.8 |
| ACC 4 | 3 | 3.6 |
| Encounter Geometry | Frequency | % |
| Convergent tracks | 27 | 32.9 |
| Reciprocal tracks | 41 | 50.0 |
| Same tracks | 14 | 17.1 |
| Weather Conditions | Frequency | % |
| Thunderstorm | 9 | 11.0 |
| Turbulence | 3 | 3.7 |
| Non-Relevant | 70 | 85.3 |
| Sector Overload | Frequency | % |
| Yes | 5 | 6.1 |
| No | 77 | 93.9 |
| TCAS | Frequency | % |
|---|---|---|
| TA | 16 | 19.5 |
| RA | 61 | 74.4 |
| Non TCAS | 5 | 6.1 |
| STCA | Frequency | % |
| PAC | 8 | 9.8 |
| VAC | 60 | 73.1 |
| Ignored | 3 | 3.7 |
| Inhibited | 1 | 1.2 |
| System Failure | 5 | 6.1 |
| Non STCA | 5 | 6.1 |
| Crew Error | Frequency | % |
|---|---|---|
| Yes | 15 | 18.3 |
| No | 67 | 81.7 |
| ATC Error | Frequency | % |
| Yes | 80 | 97.6 |
| No | 2 | 2.4 |
| Communication Issues | Frequency | % |
| Contributing Factor | 4 | 4.9 |
| Non-Contributing Factor | 78 | 95.1 |
| ATCS Ergonomics | Frequency | % |
| Contributing Factor | 8 | 9.8 |
| Non-Contributing Factor | 74 | 90.2 |
| LOS Criticality | Frequency | % |
|---|---|---|
| Minor | 22 | 26.8 |
| Major | 35 | 42.7 |
| Hazardous | 19 | 23.2 |
| Catastrophic | 6 | 7.3 |
| ACC 1 | Frequency | % |
|---|---|---|
| LOS within the same sector | 33 | 71.7 |
| LOS between different sectors | 13 | 28.3 |
| Coordination | ||
| Upper sector-Lower sector | 2 | 15.4 |
| Both sectors of ACC 1 | 7 | 53.8 |
| ACC 1-and other ACC | 4 | 30.8 |
| ACC 2 | Frequency | % |
| LOS within the same sector | 25 | 78.2 |
| LOS between different sectors | 6 | 18.8 |
| Coordination | ||
| Upper sector-Lower sector | 1 | 16.7 |
| Both sectors of ACC 2 | 1 | 16.7 |
| ACC 2-and other ACC | 4 | 66.6 |
| ACC 3 | Frequency | % |
| LOS within the same sector | 8 | 88.9 |
| LOS between different sectors | 1 | 11.1 |
| Coordination | ||
| ACC 3-and other ACC | 1 | 100.0 |
| ACC 4 | Frequency | % |
| LOS within the same sector | 3 | 100.0 |
| Node | Number of States | Description of States | |
|---|---|---|---|
| 1 | Month | 12 | 1, 2, 3, 4, 5, 6, 7, 8, 9, 10, 11, 12 |
| 2 | Year | 8 | 2012, 2013, 2014, 2015, 2016, 2017, 2018, 2019 |
| 3 | Time | 4 | Morning, Midday, Afternoon, Night |
| 4 | Weather_conditions | 3 | Thunderstorm, Turbulence, Non-Relevant |
| 5 | Airspace | 4 | ACC_1, ACC_2, ACC_3, ACC_4 |
| 6 | Encounter geometry | 3 | Reciprocal Track Scenario, Crossing Track Scenario, Same Track Scenario |
| 7 | Sector_overload | 2 | LOS contributing factor, Non-Contributing factor |
| 8 | CREW_error | 2 | LOS contributing factor, Non-Contributing factor |
| 9 | ATC_error | 2 | LOS contributing factor, Non-Contributing factor |
| 10 | COM_issues | 2 | LOS contributing factor, Non-Contributing factor |
| 11 | ATCS_ergonomics | 2 | LOS contributing factor, Non-Contributing factor |
| 12 | TCAS | 3 | TA, RA, No TCAS |
| 13 | STCA | 6 | PAC, VAC, System Failure, Ignored, Inhibited, No STCA |
| 14 | LOS Criticality | 4 | Minor, Major, Hazardous, Catastrophic |
| LOS Criticality | ATC_Error | CREW_Error | COM_Issues |
|---|---|---|---|
| Minor P(Minor) = 1 | 66% | 20% | 14% |
| Major P(Major) = 1 | 74% | 13% | 14% |
| Hazardous P(Hazardous) = 1 | 64% | 25% | 14% |
| CatastrophicP(Catastrophic) = 1 | 49% | 18% | 18% |
| LOS Criticality | ||||
|---|---|---|---|---|
| Minor | Major | Hazardous | Catastrophic | |
| ATC_errorP(ATC_error) = 1 | 25% | 40% | 23% | 12% |
| CREW_errorP(CREW_error) = 1 | 27% | 25% | 32% | 16% |
| COM_issuesP(COM_issues) = 1 | 23% | 35% | 22% | 20% |
| Weather_Conditions | ||||
|---|---|---|---|---|
| Non_Relevant P(Non_rel) = 1 | Thunderstorm P(Thunderstorm) = 1 | Turbulence P(Turbulence) = 1 | ||
| ATC_error | Yes | 72% | 62% | 54% |
| Sector_overload | Yes | 30% | 45% | 53% |
| COM_issues | Yes | 4% | 20% | 31% |
| LOS Criticality | ||||
|---|---|---|---|---|
| Minor | Major | Hazardous | Catastrophic | |
| Non_TCASP(Non_TCAS) = 1 | 15% | 18% | 23% | 44% |
| TCAS_TAP(TCAS_TA) = 1 | 15% | 44% | 26% | 15% |
| TCAS_RAP(TCAS_RA) = 1 | 30% | 36% | 23% | 12% |
Publisher’s Note: MDPI stays neutral with regard to jurisdictional claims in published maps and institutional affiliations. |
© 2022 by the authors. Licensee MDPI, Basel, Switzerland. This article is an open access article distributed under the terms and conditions of the Creative Commons Attribution (CC BY) license (https://creativecommons.org/licenses/by/4.0/).
Share and Cite
Serrano-Mira, L.; Pérez Maroto, M.; Ayra, E.S.; Pérez-Castán, J.A.; Liang-Cheng, S.Z.Y.; Gordo Arias, V.; Pérez-Sanz, L. Identification and Quantification of Contributing Factors to the Criticality of Aircraft Loss of Separation. Aerospace 2022, 9, 513. https://doi.org/10.3390/aerospace9090513
Serrano-Mira L, Pérez Maroto M, Ayra ES, Pérez-Castán JA, Liang-Cheng SZY, Gordo Arias V, Pérez-Sanz L. Identification and Quantification of Contributing Factors to the Criticality of Aircraft Loss of Separation. Aerospace. 2022; 9(9):513. https://doi.org/10.3390/aerospace9090513
Chicago/Turabian StyleSerrano-Mira, Lidia, Marta Pérez Maroto, Eduardo S. Ayra, Javier Alberto Pérez-Castán, Schon Z. Y. Liang-Cheng, Víctor Gordo Arias, and Luis Pérez-Sanz. 2022. "Identification and Quantification of Contributing Factors to the Criticality of Aircraft Loss of Separation" Aerospace 9, no. 9: 513. https://doi.org/10.3390/aerospace9090513