Article

Predicting the Remaining Useful Life of Landing Gear with Prognostics and Health Management (PHM)

1
Department of Aerospace and Systems Engineering, Feng Chia University, Taichung City 407102, Taiwan
2
Master’s Program of Data Science, Feng Chia University, Taichung City 407102, Taiwan
3
Ph.D. Program of Mechanical and Aeronautical Engineering, Feng Chia University, Taichung City 407102, Taiwan
*
Author to whom correspondence should be addressed.
Aerospace 2022, 9(8), 462; https://doi.org/10.3390/aerospace9080462
Submission received: 23 May 2022 / Revised: 22 July 2022 / Accepted: 18 August 2022 / Published: 20 August 2022
(This article belongs to the Special Issue Recent Advances in Computational Mechanics)

Abstract

:
Landing gear is an essential part of an aircraft. However, the components of landing gear are susceptible to degradation over the life of their operation, which can result in the shimmy effect occurring during take-off and landing. In order to reduce unplanned flight disruptions and increase the availability of aircraft, the predictive maintenance (PdM) technique is investigated in this study. This paper presents a case study on the implementation of a health assessment and prediction workflow for remaining useful life (RUL) based on the prognostics and health management (PHM) framework of currently in-service aircraft, which could significantly benefit fleet operators and aircraft maintenance. Machine learning is utilized to develop a health indicator (HI) for landing gear using a data-driven approach, whereas a time-series analysis (TSA) is used to predict its degradation. The degradation models are evaluated using large volumes of real sensor data from in-service aircraft. Finally, the challenges of implementing a built-in PHM system for next-generation aircraft are outlined.

1. Introduction

Although aircraft landing gear is highly durable, it is not immune to wear and tear. It is highly vulnerable to corrosion and damage, resulting in a substantially reduced operational lifespan well below manufacturer specifications [1], which increases risks and overhaul costs. The landing gear’s pressurized oleo-pneumatic shock struts constantly exert stress on their metal housings, and the force of hitting the runway on landing stresses the entire system, no matter how gently it is performed. Horizontal forces are also exerted on the gear as the aircraft brakes during landing or accelerates during take-off. Finally, strain is put on the nose landing gear during aircraft towing, especially if the tow is not executed gracefully. Thus, landing gear maintenance is crucial. Having a landing gear maintenance plan in place helps keep costs down and reduces the need for complete overhauls. Although most landing gear maintenance practices are simple, they can have a significant impact on fleet management during the execution of a maintenance action [2].
Fleet management plays a significant role in both the military and commercial sectors. Since availability is an essential part of the operational effectiveness of a fleet of aircraft, if an aircraft is not available for service or combat and cannot fly because of a mechanical problem or maintenance, then its value is compromised. Therefore, there has been an advance from the traditional preventive maintenance method to a more predictive maintenance approach, supported by the prognostics and health management (PHM) framework. This acts as a bridge between maintenance and fleet management, ensuring that operators obtain maximum availability from their aircraft.
The fleet operator who collaborated on this study has data that was collected from each aircraft and each sortie over eight years, which provided an excellent opportunity to apply the advanced PdM method to real data. These data are downloaded routinely from the flight data recorder (FDR) by the operator. The FDR records the system events, pilot inputs and onboard readings that sensors generate each flight or sortie. Even though the parameters depend on the type and manufacturer of the FDR, most of the important parameters, e.g., altitude, airspeed, acceleration, angle of attack (AOA), etc., are included in almost all FDR variants. This study had access to the data of twenty aircraft that were collected by the fleet operator, and used only the essential parameters of that data. The aim was to present the implementation of a health indicator (HI) and perform RUL prediction based on this HI using PHM technology for the in-service aircraft landing gear, all without installing additional sensors. The results of this study could contribute greatly to improving the maintenance of aging aircraft.

Current Maintenance Practice

In order to demonstrate the benefits of the new maintenance strategies, it is necessary to examine the foundation and limitations of the current maintenance practice. Current maintenance methods for critical aircraft systems such as landing gear comprise several preventive and corrective maintenance scheduling activities.
The basis of preventive maintenance builds on the approach of reliability-centered maintenance (RCM). A generic decision process is used to identify the key contributors leading to a functional failure [3] and the corresponding measures that are required [4]. Once the applicable measures have been defined, the necessary intervals of examination need to be determined. These intervals are derived from statistical data of past operations, e.g., the mean time to failure (MTTF), and also from engineering experience [5]; however, the degradation behavior can change depending on the environment, the intensity usage and the age of the machine. Hence, in order to ensure safe operation, maintenance intervals must often be estimated conservatively, leading to an excess of unnecessary maintenance activities [5,6]. The following description shows how the maintenance of landing gear is currently performed. In scheduled maintenance, there are many parts of the typical landing gear that need to be inspected. An example of key inspection areas along with typical timescales [7,8] is:
  • After 300 h or after 1 year in service: inspection.
    • Nitrogen pressure check of shock absorber.
  • After 600 h: inspections.
    • Visual inspections of landing gear hinge points.
    • Leak inspection (oil, hydraulic fluid, etc.).
    • Inspection of torque links.
  • After 1600 flight hours: perform a full inspection, which takes about 150 h.
Although there are routinely scheduled maintenance tasks, unscheduled maintenance still occurs due to incidents such as system faults reported by the pilot, failure of pre-flight checks, and post-flight inspection failures. These happen unexpectedly and increase the difficulty of fleet management. Kählert indicated that unscheduled maintenance accounts for 88% of an airline’s direct maintenance cost (DMC) [9]. Meanwhile, Heisey emphasized that non-routine labor and material costs are the primary causes of increasing maintenance costs [10].
Both scheduled and unscheduled maintenance have a significant impact on aircraft availability. Figure 1 gives a breakdown of the time elements covering maintenance actions [11], and it can be clearly seen that a significant amount of tasks are spent on maintenance and the occupational time for ground resources. Although a full inspection for an overhaul is scheduled by the manufacturer, the actual inspections carried out might be different depending on the end user, which increases the risk of having a system fault before the overhaul. Additionally, aircraft maintenance must be performed at the highest standard to ensure system reliability, which is time-consuming. Therefore, to overcome the limitations and inefficiency of the current maintenance approach, gaining continuous insight into an asset’s health state and predicting its remaining useful life to allow maintenance to be performed at appropriate times is key to helping operators optimize their fleet management to maximize its availability.

2. Problem Statement

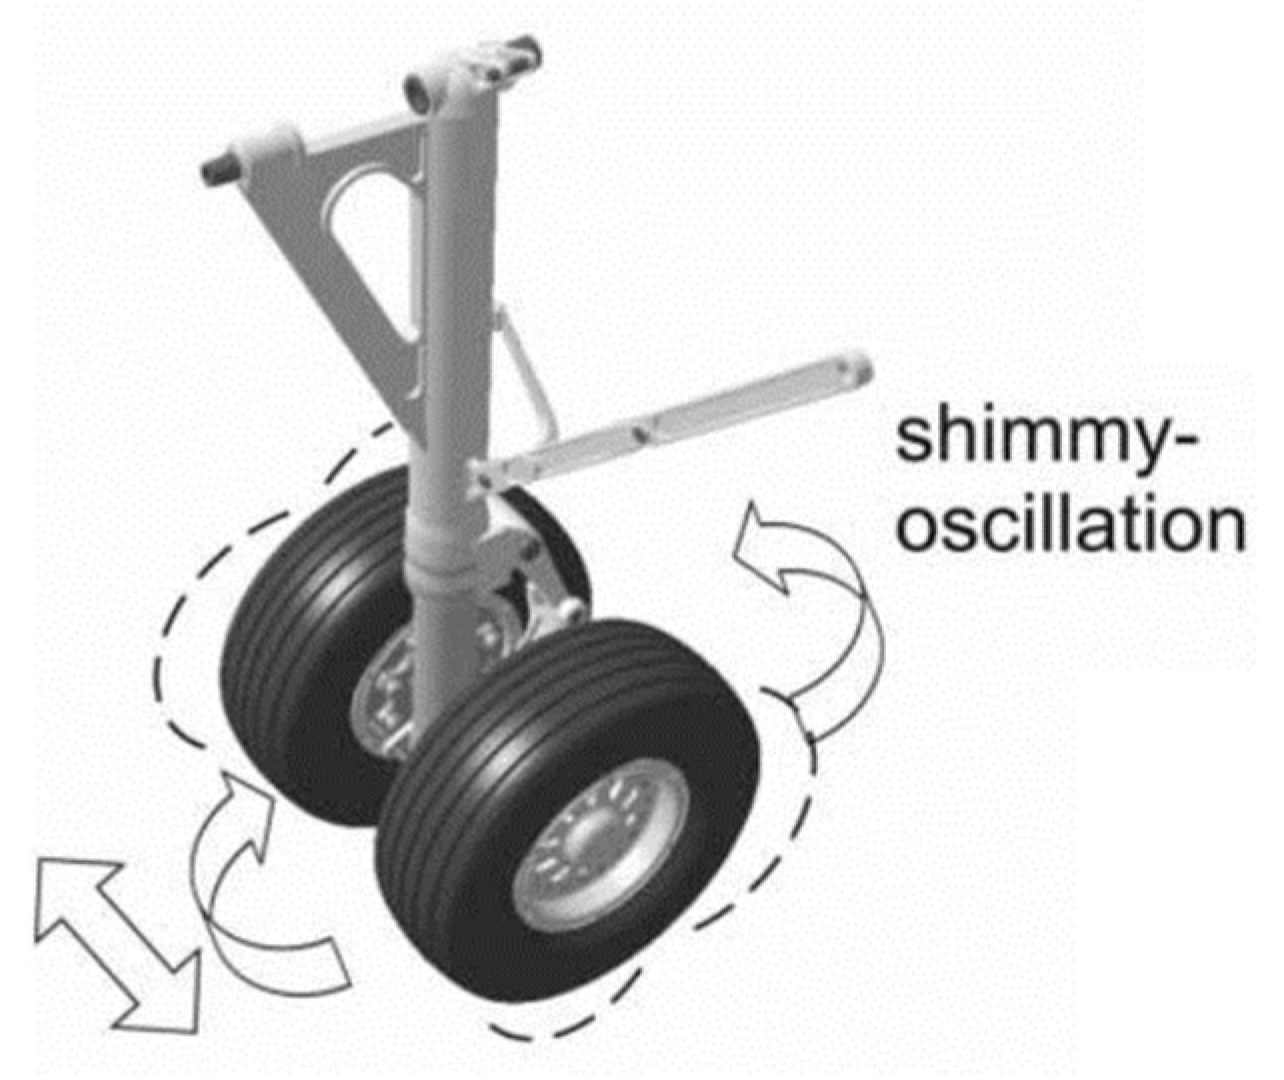
2.1. The Landing Gear Shimmy Effect

The landing gear is an essential aircraft system that supports the aircraft during ground operations, including take-off, landing impact, taxiing, gate handling and maintenance. The tasks of the landing gear are complex and have significant effects on aircraft performance. The dynamics of the landing gear depend on the design of the gear structure and its components, i.e., the shock absorber, the shimmy damper and the tire. An important landing gear oscillation phenomenon is shown in Figure 2 [12].
Shimmy can reduce the stability of landing gear and cause wear that affects its long-term durability; this has remained a challenge in aircraft engineering for the past few decades. The current engineering approach relies on the use of shimmy dampers, a systematic maintenance strategy and the replacement of landing gear components. Therefore, the monitoring and maintenance of these critical parts is crucial.
Shimmy is described as self-induced torsional and lateral oscillations caused by the interaction between flexibilities in both structural components and tires (in combination with nonlinear effects such as friction and free-play in the bearings of the king pin) [13] during ground operations, such as take-off and landing. It typically has a frequency in the range of 10 to 30 Hz [14,15]. Shimmy can occur in the nose and main landing gear, although it is more common in the former. It is understood that the shimmy mode is excited by the transfer of kinetic energy from the moving aircraft to the wheels [16], which acts as the energy source for the undesired oscillations. It can also be induced by applying the brake. As a result, the dynamic properties of the gear structure and the brake have to be seen as a coupled feedback system. The amplitude may grow to an undesirable level of vibrations that can affect the comfort and visibility of the pilot or even result in sudden severe structural damage and landing gear failure [17,18].
The simulation of aircraft ground dynamics, including shimmy prediction and brake modeling, has already been discussed in the literature. Khapane examined the interaction between the landing gear and brakes in [19]. Denti and Fanteria [20] examined the effect of different types of tires and brakes on the longitudinal dynamics of the landing gear. Besselink investigated the influence of various parameters on shimmy prediction, whose thesis is a rich resource of references concerning the topic [15].
The landing gear is one of the few systems on the aircraft without redundancies. Approximately 60% of aircraft failures are related to the landing gear and fatigue failure due to multiaxial loads (e.g., shimmy loads) [21,22]. Therefore, it is crucial to prevent the reoccurrence of such events through appropriate monitoring and maintenance of critical parts of landing gear for aircraft safety.

2.2. Challenges to Integrating the PdM Technique with Existing Aircraft Platforms

Although the state-of-the-art PdM technique and health-monitoring systems are already widely used in industrial machinery and civil engineering structures, their use in aerospace applications has been restricted by various limitations. For example, many sensor-based methods require a vast number of installed sensors. There are often hardware restrictions, usually based upon weight, complexity and the difficulties of modifying the existing platform associated with certification, as large-scale integration would disrupt daily operation.
The integration of new technologies inevitably faces difficulties, and several challenges face the community of engineers and technical specialists as they seek to utilize health monitoring for aerospace usage. A non-exhaustive list of these difficulties includes [7]:
  • Technology and frameworks are available but underutilized.
  • Performance characteristics are usually untested, leading to a lack of confidence.
  • Although a wealth of data is often available from end users, access to this data can be limited and much of it has yet to be converted to meaningful information.
Given these difficulties, utilizing devices already available on board is an approach worth testing. For example, the flight control accelerometer under the pilot seat near the nose landing gear could be used for vibration signal acquisition, where the data would be stored in the FDR. However, since the old FDR module lacks memory, the data of 15–25% of sorties of each aircraft were overwritten before being manually downloaded, resulting in missing data for future analysis. Moreover, although the sensor readings were uniformly sampled, since the FDR was originally designed for storing critical data from all the avionics on board, the data stored were nonuniformly sampled, which is undesirable in common data analysis.

3. Methodology

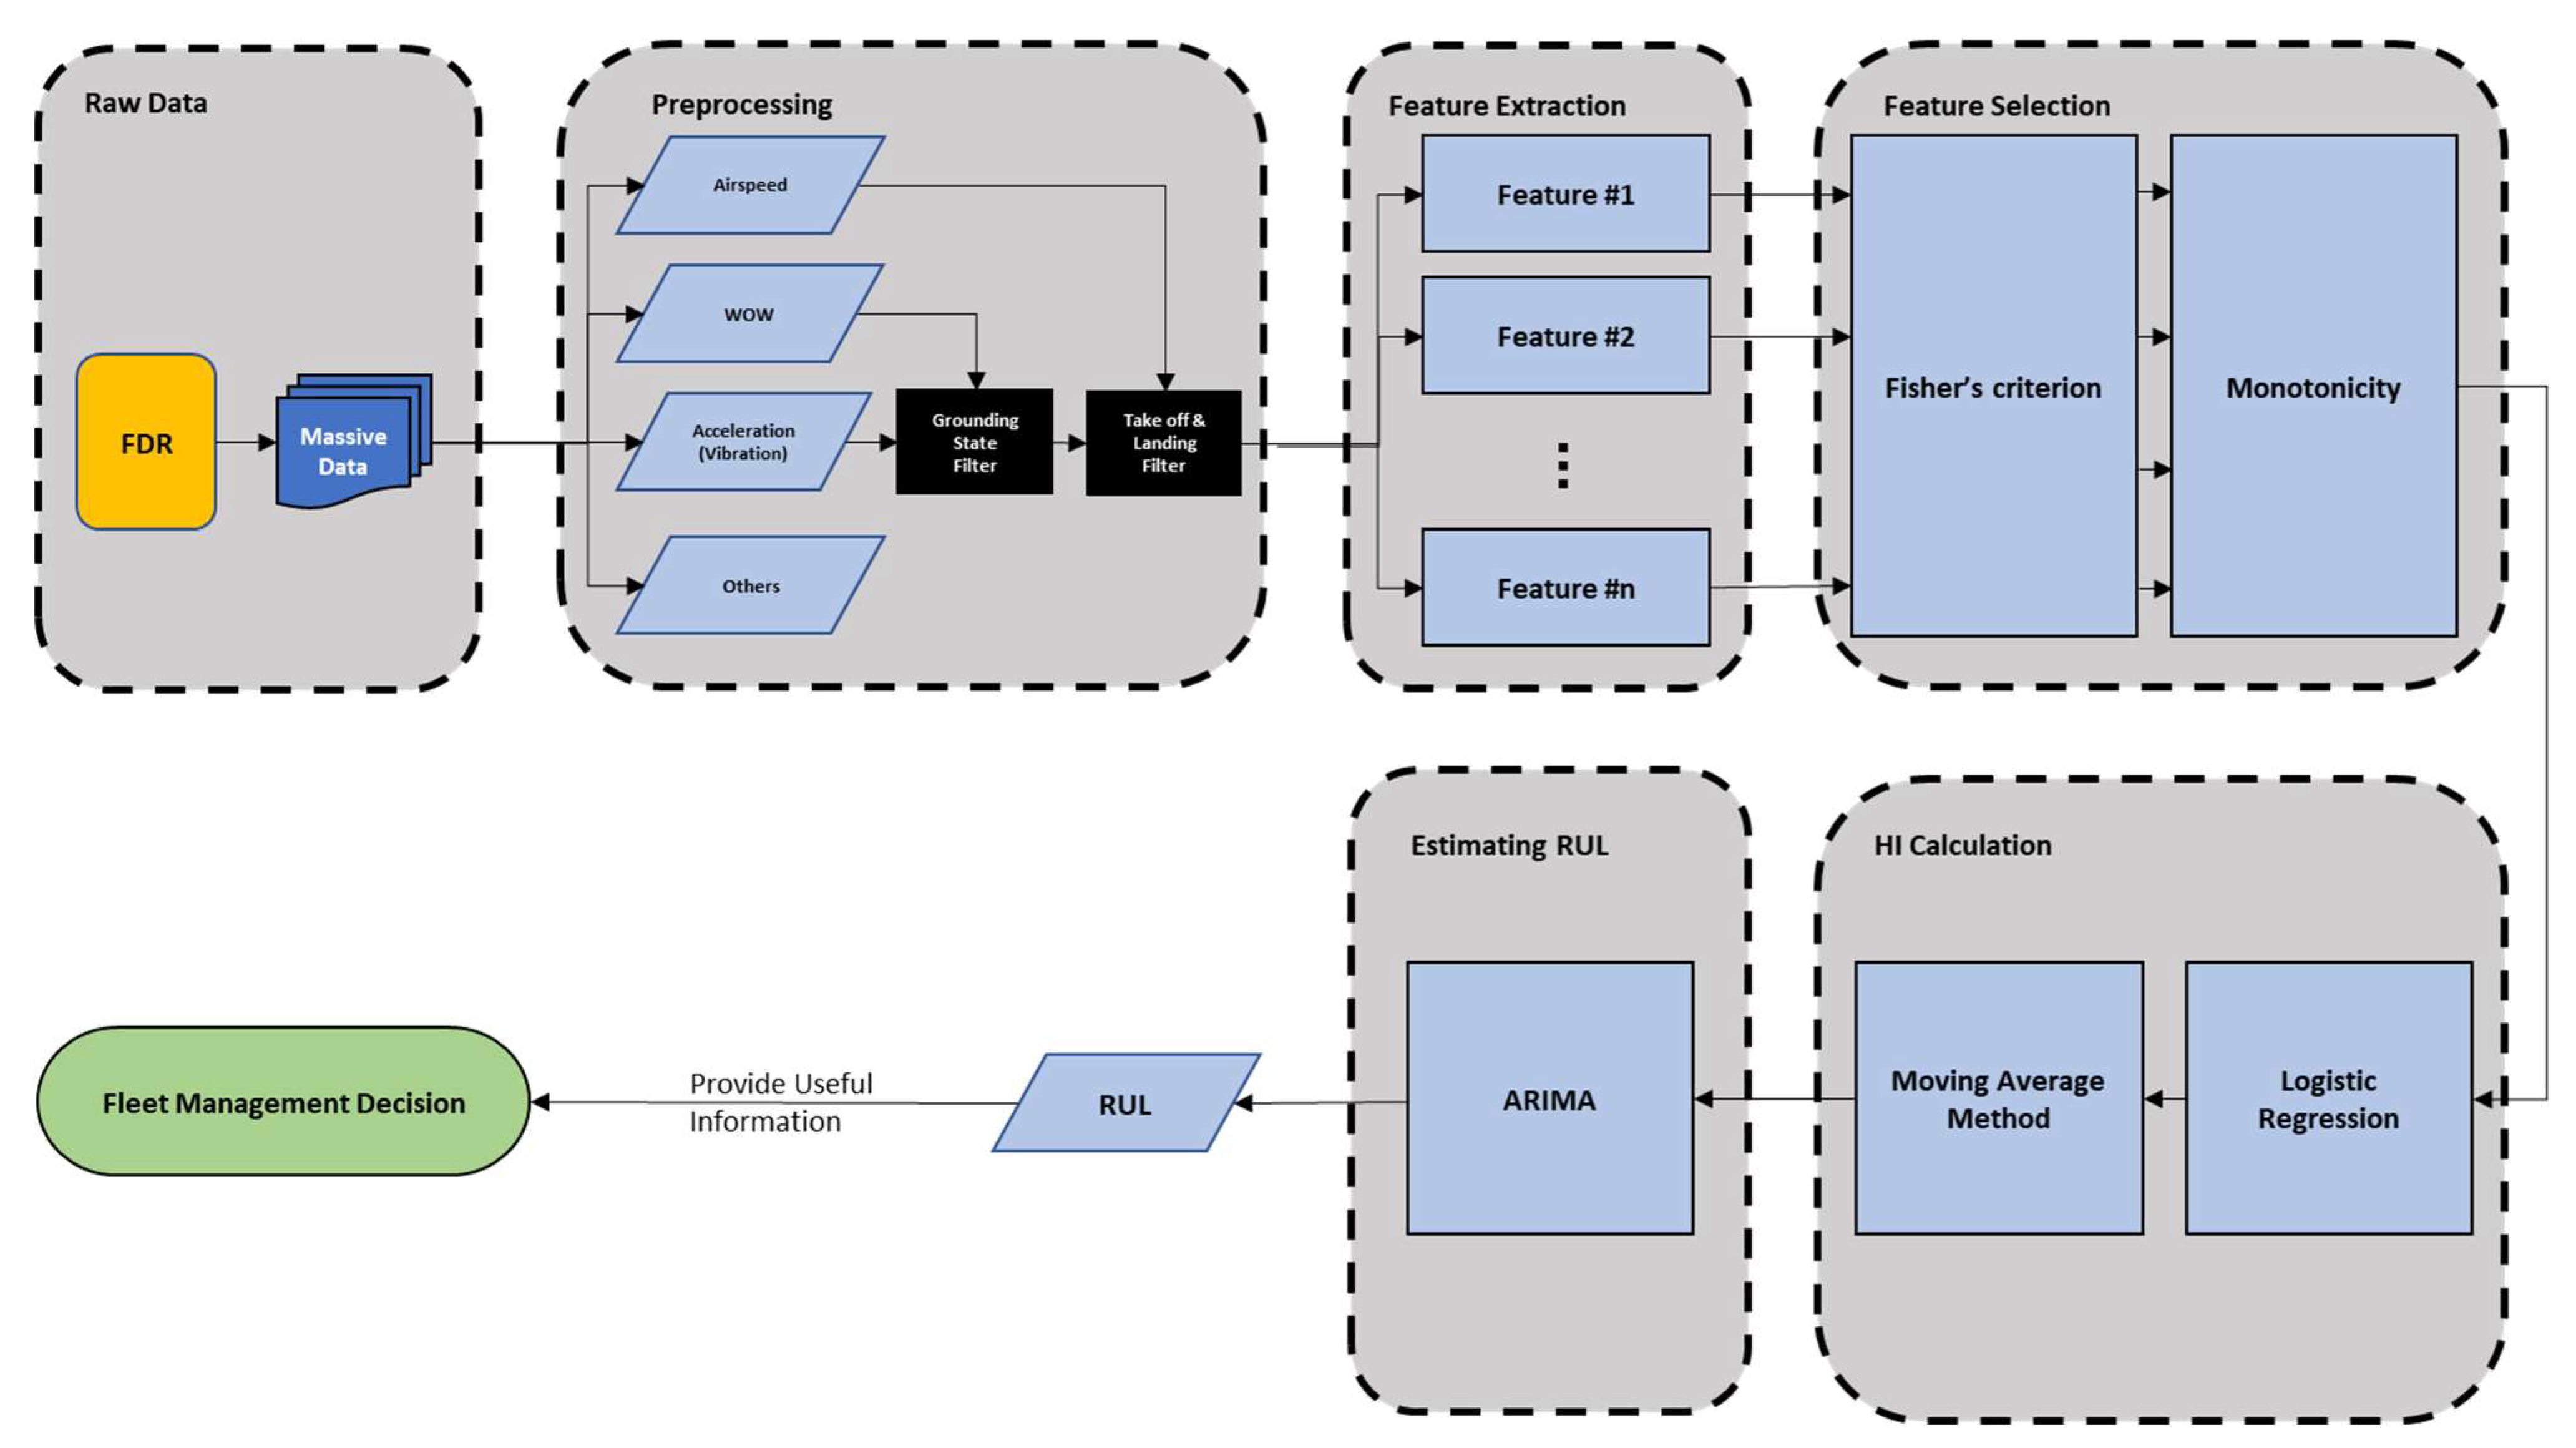
3.1. Introducing the Proposed Methodology Based on the PHM Framework

The PHM system was first applied in the field of aircraft maintenance. This system was proposed at the IEEE Aerospace Symposium in 2002 by the United States Naval Weapons System Bureau [23]. PHM technology has been intensively studied and there are many mature cases of industrial application that have verified its benefits [24,25,26,27]. The concept of prognostics is to diagnose and predict an item’s remaining useful life (RUL) (e.g., a device, component, or system). By identifying potential failures in advance and providing information on system health, it is possible to reduce unscheduled maintenance and extend scheduled maintenance intervals [28,29]. In addition, this prognostic capability offers tremendous advantages since the mean time to repair (MTTR) for unscheduled maintenance is considerably larger than for scheduled maintenance [30].
Moreover, with the aid of RUL, it is also possible to optimize the logistics of component replacement, i.e., preordering a device that is about to fail and preparing human resources. Another benefit would be the ability to adjust the operational profile of specific aircraft, e.g., an aircraft with an inevitable potential failure could be used for a specific type of mission for which the stress factors for that particular failure are minimal.
Degradations and impending faults can be identified before they cause a failure by using the prognostic methodologies based on the PHM framework, and an off-board information system allows an operator to consider the current system’s health in combination with available support resources. Altogether, this gives the operator increased potential to improve aircraft availability with regard to the concept of autonomic logistics within the Joint Strike Fighter (JSF) program. The overall procedure proposed for this study is depicted in Figure 3.

3.1.1. Preprocessing

The amount of data downloaded from the FDR each time was enormous; thus, data preprocessing was required before performing the data analysis. Since the focus was on the vibration of the landing gear, the readings of the accelerometer, e.g., the y-axis (lateral) and z-axis (vertical), generated during the ground operation were taken into account. To filter out the airborne data, an assist from another signal was needed. For example, the weight-on-wheel (WoW) signal could act as the grounding state indicator. After the ground operation data was gathered, the dataset would only need to contain the information of the time, airspeed, and readings of the accelerometer for the process afterward. Then, the data during take-off and landing operations were selected by searching for monotonically increasing airspeed for take-off data and monotonically decreasing airspeed for landing data.

3.1.2. Feature Definition

The vibration signals of the aircraft during take-off and landing change alongside the landing gear’s change in status from healthy to faulty. Previous studies have shown that some time-domain features can indicate the health of rotary machines [24]. In this study, ten time-domain feature parameters were extracted: peak-to-peak ( x p 2 p ), mean ( x m ), root mean square ( x r m s ), standard deviation ( x s t d ), skewness ( x s k ), kurtosis ( x k u ), crest indicator ( x c i ), clearance indicator ( x c l i ), shape indicator ( x s i ), and impulse indicator ( x m i ). The first three parameters represent the amplitude and energy of the vibration in the time domain. The remaining parameters represent the time-series distribution of the signal in the time domain [31]. The mathematical definitions of these features are shown in Table 1.

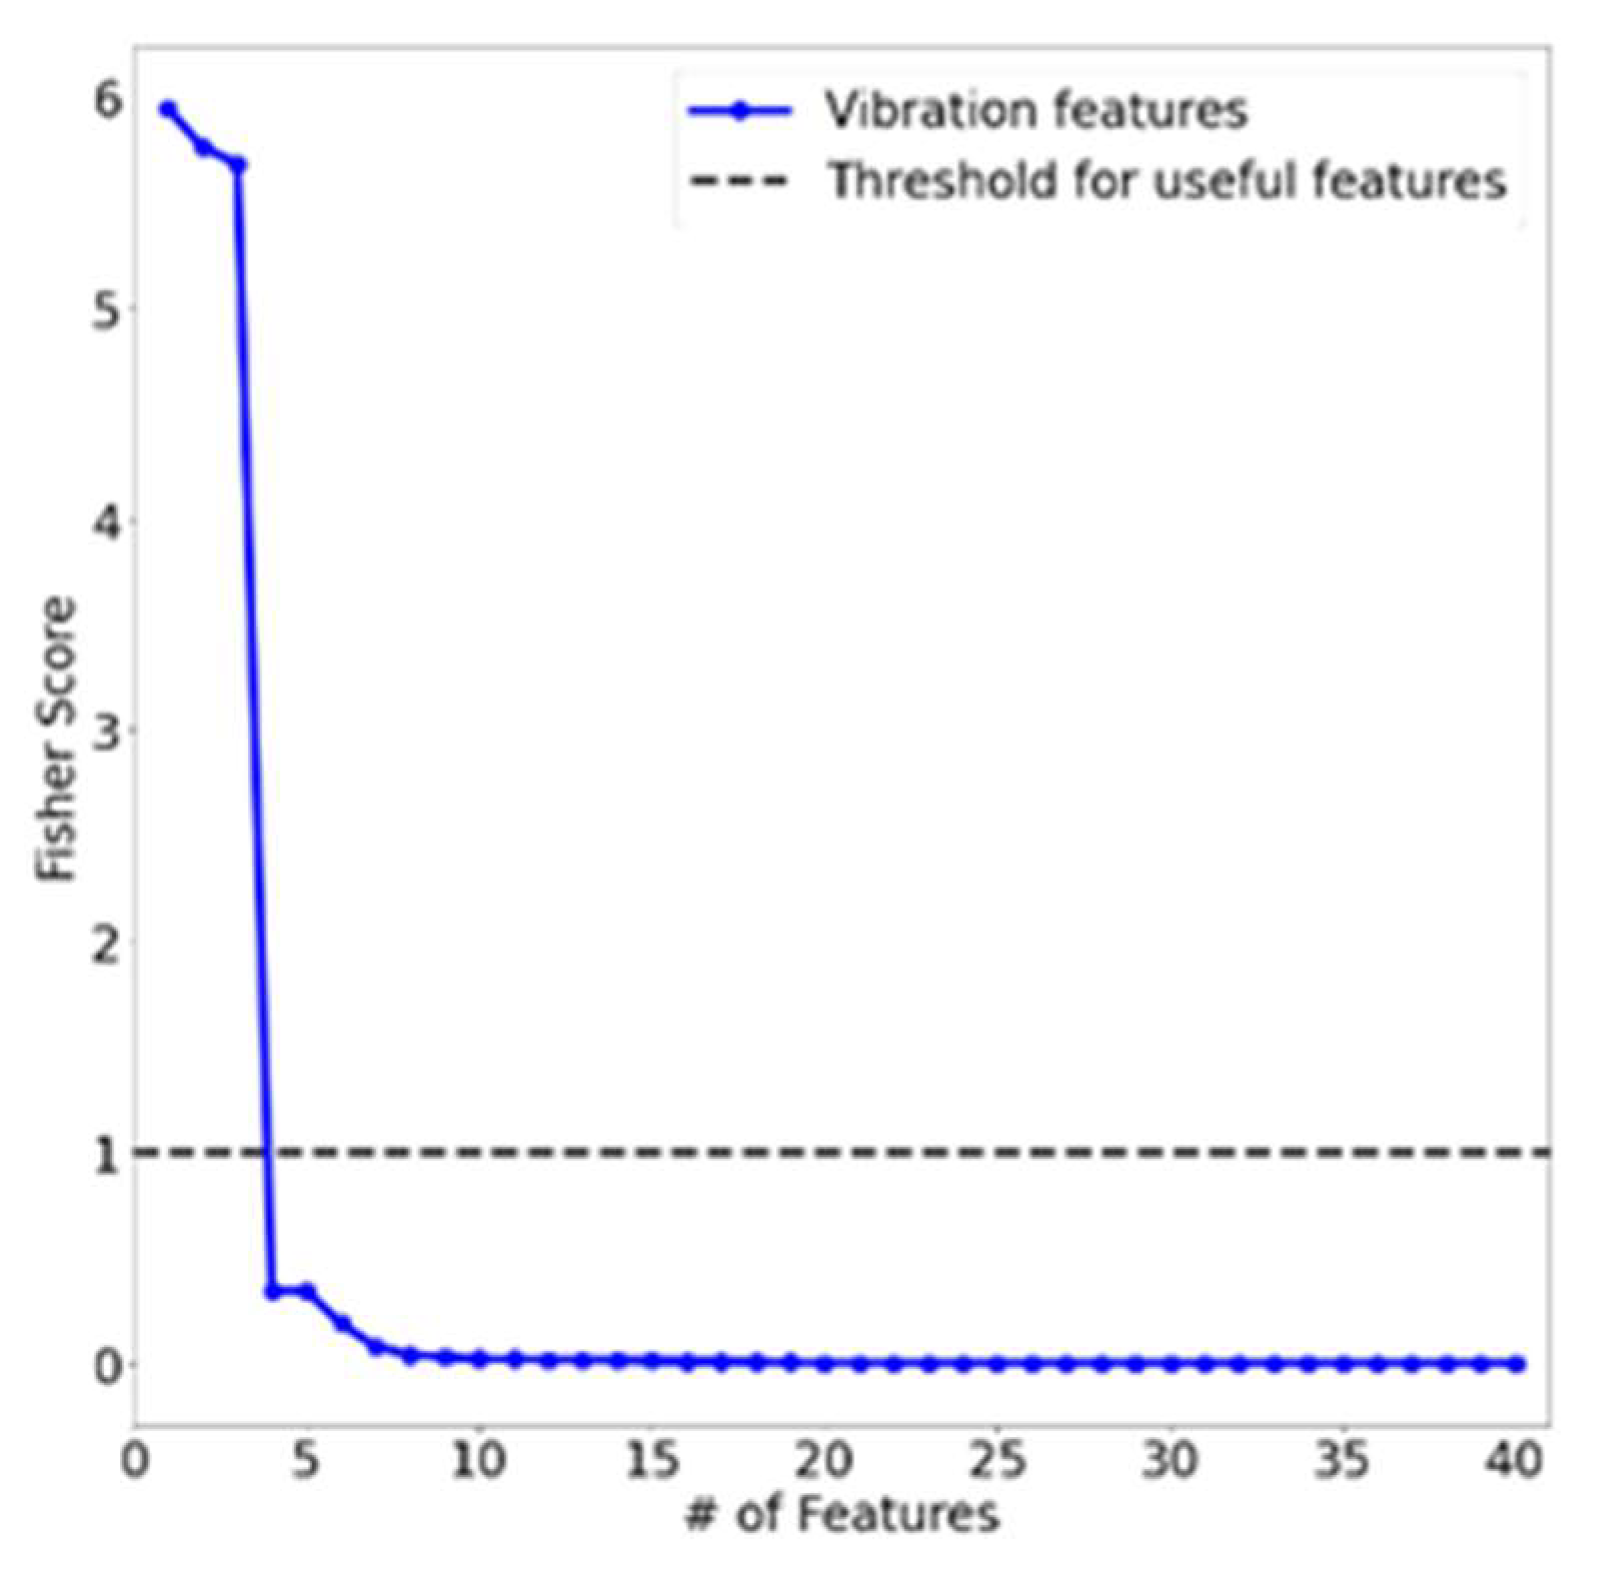
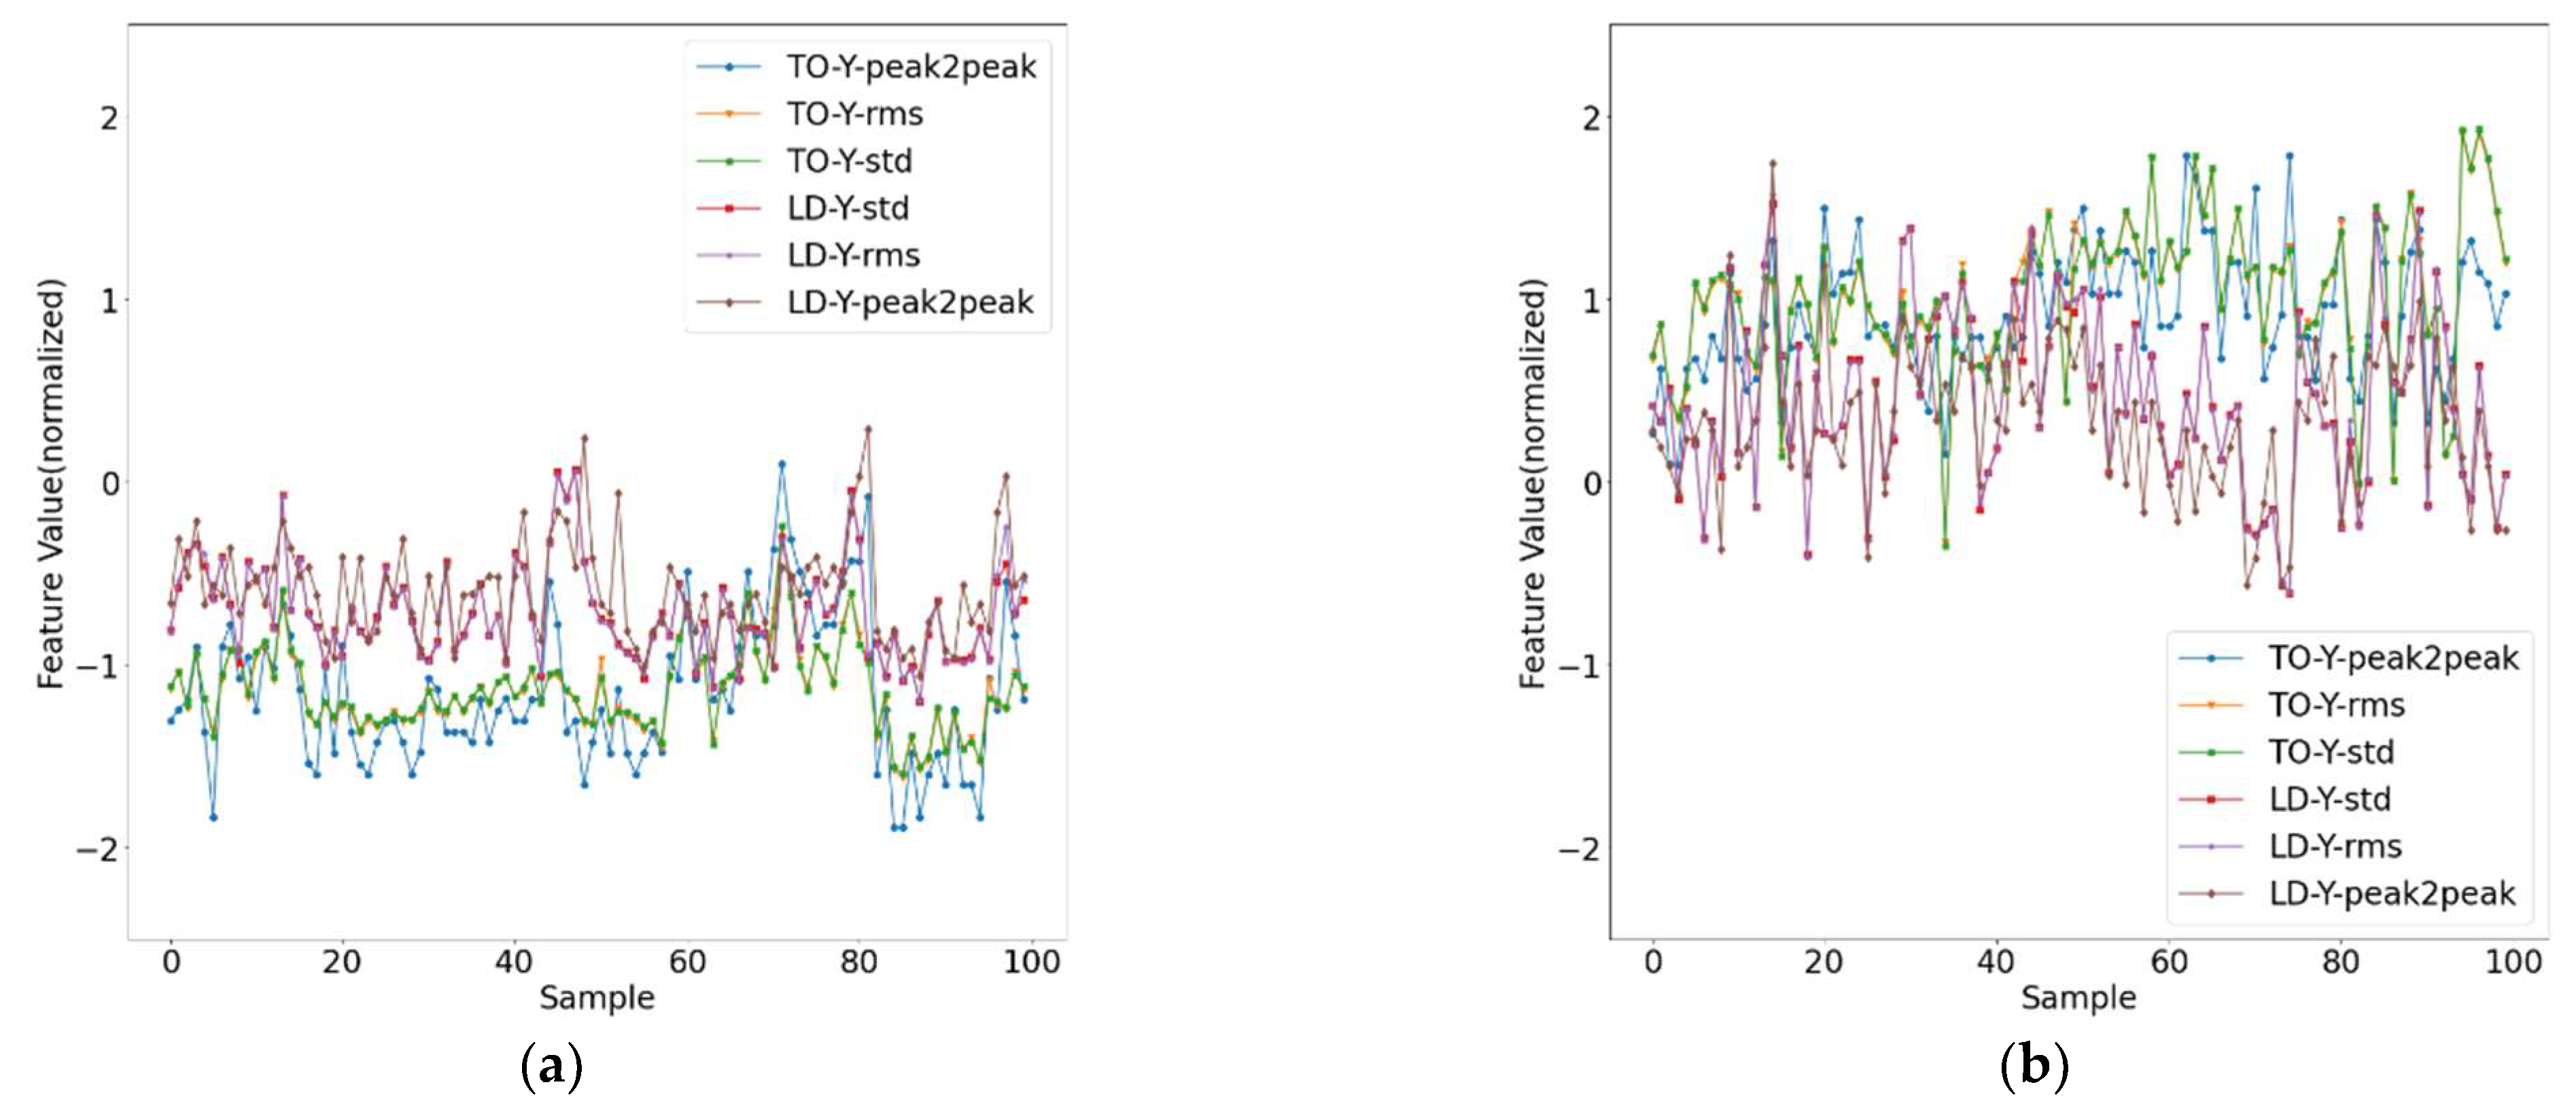
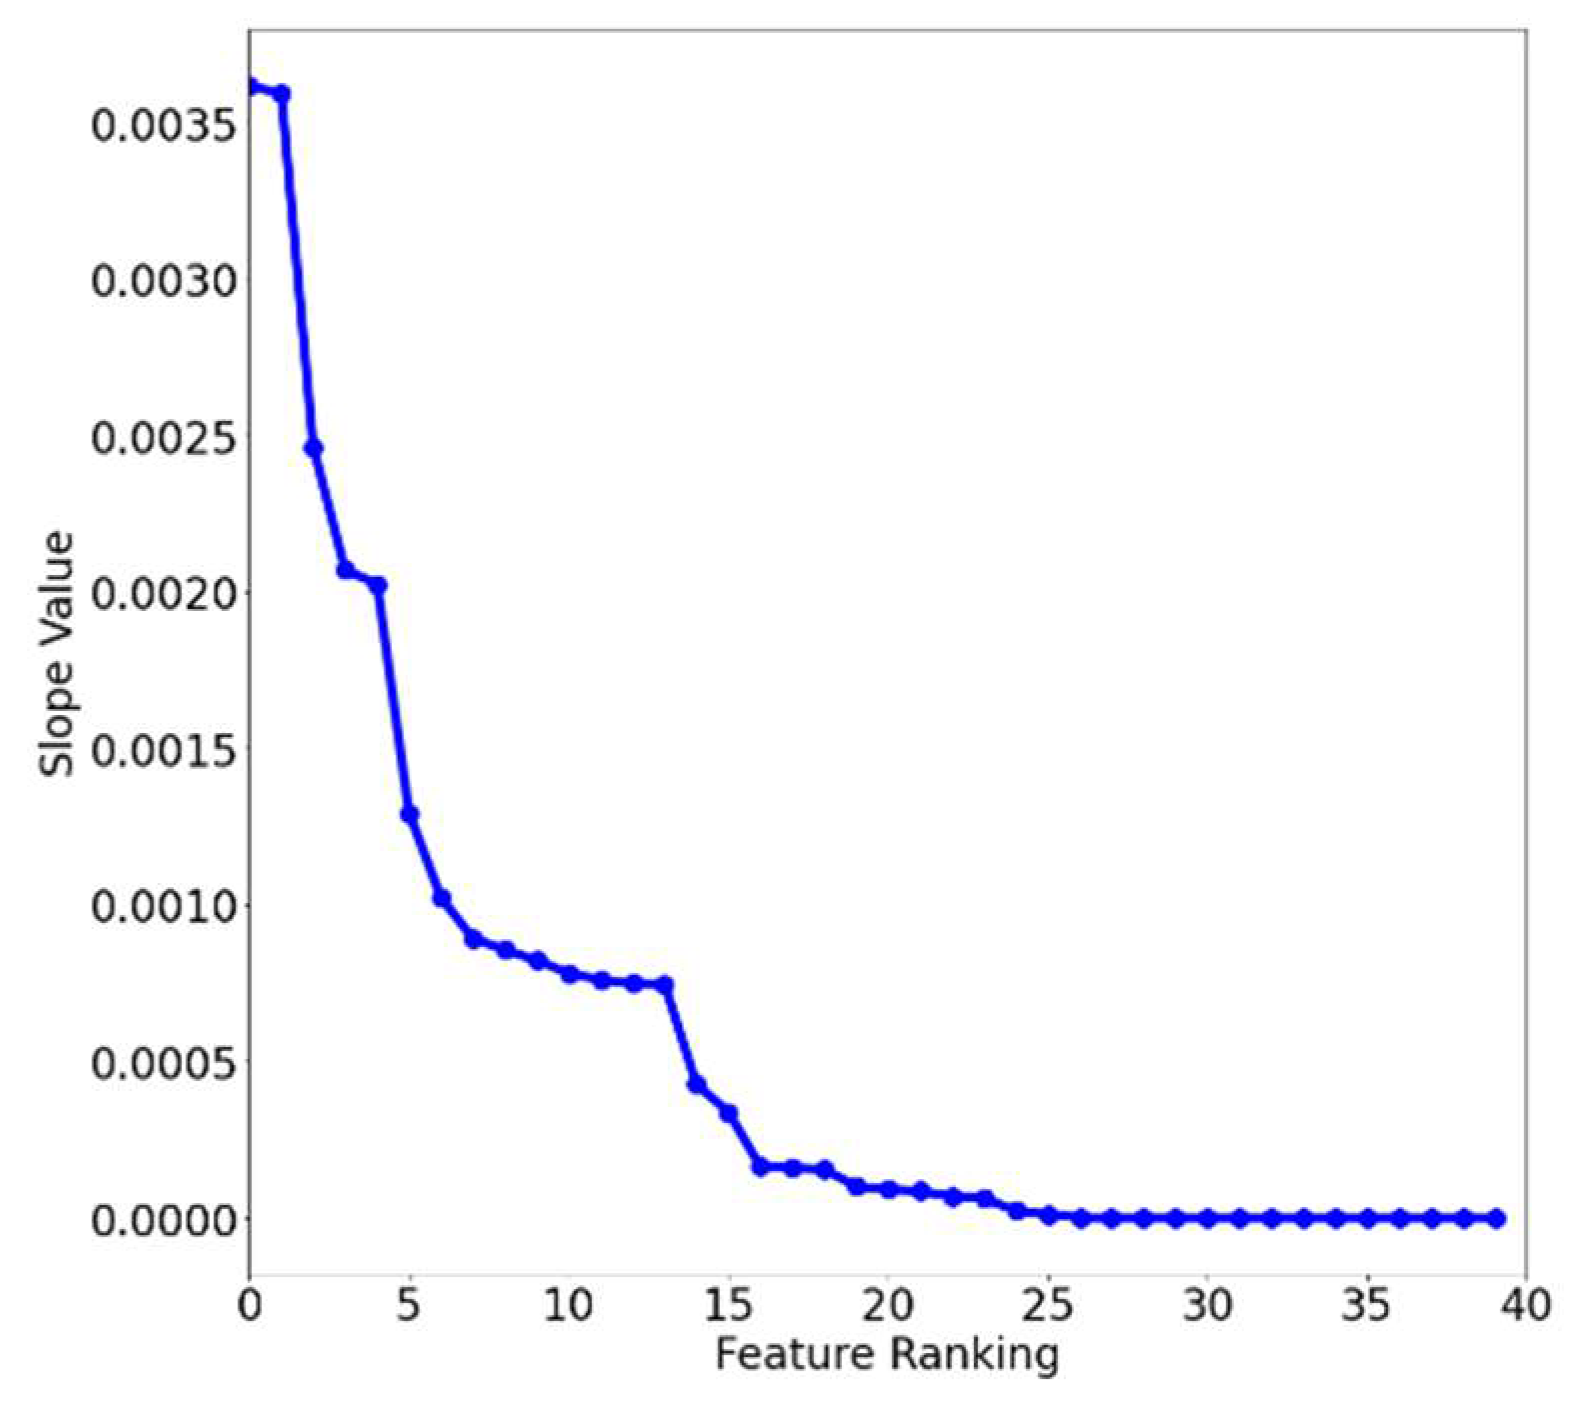
3.1.3. Feature Selection

Based on the current literature, feature selection methods can typically be categorized into wrapper-based or filter-based approaches. The wrapper method selects features based on the given classifier or regression method. The filter-based approach first ranks features using a ranking criterion and then selects important features by their ranking scores [32].
This study adopts a hybrid strategy for feature selection proposed in the literature [33]. The incoming features are first ranked using a wrapper approach based on Fisher’s criterion. Since the class information for training data is available, feature selection for classification and fault diagnosis is straightforward. Feature selection in the feature measurement space means selecting the feature components containing discriminant information and discarding those features that provide little information. The feature subset can be selected from the available features with larger criterion function values using Fisher’s criterion [34]. The feature components { f l | l = 1 ,   2 ,   ,   n } can be ranked as:
J ( f 1 ) J ( f 2 ) J ( f n 1 ) J ( f n )
where J ( ) is a criterion function for measuring the discriminant power of a specific feature component. Fisher’s criterion was used as a criterion function and is defined as:
J f l ( i , m ) = | μ i , f l μ m , f l | 2 σ i , f l 2 + σ m , f l 2
where μ i , f l and μ m , f l are the mean values of the l th feature, f l , for classes i and m , respectively, and σ i , f l 2 and σ m , f l 2 are the variances of the l th feature, f l , for classes i and m , respectively.
The valuable features can be selected with a threshold of criterion scores from the available features. This significantly simplifies the design of the logistic regression classifier and enhances the generalization capability of the performance assessment process.
To fit a better health indicator model, it is necessary to consider the monotonicity of the feature. The features with good monotonicity are essential to the health assessment. Therefore, the monotonicity of the valuable features selected using Fisher’s criterion need to be verified and re-ranked. The slope value described below is employed to re-rank all the features from the previous selection:
S p = k ( x k x ¯ ) ( y k y ¯ ) k ( x k x ¯ ) 2 ,   where   x ¯ = 1 n k x k   and   y ¯ = 1 n k y k   for   k = 1 , 2 , 3 , ,   n ,
where n is the number of observations, and S p represents the slope of the linear regression for the particular feature. In this study, x k is the k-th sortie and y k represents the feature value at sortie k. The slope value was employed in this investigation mainly for its robustness to noise in the feature series, and a higher slope value intuitively means better monotonicity of the feature. In addition, all the features were normalized to make the slope value comparable for features with different scales.

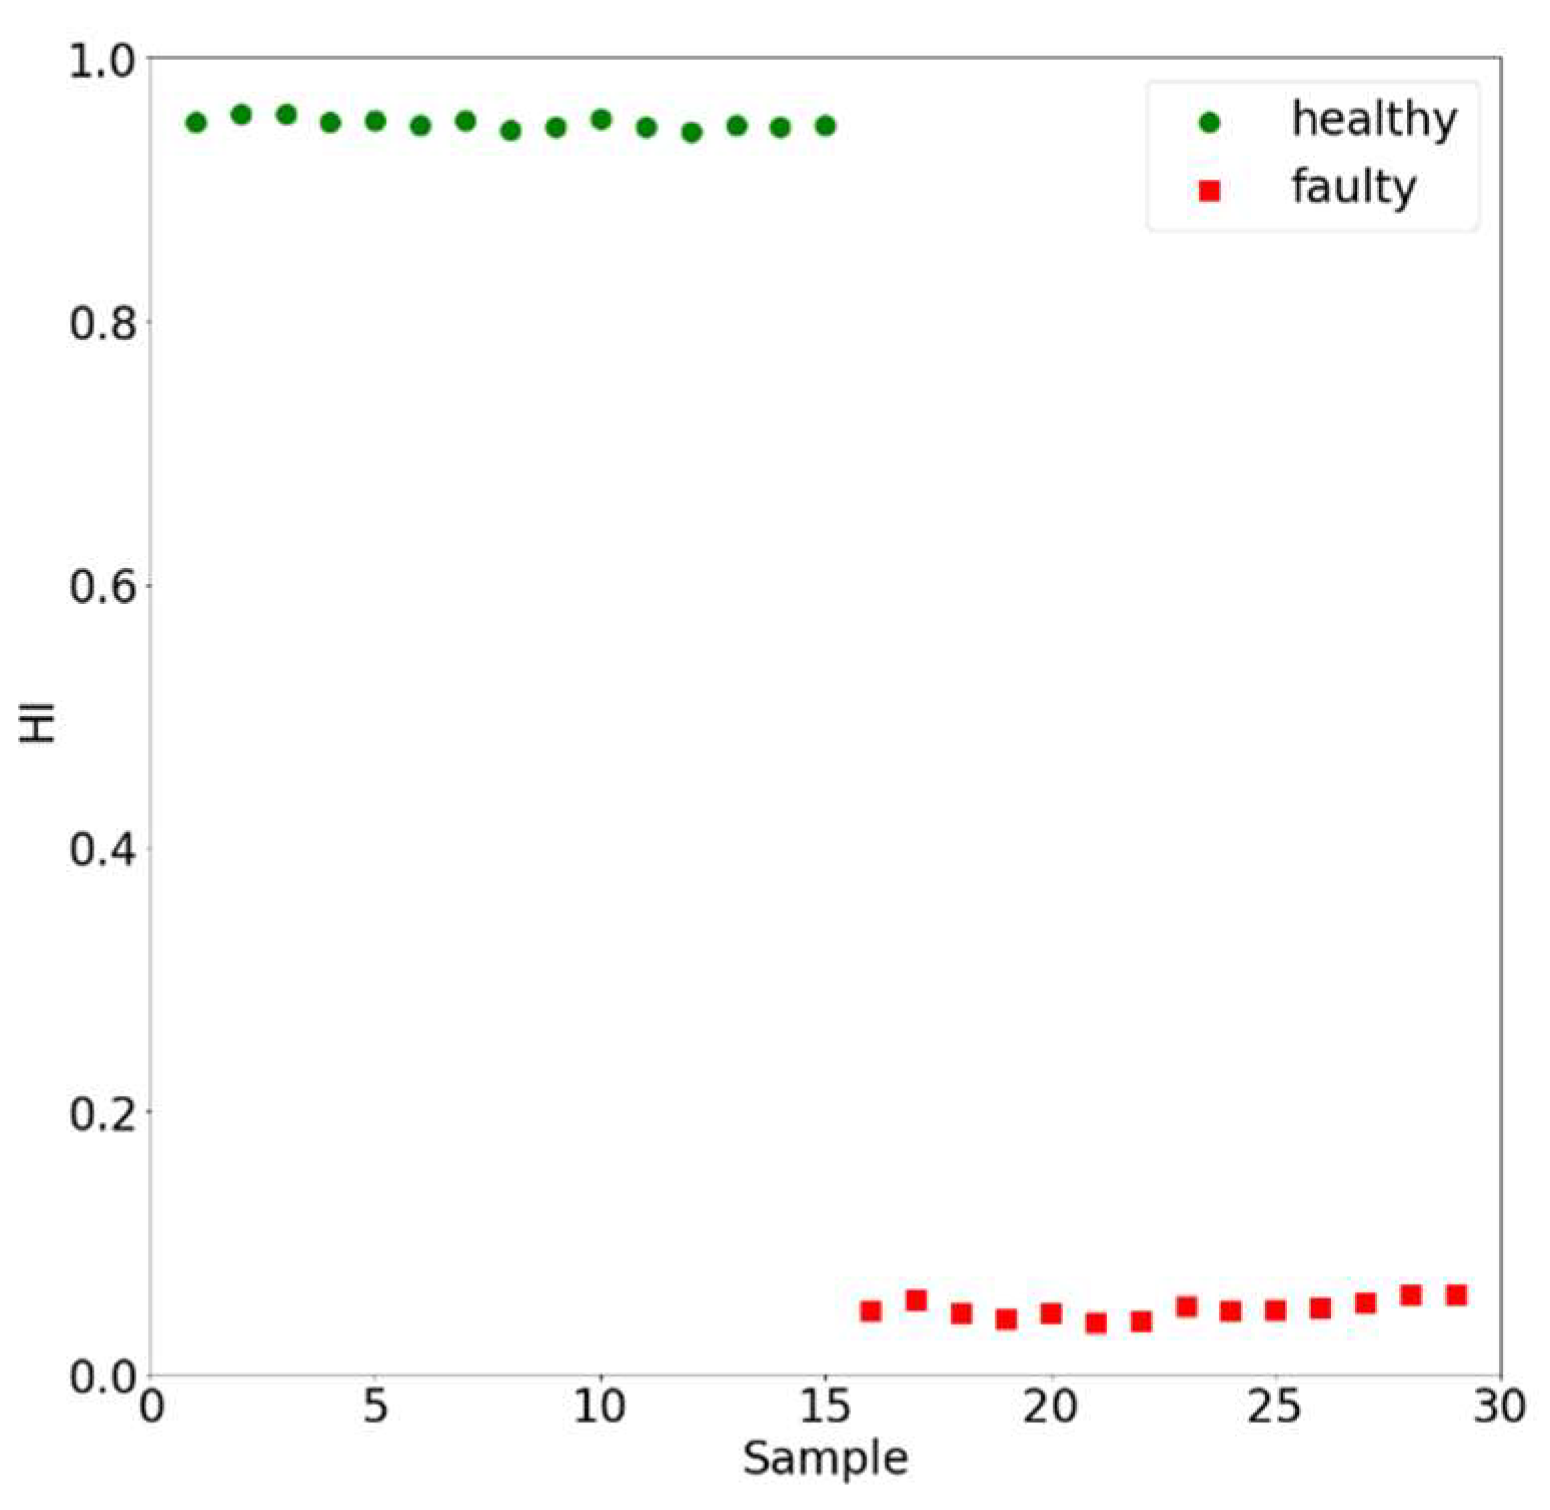
3.2. Calculating the Health Indicator Using the Logistic Regression Method

The logistic regression model is usually adopted to indicate the probability of the relationship between the healthy and faulty states. Determining the machine condition from daily maintenance records is a dichotomous problem that is represented by using a logistic regression function [35,36,37]. The concept of logistic regression is to find the best fitting model to describe the relationship between the probability of an event (constrained between 0 and 1) and a set of independent variables. The landing gear condition feature is a K -dimensional vector X i = ( x 1 i ,   x 2 i ,   ,   x k i ) and the landing gear state is y i (healthy state: y i = 1 ; faulty state: y i = 0 ). The health indicator (HI) can be described as:
HI = P ( y i = 1 | X i ) = e B X i 1 + e B X i
where B = ( β 1 ,   β 2 ,   ,   β k ) is the model parameter vector and β 0 > 0 . The logistic or logit regression model is:
Logit = ln HI 1 HI = B X i
Since logistic regression is nonlinear, the model parameters can be obtained using the log-likelihood method [37], in which the log-likelihood function (LLF) can be expressed as:
ln L ( B ) = i y i B X i l n ( 1 + e B X i )
Once the model parameters are identified, the health indicator of the landing gear can be calculated according to Equation (4).

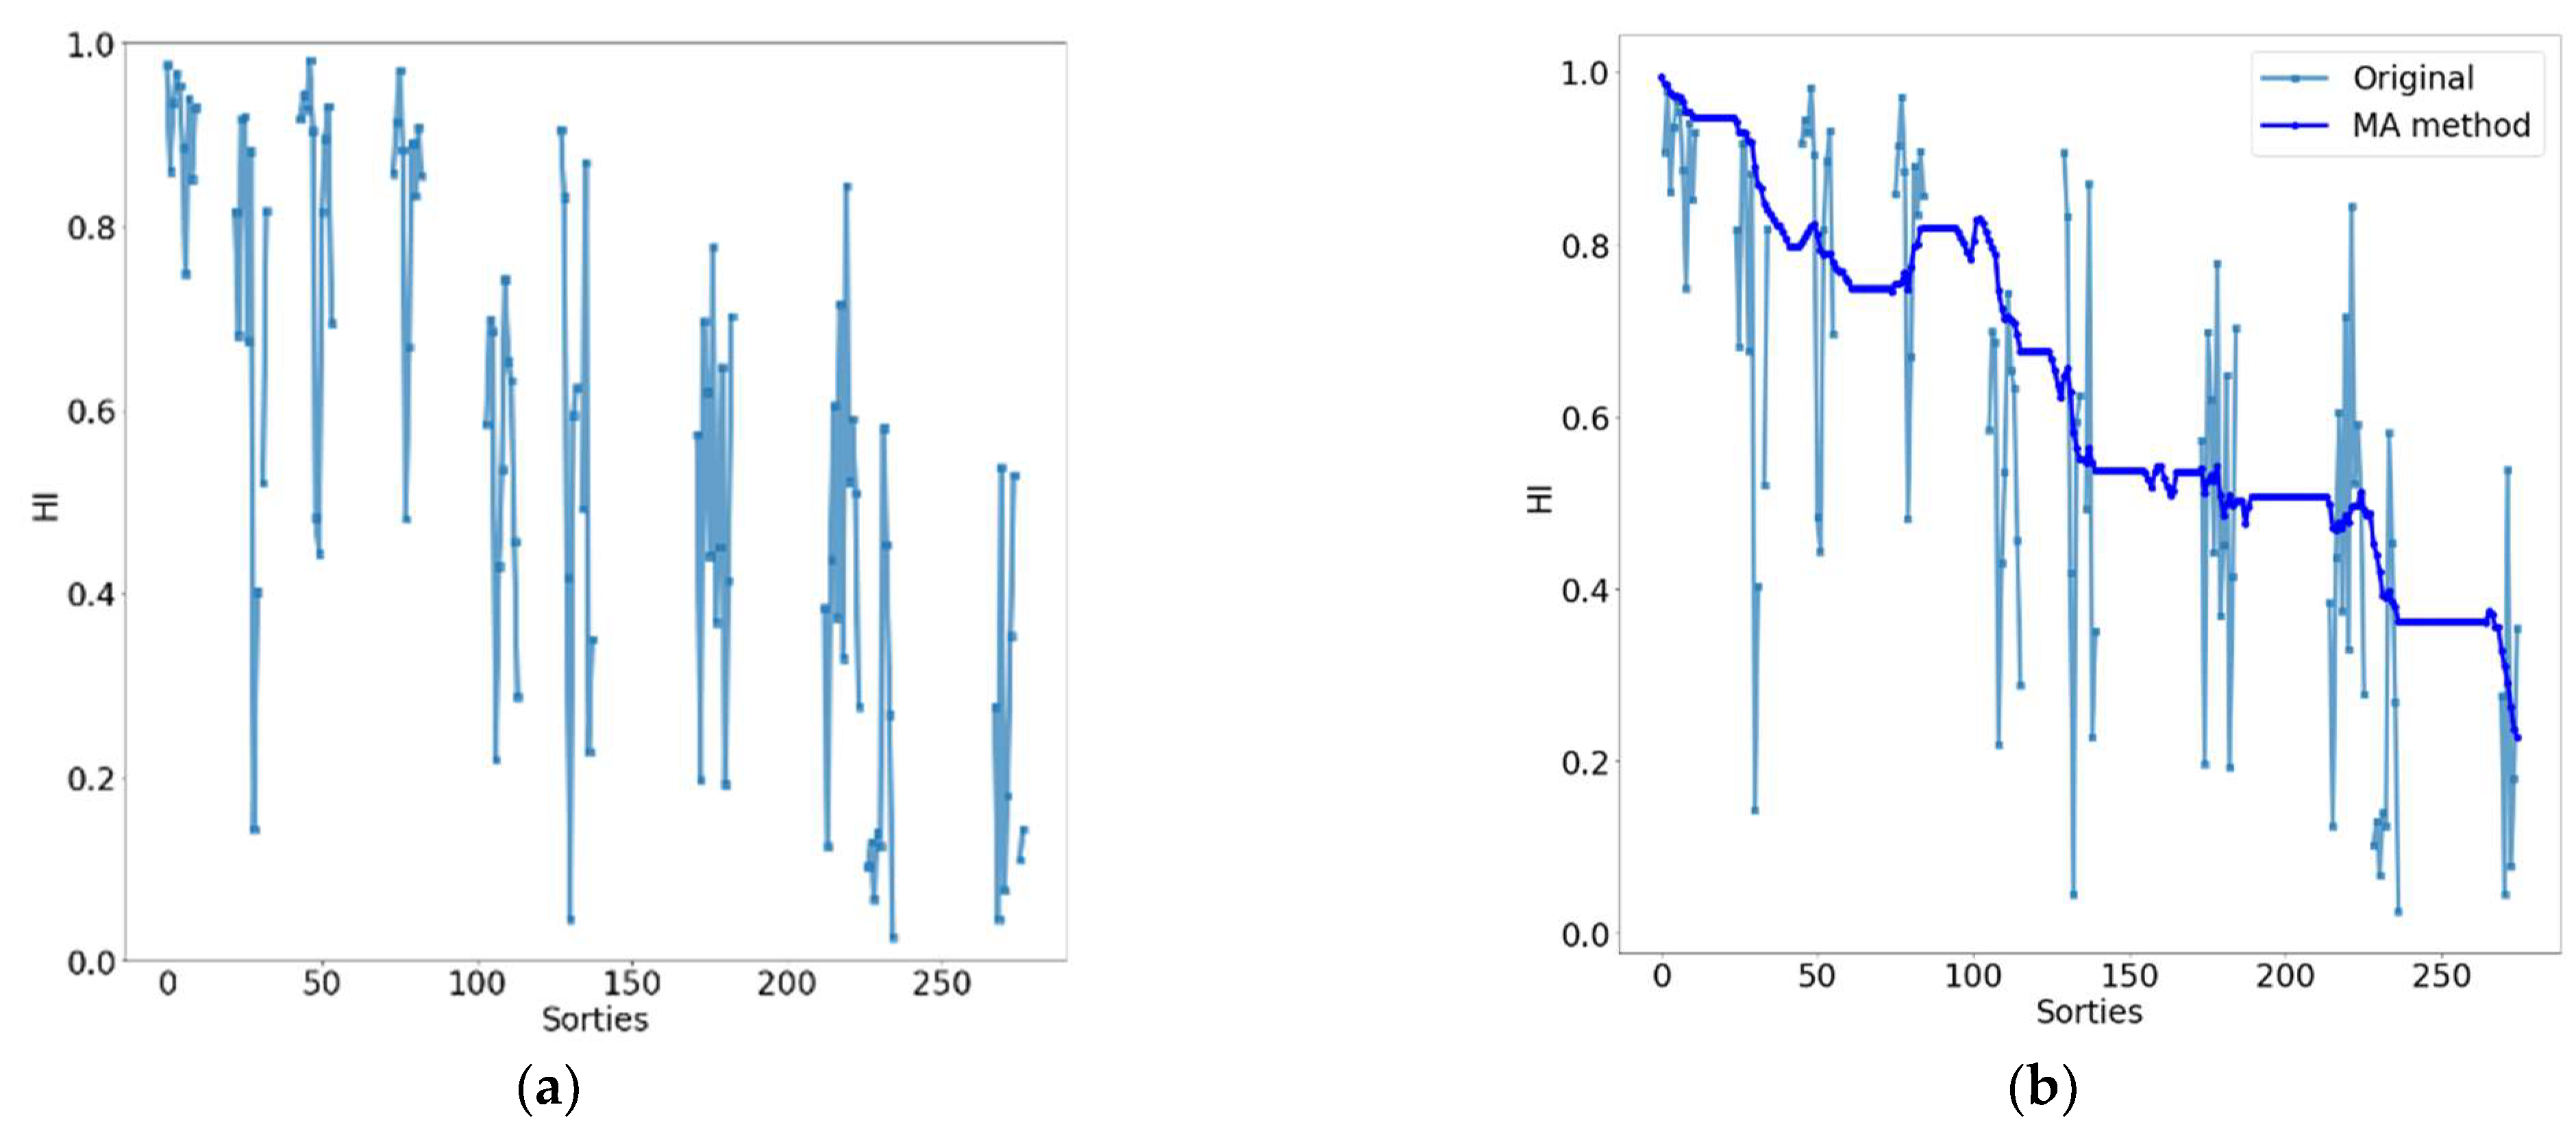
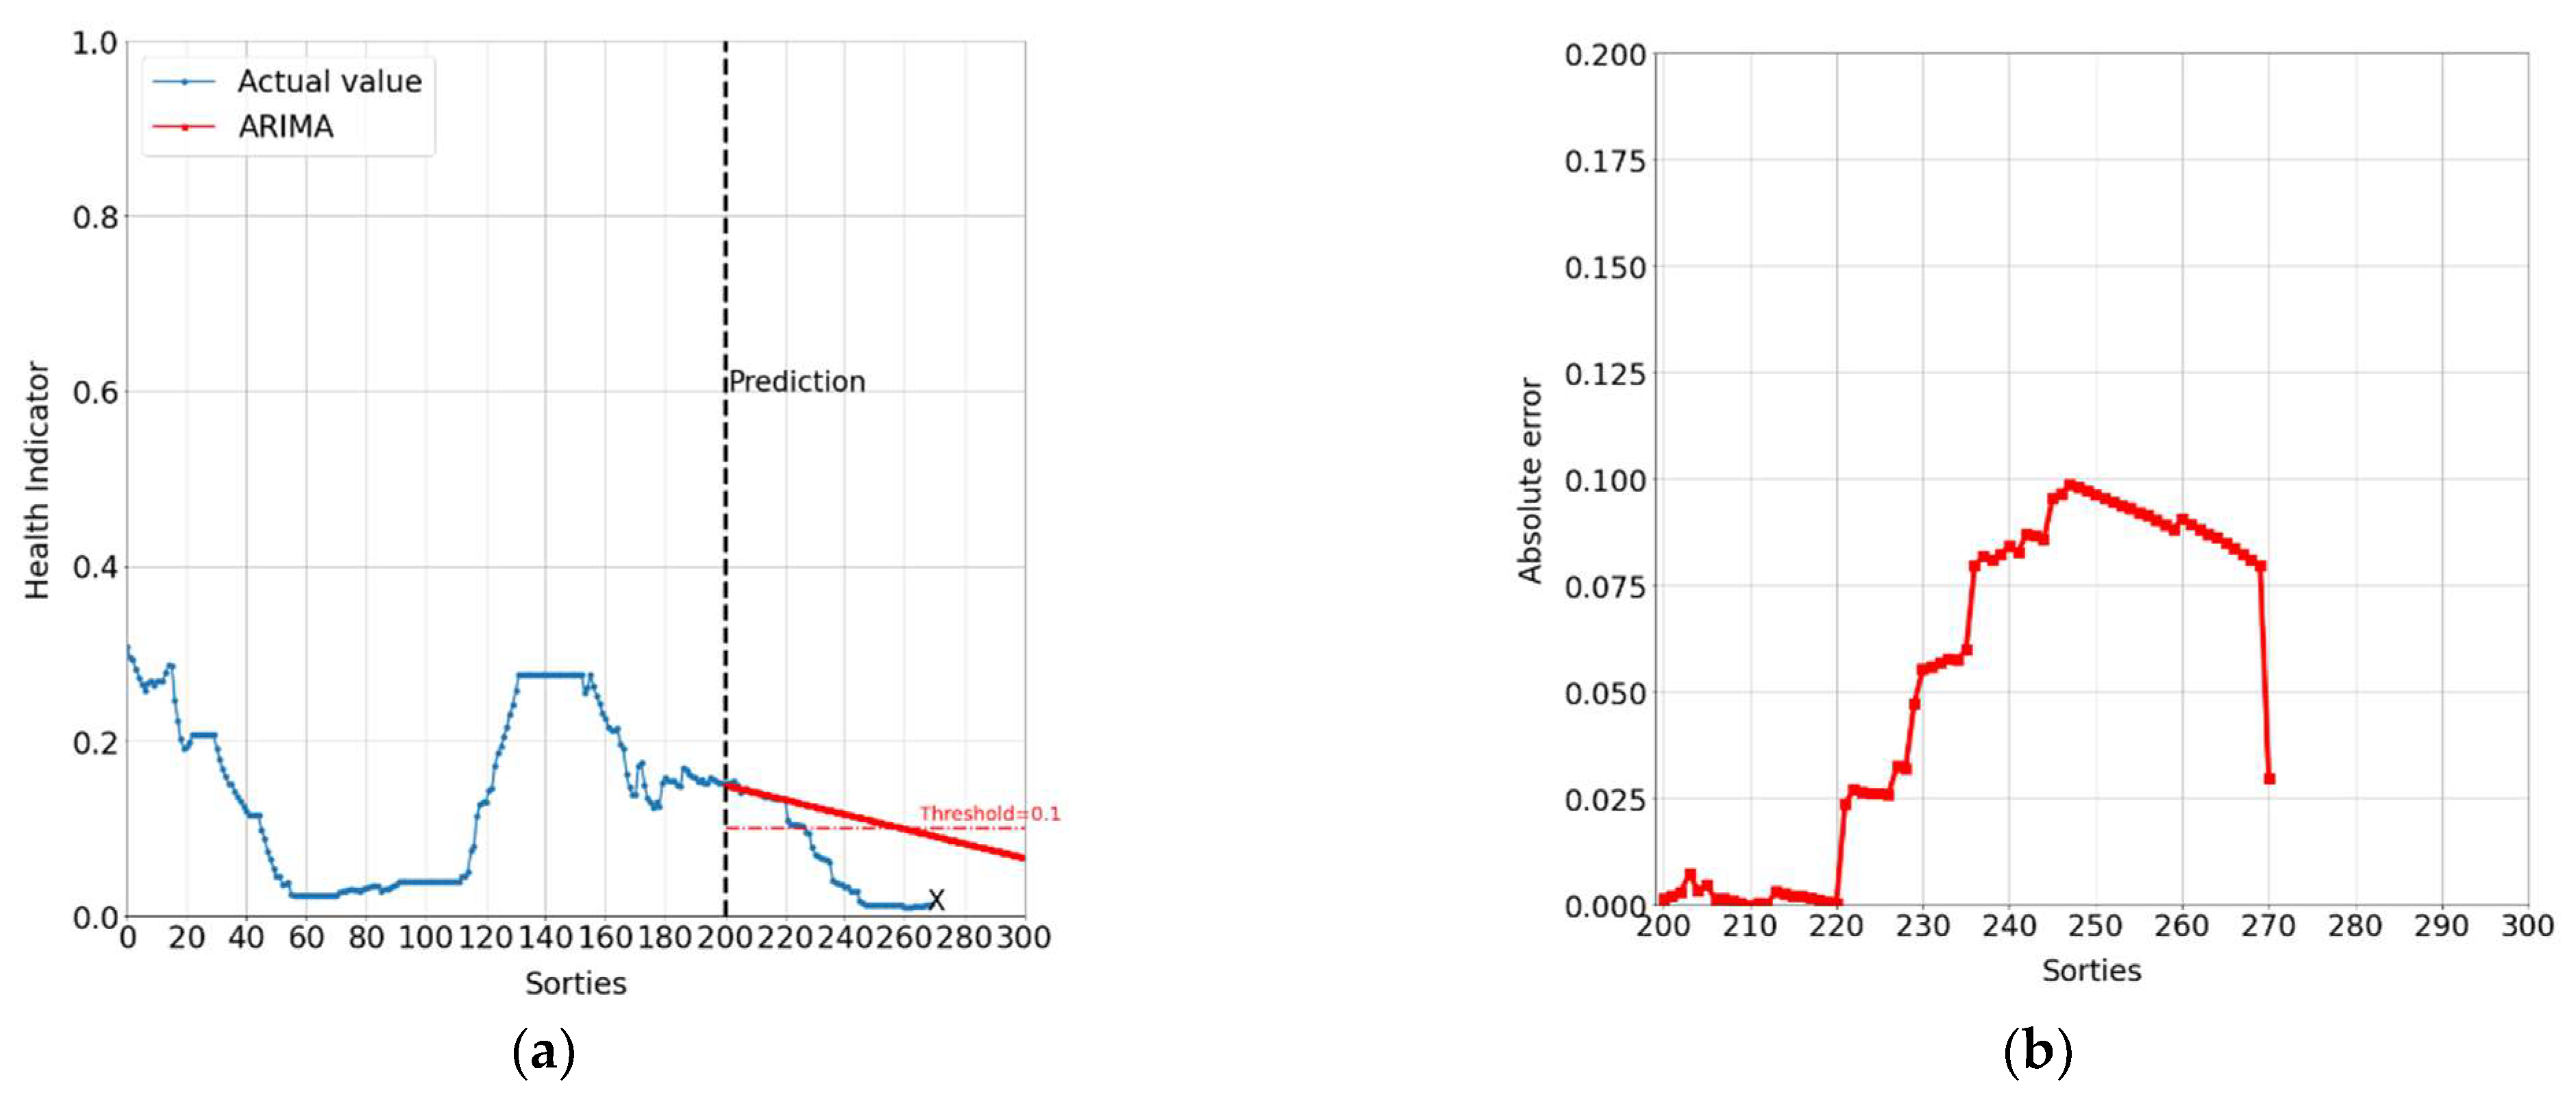
3.3. Predicting the Degradation Using the Moving Average Method and The ARIMA Model

Since the flight data were overwritten because of the lack of memory in the old FDR module, the health indicator calculated by the previous step is missing data. Missing data can have a significant effect on the estimation of the RUL. Appropriate corrective actions for missing data were considered before performing the degradation prediction. In recent decades, various techniques have been introduced to solve the problem of missing data [38]. The typical method utilized is the imputation approach, in which an estimate for the missing values is obtained and used. Imputation can be carried out via different techniques, which can be categorized as single or multiple imputations and as univariate or multivariate. Imputed values replace each of the missing values [38].
In this study, the moving average method was applied, which calculates the mean from an equal number of observations on either side of a central value.
Since long gaps of missing values could occur, the algorithm was designed to have an adaptive window size. For example, when there were less than n non-missing values in the entire available window, the window size would gradually increase to at least n non-missing values. In all other cases, the algorithm returned to the size of the preset window.
Finally, a well-known time-series prediction method proposed in the early 1970s, the ARIMA model [39], was applied. In ARIMA models, a non-stationary time series is made stationary by applying finite differencing of the data points. The mathematical formulation of the ARIMA (p, d, q) model may be written as follows [40]:
( 1 i = 1 p φ i L i ) ( 1 L ) d y t = ( 1 + j = 1 q θ j L j ) ε t
where p, d, and q are integers greater than or equal to zero and refer to the order of the model’s autoregressive, integrated, and moving average parts, respectively.

4. Results and Discussion

4.1. Health Indicator

Figure 4 presents the feature rankings based on the Fisher score. The threshold was empirically set to 1, with a Fisher score larger than 1 meaning the feature was a valuable feature. To explain this result, part of the top six features from the vibration signal between the healthy state and the faulty state are compared in Figure 5. Figure 5 demonstrates that a feature with a higher Fisher score can effectively identify healthy and faulty states. It also shows that although the sensor was not directly installed on the landing gear, the PHM method still had the potential to identify a healthy state and a faulty state.
According to the feature selection strategy for prognosis mentioned previously in Section 3.1.2, the monotonicity of valuable features from the preselection stage were validated, and the features were re-ranked by their slope value, as shown in Figure 6. One can easily see that the top two features have an excellent monotonic trend, and the top three to five features have the next best. A comparison of Fisher score rankings and slope value re-rankings is shown in Table 2. The top three features of both selection methods are the same, indicating that the valuable features selected from the Fisher score have good monotonicity; however, the feature ranking from the Fisher score was re-ranked. Therefore, the features “TO-Y-rms” and “TO-Y-std” that have both good classifying ability and good monotonicity were chosen for use in the HI model training.
The health indicator model based on logistic regression was trained with the two features selected previously. The health level of the healthy state data was set to be 0.95, and that of the faulty state data, 0.05. The training result of the HI model is shown in Figure 7.

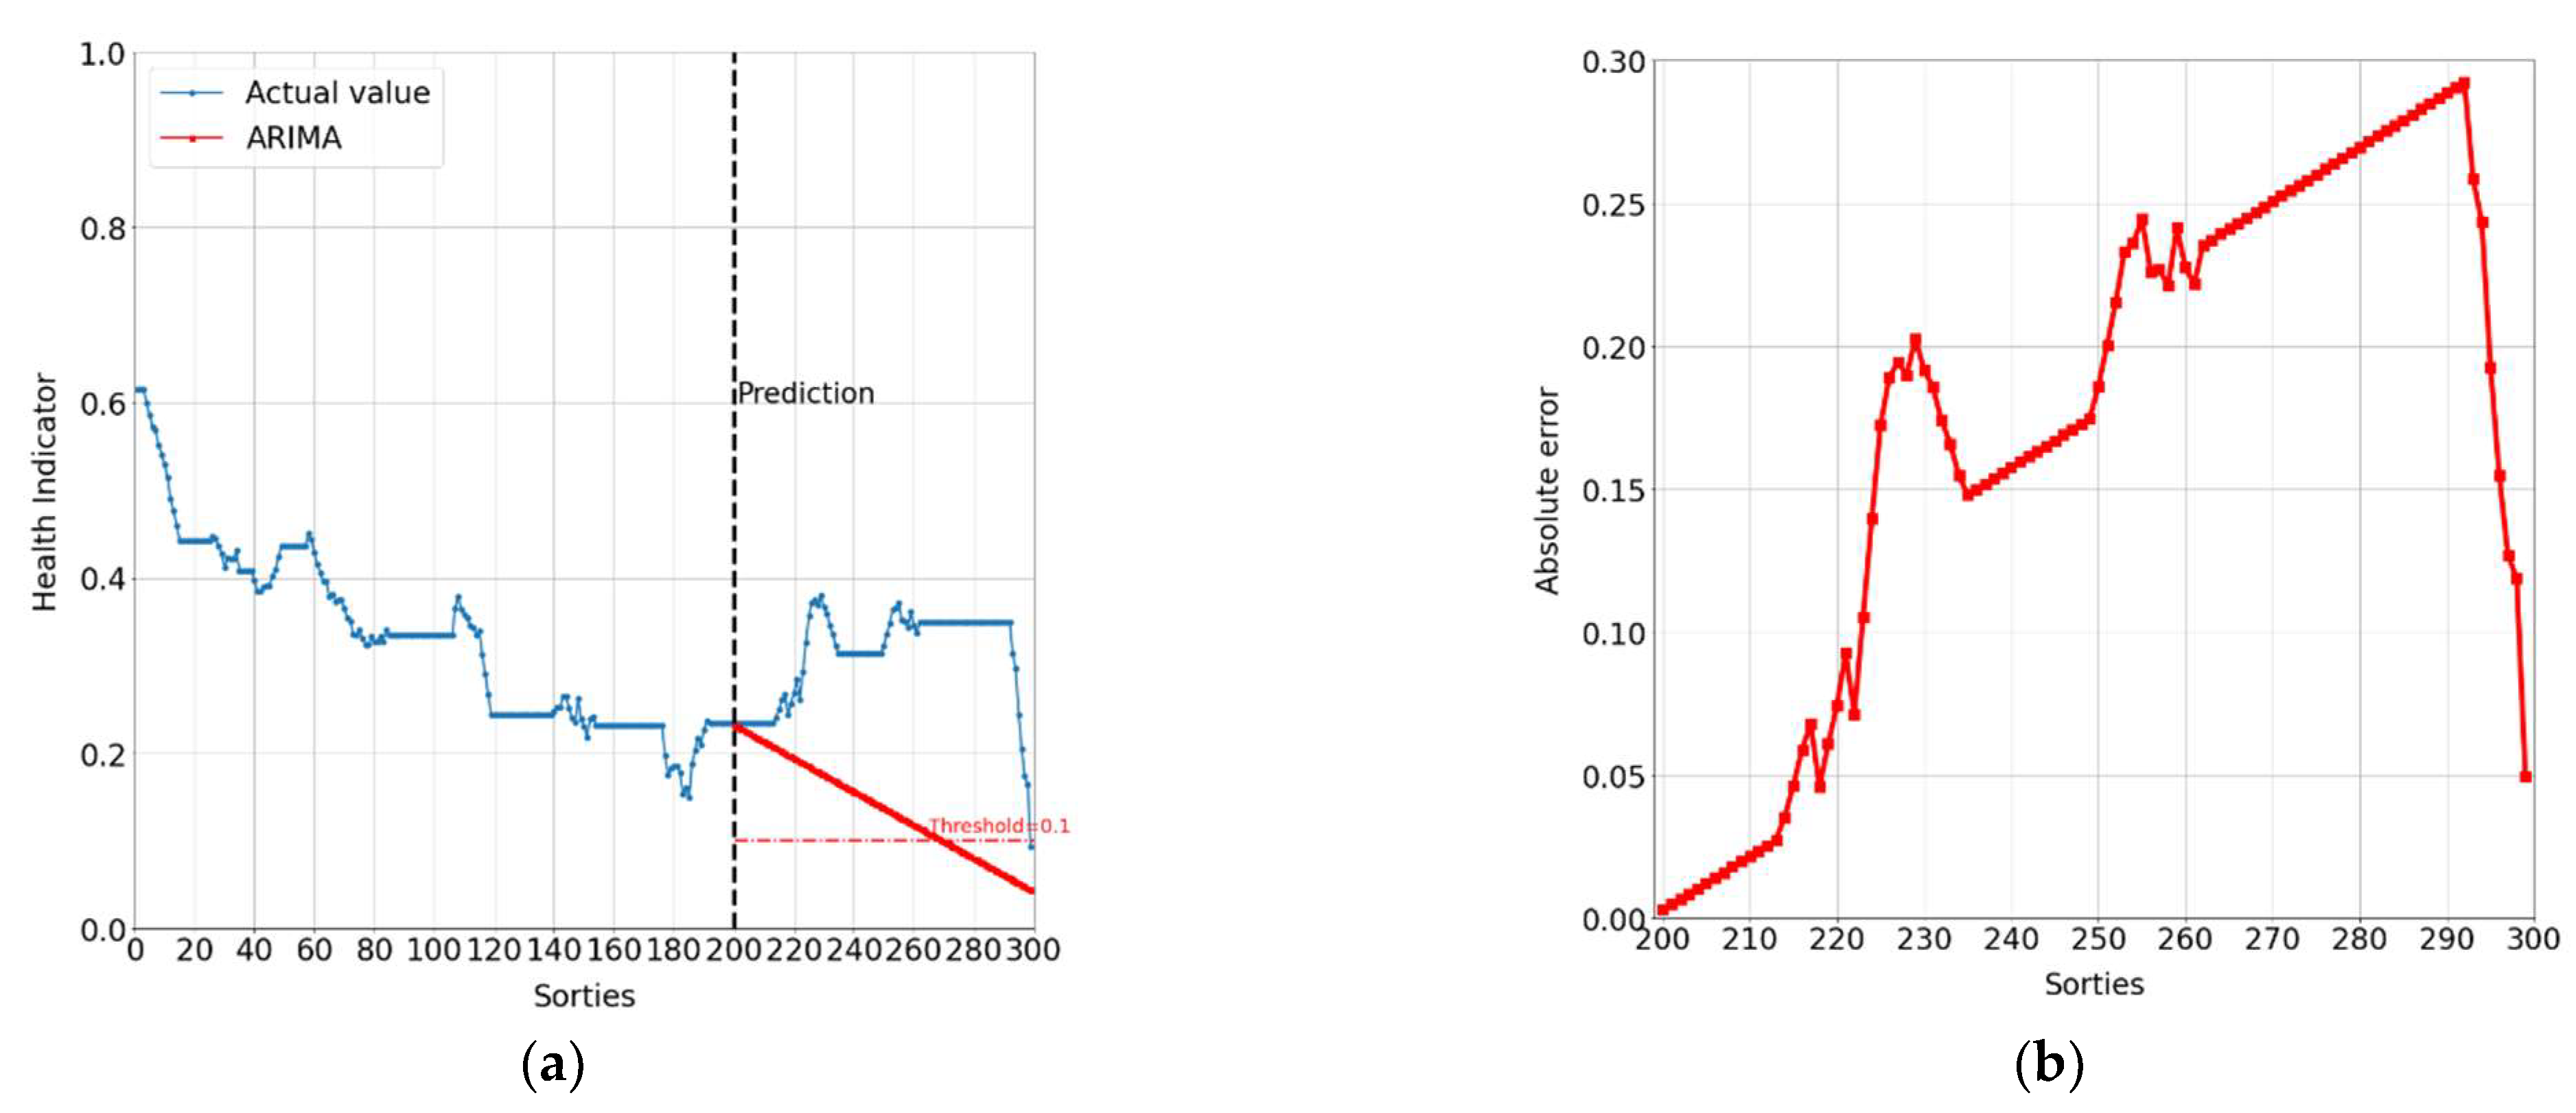
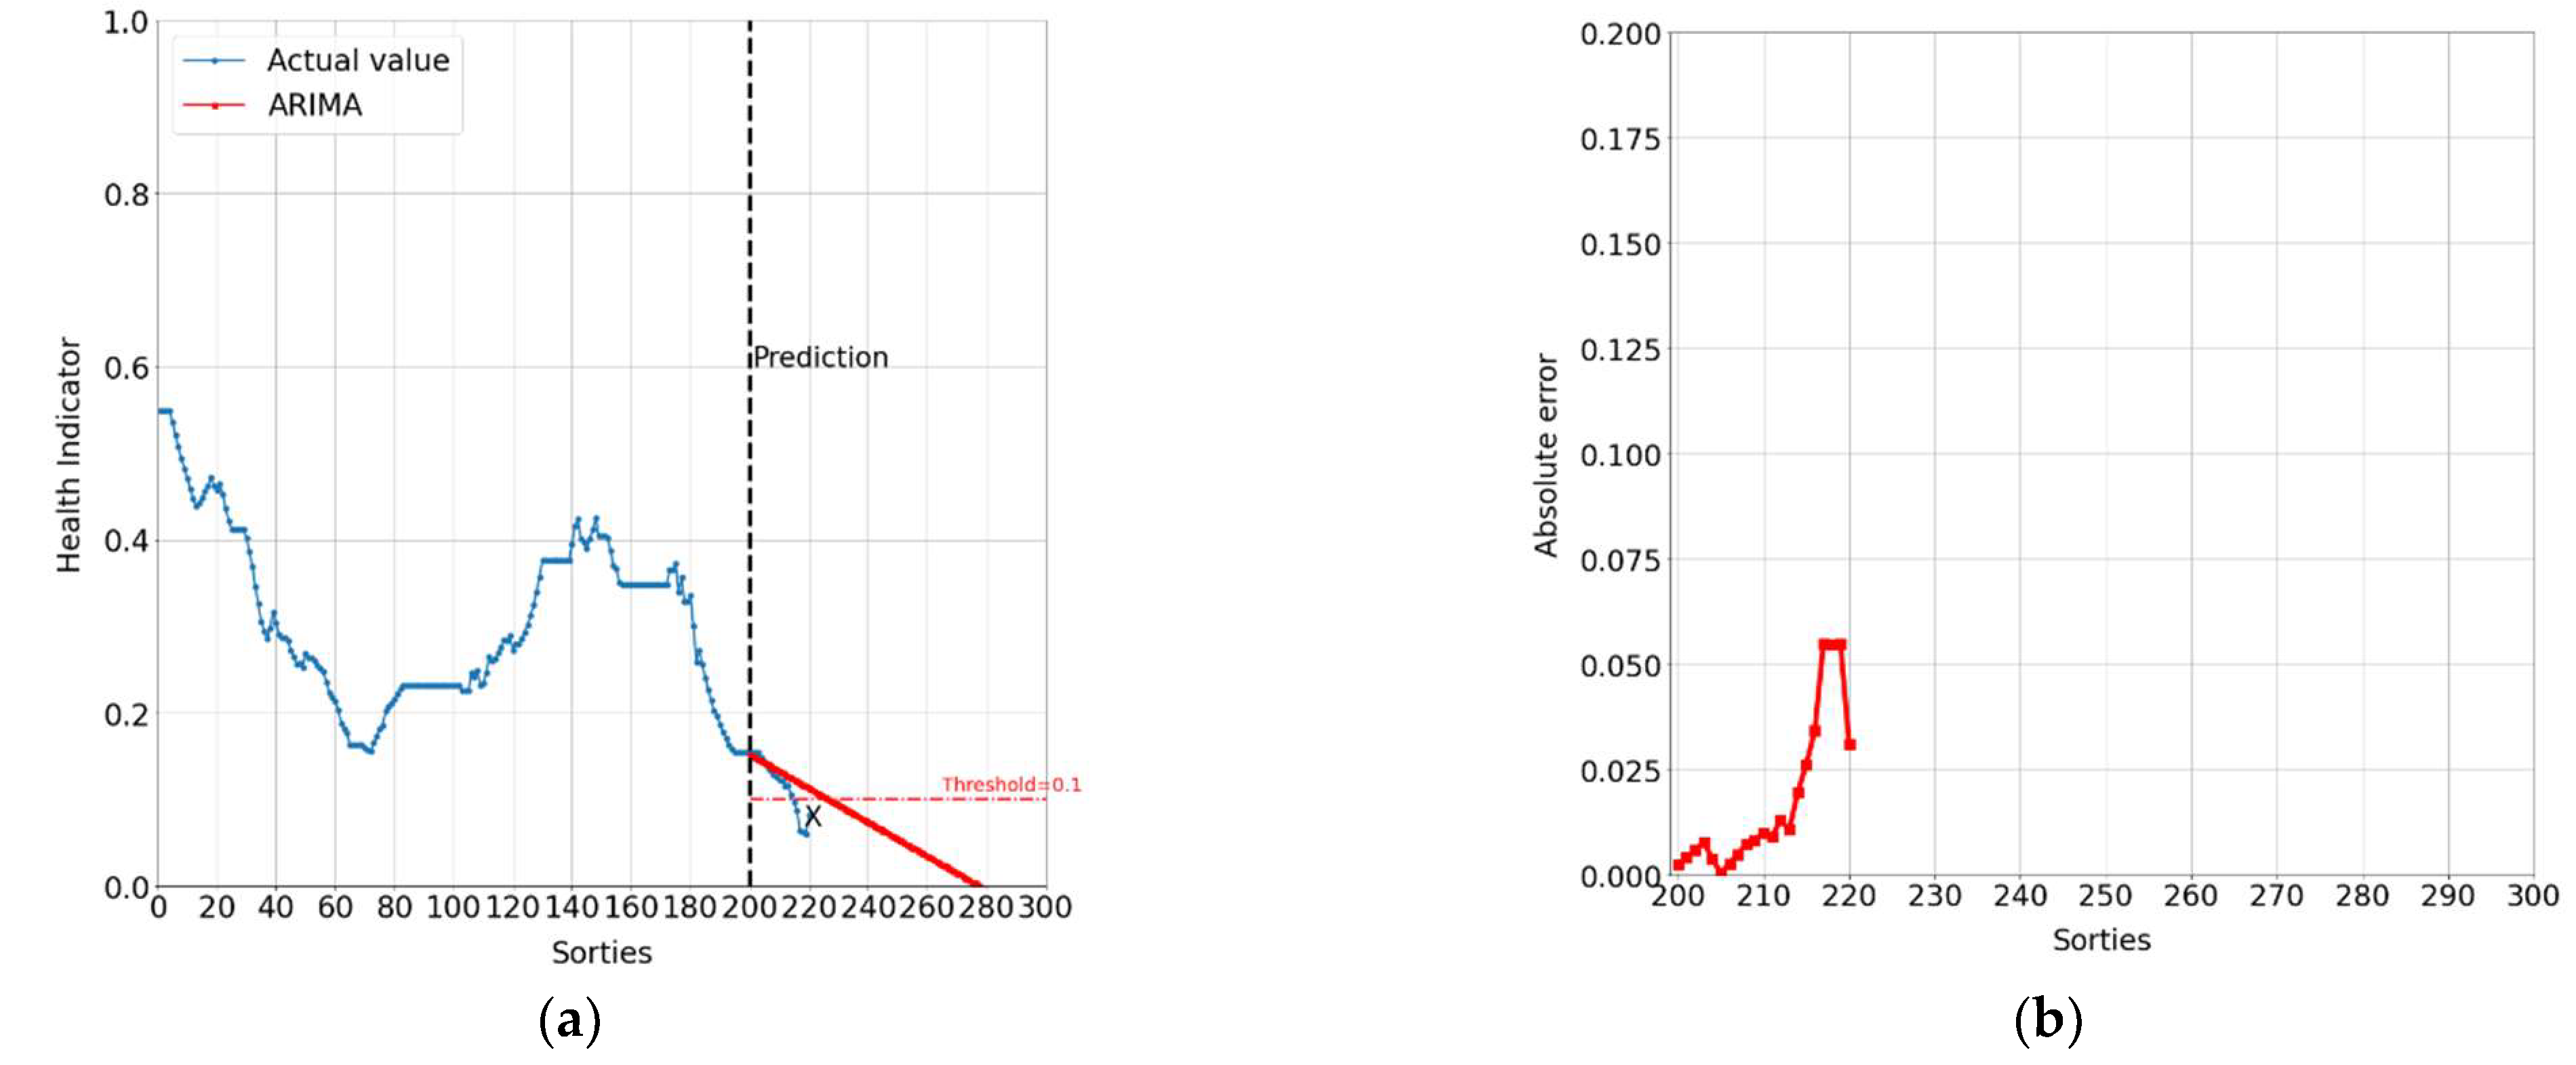
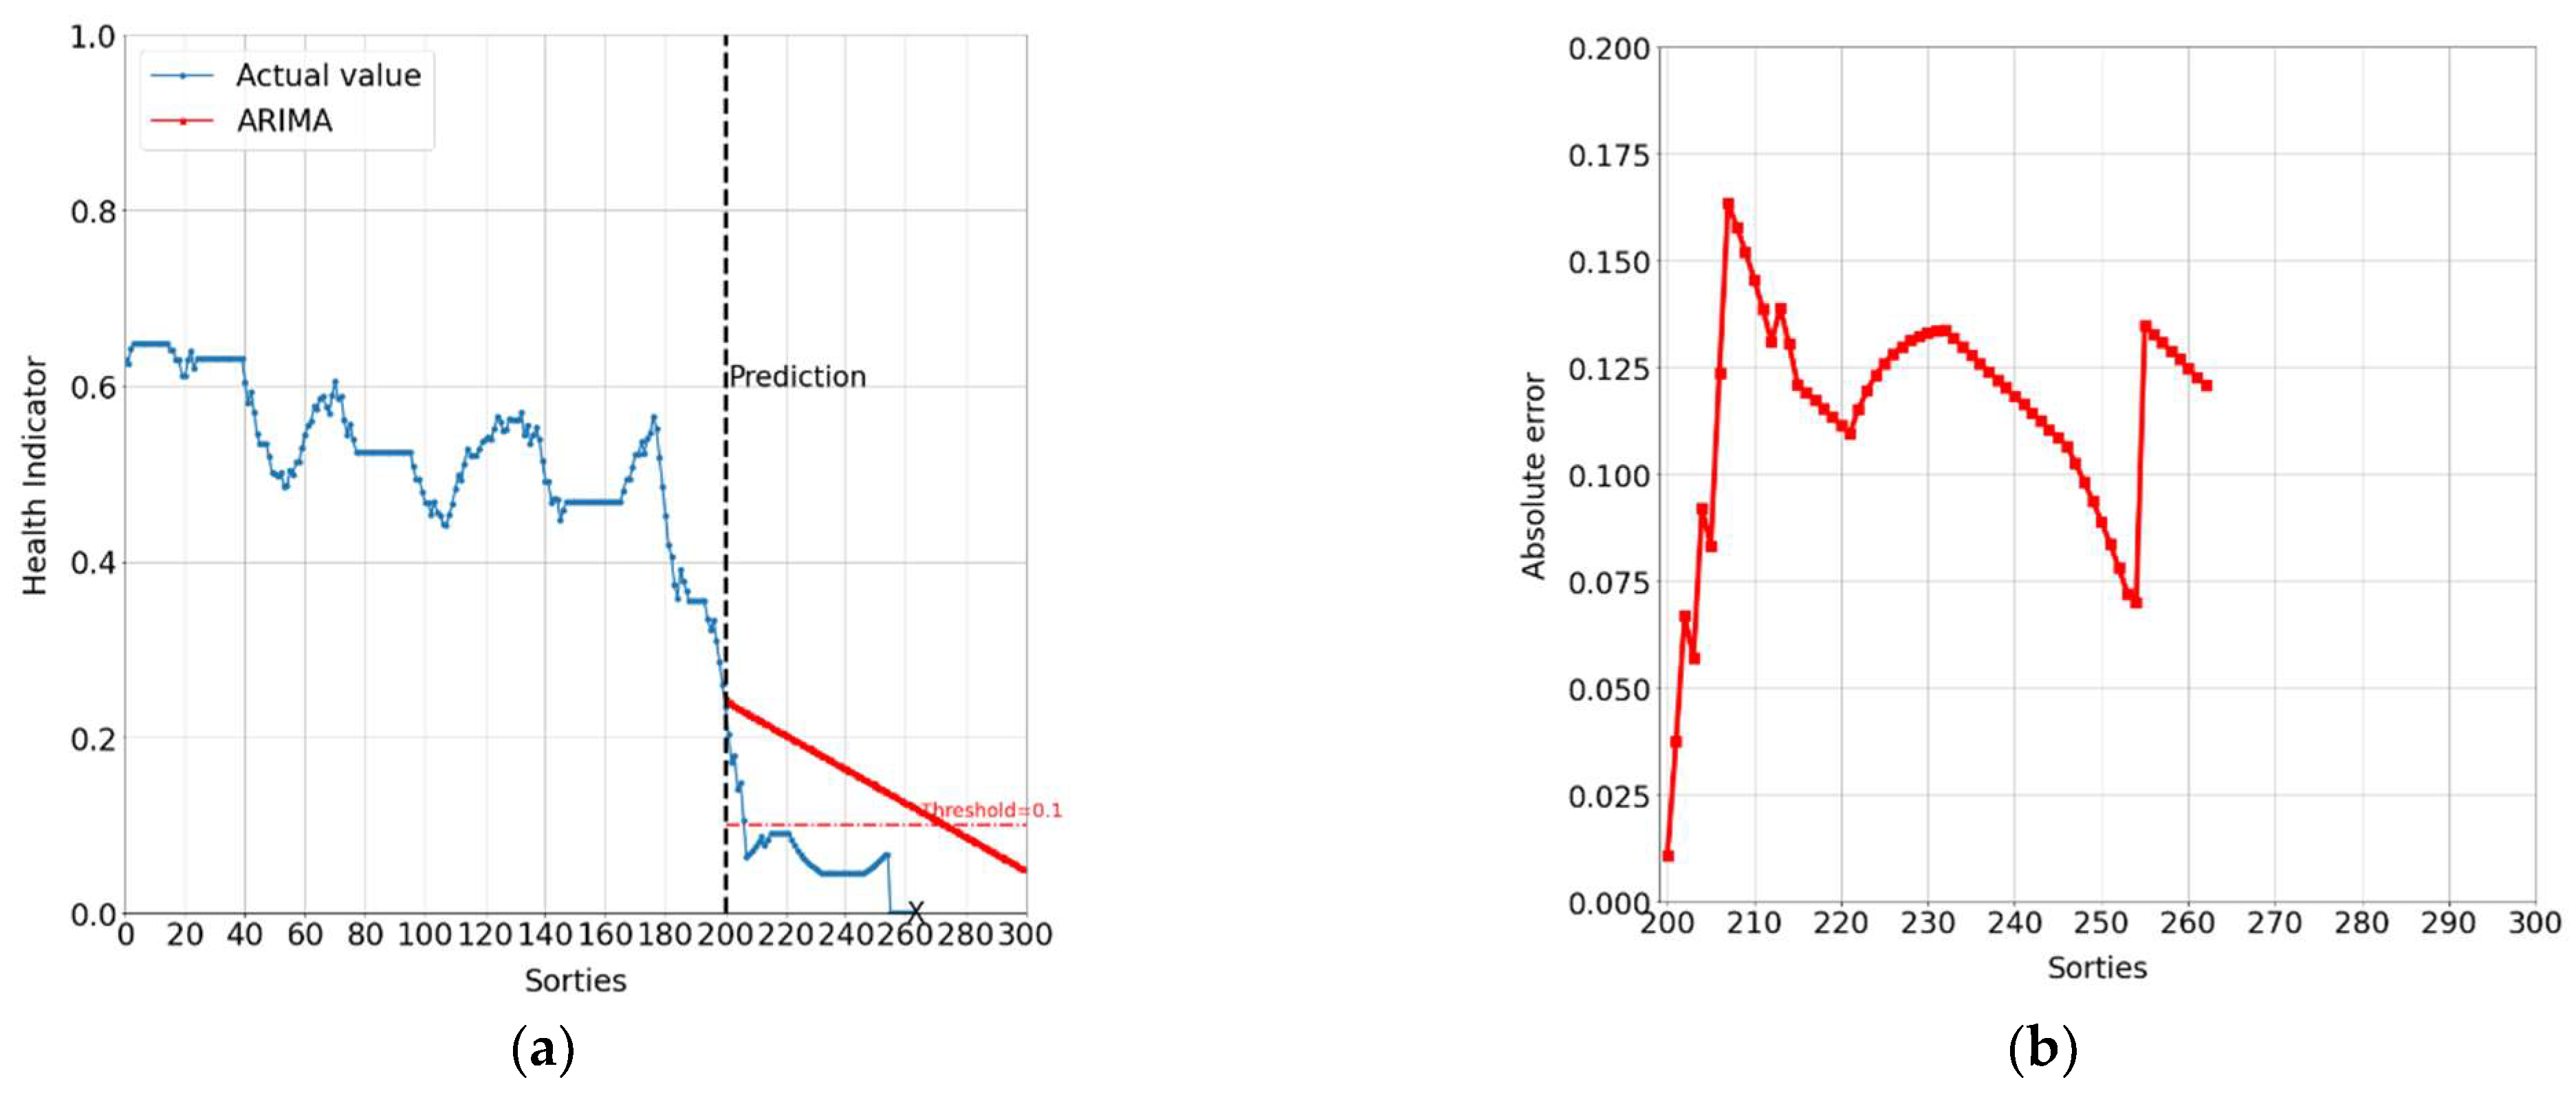
4.2. Remaining Useful Life

After obtaining the HI model, the HI of each plane’s landing gear can be calculated. A landing gear HI is shown in Figure 8a, where there are multiple gaps between an interval of sorties caused by the lack of memory of the aged FDR, and the value oscillates heavily due to the impact of the external factors, e.g., weather, runway condition, pilot’s input, etc. In Figure 8b, missing data were imputed by applying the moving average method, which gives a more reasonable trend to be used for estimating the RUL.
After applying the moving average method, the TSA was employed to predict the RUL based on the landing gear degradation trajectory. Two-thirds of the data were employed for training, and the remaining one-third for testing in the analysis set. The ARIMA model of order (2, 1, 0) was applied. In this case, data from 200 sorties made by each plane was used for training and predicting 100 future sorties. The model was evaluated by calculating the root mean square error (RMSE) of the HI between the predicted and the ground truth. Table 3 presents three evaluation metrics of the model. The first metric calculates the RMSE of the HI between the predictions and the ground truth from the beginning of the prediction till 40 sorties ahead. The second metric calculates the RMSE of the HI between the predictions and the ground truth from the beginning of the prediction till the last sorties of available ground truth. Finally, the last metric is the absolute error between the predictions and the ground truth from the beginning of the prediction till the last sorties of available ground truth. The detailed prediction details are shown in Figure 9, Figure 10, Figure 11, Figure 12 and Figure 13. The results show that the predictions of up to about 40 sorties ahead have an RMSE lower than 0.15, which is considered accurate. Fleet operators have stated that this level of accuracy of predicting 40 sorties ahead, which corresponds to a forewarning of 2–3 months, is enough for them to take action.
The landing gear depot-level maintenance must be performed when the CBM maintenance strategy is triggered or when the shimmy phenomenon is reported by the pilot. Table 4 presents the results of the RUL prediction, validated by also showing the actual time when depot-level maintenance action was taken. The predicted time to take maintenance action is determined by the HI threshold set by the fleet operator. It was 0.1 in this case. The threshold and the actual time of maintenance are also shown in Figure 9, Figure 10, Figure 11, Figure 12 and Figure 13, marked as “X”. The RUL, which is indicated by the number of sorties, is calculated from the time the prediction was made, and the error of the RUL is calculated by comparing the predicted time and the actual time when the maintenance actions were taken. The error shown in Table 4 has a range of about 30–40 sorties earlier and later than the actual time of maintenance; however, all predictions have their limitations, and as the “end of life” of the landing gear nears, the prediction will become more and more accurate. Furthermore, in actual practice the prediction will not be performed only once, but every time the data updates. Therefore, the fleet operator is able to continually adjust their fleet management plan, which is a major improvement over the original maintenance strategy.

5. Conclusions

This paper conducted a practical application of the systematic prognostics and health management (PHM) methodology for landing gear with minimal modifications on an in-service platform. This study aimed to demonstrate a state-of-the-art data-driven approach that can be performed despite the limitations of an in-service aircraft platform. Although the data preprocessing step is time-consuming and requires a certain level of domain knowledge, due to the effectiveness of the proposed methodology, there is potentially a wealth of data to be extracted and converted to meaningful information. In addition, this study also demonstrated the feasibility of a sensorless system with regard to using PHM in aerospace.
The analysis results demonstrated that the vibration signal from the built-in flight control accelerometer is valuable for fault identification. However, since the sensor was not close enough to the objective, the noise from other factors may have introduced complexity to the signal analysis and impacted the remaining useful life (RUL) prediction. Moreover, the lack of data storage memory due to the old standard flight data recorder module that was used also impaired the capacity for real-time monitoring.
In this study, the impact of noise and missing data was suppressed by applying the moving average method. As a result, the health indicator presented the clear trend of degradation of the landing gear, but was less sensitive than the original health indicator to an abrupt degradation event. This needs to be carefully considered for real-world applications. Nevertheless, the accuracy of the HI prediction and the result of the RUL prediction were accepted and validated by the fleet operator, which gives confidence to introduce this method on an in-service aircraft. Furthermore, this methodology turns into a system that aids decision-making in fleet management and lowers the risk of only relying on scheduled maintenance and the condition-based method.
This study has shown that there is still a significant margin between sensor-rich integration and system complexity, which directly affects the ease of maintenance and the ease of using an advanced system. Similar problems have already been seen on the F-35, the pioneer PHM implementation on aircraft. The Autonomic Logistics Information System has been plagued by troubles, from false alarms leading to unnecessary maintenance actions to laborious data entry requirements. It was also slow to boot up and difficult to update [41]. Therefore, for future works, implementing a built-in PHM system for next-generation aircraft and the practical needs around it requires further consideration, including sensor installation and ease of maintenance.

Author Contributions

Conceptualization, Y.-J.C. and T.-T.C.; methodology, Y.-J.C.; software, T.-H.H. and H.-K.H.; validation, Y.-J.C. and P.-W.H.; formal analysis, T.-H.H., H.-K.H. and Y.-J.C.; investigation, T.-T.C.; resources, Y.-J.C., T.-T.C. and P.-W.H.; data curation, T.-H.H. and H.-K.H.; writing—original draft preparation, T.-H.H.; writing—review and editing, Y.-J.C. and T.-T.C.; visualization, T.-H.H. and H.-K.H.; supervision, T.-T.C.; project administration, Y.-J.C.; funding acquisition, Y.-J.C., T.-T.C. and P.-W.H. All authors have read and agreed to the published version of the manuscript.

Funding

This research received no external funding.

Institutional Review Board Statement

Not applicable.

Informed Consent Statement

Not applicable.

Data Availability Statement

The data are not publicly available due to the Non-Disclosure Agreement with data provider.

Conflicts of Interest

The authors declare no conflict of interest.

References

  1. Czaban, M. Aircraft Corrosion—Review of Corrosion Processes and Its Effects in Selected Cases. Fatigue Aircr. Struct. 2018, 2018, 5–20. [Google Scholar] [CrossRef] [Green Version]
  2. Szrama, S.; Gill, A. Aircraft Operators Maintenance Decisions Supporting Method. Arch. Transp. 2021, 59, 93–111. [Google Scholar]
  3. Nowlan, F.S.; Heap, H.F. Reliability-Centered Maintenance; United Air Lines Inc.: San Francisco, CA, USA, 1978. [Google Scholar]
  4. Dhillon, B.S. Engineering Maintenance: A Modern Approach; CRC Press: Boca Raton, FL, USA, 2002. [Google Scholar]
  5. Chalifoux, A.; Baird, J. Reliability Centered Maintenance (RCM) Guide Operating a More Effective Maintenance Program; Construction Engineering Research Lab (Army): Champaign, IL, USA, 1999. [Google Scholar]
  6. Rausand, M.; Vatn, J. Reliability Centred Maintenance. In Complex System Maintenance Handbook; Springer: London, UK, 2008; pp. 79–108. [Google Scholar]
  7. Phillips, P.; Diston, D.; Starr, A.; Payne, J.; Pandya, S. A Review on the Optimisation of Aircraft Maintenance with Application to Landing Gears. In Engineering Asset Lifecycle Management; Kiritsis, D., Emmanouilidis, C., Koronios, A., Mathew, J., Eds.; Springer: London, UK, 2010; pp. 68–76. [Google Scholar]
  8. F-16s Gear Maintenance Is “Big Issue”. Available online: https://www.f-16.net/f-16-news-article2160.html (accessed on 16 May 2022).
  9. Kählert, A. Specification and Evaluation of Prediction Concepts in Aircraft Maintenance. Ph.D. Thesis, Technische Universität Darmstadt, Darmstadt, Germany, 2017. [Google Scholar]
  10. Heisey, R. Aero Magazine; Boeing Commercial Airplanes Group: Seattle, DA, USA, 2002; pp. 18–29. [Google Scholar]
  11. Knotts, R.M.H. Civil Aircraft Maintenance and Support Fault Diagnosis from a Business Perspective. J. Qual. Maint. Eng. 1999, 5, 335–348. [Google Scholar] [CrossRef]
  12. Lernbeiss, R.; Plöchl, M. Simulation Model of an Aircraft Landing Gear Considering Elastic Properties of the Shock Absorber. Proc. Inst. Mech. Eng. Part K J. Multi-Body Dyn. 2007, 221, 77–86. [Google Scholar] [CrossRef]
  13. Krüger, W.; Morandini, M. Numerical Simulation of Landing Gear Dynamics: State-of-the-Art and Recent Developments. In Proceedings of the AVT-152 Symposium on Limit Cycle Oscillation and Other Amplitude-Limited Self-Excited Vibrations, Loen, Norway, 1 January 2008. [Google Scholar]
  14. Smiley, R.F. Correlation, Evaluation, and Extension of Linearized Theories for Tire Motion and Wheel Shimmy; National Advisory Committee for Aeronautics: Moffett Field, CA, USA, 1956. [Google Scholar]
  15. Besselink, I.J.M. Shimmy of Aircraft Main Landing Gears. Ph.D. Thesis, Technische Universiteit Delft, Delft, The Netherlands, 2000. [Google Scholar]
  16. Arreaza, C.; Behdinan, K.; Zu, J.W. Linear Stability Analysis and Dynamic Response of Shimmy Dampers for Main Landing Gears. J. Appl. Mech. 2016, 83, 081002. [Google Scholar] [CrossRef]
  17. Krüger, W.; Besselink, I.; Cowling, D.; Doan, D.B.; Kortüm, W.; Krabacher, W. Aircraft Landing Gear Dynamics: Simulation and Control. Veh. Syst. Dyn. 1997, 28, 119–158. [Google Scholar] [CrossRef]
  18. Plakhtienko, N.P.; Shifrin, B.M. Critical Shimmy Speed of Nonswiveling Landing-Gear Wheels Subject to Lateral Loading. Int. Appl. Mech. 2006, 42, 1077–1084. [Google Scholar] [CrossRef]
  19. Khapane, P.D. Gear Walk Instability Studies Using Flexible Multibody Dynamics Simulation Methods in SIMPACK. Aerosp. Sci. Technol. 2006, 10, 19–25. [Google Scholar] [CrossRef]
  20. Denti, E.; Fanteria, D. Models of Wheel Contact Dynamics: An Analytical Study on the In-Plane Transient Responses of a Brush Model. Veh. Syst. Dyn. 2000, 34, 199–225. [Google Scholar] [CrossRef]
  21. Lok, S.K.; Paul, J.M.; Upendranath, V. Prescience Life of Landing Gear Using Multiaxial Fatigue Numerical Analysis. Procedia Eng. 2014, 86, 775–779. [Google Scholar] [CrossRef] [Green Version]
  22. Xue, C.J.; Dai, J.H.; Wei, T.; Liu, B.; Deng, Y.Q.; Ma, J. Structural Optimization of a Nose Landing Gear Considering Its Fatigue Life. J. Aircr. 2012, 49, 225–236. [Google Scholar] [CrossRef]
  23. Smeulers, J.P.M.; Zeelen, R.; Bos, A. PROMIS—A Generic PHM Methodology Applied to Aircraft Subsystems. Proc. IEEE Aerosp. Conf. 2002, 6, 6. [Google Scholar]
  24. Lee, J.; Wu, F.; Zhao, W.; Ghaffari, M.; Liao, L.; Siegel, D. Prognostics and Health Management Design for Rotary Machinery Systems—Reviews, Methodology and Applications. Mech. Syst. Signal Process. 2014, 42, 314–334. [Google Scholar] [CrossRef]
  25. Wang, Z.; Cui, Y.; Shi, J. A Framework of Discrete-Event Simulation Modeling for Prognostics and Health Management (PHM) in Airline Industry. IEEE Syst. J. 2017, 11, 2227–2238. [Google Scholar] [CrossRef]
  26. Zhang, Z.; Zhu, J.; Pan, F. Fault Detection and Diagnosis for Data Incomplete Industrial Systems with New Bayesian Network Approach. J. Syst. Eng. Electron. 2013, 24, 500–511. [Google Scholar] [CrossRef]
  27. Niu, G.; Jiang, J. Prognostic Control-Enhanced Maintenance Optimization for Multi-Component Systems. Reliab. Eng. Syst. Saf. 2017, 168, 218–226. [Google Scholar] [CrossRef]
  28. Gu, J.; Vichare, N.; Tracy, T.; Pecht, M. Prognostics Implementation Methods for Electronics. In Proceedings of the 2007 Annual Reliability and Maintainability Symposium, Orlando, FL, USA, 22–25 January 2007; pp. 101–106. [Google Scholar]
  29. Vichare, N.M.; Pecht, M.G. Prognostics and Health Management of Electronics. IEEE Trans. Compon. Packag. Technol. 2006, 29, 222–229. [Google Scholar] [CrossRef]
  30. Hecht, H. Why Prognostics for Avionics? In Proceedings of the 2006 IEEE Aerospace Conference, Big Sky, MT, USA, 4–11 March 2006; p. 6. [Google Scholar]
  31. Lei, Y.; He, Z.; Zi, Y.; Hu, Q. Fault Diagnosis of Rotating Machinery Based on Multiple ANFIS Combination with GAs. Mech. Syst. Signal Process. 2007, 21, 2280–2294. [Google Scholar] [CrossRef]
  32. Guyon, I.; Elisseeff, A. An Introduction to Variable and Feature Selection. J. Mach. Learn. Res. 2003, 3, 1157–1182. [Google Scholar] [CrossRef] [Green Version]
  33. Li, P.; Jia, X.; Feng, J.; Davari, H.; Qiao, G.; Hwang, Y.; Lee, J. Prognosability Study of Ball Screw Degradation Using Systematic Methodology. Mech. Syst. Signal Process. 2018, 109, 45–57. [Google Scholar] [CrossRef]
  34. Fukunaga, K. Introduction to Statistical Pattern Recognition; Elsevier: Amsterdam, The Netherlands, 2013; ISBN 978-0-08-047865-4. [Google Scholar]
  35. Hosmer, D.W., Jr.; Lemeshow, S.; Sturdivant, R.X. Applied Logistic Regression; John Wiley & Sons: Hoboken, NJ, USA, 2013; ISBN 978-0-470-58247-3. [Google Scholar]
  36. Cao, X.; Jiang, P.; Zhou, G. Facility Health Maintenance through SVR-Driven Degradation Prediction. Int. J. Mater. Prod. Technol. 2008, 33, 185–193. [Google Scholar] [CrossRef]
  37. Houston, W.M.; Woodruff, D.J. Empirical Bayes Estimates of Parameters from the Logistic Regression Model; ACT Research Report Series 97-6; ACT Inc.: Iowa City, IA, USA, 1997. [Google Scholar]
  38. Little, R.J.A.; Rubin, D.B. Statistical Analysis with Missing Data; John Wiley & Sons: Hoboken, NJ, USA, 2019; ISBN 978-0-470-52679-8. [Google Scholar]
  39. Box, G.E.P.; Jenkins, G.M.; Reinsel, G.C.; Ljung, G.M. Time Series Analysis: Forecasting and Control; John Wiley & Sons: Hoboken, NJ, USA, 2015; ISBN 978-1-118-67492-5. [Google Scholar]
  40. Adhikari, R.; Agrawal, R.K. An Introductory Study on Time Series Modeling and Forecasting. arXiv 2013, arXiv:1302.6613. [Google Scholar]
  41. Tirpak, J.A. Lockheed Mixed Up Structural Fasteners in F-35s. Air Force Mag. 2020, 103, 22–24. [Google Scholar]
Figure 1. Maintenance–time relationships. Adapted with permission from Ref. [11]. Copyright © 1999, Emerald Publishing Limited.
Aerospace 09 00462 g001
Figure 2. Shimmy phenomenon. Adapted with permission from Ref. [12]. Copyright © 2007, SAGE Publications.
Aerospace 09 00462 g002
Figure 3. The overall procedure of proposed method.
Aerospace 09 00462 g003
Figure 4. Preselection for valuable features.
Aerospace 09 00462 g004
Figure 5. Top six ranking features from the vibration signal: (a) healthy and (b) faulty.
Aerospace 09 00462 g005
Figure 6. Feature ranking based on slope value.
Aerospace 09 00462 g006
Figure 7. The training result of the HI model.
Aerospace 09 00462 g007
Figure 8. Landing gear’s HI: (a) original and (b) with missing data imputed using the moving average method.
Aerospace 09 00462 g008
Figure 9. Prediction of the landing gear HI for Plane #1: (a) results and (b) absolute error of estimated twenty sorties.
Aerospace 09 00462 g009
Figure 10. Prediction of the landing gear HI for Plane #2: (a) results and (b) absolute error of estimated twenty sorties.
Aerospace 09 00462 g010
Figure 11. Prediction of the landing gear HI for Plane #3: (a) results and (b) absolute error of estimated twenty sorties.
Aerospace 09 00462 g011
Figure 12. Prediction of the landing gear HI for Plane #4: (a) results and (b) absolute error of estimated twenty sorties.
Aerospace 09 00462 g012
Figure 13. Prediction of the landing gear HI for Plane #5: (a) results and (b) absolute error of estimated twenty sorties.
Aerospace 09 00462 g013
Table 1. Definitions of the feature parameters.
FeatureDefinition
Peak-to-peak x p 2 p = | max x min x |
Mean x m = μ = 1 N j = 1 N x j
Root mean square x r m s = 1 N j = 1 N ( x j ) 2
Standard deviation x s t d = σ = 1 N 1 j = 1 N ( x j μ ) 2
Skewness x s k = j = 1 N ( x j μ ) 3 ( N 1 ) σ 3
Kurtosis x k u = j = 1 N ( x j μ ) 4 ( N 1 ) σ 4
Crest indicator x c i = m a x | x | ( 1 / N ) j = 1 N ( x j ) 2
Clearance indicator x c l i = m a x | x | ( ( 1 / N ) j = 1 N | x j | ) 2
Shape indicator x s i = ( 1 / N ) j = 1 N ( x j ) 2 ( 1 / N ) j = 1 N | x j |
Impulse indicator x m i = m a x | x | ( 1 / N ) j = 1 N | x j |
where x j is a signal series for n = 1 , 2 ,   , N and N is the number of data points.
Table 2. Features re-ranked by slope value.
FeatureRanked by Fisher ScoreRanked by Slope Value
TO-Y-peak2peak13
TO-Y-rms21
TO-Y-std32
Table 3. Results of the HI prediction error for the landing gear on five planes.
Plane NumberRMSE
(40 Sorties Ahead)
RMSE
(Till the Last Sorties)
Error Range
(Till the Last Sorties)
Plane #10.0370.065(71 sorties)[−0.007, 0.099]
Plane #20.1140.195(100 sorties)[−0.293, −0.003]
Plane #30.025(21 sorties) *0.025(21 sorties)[−0.008, 0.055]
Plane #40.0220.023(56 sorties)[−0.014, 0.029]
Plane #50.1220.118(63 sorties)[0.011, 0.163]
* The maintenance action was taken before 40 sorties; thus, there is no available data afterwards.
Table 4. Results of the RUL predictions for the landing gear on five planes.
Plane NumberPredicted RUL
(Sorties)
Predicted Maintenance SortieActual
Maintenance Sortie
Error
(Sorties)
Plane #16026027111 (earlier)
Plane #270270N/A *>30(earlier) *
Plane #3272272216 (behind)
Plane #49429425638 (behind)
Plane #57427426311 (behind)
* The aircraft’s landing gear needs maintenance soon, but maintenance action has not yet been taken.
Publisher’s Note: MDPI stays neutral with regard to jurisdictional claims in published maps and institutional affiliations.

