Article

Quantitative Clarification of Stable Ignition Region for HKP110 Green Hypergolic Bipropellant

Research Unit II, Directorate of Research and Development, Japan Aerospace Exploration Agency, 2-1-1 Sengen, Tsukuba 305-8505, Ibaraki, Japan
*
Author to whom correspondence should be addressed.
Aerospace 2022, 9(3), 129; https://doi.org/10.3390/aerospace9030129
Submission received: 14 February 2022 / Revised: 27 February 2022 / Accepted: 28 February 2022 / Published: 2 March 2022

Abstract

:
As a candidate for a green hypergolic bipropellant, the combination of highly concentrated hydrogen peroxide and fuel with dissolved sodium borohydride has been widely studied. In this study, a drop test using such a green hypergolic bipropellant was conducted to investigate the stable ignition region in terms of the mixture ratio. As a result, stagnation phenomena of flame growth were observed in high mixture ratio conditions. In addition, impinging-jet tests using a windowed chamber were conducted with the green hypergolic bipropellant to observe the ignition phenomena inside the combustion chamber. As a result, unstable ignition phenomena were observed in oxidizer-lead injection cases. Besides the unstable ignition, hard starts occurred several times during the test series. Data analysis demonstrated that controlling the transient mixture ratio in the early phase of injection is essential for preventing unstable ignition and hard starts. The quantitative threshold of mixture ratio for stable ignition was clarified based on the test results.

1. Introduction

Traditionally, the combination of hydrazine or monomethylhydrazine (MMH) and nitrogen tetroxide (NTO) has been widely used as propellants for thrusters of satellites and spacecraft. These propellants have good storability at room temperature and hypergolicity, which means that they can be ignited simply by mixing them. This property makes highly responsive and reliable thrusters possible. However, the high toxicity of these propellants has increased the life-cycle costs of the propulsion system, such as the mandatory use of Self-Contained Atmospheric Protective Ensemble (SCAPE) suits in propellant loading operations and the high maintenance costs for ground equipment. Some launch sites do not have the facilities to handle toxic propellants such as hydrazine, which can constrain satellite design. Additionally, hydrazine has been designated as a substance of very high concern (SVHC) under the REACH regulation in the EU. This means that its use will be restricted in the future [1]. Thus, research on low-toxicity propellants has become active worldwide.
As a candidate for a less toxic hypergolic bipropellant, the combination of highly concentrated hydrogen peroxide and some types of fuel with a catalytic agent or reducing agent dissolved has been studied by many researchers [2,3,4,5,6,7,8,9,10,11]. This type of hypergolic bipropellant was originally developed in the Naval Air Warfare Center Weapons Division (NAWCWD) [2,3,4,5]. In this research, triglyme or diethylenetriamine with dissolved sodium borohydride was selected as the best fuel; it is hypergolic with highly concentrated hydrogen peroxide. These and similar fuels have been studied for years [8,9,10,11,12]. The authors of this paper introduced a new fuel blend, HKP110, in previous research [13,14]. This fuel consists of 3-methylaminopropylamine (MAPA) with 10 wt% of sodium borohydride dissolved as an ignition source. This fuel has an excellent hypergolic property with highly concentrated hydrogen peroxide. The shortest ignition delay measured by a drop test is approximately 2 ms, almost equivalent to a conventional toxic bipropellant [15]. HKP110 has 98.3% of the theoretical Isp of MMH/NTO, whereas its toxicity is much lower than that of hydrazine and its derivatives. Table 1 shows the details of HKP110 and Figure 1 shows the theoretical Isp and adiabatic temperature of HKP110/98% H2O2 as a bipropellant, compared with those of MMH/NTO. Figure 2 shows the appearance of HKP110. It is a clear liquid, as shown in this picture. This means that 10 wt% of sodium borohydride is completely dissolved in MAPA, even though the solvents in which sodium borohydride is highly soluble are limited.
Many studies have reported that thrusters often experience ignition failure or hard starts when operated with green hypergolic fuel and hydrogen peroxide, which HKP110 is also categorized as [6,11,12]. For example, Funk et al. [6] reported that an engine using green hypergolic fuel and hydrogen peroxide did not operate in any of the tests conducted in their experiment. They attributed the failure of ignition to the excessive ignition delay time for the combustion chamber volume. Kang et al. [11] reported that they experienced hard start phenomena with a green hypergolic bipropellant thruster using 95 wt% hydrogen peroxide, even though the sequence of the fuel lead operation was implemented. As seen from these examples, understanding the ignition characteristics and clarifying the stable ignition region are essential to work with a new green hypergolic fuel.
The authors have already studied the hypergolic ignition characteristics of HKP110 and hydrogen peroxide under a wide range of conditions in single-drop tests, which revealed that unstable ignition occurs when the concentration of hydrogen peroxide is lower than a certain level [14]. However, the region of stable ignition had not yet been clarified quantitively for concentrations of hydrogen peroxide near 98 wt%. Therefore, this study examined the hypergolic ignition of HKP110 and 98 wt% hydrogen peroxide by drop testing under a wider range of conditions to clarify the stable ignition region. Additionally, this study also observed hypergolic ignition by impinging-jet tests to investigate its ignition characteristics for use in practical configurations. To facilitate the observation of the phenomena inside the chamber, a combustion chamber made of quartz glass was used in the firing test. Since few studies have focused on visual observation of the hypergolic ignition of a green hypergolic bipropellant within a combustion chamber, the result of this study is expected to clarify the mechanism of unstable ignition and hard start phenomena in green hypergolic bipropellant thrusters.

2. Single-Drop Experiment

2.1. Experimental Apparatus and Test Conditions

2.1.1. Propellants

High-purity (HP) grade hydrogen peroxide (JAKUSZ Space Tech, Szymbark, Poland) was used as an oxidizer. This propellant satisfies the impurity level required by MIL-16005F [19], a specification for propellant-grade hydrogen peroxide. The concentration was calculated by measuring the liquid’s specific gravity and temperature [20] using a DA-130N specific gravity meter (Kyoto Electronics Manufacturing, Kyoto, Japan). The calculated concentration before the tests was 97.8 wt%.
HKP110, developed by the authors, was used as a fuel. MAPA and sodium borohydride (Tokyo Chemical Industry, Tokyo, Japan) were used. Sodium borohydride powder equivalent to 10 wt% was dissolved in MAPA by ultrasonic vibration in a water bath.

2.1.2. Single-Drop Test Apparatus

Figure 3 shows a diagram and an external view of the single-drop test apparatus. An electronic pipette, which was fixed on the two-axis translation stage, dispensed 10 μL of HKP110 fuel into a test tube directly below containing a predetermined amount of hydrogen peroxide. The pipette tip with appropriate output diameter was set so that the entire 10 μL of HKP110 was dispensed in a single drop. The distance from the pipette tip to the bottom of the test tube was fixed at 20 cm, so the speed of the drop was constant under every test condition. The test tube had an inner diameter of 13 mm and a length of 90 mm. The protecting plate was placed between the pipette and the test tube. The through-hole of the plate was covered by another metal plate while not experimenting in order to prevent unintended dripping into the test tube.
Ignition phenomena in the test tube were captured by a Miro 310 high-speed camera (Vision Research, Wayne, NJ, USA). The shooting speed was set to 10,000 fps, so phenomena could be observed at 0.1 ms intervals.

2.1.3. Test Conditions of Drop Test

Table 2 summarizes the test conditions of the drop tests. The volume of fuel drop was constant at 10 μL in each test and that of the oxidizer pool ranged from 10 μL to 150 μL. Based on the density of the two liquids, the corresponding mixture ratio (MR) was as shown in the table. Each test condition was tested five times.

2.2. Results

Figure 4 shows the captured high-speed camera images of the drop tests. Here, the time of contact of the two liquids was set to 0 ms.
As shown in Figure 4a,b, the flame grew smoothly in the test tube in lower MR conditions. However, flame growth stagnated in many tests at higher MRs, as shown in Figure 4c,d. In these cases, ignition and first flame generation occurred within 4 ms of the initial contact between the two liquids. However, the flame stopped growing approximately 5 ms after ignition. Stagnation of flame growth lasted for more than 10 ms, and finally, the flame generation started again, with vigorous foaming of the liquid-phase propellant. As seen from these results, continuous flame generation for a green hypergolic bipropellant becomes increasingly difficult as the MR increases.

2.3. Discussions

To investigate flame growth for each tested MR, the time history of flame growth in the test tube was measured from the captured video images. First, a color histogram of each captured image was analyzed, and then a binary image was produced for a threshold of 100 out of 256 steps of red histogram intensity. In this way, the area of the flame in the test tube could be clearly determined. Figure 5 shows an example binarized image. These processes were conducted using image processing software, Image J [21]. Finally, the length of the flame was manually measured, also on Image J, using its measurement function with appropriate scaling, and the growth history of the top edge of the flame was recorded at 0.5 ms intervals.
Figure 6 shows the result of our analysis. Five test results for each test condition are plotted per graph. As clearly shown, the tendency towards non-smooth growth of the flame became pronounced as MR increased, whereas smooth flame growth was observed for MR = 4.9. Especially for MR = 16.4 and 24.7, very long stagnation times were observed. In these cases, the growth of the flame completely stopped for more than 10 ms. Since such long stagnation was observed in two out of the five tests at MR = 16.4, this MR is considered to be the transient point between smooth and non-smooth ignition. For MR = 24.7, all test cases showed long stagnation, indicating that propellants fall completely into the non-smooth ignition region at this MR.
Similar phenomena were observed in the authors’ previous research [14], when 90 wt% hydrogen peroxide was used. As discussed in the previous research, this non-smooth growth of the flame is considered to be caused by the properties of hydrogen peroxide. In the early phase, a liquid-phase reaction occurs only in the area of contact of the two liquid propellants, leading to rapid ignition. The heat of the reaction is, however, absorbed by the heat capacity of non-reacted hydrogen peroxide, so the flame growth is inhibited. This tendency is especially pronounced for high MRs because the heat capacity of non-reacted hydrogen peroxide is relatively large under these conditions. Finally, hydrogen peroxide starts to decompose and accelerate the mixing and chemical reaction of two propellants. The same phenomena are thought to have occurred in this research, even though the concentration of hydrogen peroxide was higher. In our previous research, the threshold for smooth continual combustion was between MRs of 2 and 3 for 90 wt% hydrogen peroxide. However, it is considered to occur between MRs of 8.21 and 16.4 for a concentration of hydrogen peroxide of nearly 98 wt%, based on these test results.
In general, the mixture ratio is recognized as a major chemical parameter governing the state of a combustion reaction. However, it should be recognized as a physical parameter in hypergolic ignition phenomena of liquid bipropellants, as seen from these test results and discussions, i.e., the mixture ratio determines the amount of non-reacted propellant in the early stage of mixing of two liquid propellants, and such non-reacted propellant is considered to act as a heat-absorbing material that inhibits continuous combustion after ignition.

3. Impinging-Jet Experiment

3.1. Experimental Apparatus and Test Conditions

3.1.1. Propellants

The same fuel and oxidizer used in the single-drop test were also used in the impinging-jet test.

3.1.2. Injector and Chamber

The injector and chamber used in the impinging-jet test were originally designed to generate 10N of thrust in a vacuum with a throat and supersonic nozzle. However, since the purpose of this test was to observe the ignition phase, the impinging-jet tests were conducted without a throat and nozzle to avoid damaging the quartz chamber due to excessive chamber pressure caused by abnormal ignition.
The specifications of the chamber are shown in Table 3, and the schematic drawing and the external view are shown in Figure 7. The combustion chamber had an inner diameter of 7.5 mm and a length of 85.6 mm including the chamber holder. This chamber was made of quartz glass so that the inside could be observed with a high-speed camera during the test.
A schematic drawing of the injector hole section is shown in Figure 8, and its design specification is summarized in Table 4. The injector used in this study was 2-on-1 triplet type. Fuel was injected from a single hole on the central axis, and the oxidizer was from two surrounding directions at 30°, half of the apex angle. The oxidizer injection holes were arranged diagonally at 180° intervals along the circumference. Figure 9 shows shadowgraph images of the injection spray by water.
For the injector, the relational data of the injection differential pressure and mass flow rate were obtained in advance using actual fluid, and approximate equations were obtained from the data by power-law approximation, described as m ˙ = α Δ P β . The results of the mass flow calibration of the fuel and oxidizer are shown in Figure 10. Here, each test condition was tested only one time. The results of calculating α and β in the approximate equation are shown in Table 5. The coefficients of determination R2 for both equations were larger than 0.99, indicating that they were approximated with high accuracy.

3.1.3. Impinging-Jet Test System

The system diagram of the impinging-jet test system is shown in Figure 11. Fuel and oxidizer tanks can be pressurized at different pressures, allowing adjustment of the mixture ratio of injected fuel to the oxidizer. A check valve was installed between the propellant valve and the injector in case of an excessive increase in combustion chamber pressure. In addition, a nitrogen gas purge can be introduced downstream of the propellant valves so that all the propellant in the injector manifold can be discharged after each test, thereby improving the repeatability of the conditions in the manifold at the start of the tests. A nitrogen gas and water purge line into the combustion chamber was also installed for the same reason.
The pressure values between the propellant valve and injector hole were measured as Pif and Pio using a PHL-A series pressure transducer (Kyowa Electronic Instruments, Tokyo, Japan). These data were used to determine the injection start timing during the firing sequence and to calculate the instantaneous mass flow rate of each propellant by the approximate equation obtained in Section 3.1.2. Since the tests were conducted in atmospheric conditions with no throat configuration, Pif and Pio in the gauge pressure unit directly correspond to the injection differential pressure Δ P in the equation.

3.1.4. Test Conditions

Table 6 shows the test conditions of the impinging-jet tests. Differences in ignition behavior were observed by varying the tank pressure and injection lead time of both propellants. The firing duration of all tests was 300 ms. This was long enough to observe the hypergolic ignition phenomena. All tests were conducted under atmospheric conditions. Ambient temperature during the firing tests ranged from 12 °C to 18 °C. After each test case, the propellant in the injector manifold was discharged by GN2 purge. The inside of the combustion chamber was cleaned by water and GN2 purge to improve the repeatability.

3.2. Results

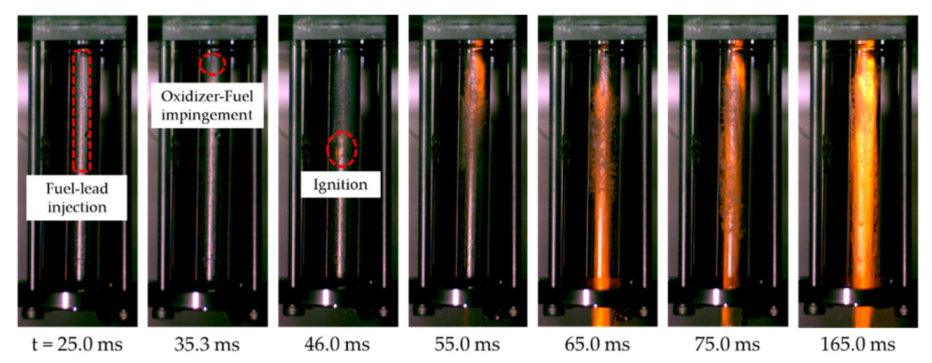
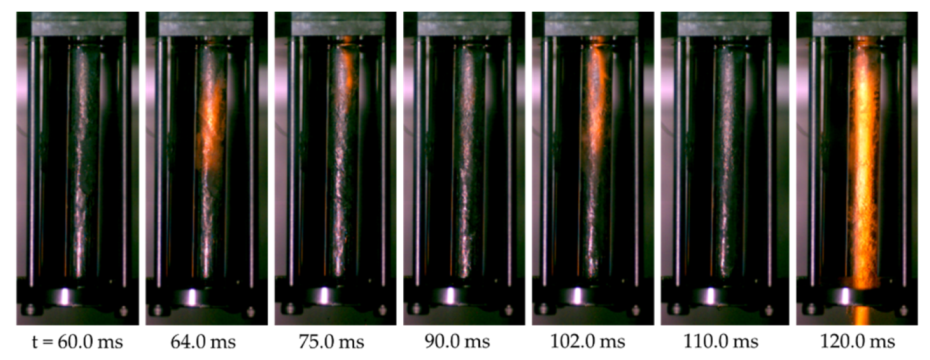
3.2.1. Observed Hypergolic Ignition Phenomena in Chamber

Figure 12 shows a sample of the history of firing captured by a high-speed camera. In this figure, fuel injection started first, and then oxidizer injection followed. The first ignition was observed approximately 10 ms after the impingement of the two liquids. The flame spread throughout the combustion chamber after the ignition, and finally, the state of combustion became stable. Here, the open signal to the propellant valve for fuel or oxidizer, whichever opened later, was set to 0 ms. It should be noted that the time from the valve open signal to the start of liquid injection in this experimental system was longer than that in practical thrusters. This was because the dribble volume, i.e., the volume of piping from the propellant valve to the injection hole, was relatively larger in this experimental system, and so it took longer to fill it with the propellant. Moreover, it was also because the actuation speed of these valves was slower than that of a practical thruster valve. Therefore, the timing of events such as impingement or ignition was later than that in a practical thruster.
Figure 13 shows the measured ignition delay in each injection lead time condition. Here, fuel lead is expressed as negative time, and oxidizer lead as positive. The ignition delay time is defined as the moment when a bright flame is first observed. The open signal to the propellant valve of fuel or oxidizer, whichever opened later, was set to 0ms. One important aspect was that unstable ignition phenomena were observed in oxidizer-lead injection cases, as shown in Figure 14. During unstable ignition, ignition and extinction occurred several times repeatedly. The state of combustion became stable at the end after repeated ignition in all unstable ignition cases, and no ignition failure occurred. However, the dispersion of measured ignition delay was larger than that of stable ignition cases.

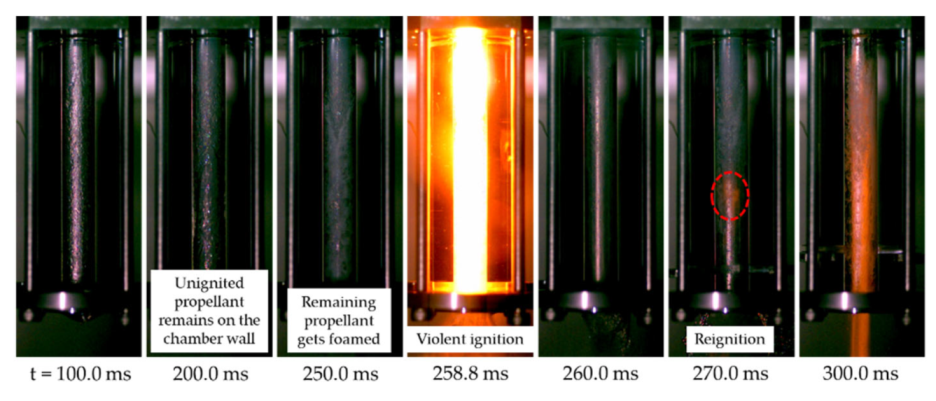
3.2.2. Hard Start Phenomena

In addition to the test results described above, hard start phenomena occurred two times during the test series. Figure 15 shows the high-speed camera images of the hard start. This figure shows that the propellant did not ignite initially. After this, most of the unignited propellant remained on the wall of the combustion chamber. Then, it began to foam. Finally, a violent ignition that was clearly different from the other ignitions occurred. This violent reaction consumed almost all the propellant in the combustion chamber. The following injected propellant reignited smoothly, leading to stable combustion as in the other test conditions. It should be noted that both hard start phenomena occurred in the first firing cases, shortly after the propellant filling operation.

3.3. Discussion

3.3.1. Cause of Hard Start Phenomena

The high-speed camera images taken shortly before the hard ignition are shown in Figure 16. From this figure, the flame in the early phase of ignition seemed to be normal deflagration, as seen in the stable ignition cases. However, the flame instantaneously changed to a violent state from t = 258.7 ms to t = 258.5 ms. Considering the speed of the reaction, the state of the flame was considered to have transitioned from deflagration to detonation at this point. As mentioned in the previous section, unburned propellant remaining on the chamber wall was observed to be foaming shortly before the hard ignition. This indicates that propellant was vaporizing or decomposing and a large amount of premixed gas of fuel and oxidizer, which would cause detonation under certain conditions, is considered to have been generated. Therefore, such premixed gas generated from the remaining propellant was obviously the direct cause of the hard start.
In order to identify why such a large amount of unburned propellant remained on the chamber wall, the high-speed camera images of the hard start cases were analyzed in detail to clarify the cause of the hard start. As a result, it was found that fuel-lead injection was interrupted due to gas inclusion and the oxidizer injection started before the fuel liquid was normally injected again. Therefore, the local mixture ratio shortly after the start of impingement was presumed to be extremely high, even though the accurate mass flow rate could not be calculated. This was likely the root cause of the hard start. Figure 17 shows the interrupted fuel-lead injection in the hard start case.
Both hard starts occurred in the first firing cases shortly after the propellant filling. Even though the upstream volume of the propellant valves was fully filled with propellant by the vacuum filling operation, there may have been some gas in the fuel feed line. Moreover, the injector manifold was filled with GN2 gas or air shortly before the injection since these firing tests were conducted under atmospheric conditions. As seen from these facts, the hard start phenomena observed in this series of experiments can be considered an accidental event caused by the test method. However, the results indicate the importance of controlling the transient mixture ratio shortly after the start of propellant injection to prevent a hard start in green hypergolic thrusters. Once propellant impingement spray at a high mixture ratio is generated in a small combustion chamber, the unignited propellant remains on the chamber wall. It inhibits the ignition of subsequently injected propellant, further increasing the amount of unignited propellant. Since only 0.47 g of oxygen is generated from 1 g of hydrogen peroxide on decomposition, bipropellants using hydrogen peroxide have the highest Isp at high MR, such as four or five, and so thrusters are usually designed for high MR combustion. In such thrusters, unexpected events such as gas inclusion or delayed valve actuation can easily cause a very high MR spray, leading to a hard start, even when the concentration of hydrogen peroxide is sufficiently high.
From the viewpoint of chamber design, the diameter may have had some effect on the hard start phenomena. The diameter of the quartz chamber used in this experiment was relatively small, which meant that sprayed propellant could easily remain on the wall and that subsequent injected propellant would be quickly absorbed by such remaining propellant. If the diameter had been larger in this experiment, the hard start might not have occurred, or the time of occurrence might have been significantly different. However, since the actual thruster was equipped with a throat and unburned propellant was not easily discharged, we should still be cautious about similar abnormal ignition phenomena in the actual thruster.

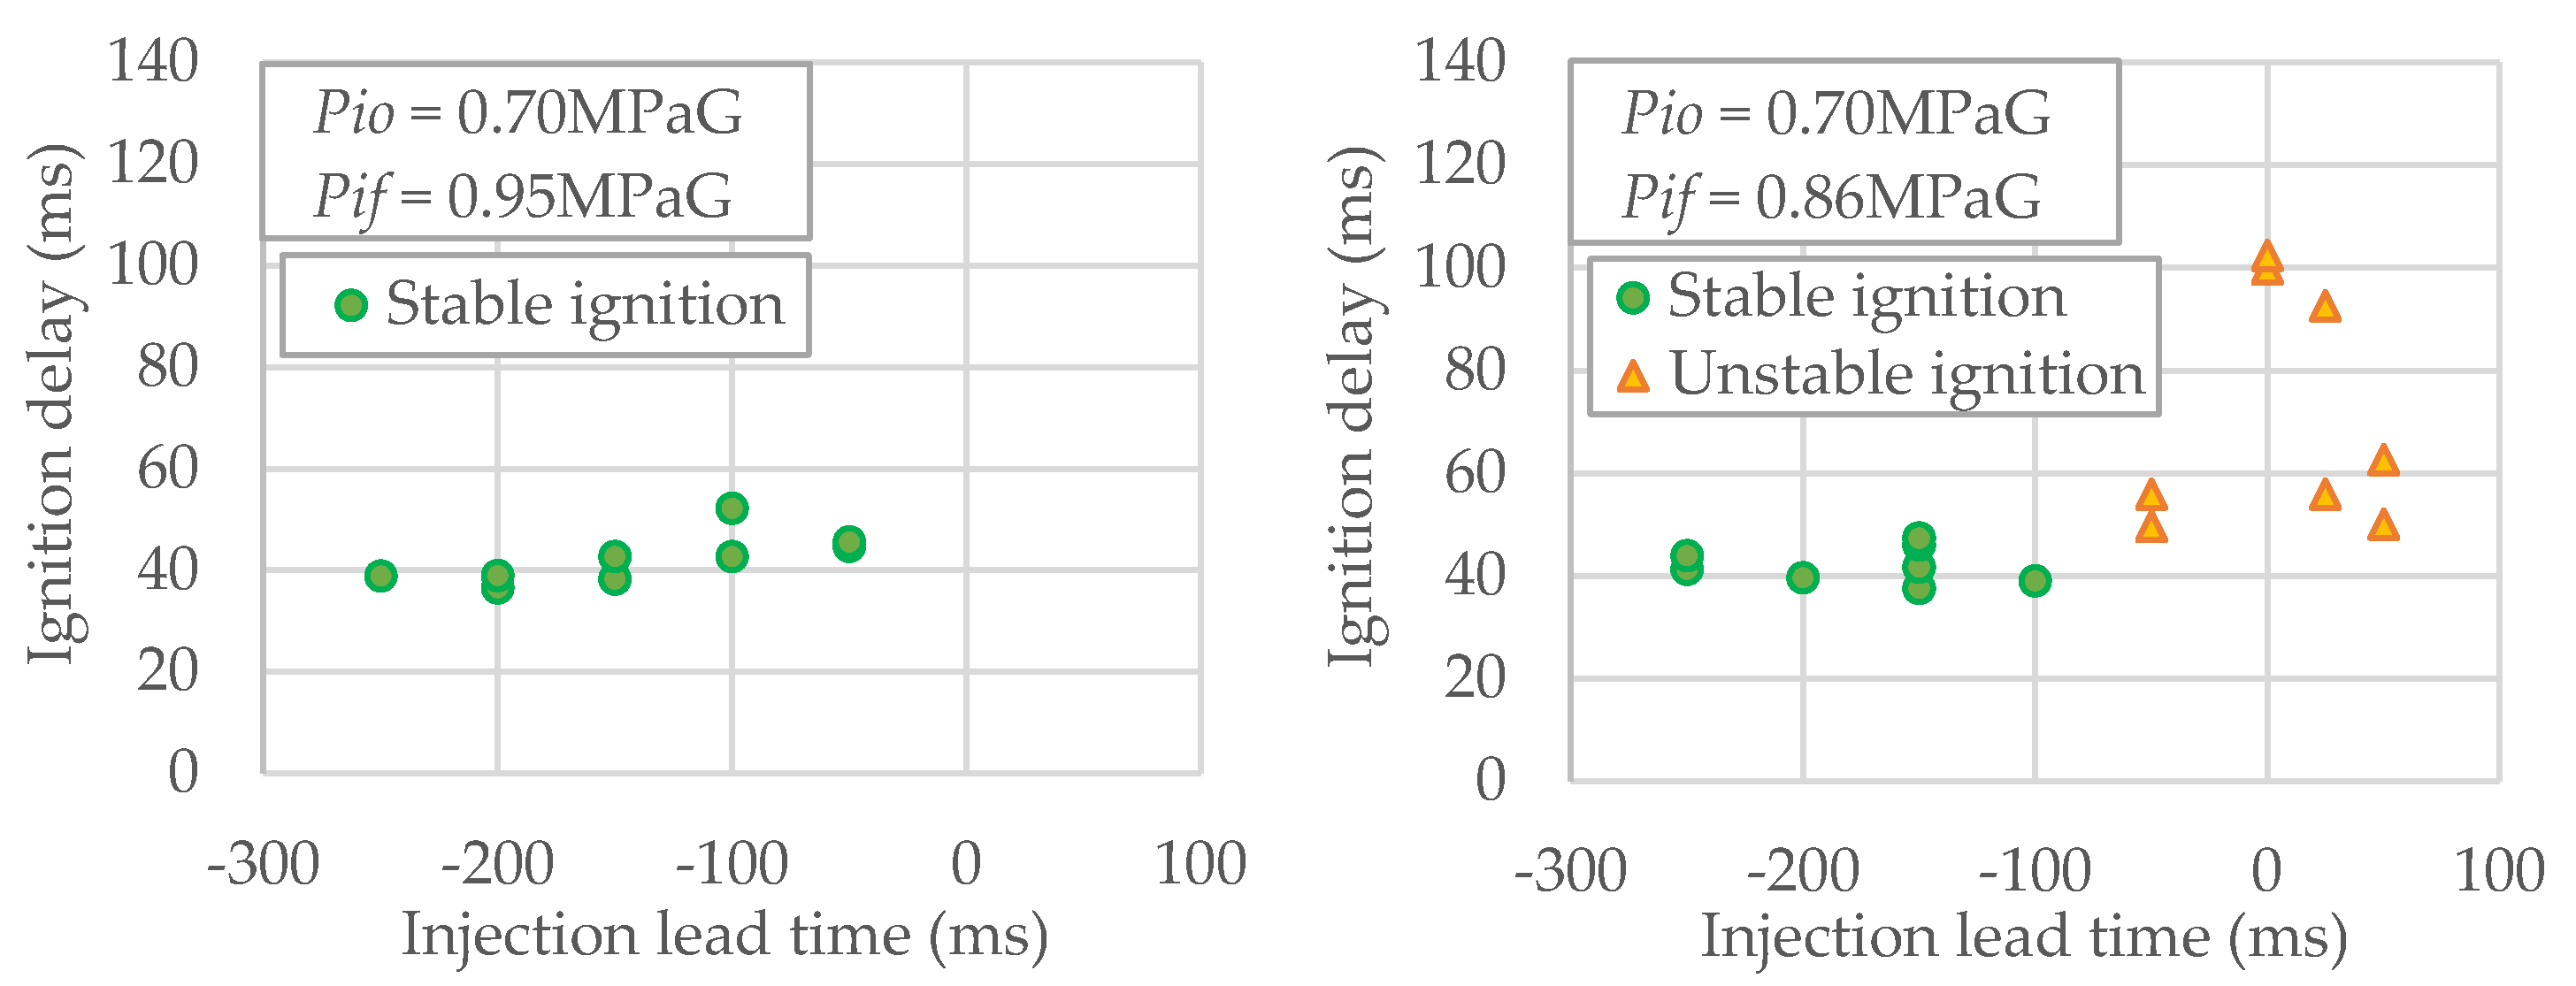
3.3.2. Region of Stable Ignition

The direct cause of flame extinction as observed in the impinging-jet experiment is presumed to be that the subsequent fuel and oxidizing gases were not generated from the liquid-phase propellants, or that the balance of fuel and oxidizing gases was outside the composition of the flammability limit. Since the unstable ignition phenomena were caused by the change in injection sequence, well-balanced gas generation from the propellants is considered to have been inhibited by the unsuitable injection sequence, or some other cause resulting from it. Therefore, it is necessary to quantitatively clarify the conditions that cause such a non-ideal state in terms of the injection sequence or other parameters.
Even if the injection lead time is the same, the test results of other injectors impinging are expected to be different from those in this study because each propellant valve and injector has a unique valve response time and injector manifold volume. Therefore, all data were rearranged in terms of the averaged mixture ratio shortly after injection to generalize and quantify these experimental results. To eliminate the effects of valve actuation time and the time for the manifold to fill, the moment at which the injector pressure started to rise was set to the start time of mixture ratio calculation and ignition delay measurement here. Depending on the injection lead time, Pif or Pio, whichever started to rise later, was used for reference time determination. The averaged mixture ratio was calculated by the total amount of injected fuel and oxidizer during the first 30 ms of injection because most of the nominal stable ignition occurred within 30 ms. Figure 18 shows a sample of the measured injector pressure and calculated transitional mixture ratio.
Figure 19 shows the result of data rearrangement. As described in the previous section, it was confirmed that the fuel injection in hard start cases was interrupted due to gas inclusion. In these cases, the accurate mass flow rate could not be calculated using differential pressure, so the data corresponding to hard start cases are plotted outside the right column in Figure 19, considering that the mixture ratio was expected to be extremely high due to the lack of fuel liquid injection.
This figure shows that ignitions were stable when the mixture ratio was less than 3. This region corresponds to the fuel-lead injection in this study. However, ignition tended to become unstable when the mixture ratio was more than 9. This result is consistent with the test result of the drop test described in Section 2.3. Since the threshold for smooth ignition is around 10 of MR in the drop test results, this is considered to be linked to the unstable ignition phenomena in the impinging-jet test. Considering these test results, controlling the transient MR to less than this threshold in the injection start phase is important for the stable ignition of a green hypergolic bipropellant thruster.

4. Conclusions

Hypergolic ignition of HKP110 green hypergolic fuel and nearly 98 wt% hydrogen peroxide was observed in single-drop tests under a wide range of conditions to clarify the threshold of the stable ignition region. As a result, unstable ignition occurred at high MRs. The threshold mixture ratio for unstable ignition was around 10.
An impinging-jet experiment with a quartz chamber was also conducted to clarify the ignition characteristics of HKP110 fuel and hydrogen peroxide.
Hypergolic ignition was successfully observed in many cases, which indicates the feasibility of using HKP110 as a hypergolic fuel, although unstable ignition phenomena were observed in the oxidizer-lead injection sequence, even though the concentration of hydrogen peroxide was around 98 wt%. Moreover, hard start phenomena also occurred several times in this test series. Analyzing video images showed that fuel-lead injection was interrupted by gas inclusion in hard starts. This caused the extremely high mixture ratio condition in the early phase of firing, and unignited propellant remained on the chamber wall but finally ignited violently.
By rearranging the data by transient mixture ratio in the early phase of firing, it was also revealed that ignition was stable when the transient average MR was less than 3. On the contrary, ignition was unstable when the transient average MR was larger than 9. This result is consistent with those of the single-drop testing mentioned above, showing that it is important to control the transient mixture ratio in the early phase for the stable ignition of green hypergolic bipropellant thrusters.
It should be noted that the impinging-jet tests in this study were conducted under atmospheric conditions with no throat configuration. Although the result is useful enough for a general discussion of stable ignition, further research should be done with an improved experimental setup simulating practical use in space.

Author Contributions

Conceptualization, K.H. and T.N.; methodology, K.H.; software, K.H.; validation, T.N.; formal analysis, K.H.; investigation, K.H.; resources, K.H.; data curation, K.H.; writing—original draft preparation, K.H.; writing—review and editing, T.N.; visualization, K.H.; supervision, T.N.; project administration, T.N.; funding acquisition, K.H. and T.N. All authors have read and agreed to the published version of the manuscript.

Funding

This research received no external funding.

Institutional Review Board Statement

Not applicable.

Informed Consent Statement

Not applicable.

Data Availability Statement

All experimental data are available from the corresponding author on reasonable request.

Acknowledgments

We would like to thank Junichi Nakatsuka, Shioka Hagiwara, Noriyuki Takahashi, Taro Morikawa, and Emi Imoto for their contributions to the experiments in this study.

Conflicts of Interest

The authors declare no conflict of interest.

Abbreviations

The following abbreviations are used in this manuscript:
GN2Gas nitrogen
H2O2Hydrogen peroxide
MAPA3-methylaminopropylamine
MMHMonomethylhydrazine
NAWCWDNaval air warfare center weapons division
NTONitrogen tetroxide
SCAPESelf-contained atmospheric protective ensemble suits
SVHCSubstance of very high concern
ACross-sectional area of orifice (m2)
CdDischarge coefficient
IspSpecific impulse (s)
MRMixture ratio (oxidizer to fuel mass ratio)
PifInjector pressure (fuel line) (MPaG)
PioInjector pressure (oxidizer line) (MPaG)
PtfFuel tank pressure (MPaG)
PtoOxidizer tank pressure (MPaG)
R2Coefficient of determination
Δ P Differential pressure (MPa)
ρ Density (kg/m3)

References

  1. Rohr, T.; Nikulainen, M. Impact of REACH Legislation on European Space Programs. In Proceedings of the International Workshop on Environment and Alternative Energy, Madrid, Spain, 22 April 2015. [Google Scholar]
  2. Rusek, J.J.; Anderson, N.; Lormand, B.M.; Purcell, N.L. Non-Toxic Hypergolic Miscible Bipropellant. US Patent 5,932,837 B2, 3 August 1999. [Google Scholar]
  3. Lormand, B.M. Non-Toxic Hypergolic Miscible Fuel with Stable Storage Characteristics. US Patent 6,419,771 B1, 16 July 2002. [Google Scholar]
  4. Diede, A. Reduced Toxicity Hypergolic Bipropellant Fuels. US Patent 6,695,938 B2, 24 February 2004. [Google Scholar]
  5. Palmer, R.K.; Rusek, J.J. Low toxicity reactive hypergolic fuels for use with hydrogen peroxide. In Proceedings of the 2nd International Conference on Green Propellants for Space Propulsion, Sardinia, Italy, 7–8 June 2004; pp. 199–204. [Google Scholar]
  6. Funk, J.E.; Heister, S.D. Development Testing of Non-Toxic Storable Hypergolic Liquid Propellants. In Proceedings of the 35th Joint Propulsion Conference & Exhibit, Los Angeles, CA, USA, 20–24 June 1999. [Google Scholar]
  7. Pourpoint, T.; Anderson, W.E. Hypergolic Reaction Mechanisms of Catalytically Promoted Fuels with Rocket Grade Hydrogen Peroxide. Combust. Sci. Technol. 2007, 179, 2107–2133. [Google Scholar] [CrossRef]
  8. Mahakali, R.; Kuipers, F.; Yan, A.; Anderson, W.; Pourpoint, T. Development of Reduced Toxicity Hypergolic Propellants. In Proceedings of the 47th AIAA/SAE/ASEE Joint Propulsion Conference, San Diego, CA, USA, 31 July–3 August 2011. [Google Scholar]
  9. Florczuk, W.; Rarata, G. Assessment of Various Fuel Additives for Reliable Hypergolic Ignition with 98% HTP. In Proceedings of the 66th International Astronautical Congress, Jerusalem, Israel, 12–16 October 2015. [Google Scholar]
  10. Kang, H.; Jang, D.; Kwon, S. Demonstration of 500N Scale Bipropellant Thruster Using Non-Toxic Hypergolic Fuel and Hydrogen Peroxide. Aerosp. Sci. Technol. 2016, 49, 209–214. [Google Scholar] [CrossRef]
  11. Kang, H.; Kwon, S. Green hypergolic combination Diethylenetriamine based fuel and hydrogen peroxide. Acta Astronaut. 2017, 137, 25–30. [Google Scholar] [CrossRef]
  12. Austin, B.L.; Heister, S.D.; Anderson, W.E. Characterization of Pintle Engine Performance for Nontoxic Hypergolic Bipropellants. J. Propuls. Power 2005, 21, 627–635. [Google Scholar] [CrossRef]
  13. Hatai, K.; Ikeda, H. Research on Fuel Selection for Reduced-Toxicity Hypergolic Bipropellant. J. Jpn. Soc. Aeronaut. Space Sci. 2019, 67, 174–180. (In Japanese) [Google Scholar] [CrossRef]
  14. Hatai, K.; Nagata, T.; Ikeda, H. Research on Ignition Property of Reduced-Toxicity Hypergolic Bipropellant. J. Jpn. Soc. Aeronaut. Space Sci. 2021, 69, 105–112. (In Japanese) [Google Scholar] [CrossRef]
  15. Weiss, H.G.; Johnson, B.; Fisher, H.D.; Gerstein, M. Modifications of the Hydrazine-Nitrogen Tetroxide Ignition Delay. AIAA J. 1964, 2, 2222–2223. [Google Scholar] [CrossRef]
  16. Brief Profile of 3-Aminopropylmethylamine, European Chemical Agency. Available online: https://echa.europa.eu/brief-profile/-/briefprofile/110.025.950 (accessed on 15 December 2021).
  17. Bingham, E.; Cohrssen, B. Patty’s Toxicology, 6th ed.; John Wiley & Sons, Inc: New York, NY, USA, 2012; p. 875. [Google Scholar]
  18. Gordon, S.; McBride, B. Computer Program for Calculation of Complex Chemical Equilibrium Compositions and Applications; NASA RP-1311: Washington, DC, USA, 1994. [Google Scholar]
  19. MIL-PRF-16005F, Performance Specification–Propellant, Hydrogen Peroxide. Available online: https://www.hydrogen-peroxide.us/chemical-specifications/MIL-PRF-16005F_Rocket_Propellant_Hydrogen_Peroxide.pdf (accessed on 1 August 2003).
  20. Schumb, W.C.; Satterfield, C.N.; Wentworth, R.L. Hydrogen Peroxide; Reinhold Publishing Corporation: New York, NY, USA, 1955; pp. 194–198. [Google Scholar]
  21. Rasband, W.S.; ImageJ, U.S.; National Institute of Health. Bethesda: Maryland, USA, 1997–2012. Available online: https://imagej.nih.gov/ij/ (accessed on 1 February 2022).
Figure 1. Theoretical Isp and adiabatic flame temperature of HKP110 fuel (calculated by CEA [18], conditions: nozzle expansion ratio = 100, frozen flow at throat, initial chamber pressure = 10 atm, propellant temperature = 300 K, calculated results of MMH/NTO are also plotted as references).
Aerospace 09 00129 g001
Figure 2. HKP110 fuel.
Aerospace 09 00129 g002
Figure 3. Single-drop test apparatus (left: diagram, right: external view).
Aerospace 09 00129 g003
Figure 4. High-speed camera images of drop test ((a) MR = 4.9, (b) MR = 8.2, (c) MR = 16.4, (d) MR = 24.7).
Aerospace 09 00129 g004aAerospace 09 00129 g004b
Figure 5. Explanation of image analysis for single-drop test results.
Aerospace 09 00129 g005
Figure 6. Time history of flame growth in the test tube ((a) MR = 1.6, (b) MR = 8.2, (c) MR = 16.4, (d) MR = 24.7, five test results for each test condition are plotted per graph).
Aerospace 09 00129 g006
Figure 7. Injector and quartz chamber (left: schematic drawing, right: external view).
Aerospace 09 00129 g007
Figure 8. Schematic drawing of the injection hole section.
Aerospace 09 00129 g008
Figure 9. Shadowgraph images of injection spray by water (left: 0° angle, right: 90° angle).
Aerospace 09 00129 g009
Figure 10. Mass flow rate calibration results of injector (left: fuel, right: oxidizer).
Aerospace 09 00129 g010
Figure 11. Schematic diagram of impinging-jet test system.
Aerospace 09 00129 g011
Figure 12. High-speed camera images of hypergolic ignition inside the chamber.
Aerospace 09 00129 g012
Figure 13. Measured ignition delay in each injection lead time condition (fuel-lead time: negative, oxidizer-lead time: positive).
Aerospace 09 00129 g013
Figure 14. High-speed camera images of unstable ignition.
Aerospace 09 00129 g014
Figure 15. High-speed camera images of hard start case.
Aerospace 09 00129 g015
Figure 16. Detailed time history of hard start.
Aerospace 09 00129 g016
Figure 17. Interrupted fuel-lead injection in hard start.
Aerospace 09 00129 g017
Figure 18. Sample of measured injector pressure and calculated mixture ratio in early phase of injection.
Aerospace 09 00129 g018
Figure 19. Relation between early averaged MR and ignition behavior.
Aerospace 09 00129 g019
Table 1. The details of HKP110 fuel.
HKP110(Ref.) MMH
Composition3-methylaminopropylamine (MAPA) with 10 wt% of sodium
borohydride dissolved
-
Toxicity(MAPA [16])
LD50 (oral): 982 mg/kg
LD50 (dermal): 2293.6 mg/kg
LC50 (inhalation): 11.1 mg/L/4 h
(MMH [17])
LD50 (oral): 32 mg/kg
LD50 (dermal): 93 mg/kg
LC50 (inhalation): 0.14 mg/L/4 h
Hypergolicityhypergolic with H2O2hypergolic with NTO
Theoretical Isp326.1 s with 98 wt% H2O2 (*)331.6 s with NTO (*)
Ignition delay~2 ms with 98 wt% H2O21~3 ms with NTO
(*) Calculated by CEA [18] (conditions: nozzle expansion ratio = 100, frozen flow at throat, initial chamber pressure = 10 atm, propellant temperature = 300 K).
Table 2. Test conditions of drop test.
Test
No.
Amount of Fuel
(HKP110)
Amount of Oxidizer
(H2O2)
Corresponding
MR
Number of Tests
110 μL30 μL4.95
210 μL50 μL8.25
310 μL100 μL16.45
410 μL150 μL24.75
Table 3. Chamber specifications.
ItemDesign
Chamber inner diameter7.5 mm
Chamber length88 mm
Chamber materialQuartz glass
ThroatN/A
NozzleN/A
Table 4. Design specifications of the injector.
ItemDesign
Impinging pattern2-on-1 triplet
Hole diameter (oxidizer)0.36 mm × 2
Hole diameter (fuel)0.25 mm × 1
Impinging angle30° at half apex
Film coolingN/A
Table 5. Calculation results of approximate coefficient.
α β R2
Fuel1.0590.6690.999
Oxidizer6.4270.4460.995
Table 6. Test conditions.
ItemValue
Ptf0.86 MPaG0.95 MPaG
Pto0.70 MPaG0.70 MPaG
Injection sequenceFuel lead:
50, 100, 150, 200, 250 ms
Oxidizer lead:
0, 50 ms
Fuel lead:
50, 100, 150, 200, 250 ms
Oxidizer lead:
N/A
Firing duration300 ms
(Excluding lead injection)
Environment12~18 °C in the atmosphere
Publisher’s Note: MDPI stays neutral with regard to jurisdictional claims in published maps and institutional affiliations.

