Article

Multi-Scale Nonlinear Progressive Damage and Failure Analysis for Open-Hole Composite Laminates

State Key Laboratory of Mechanics and Control of Mechanical Structures, Nanjing University of Aeronautics and Astronautics, Nanjing 210016, China
*
Authors to whom correspondence should be addressed.
Aerospace 2022, 9(2), 59; https://doi.org/10.3390/aerospace9020059
Submission received: 29 December 2021 / Revised: 19 January 2022 / Accepted: 19 January 2022 / Published: 24 January 2022
(This article belongs to the Topic Composites in Aerospace and Mechanical Engineering)

Abstract

:
In order to study the nonlinear behaviors and interactions among the constituents for the composite material structure under the tensile load, multiscale damage model using generalized method of cells (GMC) and a lamina-level progressive damage model were established, respectively, for fiber reinforced composite laminates with a central hole, which were based on the thermodynamic Schapery Theory (ST) at either the micro-level or the lamina level. Once the nonlinear progressive degradation of the matrix material reached the lower limit value for the ST method, matrix failures naturally occurred, the failure of the fiber was determined by the maximum stress failure criterion. For the multiscale progressive damage model, the GMC model consisting of a fiber subcell and three matrix subcells was imposed at each integral point of FEM elements, and the three matrix subcells undergo independent damage evolution. The load versus displacement curves and failure modes of the open-hole laminates were predicted by using the two progressive failure models, and the results were compared with that obtained by the Hashin-Rotem progressive failure model and the experimental results. The results show that the ST based method can obtain the nonlinear progressive damage evolution states and failure states of the composite at both the lamina level and the multiscale level. Finally, the damage contours and failure paths obtained are also presented.

1. Introduction

Polymer matrix composites (PMCs) have been widely used in aircraft structures owing to their low weight, high strength, high resistance to fatigue, and many other superior advantages. Progressive damage analysis of composite laminates is regarded as an important and complex subject, which is highlighted by the World-Wide Failure Exercise (WWFE) [1,2,3]. It is mainly based on macroscopic failure analysis methods within the WWFE to predict the final failure behavior of fiber reinforced composites. The associated parameters in these theories generally rely on extensive mechanical experiments, which result in myriad costs of time and expense. Although many criteria take different failure modes into account and incorporate progressive failure modeling [4,5,6], they are essentially phenomenological methods that cannot capture the interaction between the constituents at the microscale level. In order to more accurately characterize the mechanical response of the fiber reinforced composite structures, damage and failure mechanisms must be treated separately [7,8,9]. The gradual expansion of matrix micro-damage or micro-crack originates from the distributed micro-pores or other micro-defects produced in the manufacturing of composite structures. The damage expansion leads to stiffness reduction in local areas of the structure, resulting in redistribution of stress and strain fields, which is the main cause of nonlinear phenomena before the catastrophic failure of fiber reinforced composite materials occurs [10].
Progressive damage and failure analysis of composite structures with an open hole is one of the hot subjects for structural designs [11,12]. Stress concentration and redistribution around the open hole in a laminate subjected to tensile loads can lead to produce complicated damage and failure modes [13], including matrix cracking, fiber breakage, delamination, etc. [14,15]. Linear elasticity along with different failure criteria are usually employed to predict the damage and failure states of composite structures with an open hole for many analytical and numerical models at the micro level [16]. Even though the failure of fiber and matrix is treated distinctly for these progressive damage methods [6], it is not available to obtain the interaction between the constituents.
Micromechanical models are able to acquire the quantitative relationship among the constituent materials within the composites [17]. By using microscopic mechanical methods, variations of constituent material properties, constituent phases or the microscopic geometries, such as the fiber volume fraction and micro-level architecture, can be considered conveniently to promote a further study of the failure mechanism for composite structures. The generalized method of cells (GMC) [18,19] based on a homogenization technique are actually analytical, which has been proved to have very high computational efficiency. Formulations of the GMC model contain the applications of some governing equations using a homogenization method, by which traction and displacement continuity equations are imposed at the subcell interfaces and the periodic boundaries of the repeating unit cell (RUC) in an integral sense. It is convenient to apply the micromechanics model GMC to the multiscale analysis within commercial finite element software [20,21].
The main objective of the current work is to use a thermodynamically based Schapery Theory (ST) [22,23,24] to predict the nonlinear response, the damage evolution, and the failure contour for the composite laminates with an open hole under tensile loading. Two progressive damage methods are used, one is ST/FF (Schapery Theory/Fiber Failure) method at the laminate level, the other is a multi-scale analysis method ST/GMC/FF (Schapery Theory/Generalized Method of Cells/Fiber Failure) at micro-scale level, both models contain a ST based degradation strategy of elastic properties for the matrix damage and the maximum stress failure criterion for the fiber failure, which are employed at either the lamina level or the micro level. The results obtained from these two models are compared with the experimental data and that analysed using Hashin-Rotem progressive damage method embedded in the ABAQUS software.

2. Multiscale Method of Progressive Damage and Failure

2.1. ST Model

The Schapery Theory can be used for the progressive damage analysis of the fiber reinforced composites, in which the total applied potential WT of the material is divided into the recoverable elastic part W and the dissipative part WS that can cause structural deformation [25].
W T = W + W S
A portion of the total applied work potential causes the microcracking and any other structural changes when the material is loaded, which affects the elastic properties of the material, and at the same time, the other portion of the applied work potential can be recovered when the material is unloaded. This process is shown in Figure 1, where the shaded area represents the dissipated potential WS and the area below the straight line represents the elastic potential W.
According to the ST method [22,23], both W and Ws are functions of a group of internal state variables (ISVs) Sm (m = 1, 2, …, M). The total applied work potential is a constant with respect to each of the internal state variables [23],
W T S m = 0
The dissipated potential WS is allowed to be a function of any number of internal state variables, and different internal state variables can be used to explain different damage and failure mechanisms. In order to describe the nonlinear progressive damage of the matrix material of the fiber reinforced composites, Ws is assumed to be a function of a single internal variable S [25]. For convenience, Ws = S can be selected,
W T = W + S
Calculating the derivative of Equation (3) with respect to S yields,
W S = 1

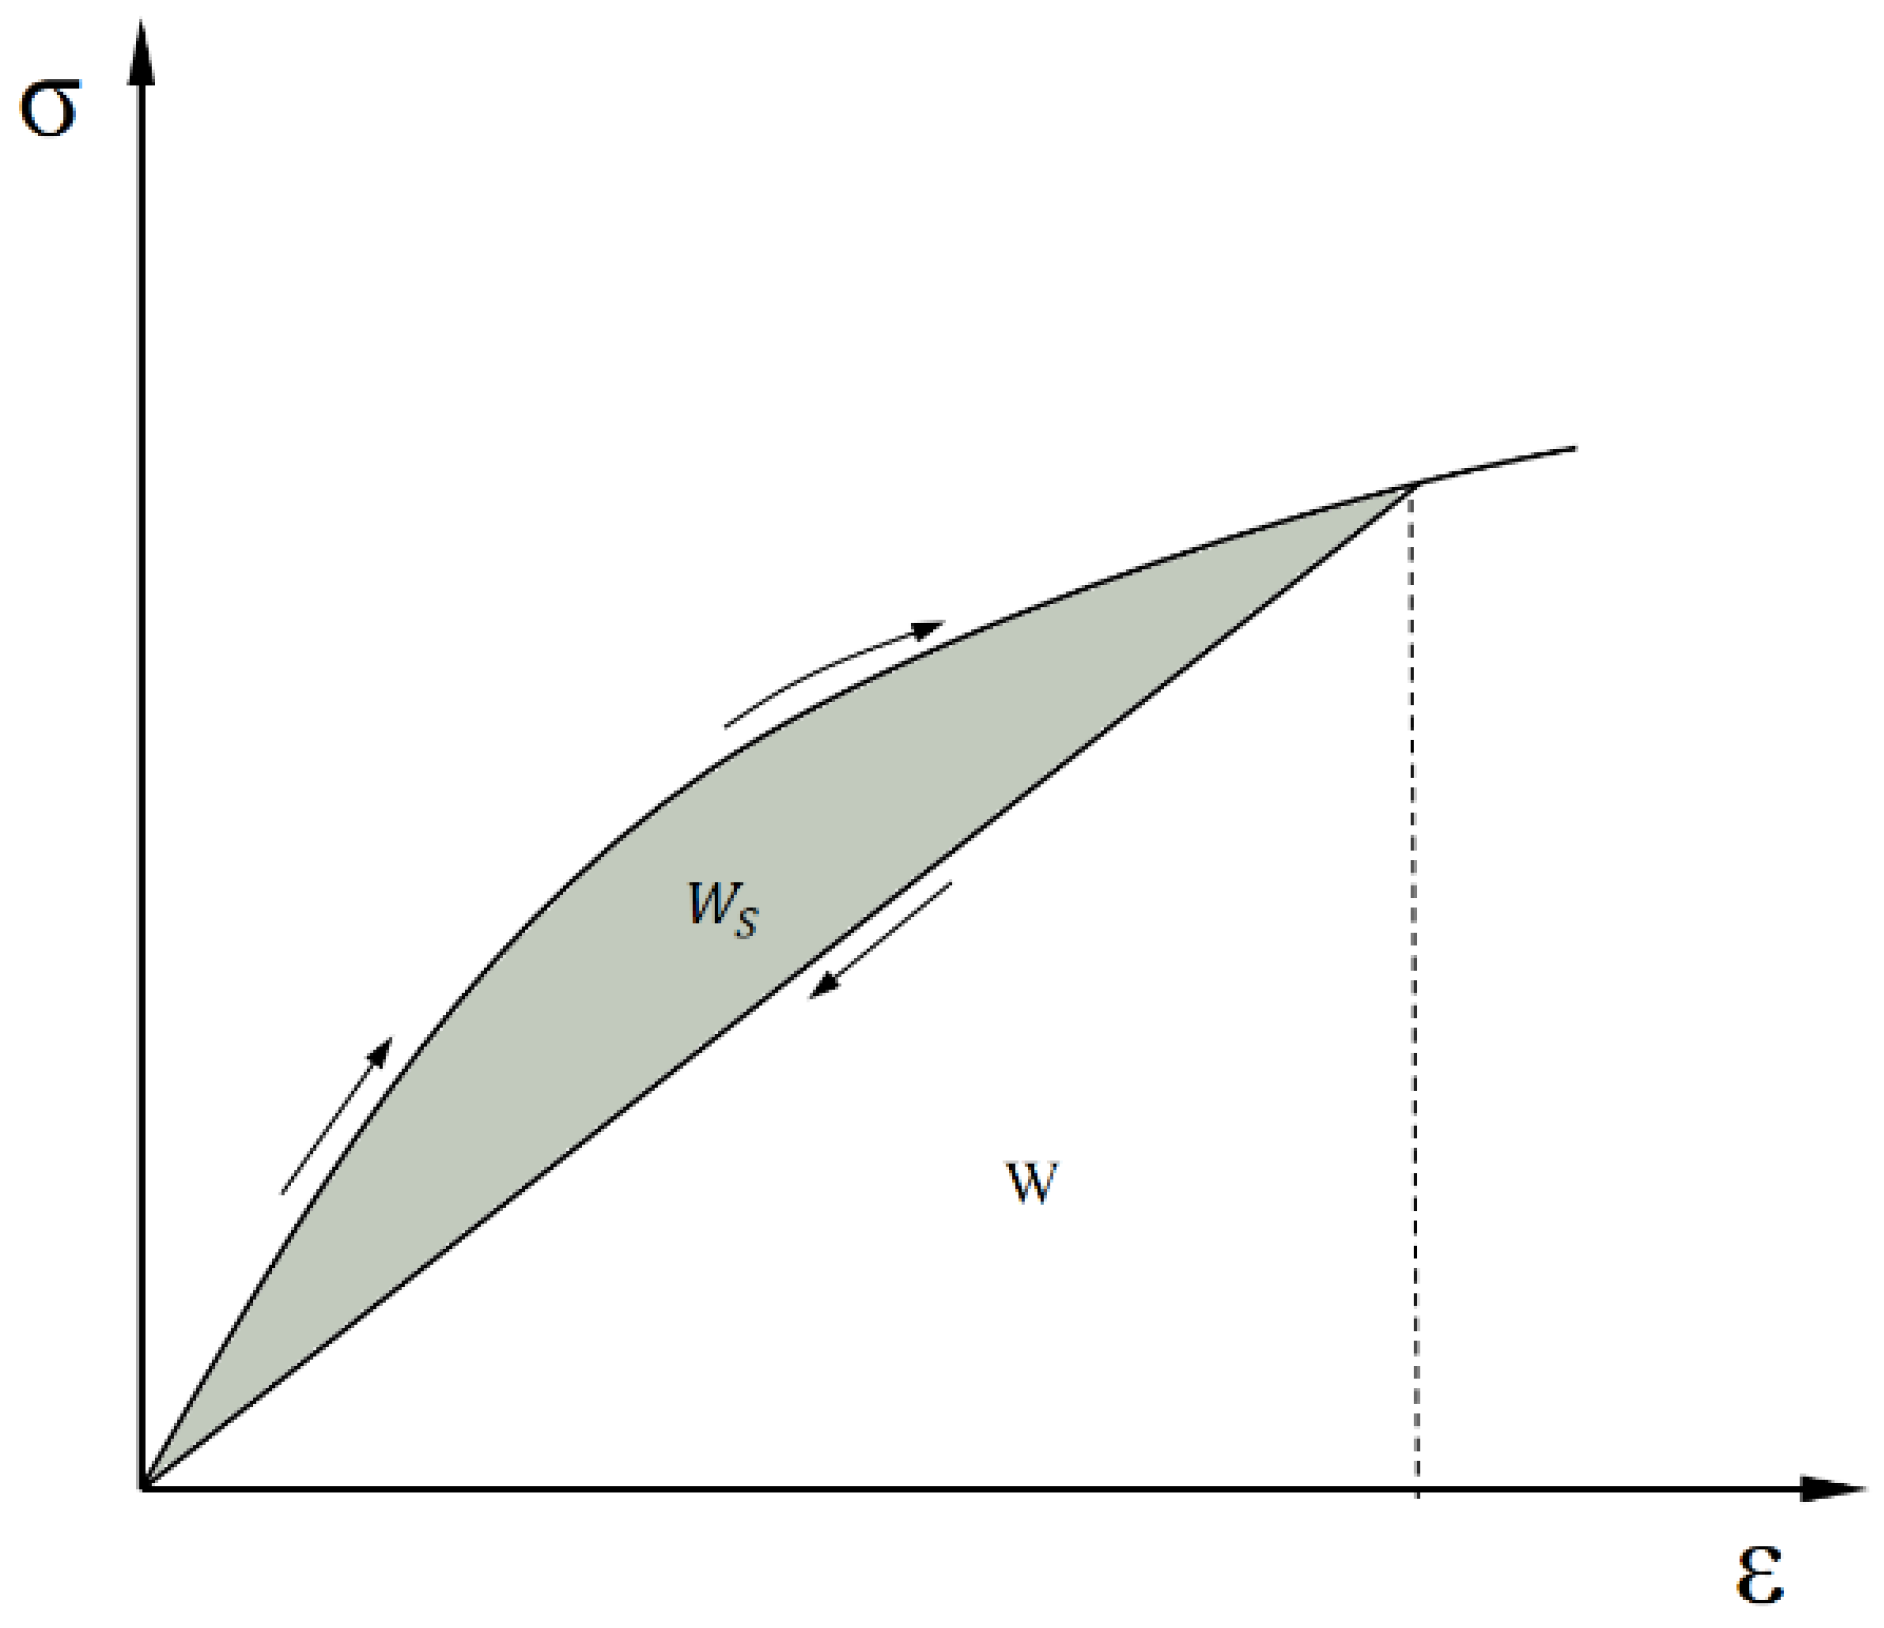
2.2. Constitutive Relation

The constitutive relation of a unidirectional lamina under the plane stress state can be written as,
σ 11 = Q 11 ε 11 + Q 12 ε 22 σ 22 = Q 12 ε 11 + Q 22 ε 22 τ 12 = Q 66 γ 12
where γ12 is the engineering shear strain, and
Q 11 = E 11 1 ν 12 ν 21 Q 22 = E 22 1 ν 12 ν 21 Q 12 = ν 12 Q 22 Q 66 = G 12 ν 21 = ν 12 E 22 E 11
where E11, E22, υ12, υ21, and G12 denote axial elastic modulus, transverse elastic modulus, Poisson’s ratio, transverse Poisson’s ratio, and shear modulus respectively. It can be assumed that υ12υ21 1, then Equation (6) becomes
Q 11 = E 11 Q 22 = E 22 Q 12 = ν 12 Q 22 Q 66 = G 12

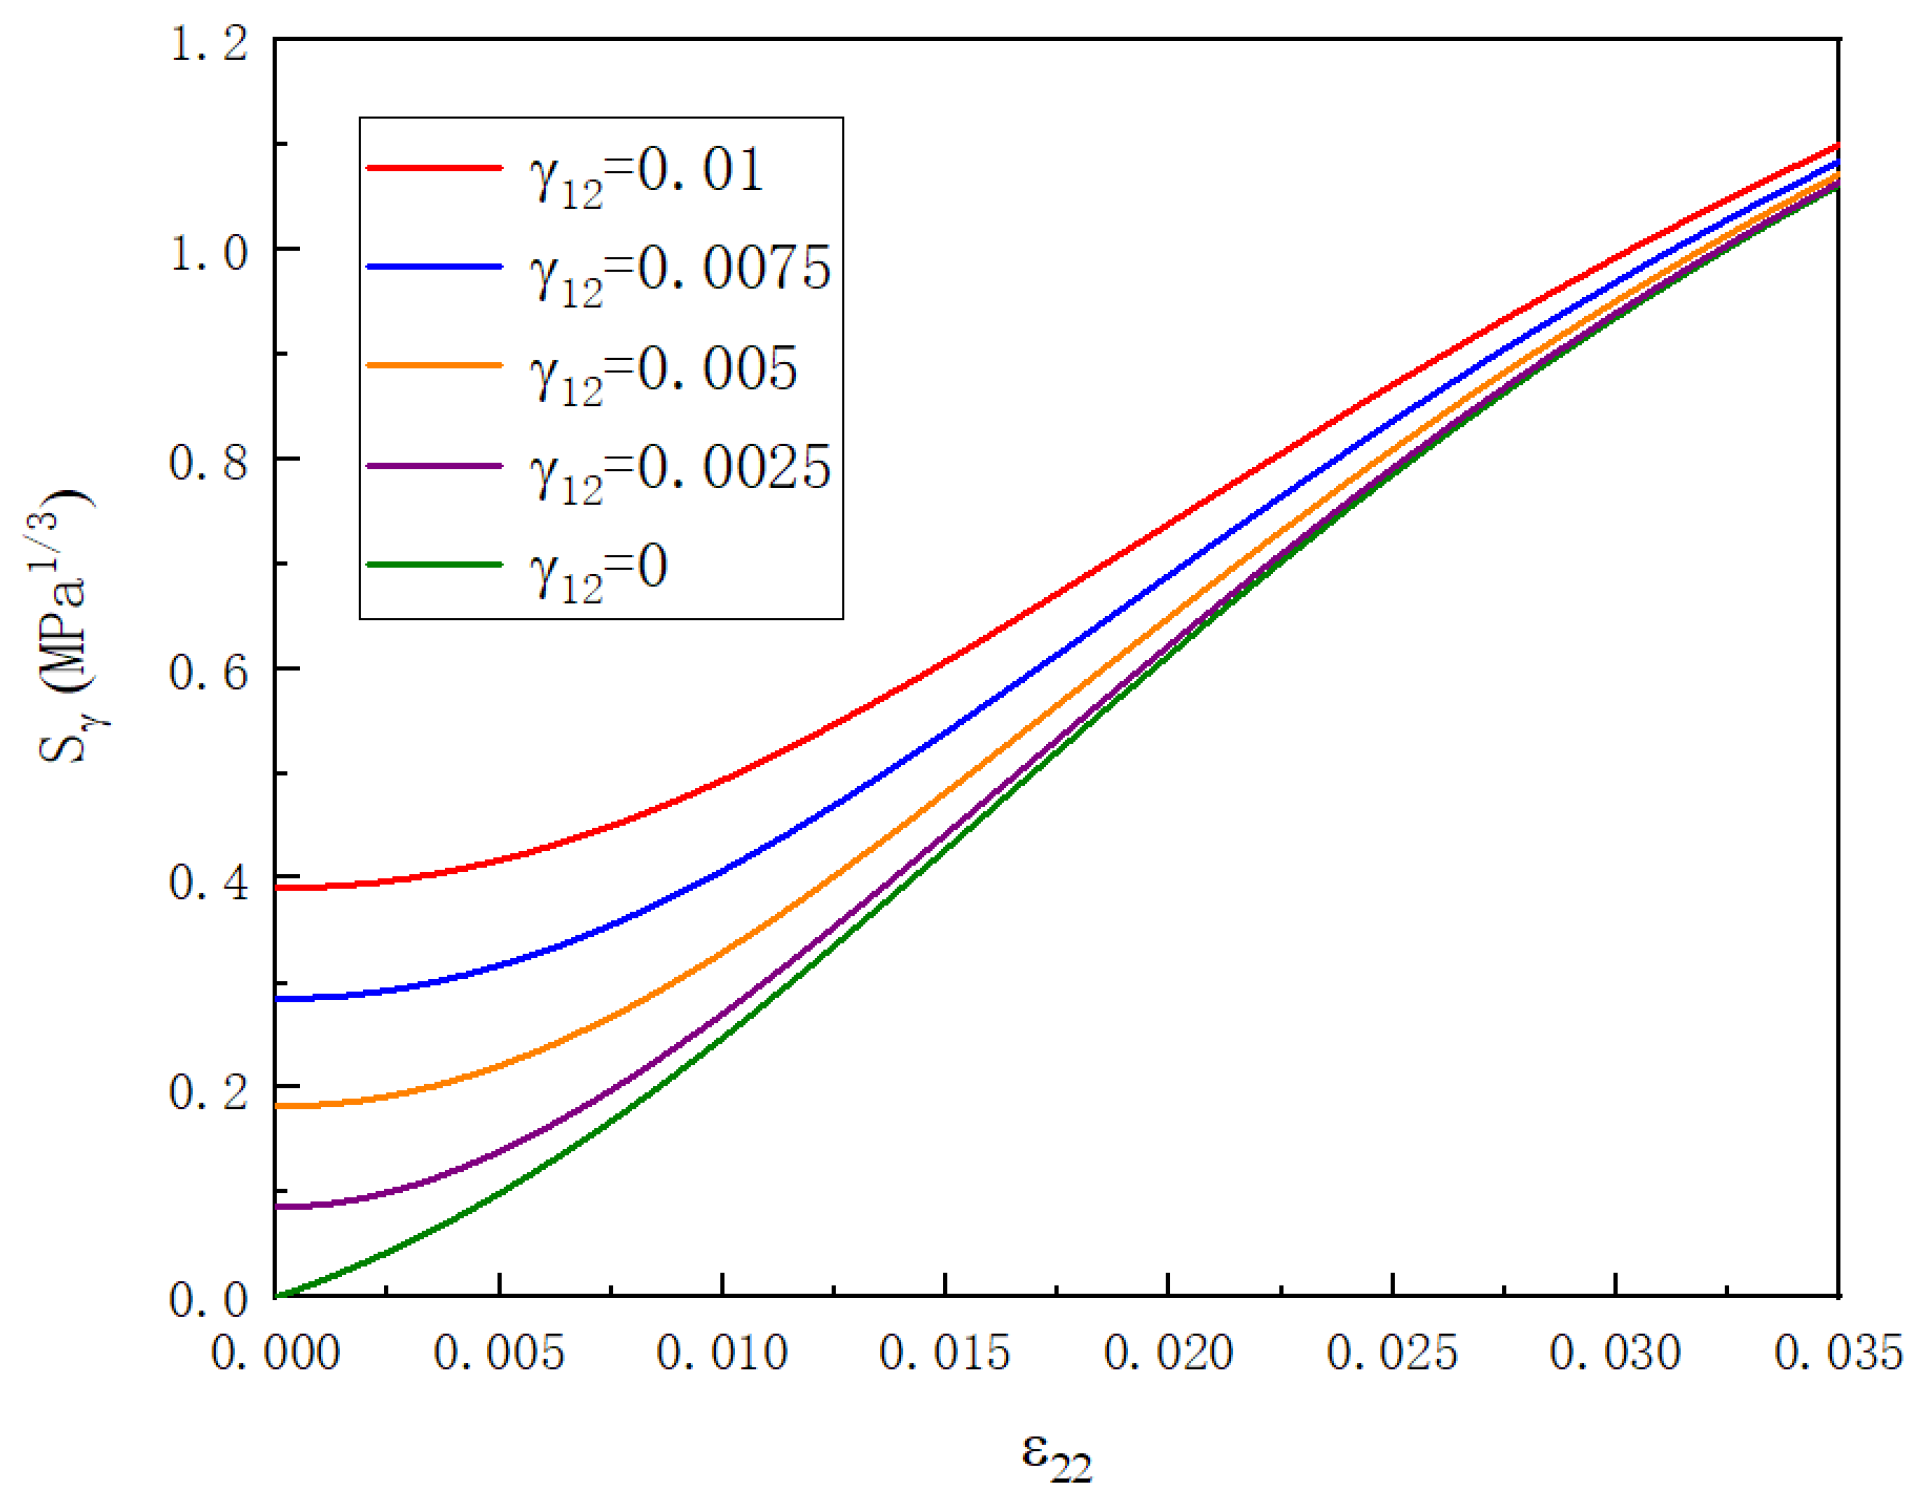
2.3. Calculating the Damage State

The damage mechanism associated with the internal state variable S only is limited to the matrix phase of composite materials, so it is considered that the damage is limited to E22 and G12, or only degrades the matrix material in the RUC. Both E22 and G12 are functions of the internal state variable S, which can be expressed as,
E 22 = E 220 e s ( S )
G 12 = G 120 g s ( S )
where, E220 and G120 represent the original transverse elastic modulus and shear modulus, and es(S) and gs(S) represent the polynomial function of the transverse and shear modulus with respect to S.
According to the plane stress constitutive relation, the expression of elastic strain energy density W can be expressed as,
W = 1 2 ( E 11 ε 11 2 + E 22 ε 22 2 + G 12 γ 12 2 ) + Q 12 ε 11 ε 22
By assuming Q12 is constant, and differentiating Equation (10) with respect to S yields,
ε 22 2 2 E 22 S + γ 12 2 2 G 12 S = 1
Experiments show that variable S is a function of ε3 [25], so a reduced internal state variable Sγ can be introduced,
S = S γ 3
Then, Equation (11) becomes
ε 22 2 2 E 22 S γ + γ 12 2 2 G 12 S γ = 3 S γ 2
Once Sγ is solved by Equation (13), the elastic moduli E22 and G12 can undergo nonlinear degradation according to Equations (8) and (9).

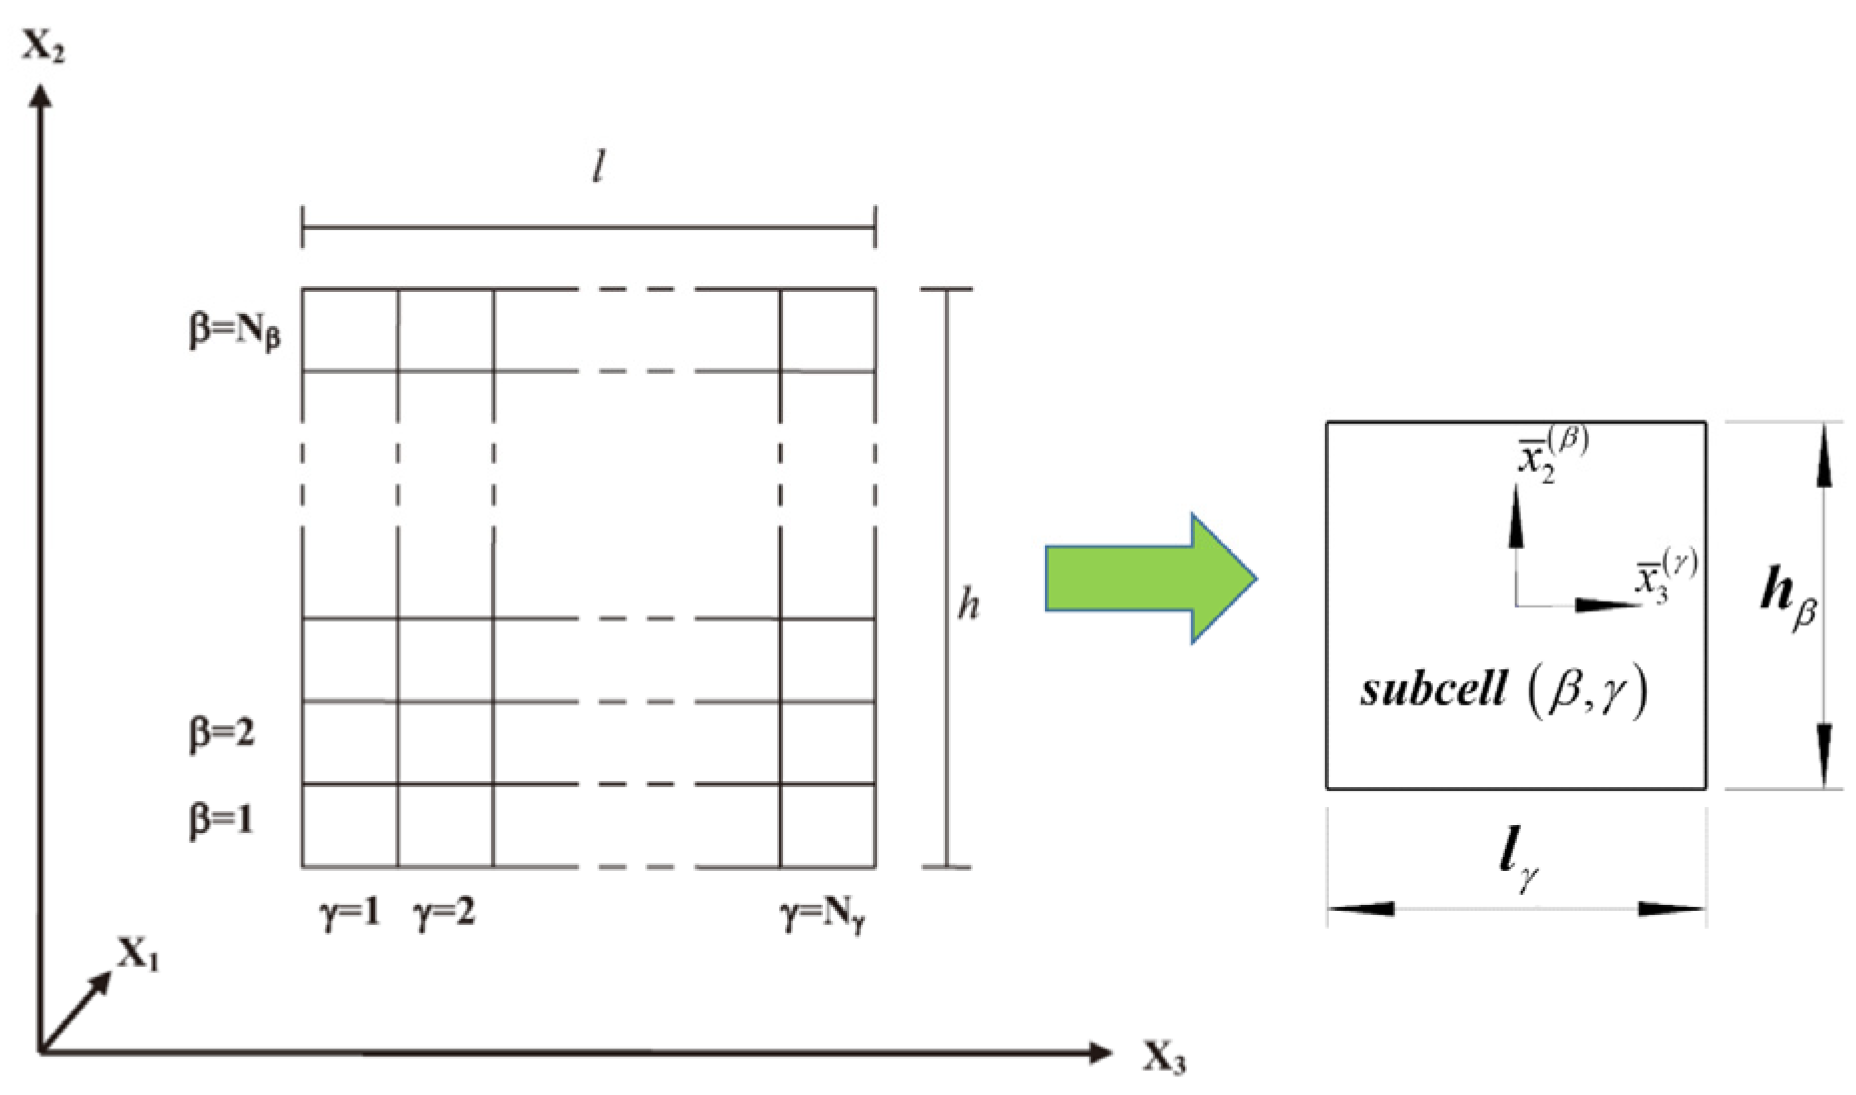
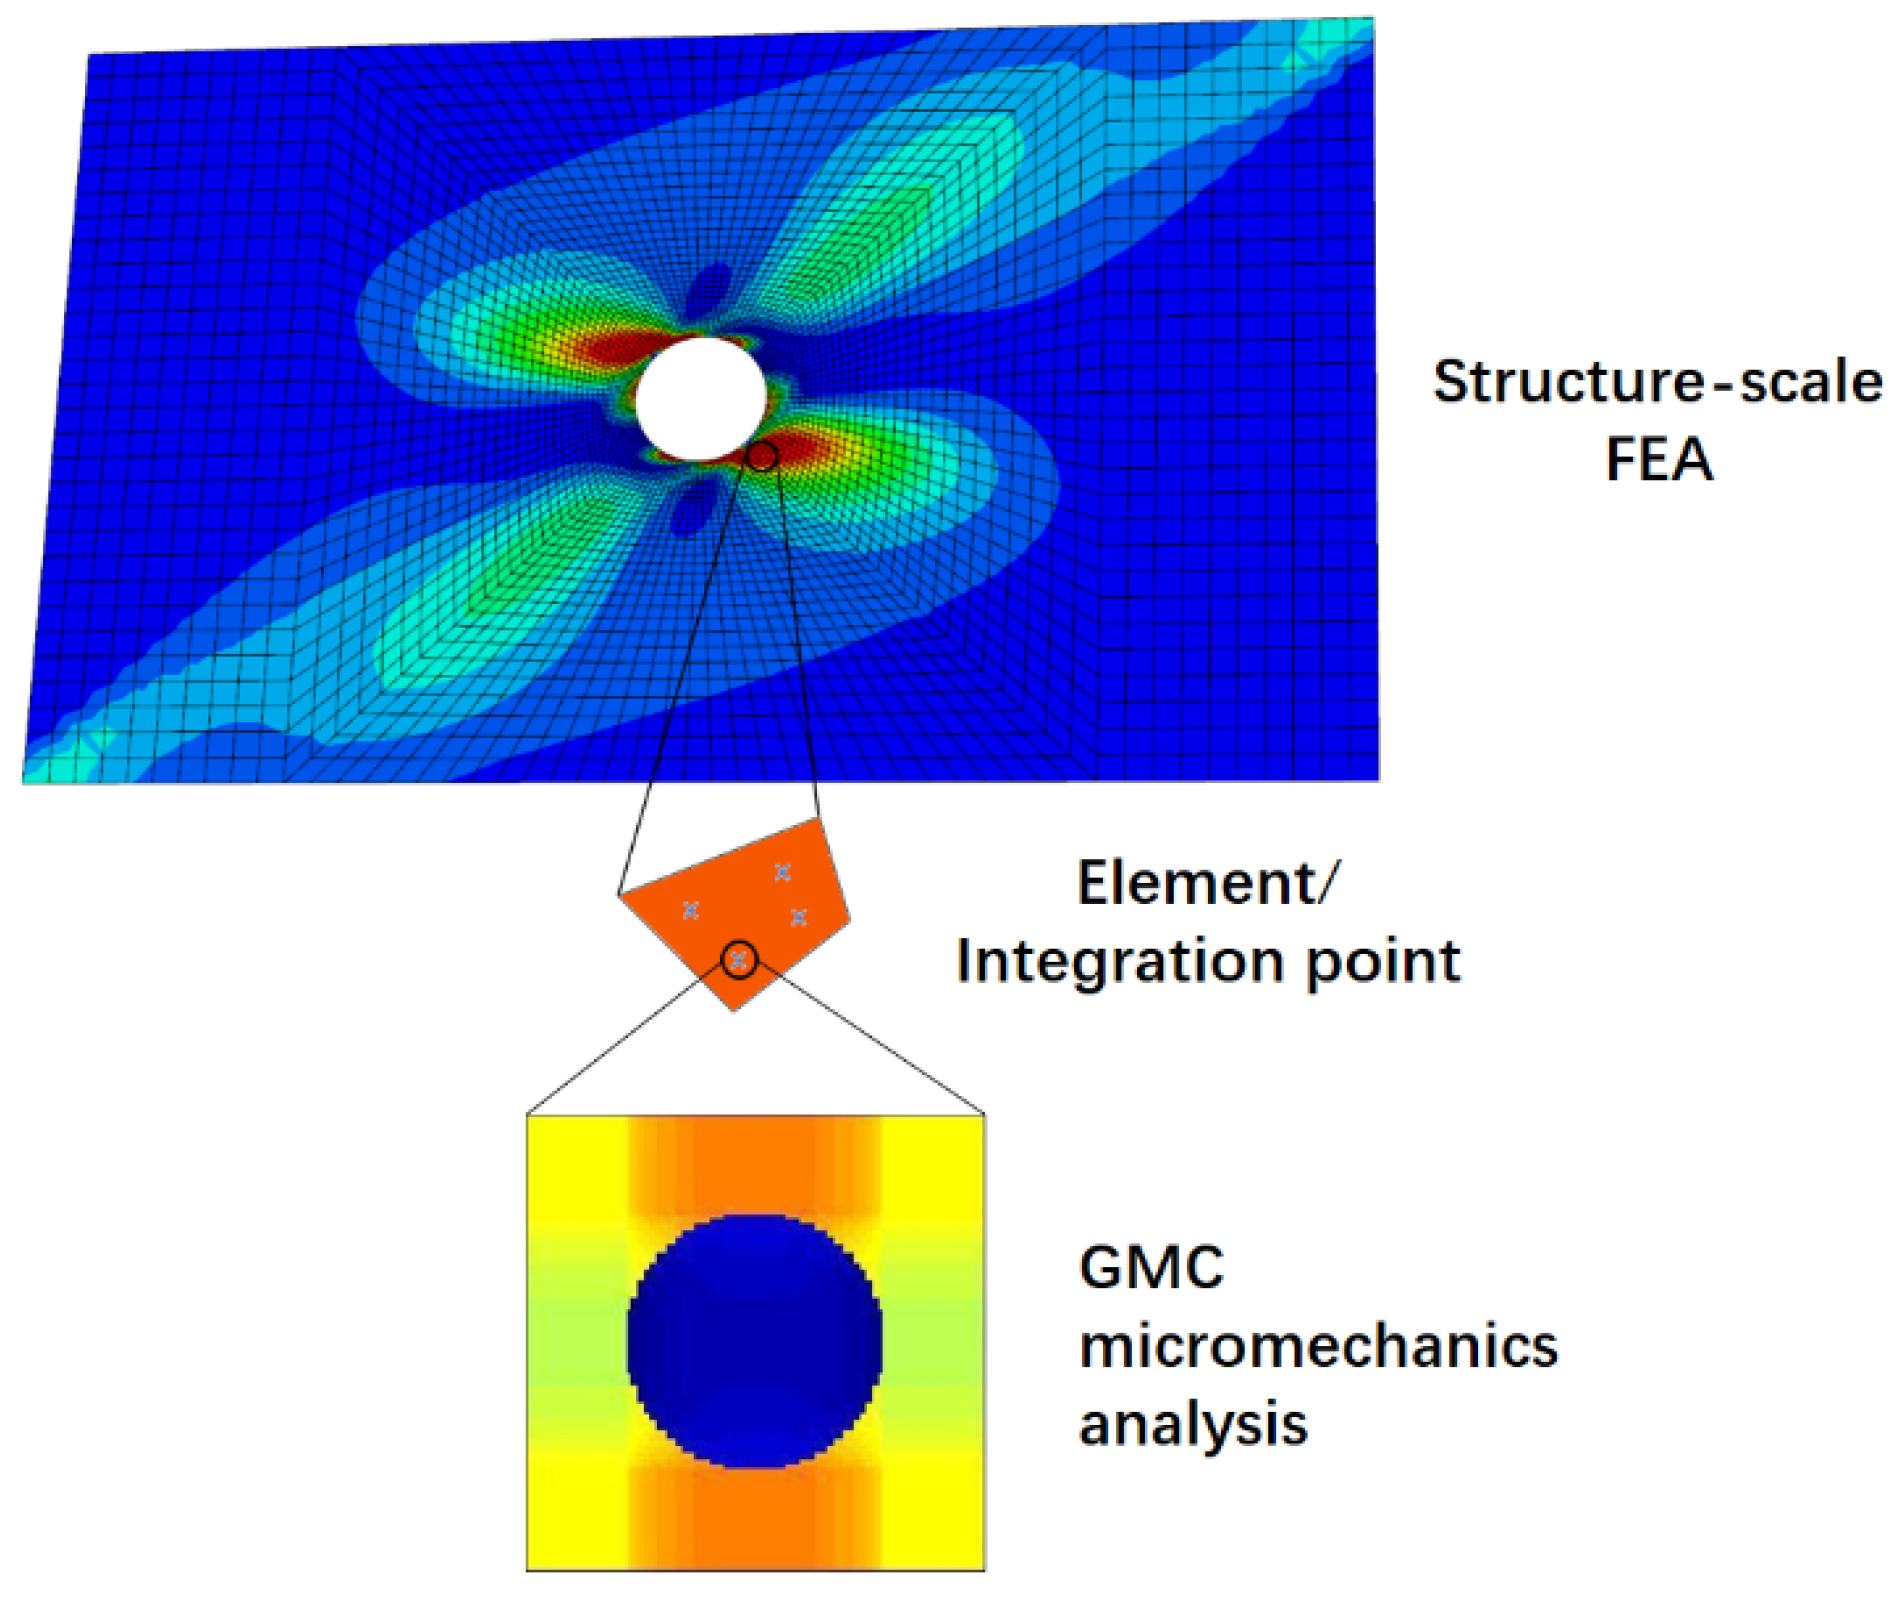
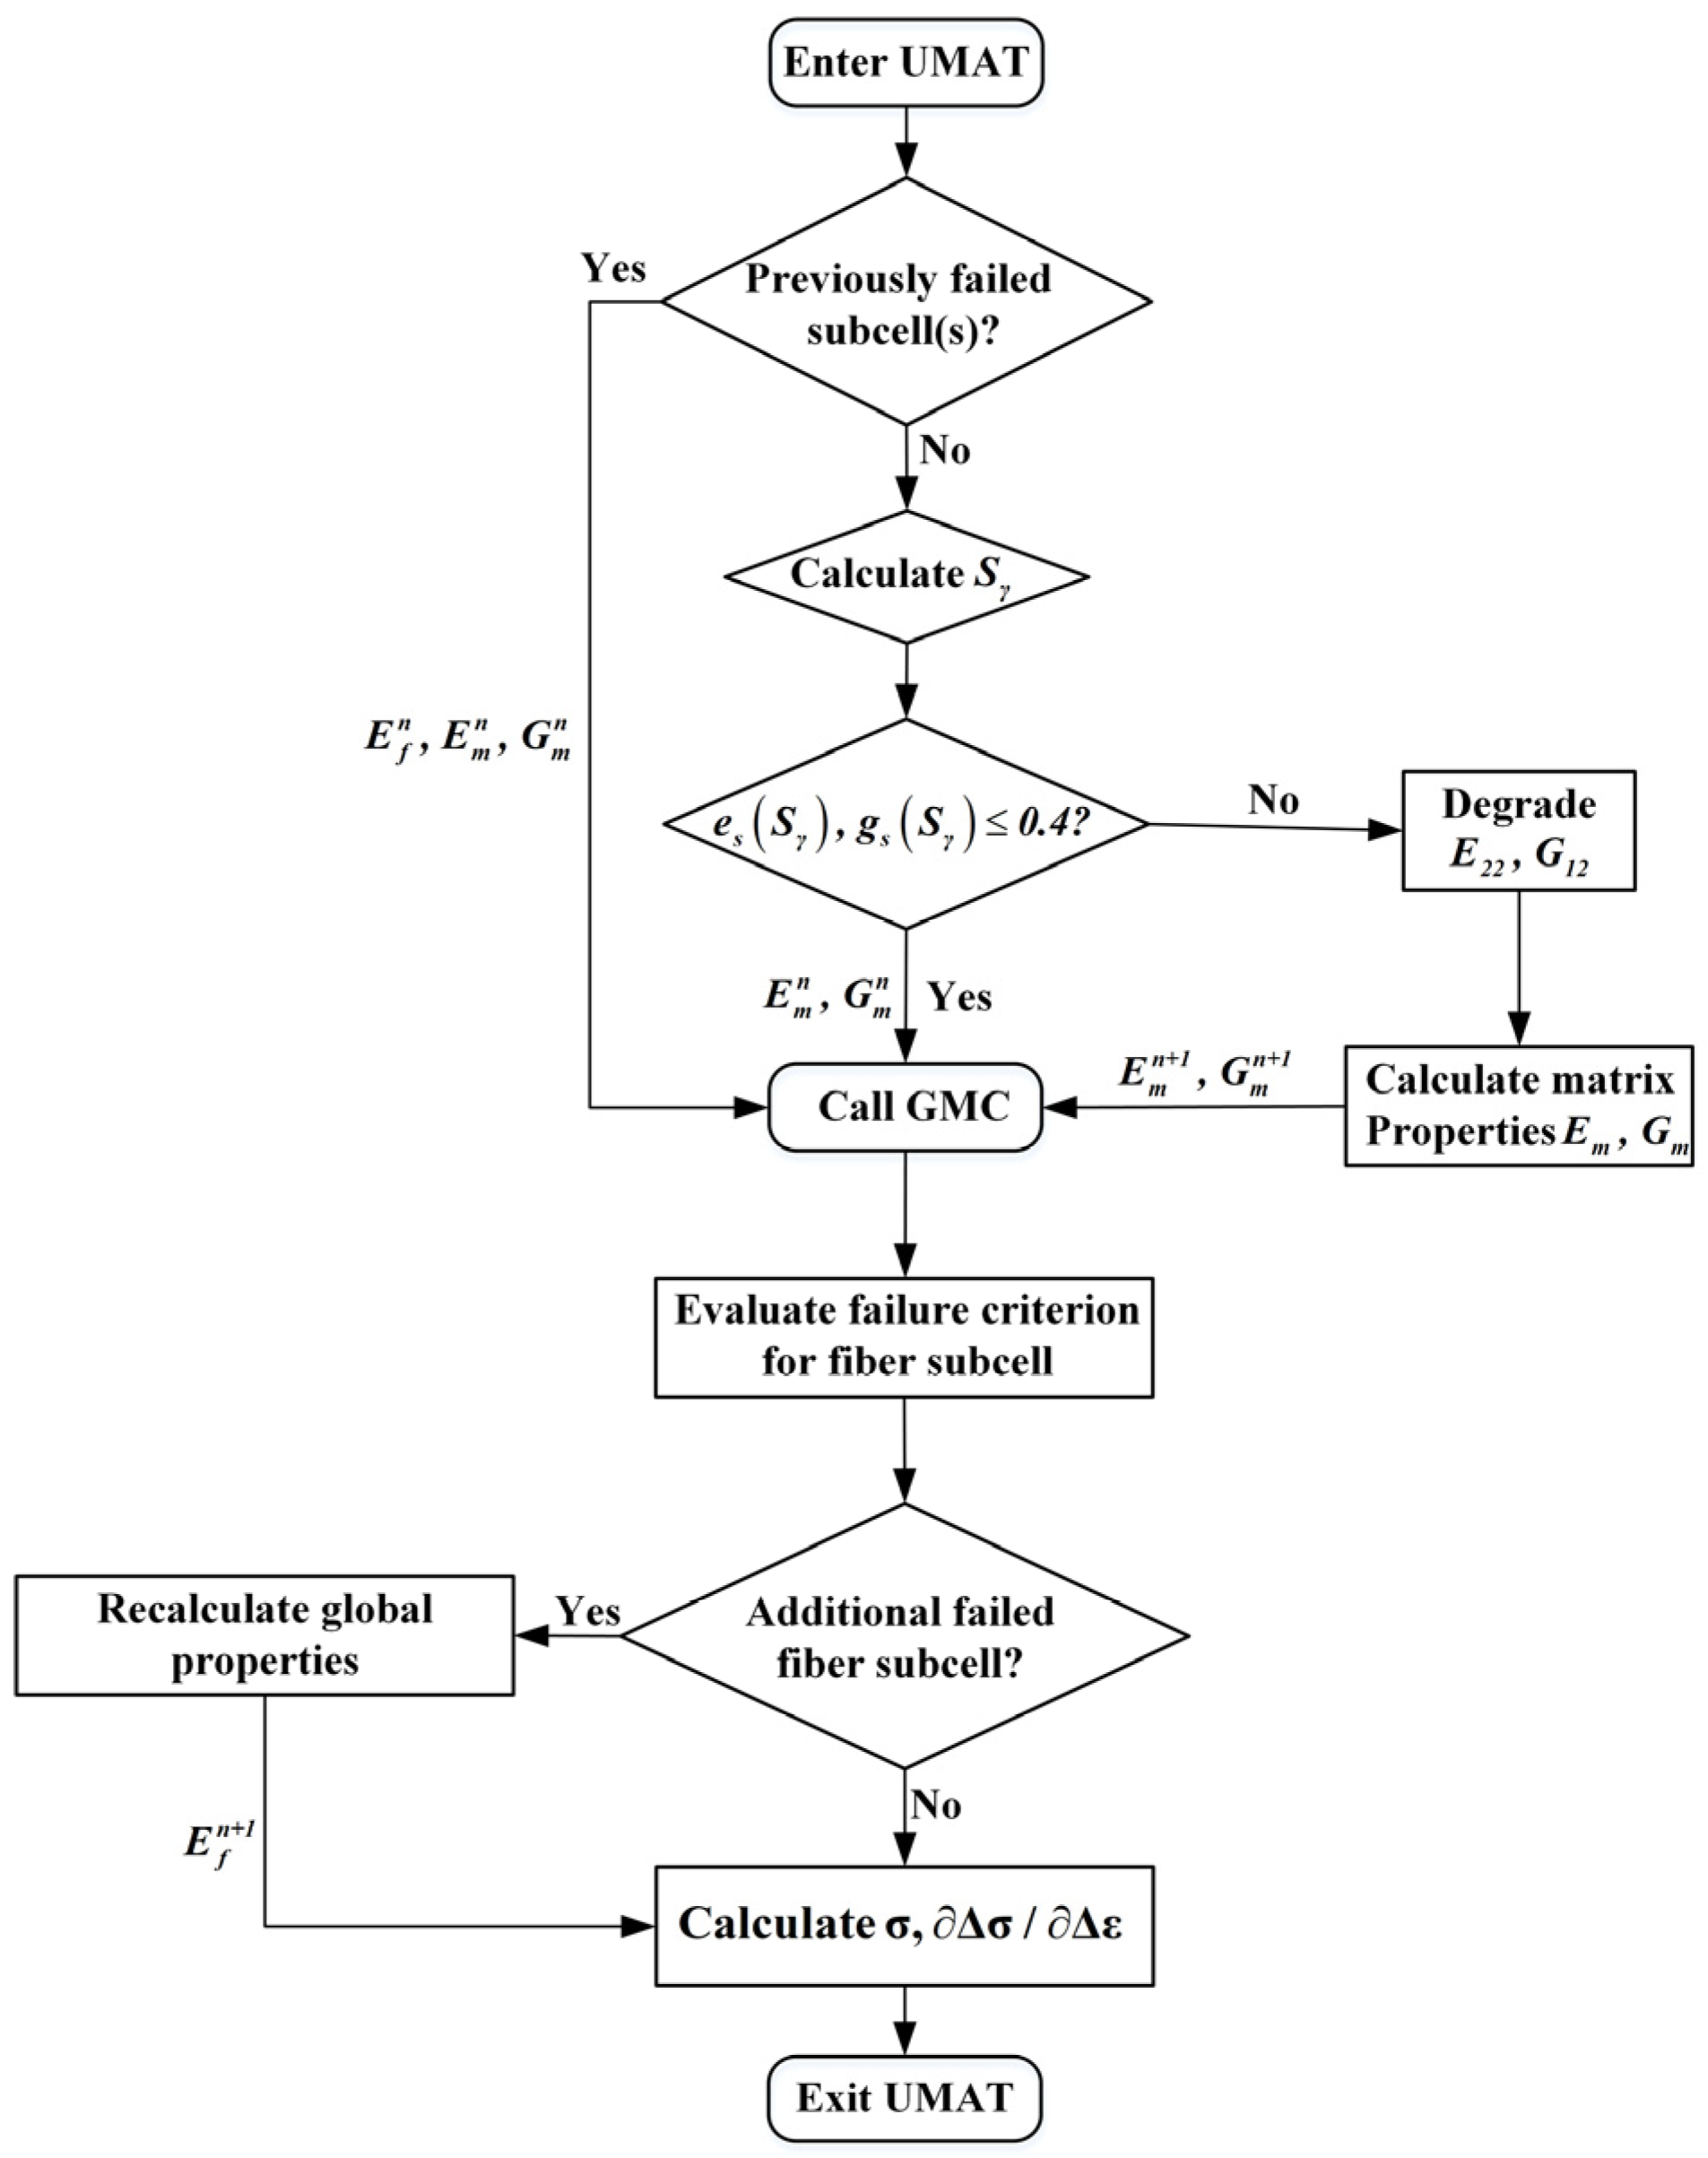
2.4. Generalized Method of Cells

The generalized method of cells (GMC) is employed to predict the strengths of continuous fiber composites in this work. The fiber reinforced composite is modeled as a rectangular repeating unit cell that contains a preset number of rectangular subcells as shown in Figure 2, and each subcell (βγ) may be occupied by a distinct homogeneous material. The constitutive equation in each subcell for the micromechanical model is denoted below,
σ ( β γ ) = C ( β γ ) ε ( β γ )
where σ(βγ), C(βγ), and ε(βγ) represent the average stress components, the elastic stiffness matrix, and the average total strain components in subcell (βγ), respectively. Inelastic strain and thermal strain are not took into considered herein.
The basic displacement assumptions in GMC is a linear polynomial, as shown in Formula (15), with the local coordinates ( x ¯ 2 ( β ) , x ¯ 3 ( γ ) ) located at the center of each subcell,
u i ( β γ ) = W i ( 00 ) ( β γ ) + y ¯ 2 ( β ) W i ( 10 ) ( β γ ) + y ¯ 3 ( γ ) W i ( 01 ) ( β γ ) i = 1 , 2 , 3
where W i ( 00 ) ( β γ ) represents the displacements at the center of subcell (βγ), microvariables W i ( 10 ) ( β γ ) and W i ( 01 ) ( β γ ) characterize the first-order dependence of the displacement field on the local coordinates x ¯ 2 ( β ) and x ¯ 3 ( γ ) .
The formulation of GMC involves imposition of several governing conditions, including application of continuity of displacements and tractions at each of the subcell interfaces and the periodic boundaries of the repeating unit cell (RUC) in an average sense. By regarding the stress components in the subcells as the basic unknowns, a system of equations relating the unknown stress variables to the macroscopic strains can be represented as follows,
G T = f m
where the G matrix consists of information on the geometry and mechanical properties of the material in the individual subcells (βγ), the T vector represents the subcell stress components that need to be solved, and the f m vector incorporates information of geometrical dimensions and the global strains on the RUC.
The expression that relates the average strain in the subcell to the externally global strain in virtue of the solutions of Equation (16), then the final form of the global constitutive equation that relates the average stress σ ¯ and strain ε ¯ is determined as follow,
σ ¯ = C * ε ¯
where C* is the average or effective stiffness matrix.
The global stress can be established in the GMC repeating unit cell as follow,
σ ¯ = 1 h l β = 1 N β γ = 1 N γ h β l γ σ ( β γ )
where h and l represent the height and length of the RUC, hβ and lγ represent the height and length of the subcell (βγ), as shown in Figure 2.
The GMC model is applied to each integration point of each finite element, and the strain states of each integral point are taken as the load input to the RUC, then the stress and strain states of each constitutive materials can be obtained according to Equation (16). The damage evolution and failure are evaluated at the micro-level, and after updating the stiffness matrix using the homogenization method, the multi-scale analysis will entry the next finite element iterative calculation. Figure 3 is a schematic diagram of the analysis process.

3. Analysis Method

Three analysis methods are adopted in this paper, one is a multi-scale analysis method based on GMC, the second method is based on ST at the lamina level, and the last one employs an empirical method based on the 2D Hashin-Rotem failure criteria and implicit solver of static analysis is used. The maximum stress failure criterion for fiber subcells and ST theory for matrix subcells are employed for the first method, the maximum stress failure criterion together with a degradation limit are used for the second method. Once the reduced internal state variable Sγ is determined, the transverse and shear stiffness of matrix properties degrades according to the damage functions es and gs. These damage and failure models for the static analysis are all implemented in ABAQUS/Standard employing the user-defined subroutine UMAT.

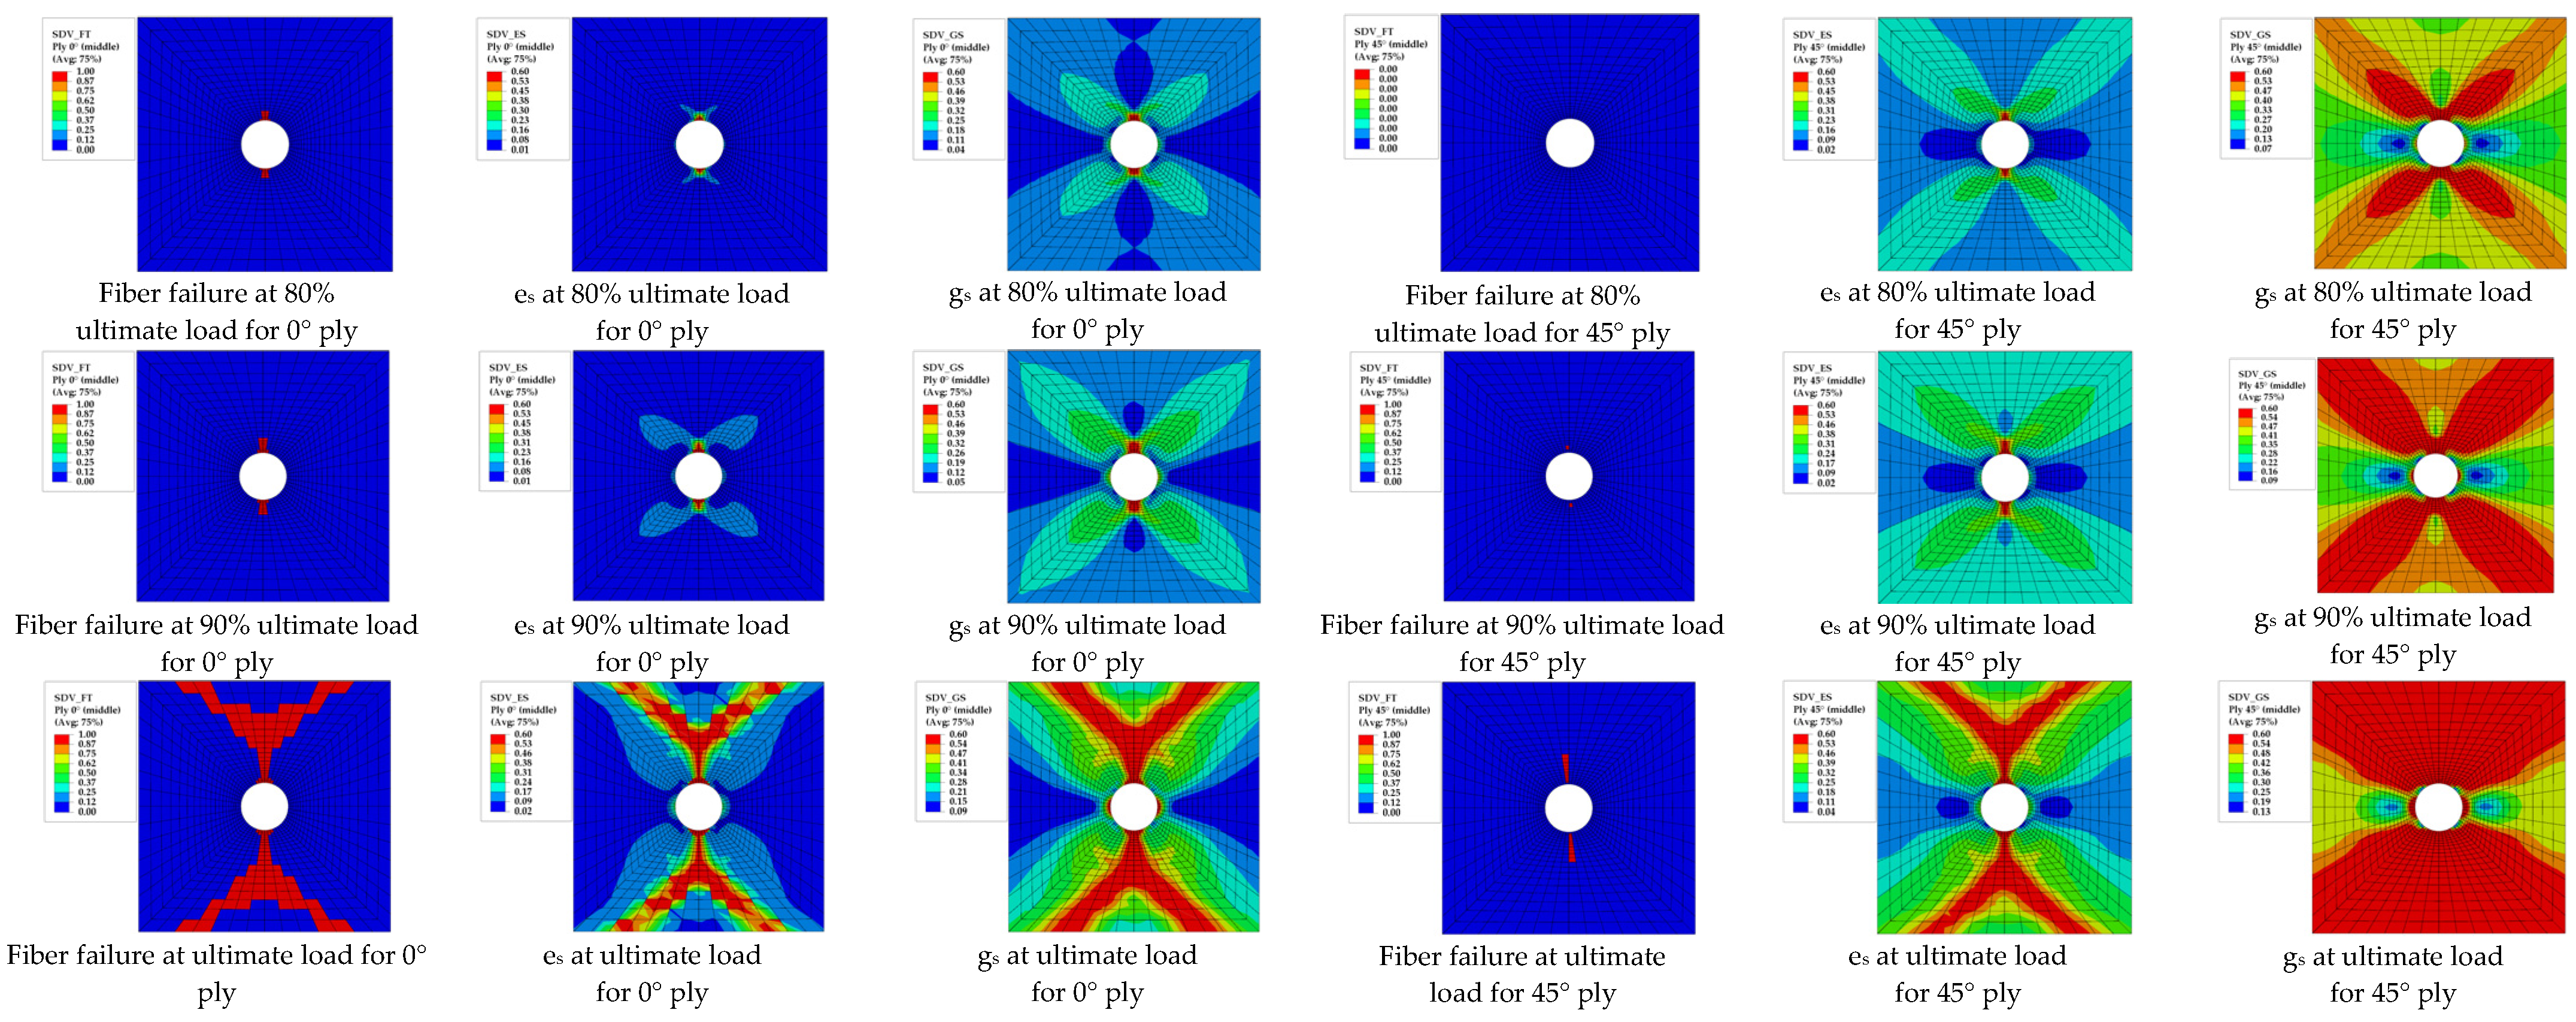
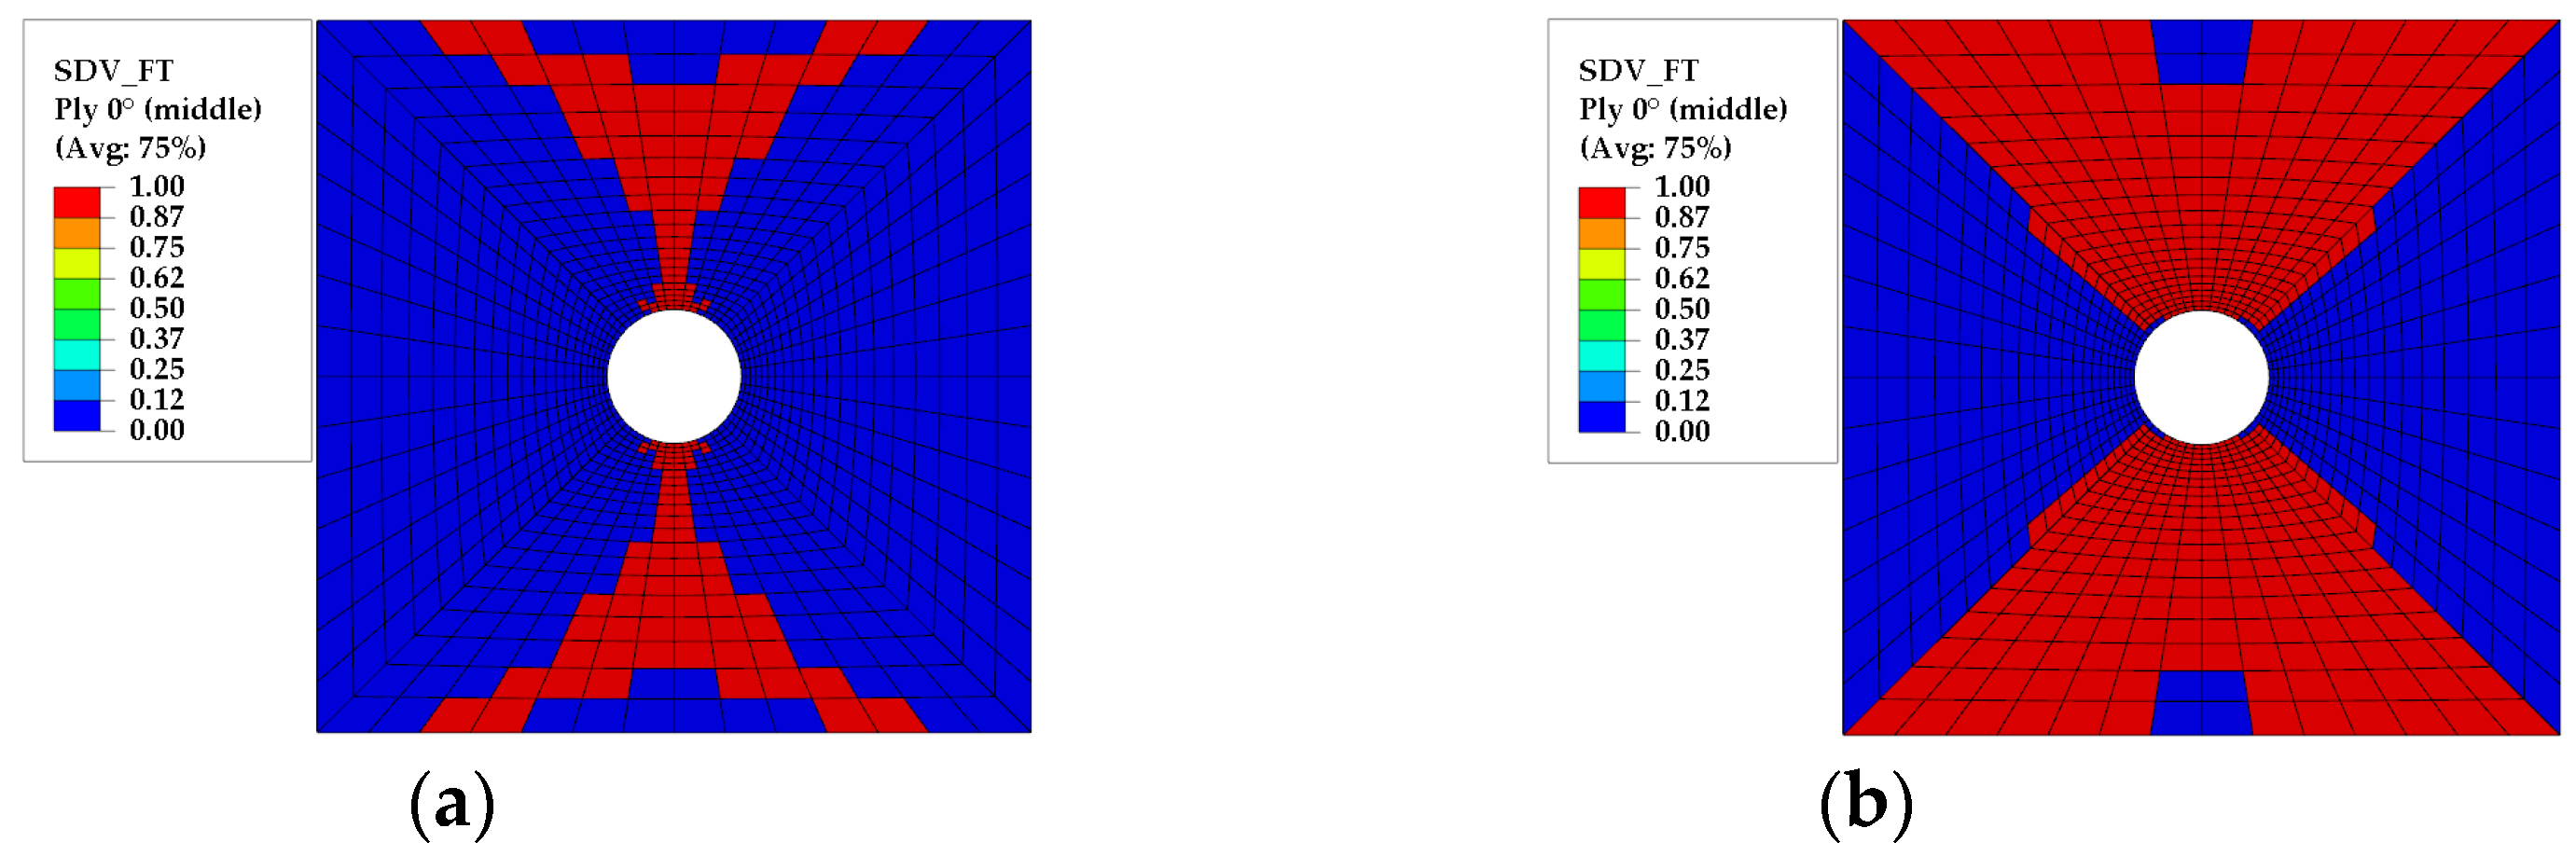
3.1. Lamina Level Damage and Failure Model Based on ST

According to the experimental data of transverse elastic modulus E22 and shear modulus G12 corresponding to internal variable Sγ in literature [26], damage functions es and gs are obtained by cubic polynomial fitting, as shown in equations below. The coefficients are shown in Table 1. Figure 4 shows the polynomial es and gs obtained by fitting and the experimental data, respectively. The fitting effect is very ideal. The damage evolution rate of G12 is obviously higher than that of E22.
e s = e s 0 + e s 1 S γ + e s 2 S γ 2 + e s 3 S γ 3
g s = g s 0 + g s 1 S γ + g s 2 S γ 2 + g s 3 S γ 3
According to Equation (13), the value of Sγ depends on the strain state of the repeating unit cell, that is, it is determined by the transverse strain ε22 and shear strain γ12. Figure 5 show the changing curves of Sγ with ε22 in the interval [0, 0.035] when γ12 is selected to be 0, 0.0025, 0.005, 0.0075, and 0.01. It can be seen that the positive solution of Sγ is unique and monotonically increasing. The growth rate increases first, then decreases, and finally flattens out. The values of Sγ are between 0 and 1.2.
It is generally believed that fiber fracture occurs instantaneously and results in immediate local failure of laminates. Therefore, the properties of fiber is deemed to be linear before it reaches the ultimate failure, so the strength prediction can be satisfied by using a simple maximum stress failure criterion.
( σ 11 X T ) 2 = d f 2 ,   σ 11 > 0
( σ 11 X C ) 2 = d f 2 ,   σ 11 < 0
where σ11 is the stress in the fiber direction, XT and XC are the fiber direction tensile and compressive strengths. Fiber failure will initiate when df exceed 1.
For the matrix damage of monolayer plate, the degradation of E22 and G12 for a laminate or the RUC is reduced by Equations (8) and (9). Since material softening may cause convergence problems for the finite element model using the implicit algorithm, the degradation ratio of E22 and G12 was limited to 0.4, after which the damage evolution was terminated and E22 and G12 would remain constant, and the matrix material is considered to be failed.

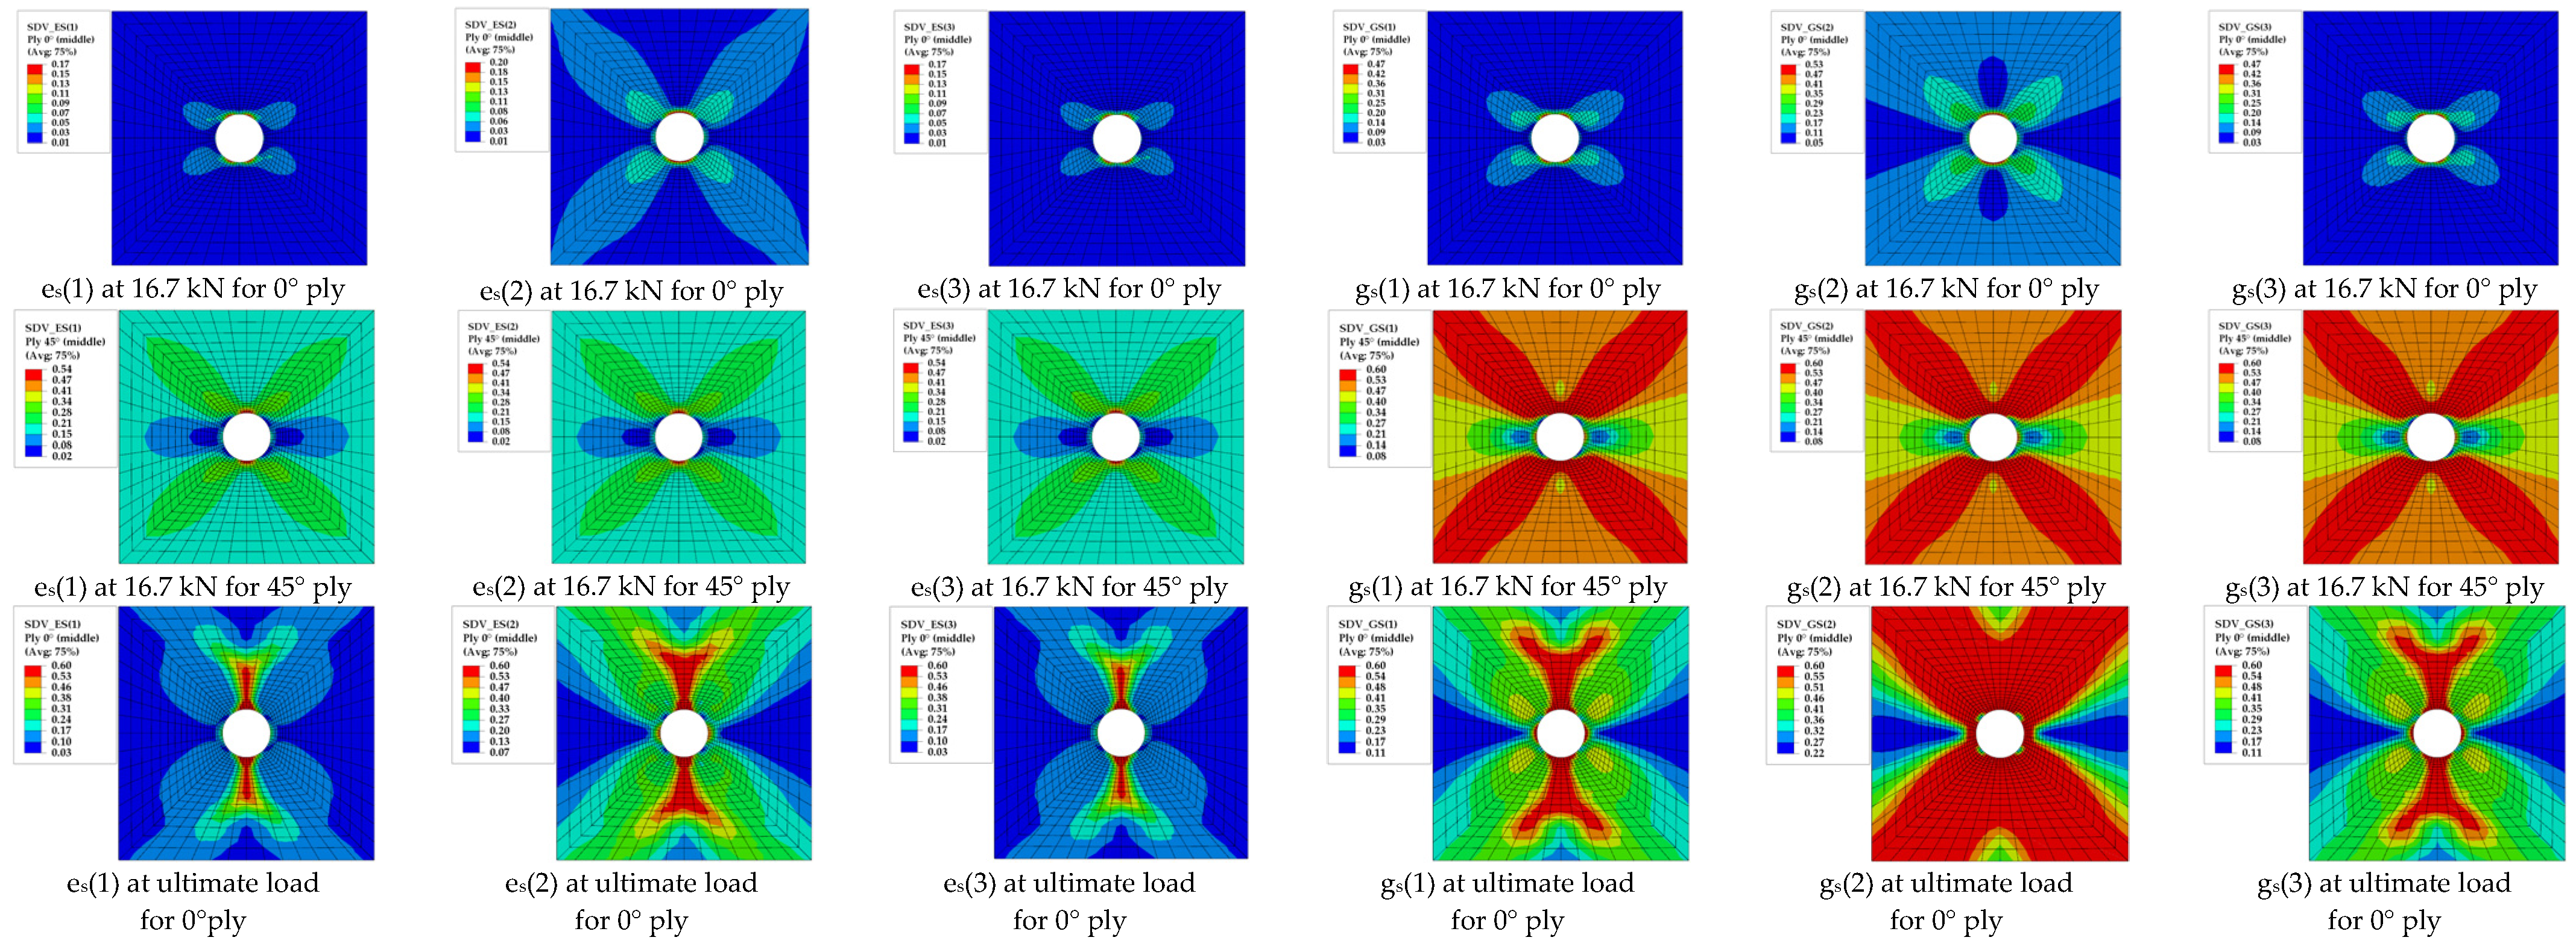
3.2. Micro-Scale Damage and Failure Model

The micromechanical GMC model can capture the interaction between the constituents of composite materials, and can easily analyze the damage or failure of fiber and matrix phases independently. Each material point in the finite element model corresponds to a 2 × 2 RUC [21], as shown in Figure 6, containing one fiber subcell and three matrix subcells. The fiber volume fraction of T800/3900-2 lamina is 0.6, and its properties of fiber and matrix constituents are shown in Table 2 and Table 3.
Fiber subcells are considered to be linear before the failure occurs, and the fiber subcell failure is determined by the maximum stress failure criterion, which is shown in Equations (23) and (24). The material properties of fiber constituent after failure are immediately reduced to 0.01% of its initial value.
( σ ¯ 11 ( 11 ) X f t ) 2 = d f 2 ,   σ ¯ 11 > 0
( σ ¯ 11 ( 11 ) X f c ) 2 = d f 2 ,   σ ¯ 11 < 0
where σ ¯ 11 ( 11 ) is the stress of the fiber subcell in the longitudinal direction, Xfc and Xfc are its tensile and compressive strengths. When damage variable df is greater than or equal to 1, fiber subcells would fail.
In each time step of the multiscale analysis, the GMC micromechanics model calculates the overall elastic moduli should be consistent with the laminate level moduli obtained from Equations (8) and (9). Therefore, the matrix subcells should be degraded in a certain way in order to produce the same E22 and G12. Matrix constituent properties are also functions of the reduced internal state variable Sγ,
E m = E m 0 e s ( S γ )
G m = G m 0 g s ( S γ )
The value of Sγ is determined by the following formula,
( ε ¯ 22 ( β γ ) ) 2 2 E m 0 S γ + ( γ ¯ 12 ( β γ ) ) 2 2 G m 0 S γ = 3 S γ 2
where ε ¯ 22 ( β γ ) and γ ¯ 12 ( β γ ) represent transverse strain and shear strain of matrix subcell (βγ). Matrix subcell stress vector σ ¯ ( β γ ) can be obtained by the following formula,
σ ¯ ( β γ ) = A ε ¯ ,
A is a third-order matrix connecting the macroscopic strain components and the stress components of each subcell under the plane stress state.
Using the constitutive relation of the subcell material, there is
ε ¯ ( β γ ) = S ( β γ ) σ ¯ ( β γ )
where S ( β γ ) is the flexibility matrix of the subcell (βγ) material.
Combined with Equations (28) and (29), the expressions of strain of each subcell are as follows:
ε ¯ ( β γ ) = S ( β γ ) A ε ¯
Due to the different stress-strain states of each matrix subcell at the same material point in the analysis process, the damage evolution rates of different matrix subcells are different. In order to keep the same as the damage limit 0.4 of lamina level E22 and G12, the matrix subcell material with damage evolution dropping to 0.4 earlier stops, degrading until the last matrix subcell reaches the degradation limit, which represents the final matrix failure of the RUC. The flow chart of multi-scale analysis algorithm based on a four-subcells GMC model is as shown in Figure 7.

3.3. Lamina-Scale Failure Model-Based Hashin-Rotem Theory

The Hashin-Rotem failure theory include separate criteria for fiber and matrix. The fiber failure criteria are the same as the maximum stress criteria as shown in Equations (21) and (22). Matrix failure are contributed by the transverse and shear stresses in a lamina, which are dictated by
( σ 22 Y T ) 2 + ( τ 12 S ) 2 = d m 2 ,   σ 22 > 0
( σ 22 Y C ) 2 + ( τ 12 S ) 2 = d m 2 ,   σ 22 < 0
where σ22 and τ12 are the transverse and shear stresses in a lamina, YT, YC, and S are respectively the transverse compressive strength, transverse tensile strength, and shear strength in the composite lamina.

4. Results and Discussion

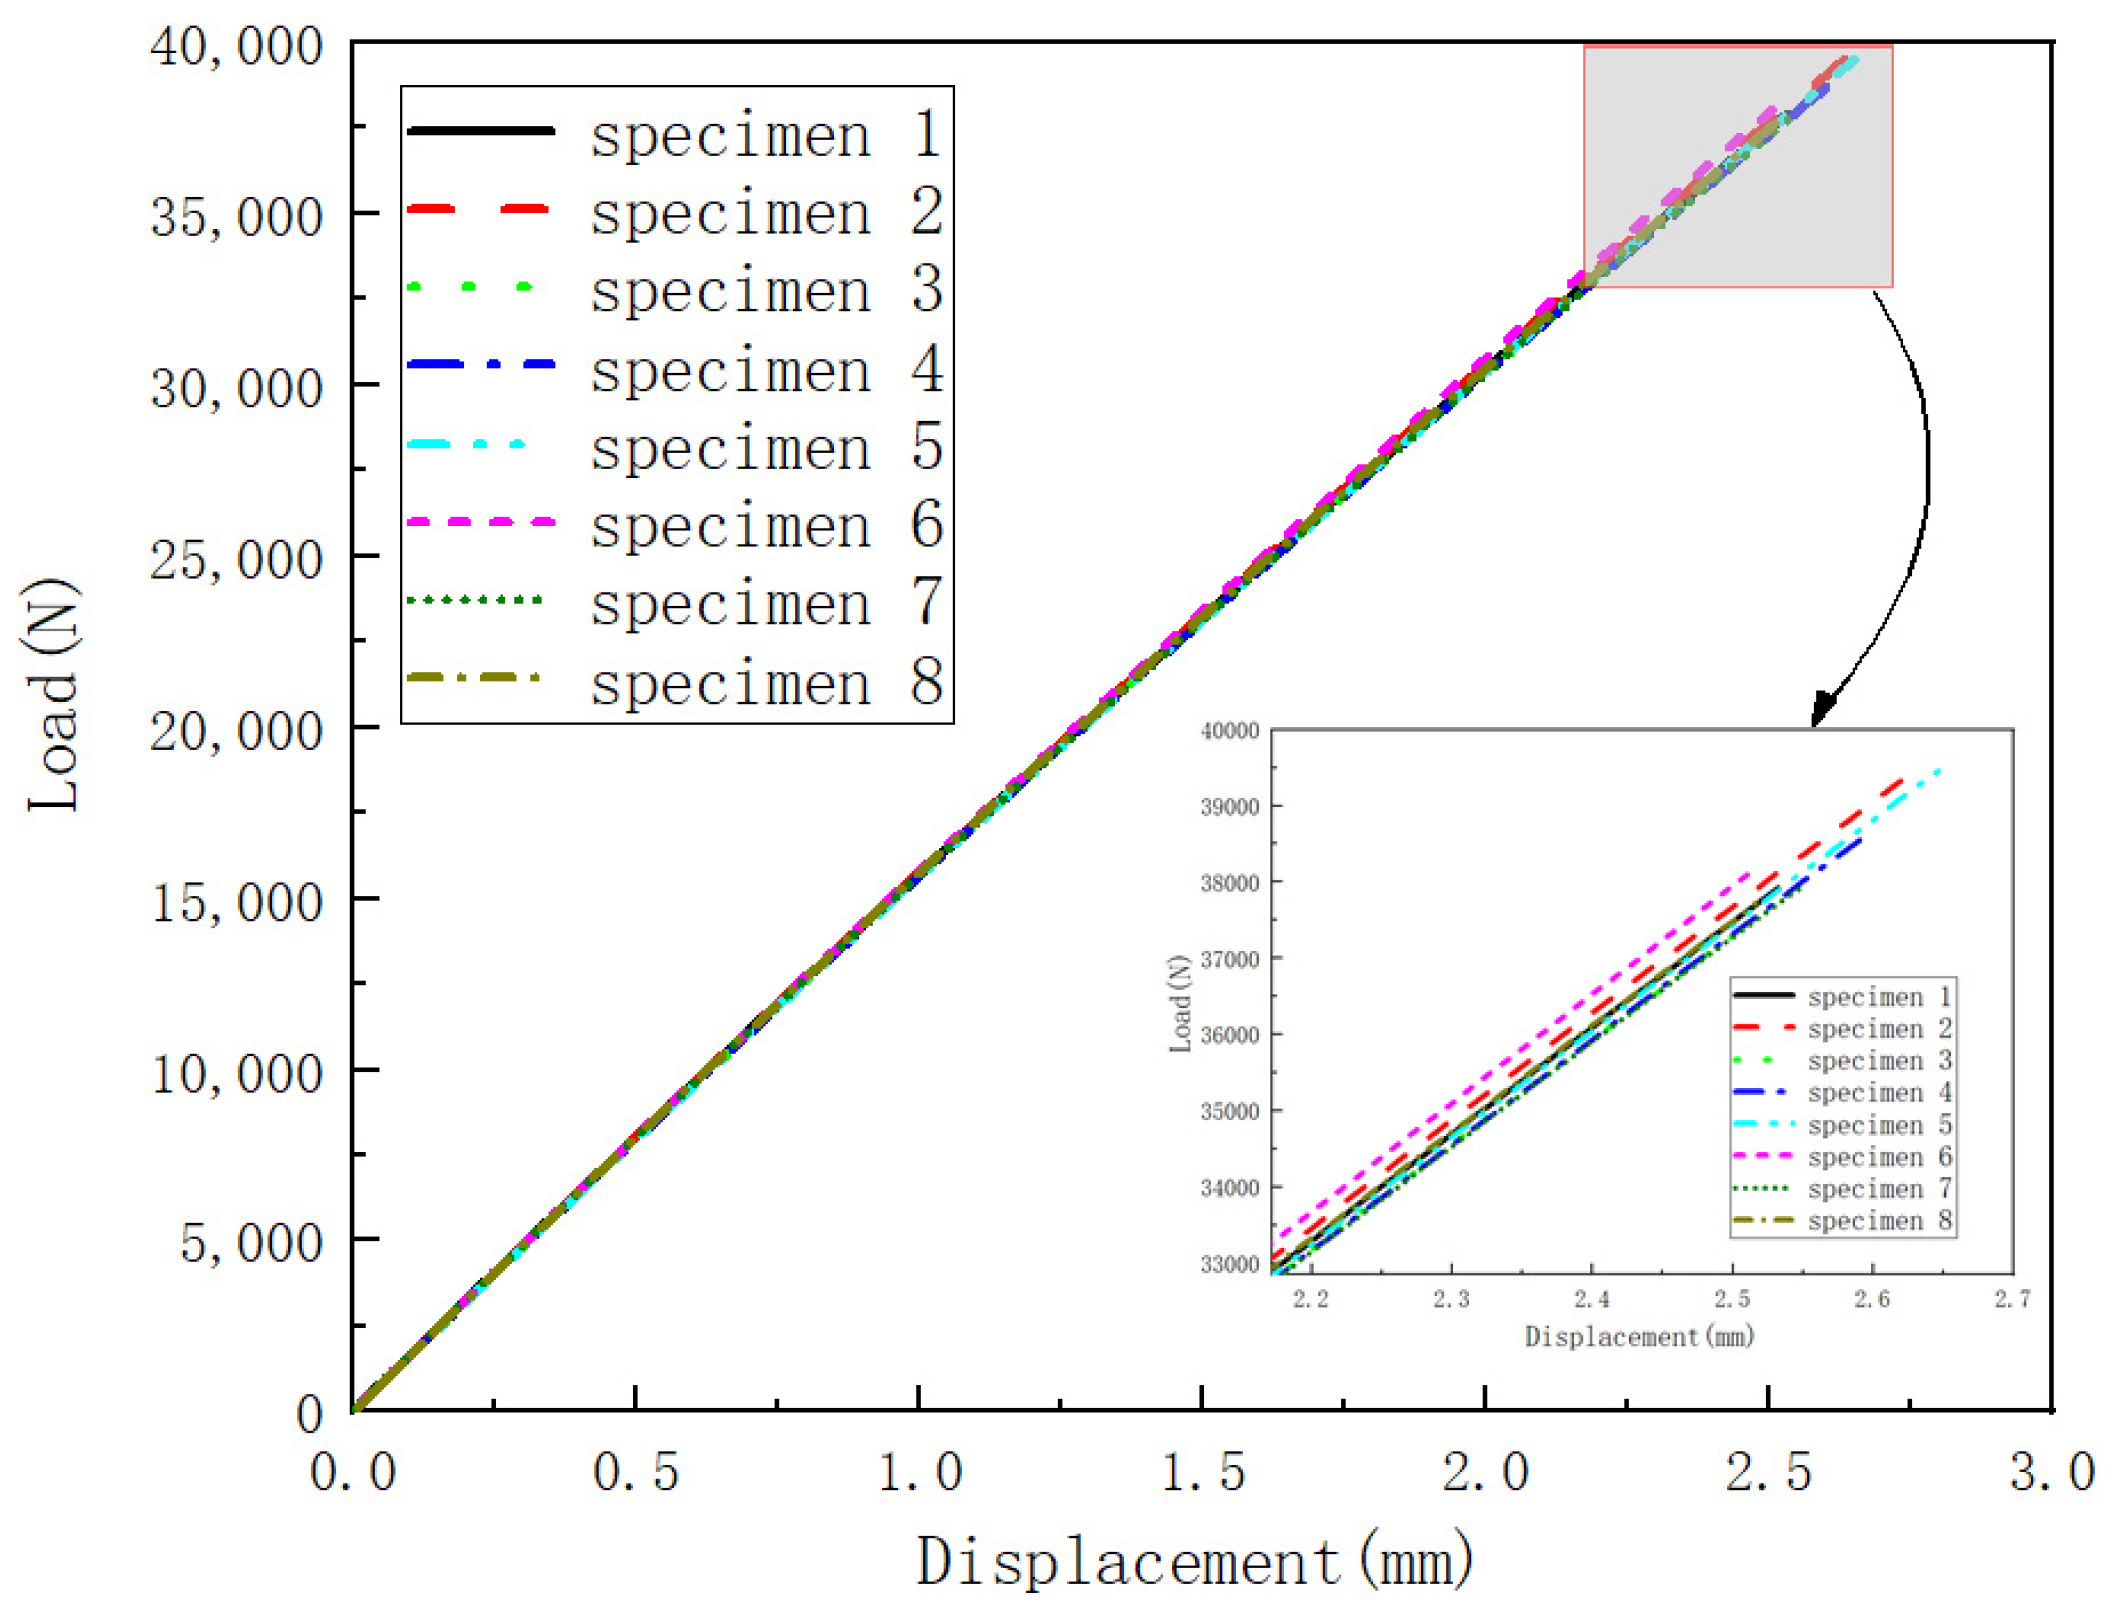
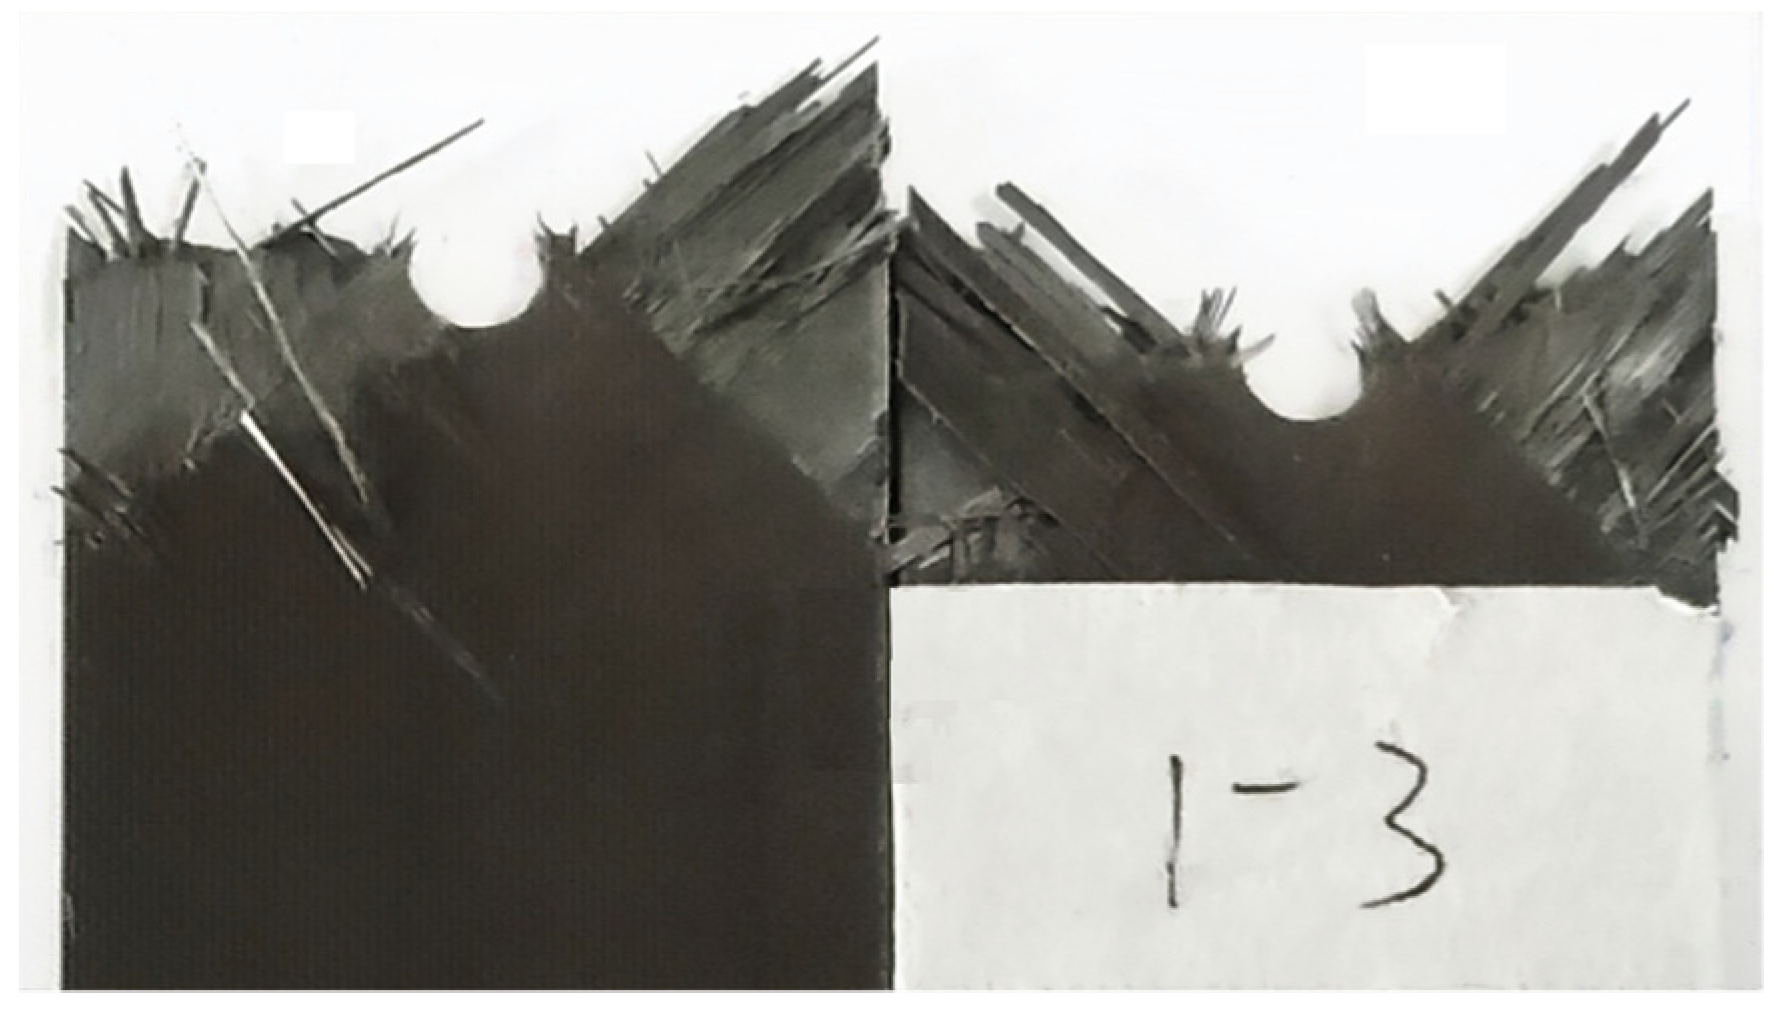
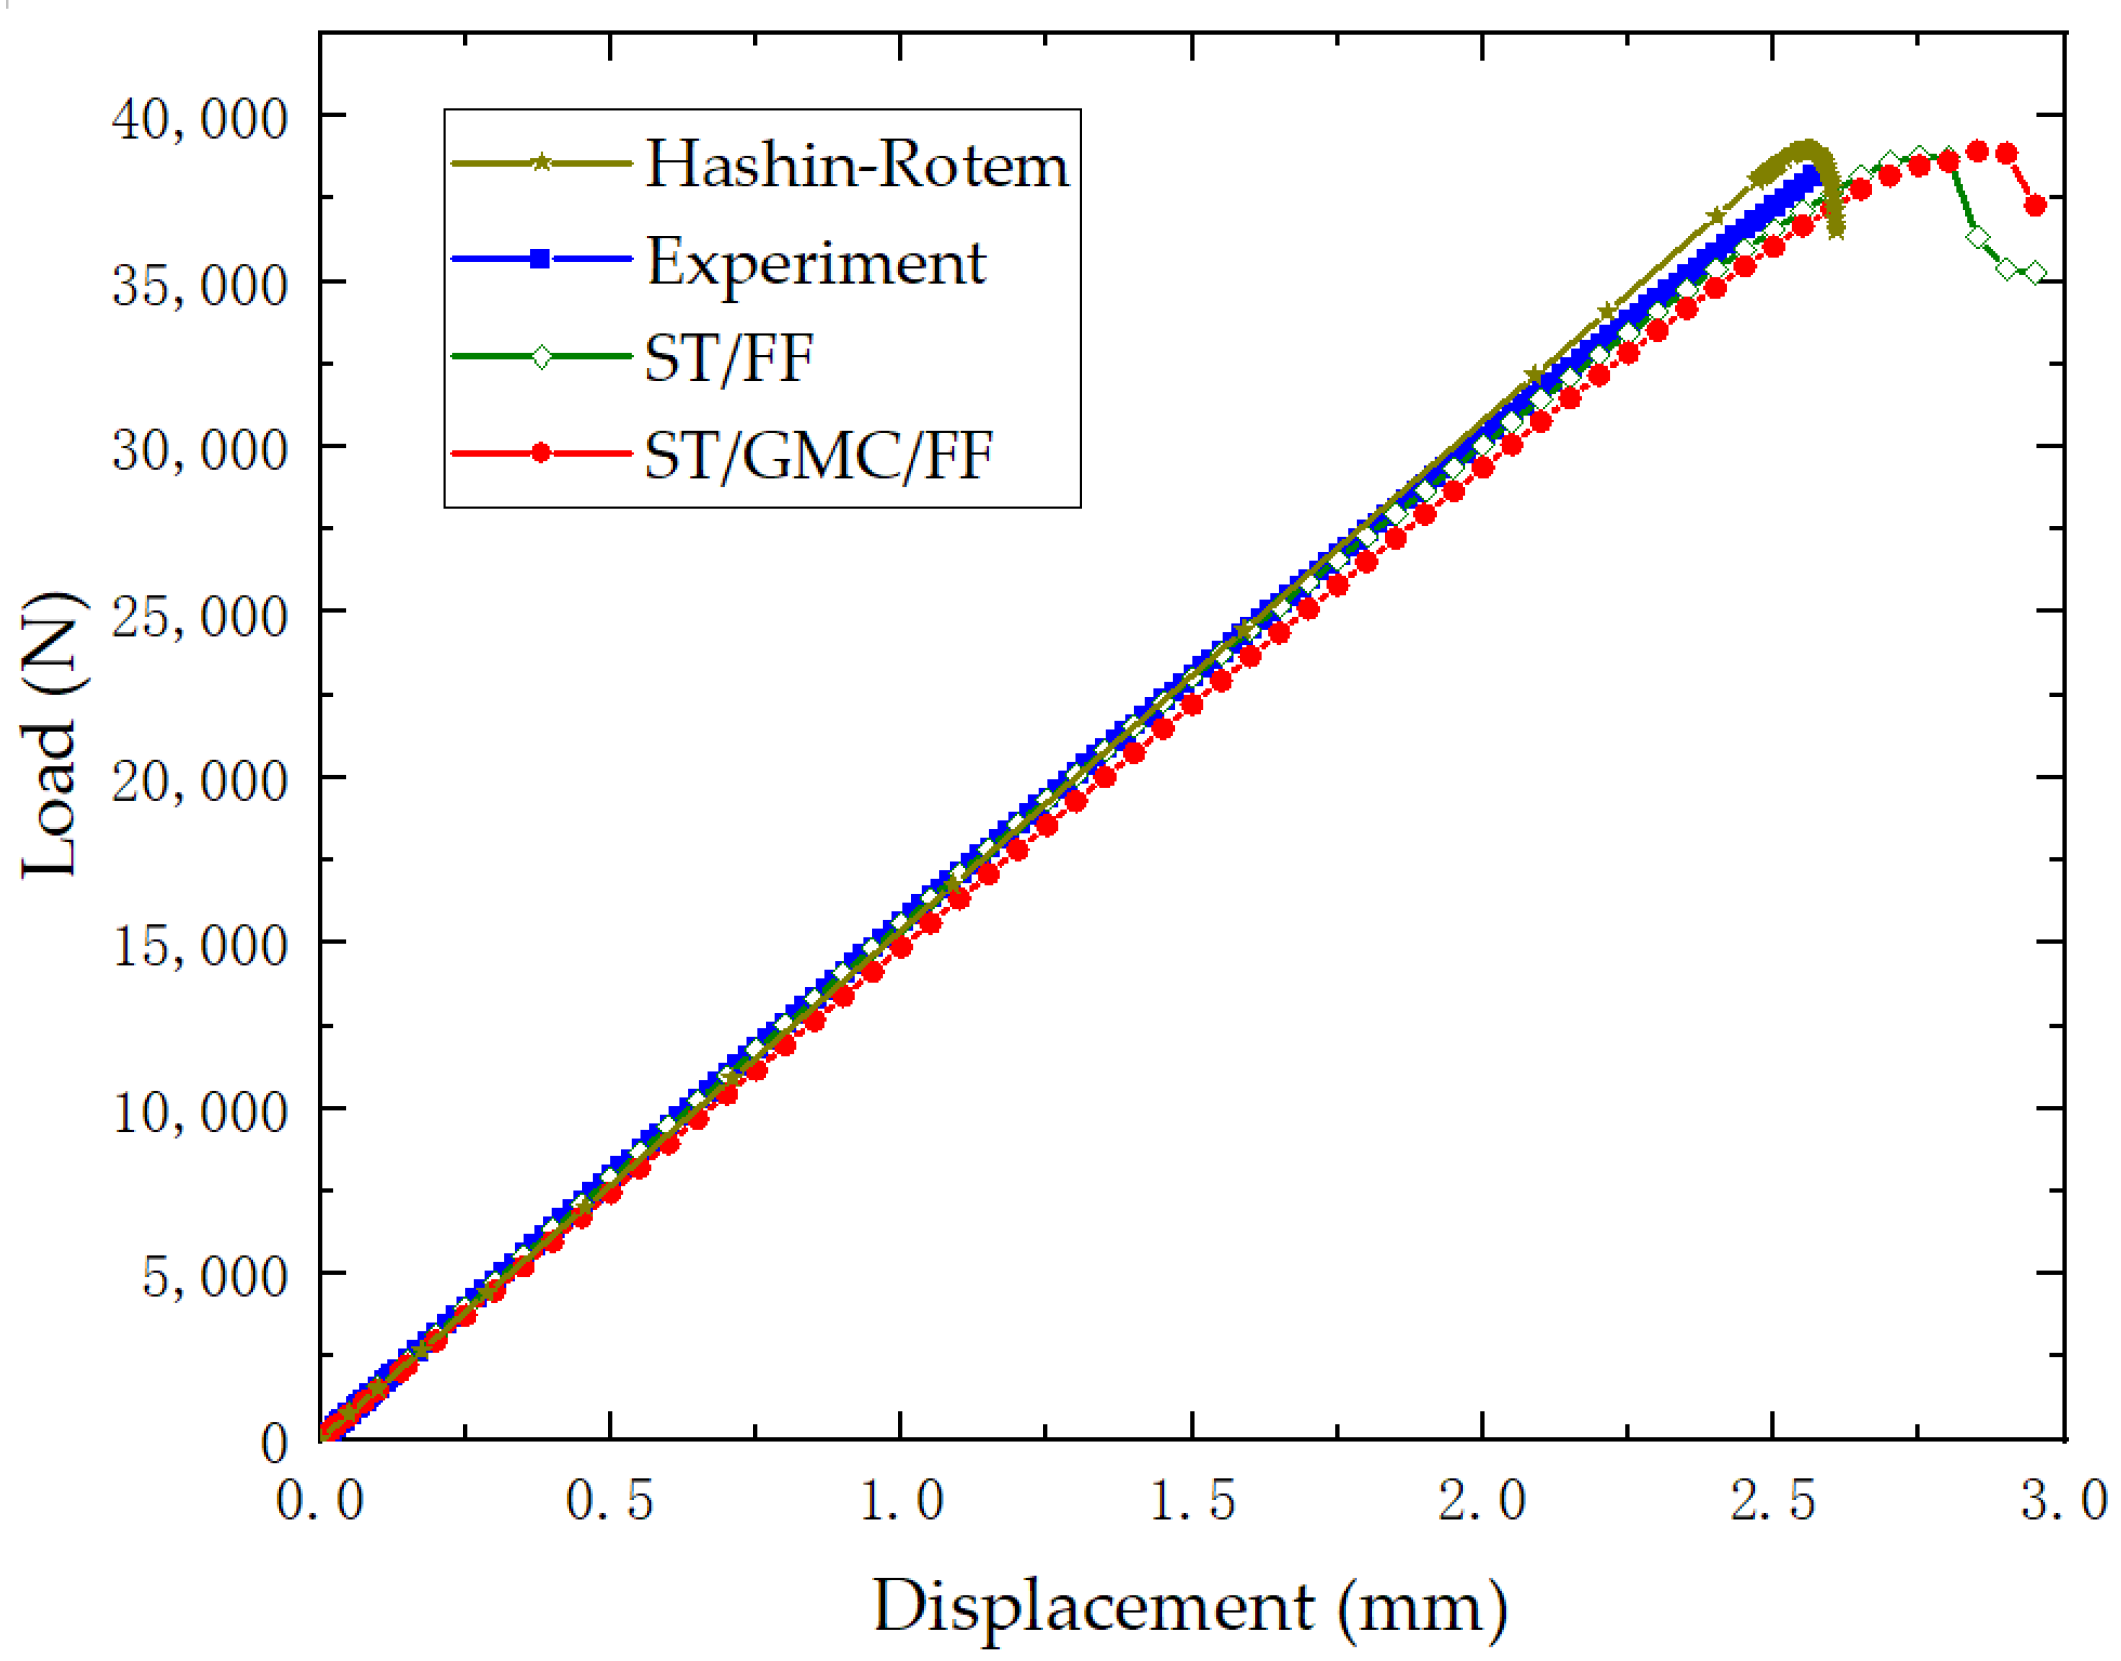
4.1. Experimental Result

A total of 8 composite specimens with a central opening hole are provided, of which the geometric dimensions are: 250 mm long, 25.26 mm wide, 2.28 mm thick, and the central hole diameter 4.76 mm. [45/−45/0/−45/0/45/45/0/−45/0/−45/45] are the laminate stacking sequences, and the material properties of these specimens correspond to T800/3900-2 as shown in Table 4.
The tensile test process of open-hole laminates is conducted in accordance with ASTM D5766—standard test method for open-hole tensile strength of polymer matrix composite laminates. The open-hole tensile test of laminates was carried out on MTS 370 electro-hydraulic servo test machine, which has a maximum load-carrying capacity of 250 kN with a accuracy of 0.5%. The displacement load curves of the test pieces are shown in Figure 8.
The average failure load of all specimens is 38.34 kN, and the dispersion coefficient is 2.13%. It can be seen from the displacement versus load curve that all the specimens are obviously brittle before the ultimate failure determined by the tensile strength of 0° layer onset. The photograph of the failed specimen is present in Figure 9, it can be observed that the catastrophic failures are concentrated around the open hole which causes the stress concentrations and finally span the width of the specimen, the failure modes of the specimen are mainly as follows: tensile fracture of fiber for 0° layer and tensile fracture of the matrix for ±45° layer.

4.2. Results of Finite Element Analysis

The three methods implemented using the subroutine UMAT introduced in Section 2 above are used to conduct the finite element analysis of the open-hole laminate specimens. The S4R mesh type is used, and the mesh is refined around the open hole. The composite constituents properties can be seen in Table 2 and Table 3, and the laminate properties are shown in Table 4. Additionally, the tensile and compressive strengths of the composite laminate are 2690 MPa and 1380 MPa, respectively, which are provided by vendors and used to perform FEA at the micro-level. The finite element model is restricted from moving in the thickness direction and all the in-plane rotational degrees of freedom to account for plane stress simulation. The left end of the model is fixed and the right edge is constrained in the transverse displacement and all rotations, then a tensile displacement of 5 mm is applied to the right end. The load versus displacement curves obtained from the three progressive damage methods are shown in Figure 10. It can be observed that the ultimate load prediction for ST/FF (38.76 kN), Hashin-Rotem (39.49 kN) and ST/GMC/FF (38.93 kN) agree well with the experimental value (38.45 kN). The load displacement curve obtained by Hashin-Rotem progressive damage method is linear, but both ST/FF and ST/GMC methods achieve satisfactory nonlinear reduction before the displacement-load curve reaches its peak. The load displacement curve obtained in the experiment has shown, to some extent, nonlinear behavior, especially near the end of the experimental curve. In the experiment, the crack initiates around the open hole and propagates rapidly to the edge of the specimen. It is not possible to capture the rapid progression of the crack by using the implicit solver, so the gradual failure of fiber and matrix yield the exhibited softening in the ST or ST/GMC model.
Figure 11 shows the fiber damage and matrix nonlinear damage state of 0° layer and 45° layer under different loads by ST/FF method. As the damage states of the −45° layer and 45° layer are basically symmetric with respect to the 0° axis, the damage contour of 0° layer and 45° layer are selected to be shown below. At 80% ultimate load, tensile and shear damage begin to fail at the upper and lower edges of the open hole, while no element in the transverse direction reaches the maximum failure value for 0° layer. Under this load, a small number of elements have failed in the transverse direction and more shear failure are presented around the open hole for the 45° layer, but no fiber failure occurs in this layer. At 90% ultimate load, the fiber failure, the progressive degradation of transverse and shear moduli for 0° layer and 45° layer all continue to extend. When reaching the ultimate load, all damage contours of 0° or 45° layer have spanned the width of the specimen except for the fiber failure of 45° layer, after which the crack propagates rapidly until most of elements around the open hole are failed. It can be observed the degree of damage for shear modulus are greater than that of transverse modulus in both 0° and 45° layers, which is consistent with the theoretical model shown in Figure 4 above. The final damage patterns of 0° or 45° layer are in agreement with the experimental results, which proves that the prediction of failure mode is reliable.
Figure 12 shows the nonlinear damage contours of three matrix subcells for 0° layer and 45° layer under both 16.7 kN and the ultimate loads using ST/GMC/FF method. Under the loading of 16.7 kN, the shear modulus of the second matrix subcell at 0° layer begins to fail for a few elements at the upper and lower edges of the open hole, while none of the damage of transverse modulus of any element reaches its failure value. The other two matrix subcells for 0° layer have the same damage evolution and do not reach the lower limit of damage 0.4. Under this load, the shear elastic moduli gs of the three matrix subcells for 45° layer have been extended into a cross shape of ±45°, however, just a few transverse failure appears at the upper and lower edges of the open hole for the matrix subcells. The transverse and shear modulus progressive damage patterns are basically the same. Under the ultimate load, the transverse elastic modulus and shear modulus of all subcells in 45° layer have evolved to the failure value in almost all finite elements around the hole, which is not shown Figure 12. The shear moduli of first and third matrix subcells at 0° layer evolve to the limit value 0.4 for most elements, as shown in the third row of Figure 12, while the damage of transverse elastic moduli evolve along the direction of x2 axis, which does not span the finite element model. It can be seen that the elastic modulus of second matrix subcell degrade faster than the other two matrix subcells, because the second matrix subcell locates at the same column with the fiber subcell, which have a large value of stiffness component according to the stress continuity assumption of GMC, i.e., σ22 in the same column of RUC are equal on the x2 axis shown in Figure 2. This phenomenon is very obvious at 0° layer, but not at 45° layer, indicating that the reduction evolution of matrix subcells is sensitive to the layer angle.
As shown in Figure 13, the damage state of 0° layered fiber subcells is similar to the damage contour obtained by ST/FF method, in which the failure starts from the elements at the upper and lower edges of the hole and expands along the oblique crossing direction, until it runs horizontally through the finite element model. Because the RUC model used contains only one fiber subcell, the failure of the fiber subcell means the fiber failure for the whole RUC at the finite element scale.

5. Conclusions

By using ST/FF, Hashin progressive damage model and ST/GMC/FF multi-scale progressive damage model, the ultimate load, failure mode and nonlinear damage evolution of fiber reinforced composite laminates with a central open hole were analysed, and the tensile experiment results of 8 specimens were compared. The following conclusions can be drawn:
  • ST/FF nonlinear damage model, Hashin-Rotem progressive damage analysis method, and the ST/GMC/FF model based on the multi-scale progressive damage model are ideal to predict the damage state, failure pattern and the ultimate load, where the ST method well captured the nonlinear behavior of the laminates and reasonable failure mode prediction was obtained. The ST method makes the matrix damage become a natural nonlinear damage evolution and replaces the traditional matrix failure criterion model. Fiber tensile failure shows obvious brittleness behavior, so the failure criterion of fiber is still needed in both macroscopic and microscopic models.
  • Based on the multi-scale progressive damage model of GMC model, ST/GMC/FF methods will resolve stresses or strains of a laminate to the repeating unit cell at the microscopic level, which make the matrix and fiber constituents to be distinguishable, and different matrix subcells also have independent damage evolvement and failure states. It shows that the multi-scale method based on the GMC model can better explain the crack path and failure mechanism for the matrix constituent of a laminate.

Author Contributions

Conceptualization, validation and project administration, M.T.; Methodology, software, investigation and writing—original draft preparation, J.S. All authors have read and agreed to the published version of the manuscript.

Funding

This work was Funded by the Priority Academic Program Development of Jiangsu Higher Education Institutions, National Natural Science Foundation of China (NSFC)(52075232), Natural Science Foundation of Jiangsu Province(BK20201112), and project of “Analysis and Research on Transient Response of Pressure Impulse and Fatigue Life of Hydraulic Product”. (201928052009).

Institutional Review Board Statement

Not applicable.

Informed Consent Statement

Not applicable.

Data Availability Statement

The data will be made available on request.

Conflicts of Interest

The authors declare no conflict of interest. The funders had no role in the design of the study; in the collection, analyses, or interpretation of data; in the writing of the manuscript, or in the decision to publish the results.

References

  1. Soden, P.D.; Hinton, M.J.; Kaddour, A.S. Lamina properties, lay-up configurations and loading conditions for a range of fibre-reinforced composite laminates. Compos. Sci. Technol. 1998, 58, 1011–1022. [Google Scholar] [CrossRef]
  2. Soden, P.D.; Hinton, M.J.; Kaddour, A.S. A comparison of the predictive capabilities of current failure theories for composite laminates. Compos. Sci. Technol. 1998, 58, 1225–1254. [Google Scholar] [CrossRef]
  3. Hinton, M.J.; Kaddour, A.S.; Soden, P.D. A comparison of the predictive capabilities of current failure theories for composite laminates, judged against experimental evidence. Compos. Sci. Technol. 2002, 62, 1725–1797. [Google Scholar] [CrossRef]
  4. Puck, A.; Schürmann, H. Failure analysis of FRP laminates by means of physically based phenomenological models. Compos. Sci. Technol. 2002, 62, 1633–1662. [Google Scholar] [CrossRef]
  5. Pinho, S.; Iannucci, L.; Robinson, P. Physically-based failure models and criteria for laminated fibre reinforced composites with emphasis on fibre kinking: Part I: Development. Compos. Part A Appl. Sci. Manuf. 2006, 37, 63–73. [Google Scholar] [CrossRef] [Green Version]
  6. Icardi, U.; Locatto, S.; Longo, A. Assessment of recent theories for predicting failure of composite laminates. Appl. Mech. Rev. 2007, 60, 76–86. [Google Scholar] [CrossRef]
  7. Beaumont, P.; Dimant, R.A.; Shercliff, H.R. Failure processes in composite materials: Getting physical. J. Mater. Sci. 2006, 41, 6526–6546. [Google Scholar] [CrossRef]
  8. Mehrmashhadi, J.; Chen, Z.; Zhao, J.; Bobaru, F. A stochastically homogenized peridynamic model for intraply fracture in fiber-reinforced composites. Compos. Sci. Technol. 2019, 182, 107770. [Google Scholar] [CrossRef]
  9. Mehrmashhadi, J.; Tang, Y.; Zhao, X.; Xu, Z.; Pan, J.; Le, Q.V.; Bobaru, F. The effect of solder joint microstructure on the drop test failure—a peridynamic analysis. IEEE Trans. Compon. Packag. Manuf. Technol. 2018, 9, 58–71. [Google Scholar] [CrossRef]
  10. Tallia, R.; Morello, P.; Castellano, G. Damage and failure of composite materials. AIAA J. 2012, 52, 317–323. [Google Scholar]
  11. Hallett, S.R.; Green, B.G.; Jiang, W.G.; Wisnom, M.R. An experimental and numerical investigation into the damage mechanisms in notched composites. Compos. Part A Appl. Sci. Manuf. 2009, 40, 613–624. [Google Scholar] [CrossRef]
  12. Camanho, P.P.; Erçin, G.H.; Catalanotti, G.; Mahdi, S.; Linde, P. A finite fracture mechanics model for the prediction of the open-hole strength of composite laminates. Compos. A Appl. Sci. Manuf. 2012, 43, 1219–1225. [Google Scholar] [CrossRef] [Green Version]
  13. Pierron, F.; Green, B.; Wisnom, M.R.; Hallet, S.R. Full-field assessment of the damage process of laminated composite open-hole tensile specimens. Part II Exp. Results Compos. Part A Appl. Sci. Manuf. 2007, 38, 2321–2332. [Google Scholar] [CrossRef]
  14. Orifici, A.C.; Herszberg, I.; Thomson, R.S. Review of methodologies for composite material modelling incorporating failure. Compos. Struct. 2008, 86, 194–210. [Google Scholar] [CrossRef]
  15. Sadeghi, G.; Hosseini-Toudeshky, H.; Mohammadi, B. An investigation of matrix cracking damage evolution in composite laminates–development of an advanced numerical tool. Compos. Struct. 2014, 108, 937–950. [Google Scholar] [CrossRef]
  16. Iarve, E.V.; Mollenhauer, D.; Kim, R. Theoretical and experimental investigation of stress redistribution in open hole composite laminates due to damage accumulation. Compos. Part A Appl. Sci. Manuf. 2005, 36, 163–1717. [Google Scholar] [CrossRef]
  17. Talreja, R. Multi-scale modeling in damage mechanics of composite materials. J. Mater. Sci. 2006, 41, 6800–6812. [Google Scholar] [CrossRef]
  18. Paley, M.; Aboudi, J. Micromechanical analysis of composites by the generalized cells model. Mech. Mater. 1992, 14, 127–139. [Google Scholar] [CrossRef]
  19. Pindera, M.J.; Bednarcyk, B.A. An efficient implementation of the generalized method of cells for unidirectional, multi-phased composites with complex microstructures. Compos. Part B-Eng. 1999, 30, 87–105. [Google Scholar] [CrossRef]
  20. Naghipour, P.; Arnold, S.M.; Pineda, E.J.; Stier, B.; Hansen, L.; Bednarcyk, B.A.; Waas, A.M. Multiscale static analysis of notched and unnotched laminates using the generalized method of cells. J. Compos. Mater. 2016, 51, 1433–1454. [Google Scholar] [CrossRef] [Green Version]
  21. Shi, J.; Tong, M.; Zhou, C.; Ye, C.; Wang, X. Progressive Failure Analysis in Open-Hole Tensile Composite Laminates of Airplane Stringers Based on Tests and Simulations. Appl. Sci. 2020, 11, 185. [Google Scholar] [CrossRef]
  22. Schapery, R.A. A theory of mechanical behavior of elastic media with growing damage and other changes in structure. J. Mech. Phys. Solids 1990, 38, 215–253. [Google Scholar] [CrossRef]
  23. Schapery, R.A. Prediction of compressive strength and kink bands in composites using a work potential. Int. J. Solids. Struct. 1995, 32, 739–765. [Google Scholar] [CrossRef]
  24. Lamborn, M.J.; Schapery, R.A. An investigation of the existence of a work potential for fiber-reinforced plastic. J. Compos. Mater. 1993, 27, 352–382. [Google Scholar] [CrossRef]
  25. Sicking, D.L. Mechanical Characterization of Nonlinear Laminated Composites with Traverse Crack Growth; Texas AM University College: College Station, TX, USA, 1992. [Google Scholar]
  26. Pineda, E.J.; Waas, A.M. Numerical implementation of a multiple-ISV thermodynamically-based work potential theory for modeling progressive damage and failure in fiber-reinforced laminates. Int. J. Fract. 2013, 182, 93–122. [Google Scholar] [CrossRef] [Green Version]
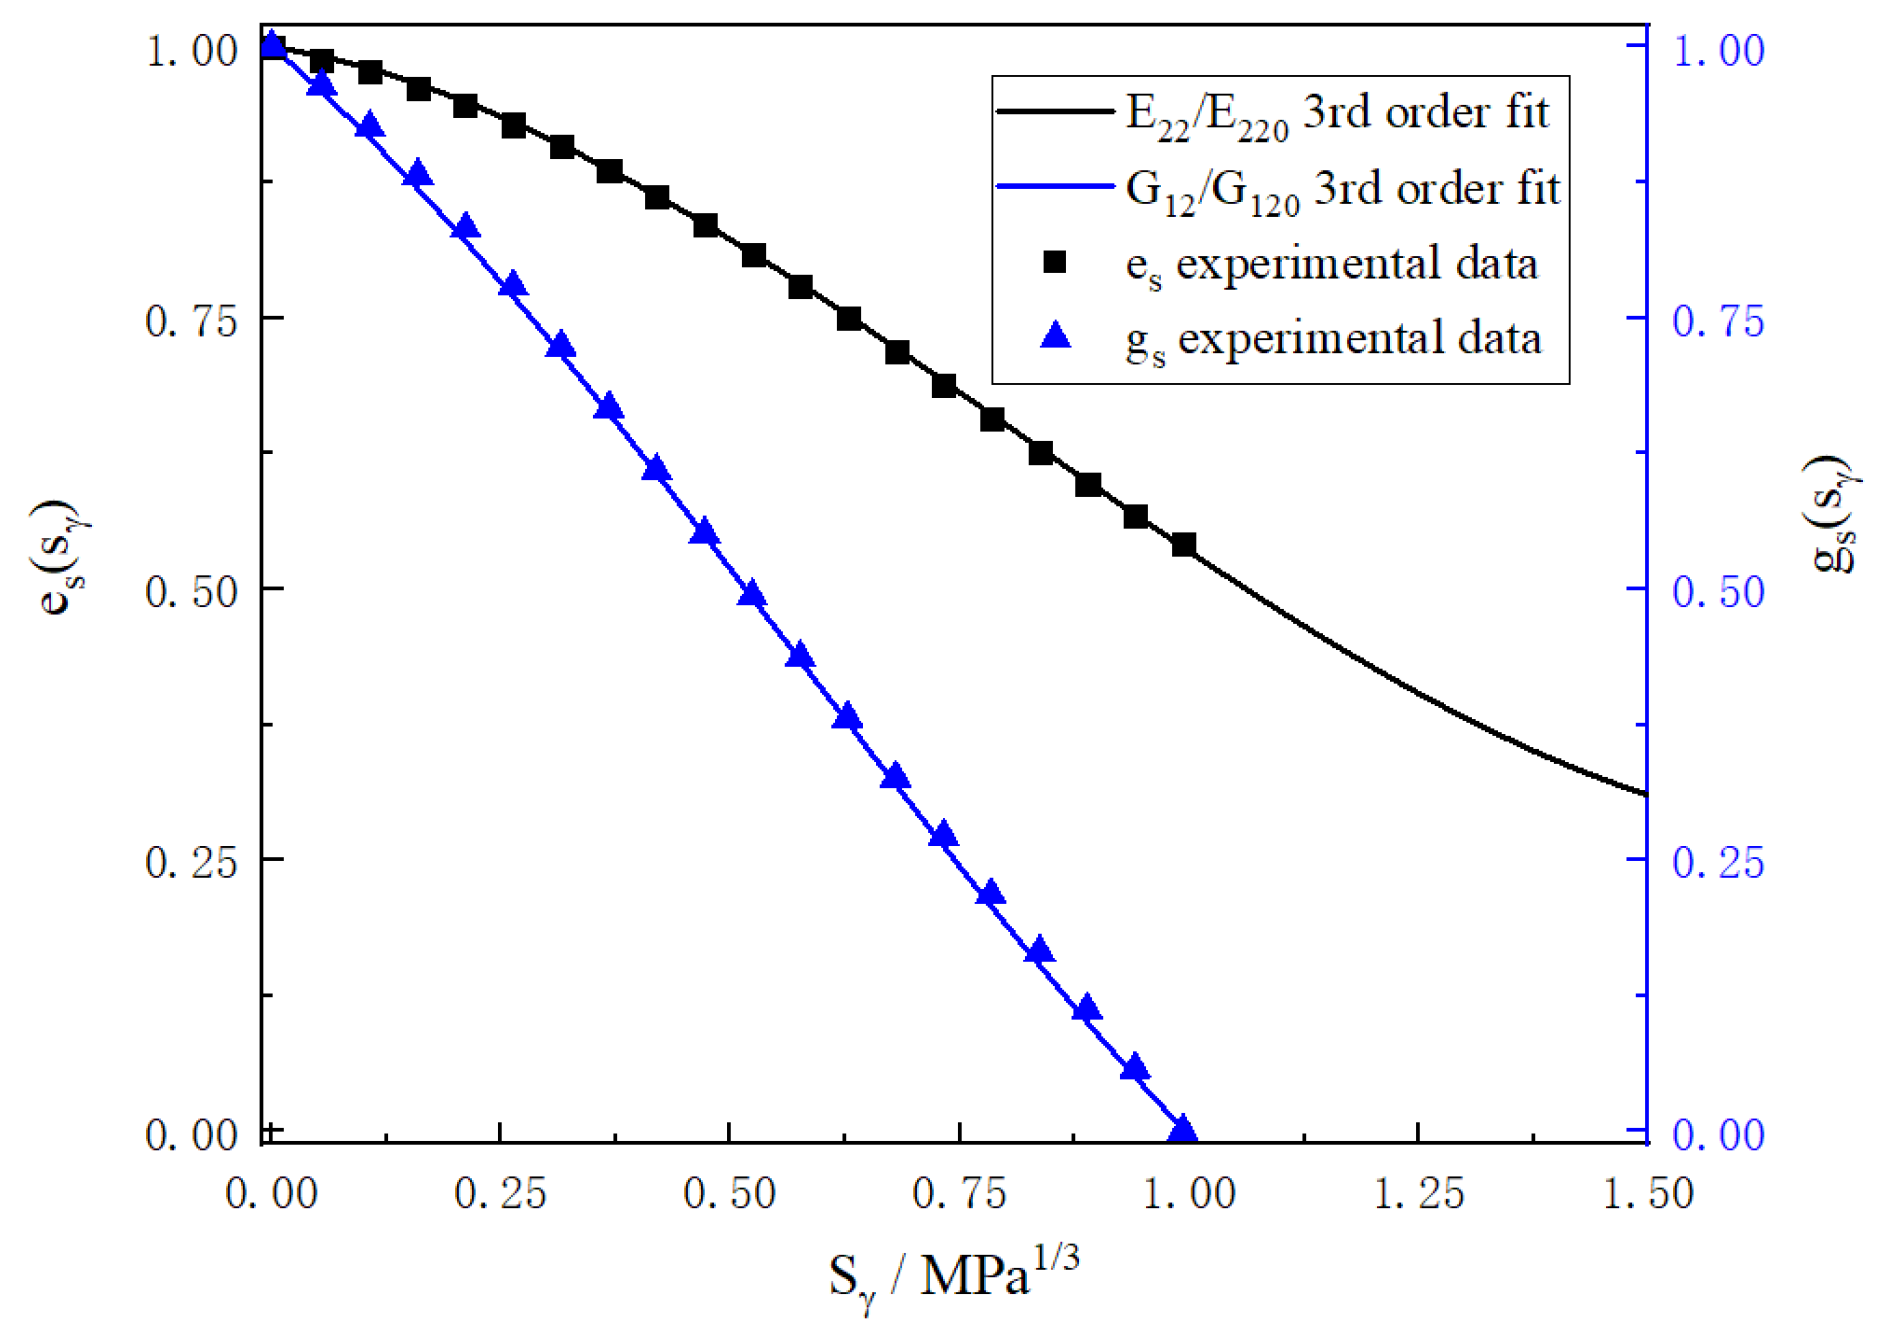
Figure 1. Irrecoverable portion Ws (shaded area) and the elastic portions W.
Aerospace 09 00059 g001
Figure 2. Discretization of the repeating unit cell.
Aerospace 09 00059 g002
Figure 3. FEM with generalized method of cells (GMC).
Aerospace 09 00059 g003
Figure 4. Ratio of actual modulus to virgin modulus as a function of the reduced internal state variable.
Aerospace 09 00059 g004
Figure 5. Changes of the reduced internal state variable with strain states.
Aerospace 09 00059 g005
Figure 6. 2 × 2 RUC used in micromechanics simulations.
Aerospace 09 00059 g006
Figure 7. Flow chart of hierarchy for multiscale algorithm with damage and failure at the micro-scale.
Aerospace 09 00059 g007
Figure 8. The force-displacement curve of eight specimens.
Aerospace 09 00059 g008
Figure 9. Photograph of failed laminate specimen.
Aerospace 09 00059 g009
Figure 10. The force–displacement curve of simulations.
Aerospace 09 00059 g010
Figure 11. Matrix damage evolution and fiber failure propagation based on ST/FF method.
Aerospace 09 00059 g011
Figure 12. Matrix damage evolution based on ST/GMC/FF method.
Aerospace 09 00059 g012
Figure 13. Failure of fiber subcell. (a) Failure at ultimate load; (b) The final failure.
Aerospace 09 00059 g013
Table 1. Micro-damage polynomial coefficients for E22 and G12.
E22
Coefficients
ValuesG12
Coefficients
Values
eS01gS01
eS1−0.1308gS1−0.7269
eS2−0.5650gS2−0.6706
eS30.2304gS30.3932
Table 2. Elastic properties of the composite constituents.
Fiber
Properties
Values/GPaMatrix
Properties
Values/GPa
Ef11293Em112350
Ef2291Em222350
υf120.23υm120.35
υf230.45υm230.35
Gf1255Gm122300
Table 3. Strengths of the composite constituents.
PropertiesValues/MPa
Tensile fiber strength, Xft5200
Compressive fiber strength, Xfc2855
Matrix transverse tensile strength, Ymt49
Matrix transverse compressive strength, Ymc124
Matrix shear strength, S41
Table 4. Elastic properties of the T800/3900-2 lamina.
Elastic
Properties
ValuesElastic
Properties
Values
E1/GPa154G23/MPa4340
E2/GPa9Em120.29
E3/GPa9vm130.29
G12/MPa4340vm230.45
G13/MPa4340
Publisher’s Note: MDPI stays neutral with regard to jurisdictional claims in published maps and institutional affiliations.

