Communication

Wake-Tailplane Interaction of a Slingsby Firefly Aircraft

1
School of Aerospace, Mechanical & Mechatronic Engineering, The University of Sydney, Camperdown, NSW 2006, Australia
2
School of Aerospace, Transport & Manufacturing, Cranfield University, Cranfield MK43 0AL, UK
3
School of Future Transport Engineering, Coventry University, Priory Street, Coventry CV1 5FB, UK
*
Author to whom correspondence should be addressed.
Aerospace 2022, 9(12), 787; https://doi.org/10.3390/aerospace9120787
Submission received: 7 November 2022 / Revised: 30 November 2022 / Accepted: 30 November 2022 / Published: 2 December 2022
(This article belongs to the Special Issue Advanced Flow Diagnostic Tools)

Abstract

:
This paper presents in-flight measurements of the interaction of the wing wake of a stalled Slingsby T67 Firefly light aircraft with the aircraft tailplane. Tailplane data was recorded by a GoPro360 camera and analyzed using spatial correlation methods. The tailplane movement and corresponding spectra indicate that the aerodynamic wake shedding frequency closely matches the resonant frequency of the tailplane, resulting in a significant excitation of the structure during heavy stall. Large magnitude, lower frequency tailplane movement was also identified by analysis of the pitch attitude from the image data, with results consistent in post-stall behavior reported by previous modelling and measurements.

1. Introduction

The aerodynamic interaction between wakes and bodies is a complex and highly non-linear system. These systems include wake vortex on landing aircraft [1], wind turbine wake interactions [2] or propeller-rudder interactions [3]. Rockwell [4] has defined different categories of wake interaction, with respect to the originating wake vorticity axes, including before body interaction, parallel, streamwise and normal interaction. Specific to wake interaction of an aircraft wing with a tailplane, this can be categorized as a parallel interaction, or a tandem aerofoil interaction. Research at small scale has been reported on tandem aerofoil interactions as a potential biomimetic propulsor [5]. At full-scale, wake interaction can cause significant problems in aircraft design. A key example was the wake issue reported with the F/A-18 fighter, where the wing wake directly interacted with the tail fin [6]. This resulted in a major reduction of fin fatigue life, requiring modification of the leading edge of the wing through a major testing program. In this work, the wake interaction was characterized using unsteady flow and surface pressure sensors, mounted into the fin, flow visualization and accelerometers mounted into the structure.
The following article presents results from a wing-tailplane wake interaction, with image data recorded using a GoPro360 full-field camera and image cross-correlation. The unsteady wake was generated during aerodynamic stall and results have indicated a significant effect of the wake on the tailplane structure, due to the aerodynamic shedding frequency of the wing, which was found to closely match the natural structural frequency of the tailplane.

2. Slingsby Tailplane Tests

Previous work by the authors described a Direct Eddy Simulation (DES) model of a Slingsby T67 aerobatic light aircraft and a series of flight tests, to validate the numerical model in the stall [7,8]. In this work, the in-flight data focused on surface flow visualization, accelerometer data, GPS data and cockpit instrument pressure data, and comparisons identified a significant buffet frequency, which in both the in-flight accelerometer and DES aerodynamic spectra. A separate ground test was also carried out, to identify the natural frequency of the wing, and showed this structural frequency could be discriminated from the aerodynamic buffet frequency.
Subsequent examination of the full DES flow field showed a substantial interaction of the wing wake with the tailplane during the stall [7,8]. Therefore, a further flight test was conducted, to see if this wake interaction was significant and to ensure a higher level of validation of the DES model. The following section presents details of this additional flight test, including a separate ground test, which was used to establish the structural frequencies of the tailplane.

2.1. Tailplane Ground Measurements

To measure the natural frequency of the tailplane, a Pixhawk4TM inertial reference unit, with a weight of 33 g and a sample rate of 250 Hz, was secured to the top surface of the tailplane using adhesive tape, near the tail tip. The tailplane, which is primarily constructed from fiberglass and fixed to a fiberglass fuselage, was then excited with an impulse impact in the vertical direction, within the stress limits of the tailplane structure.
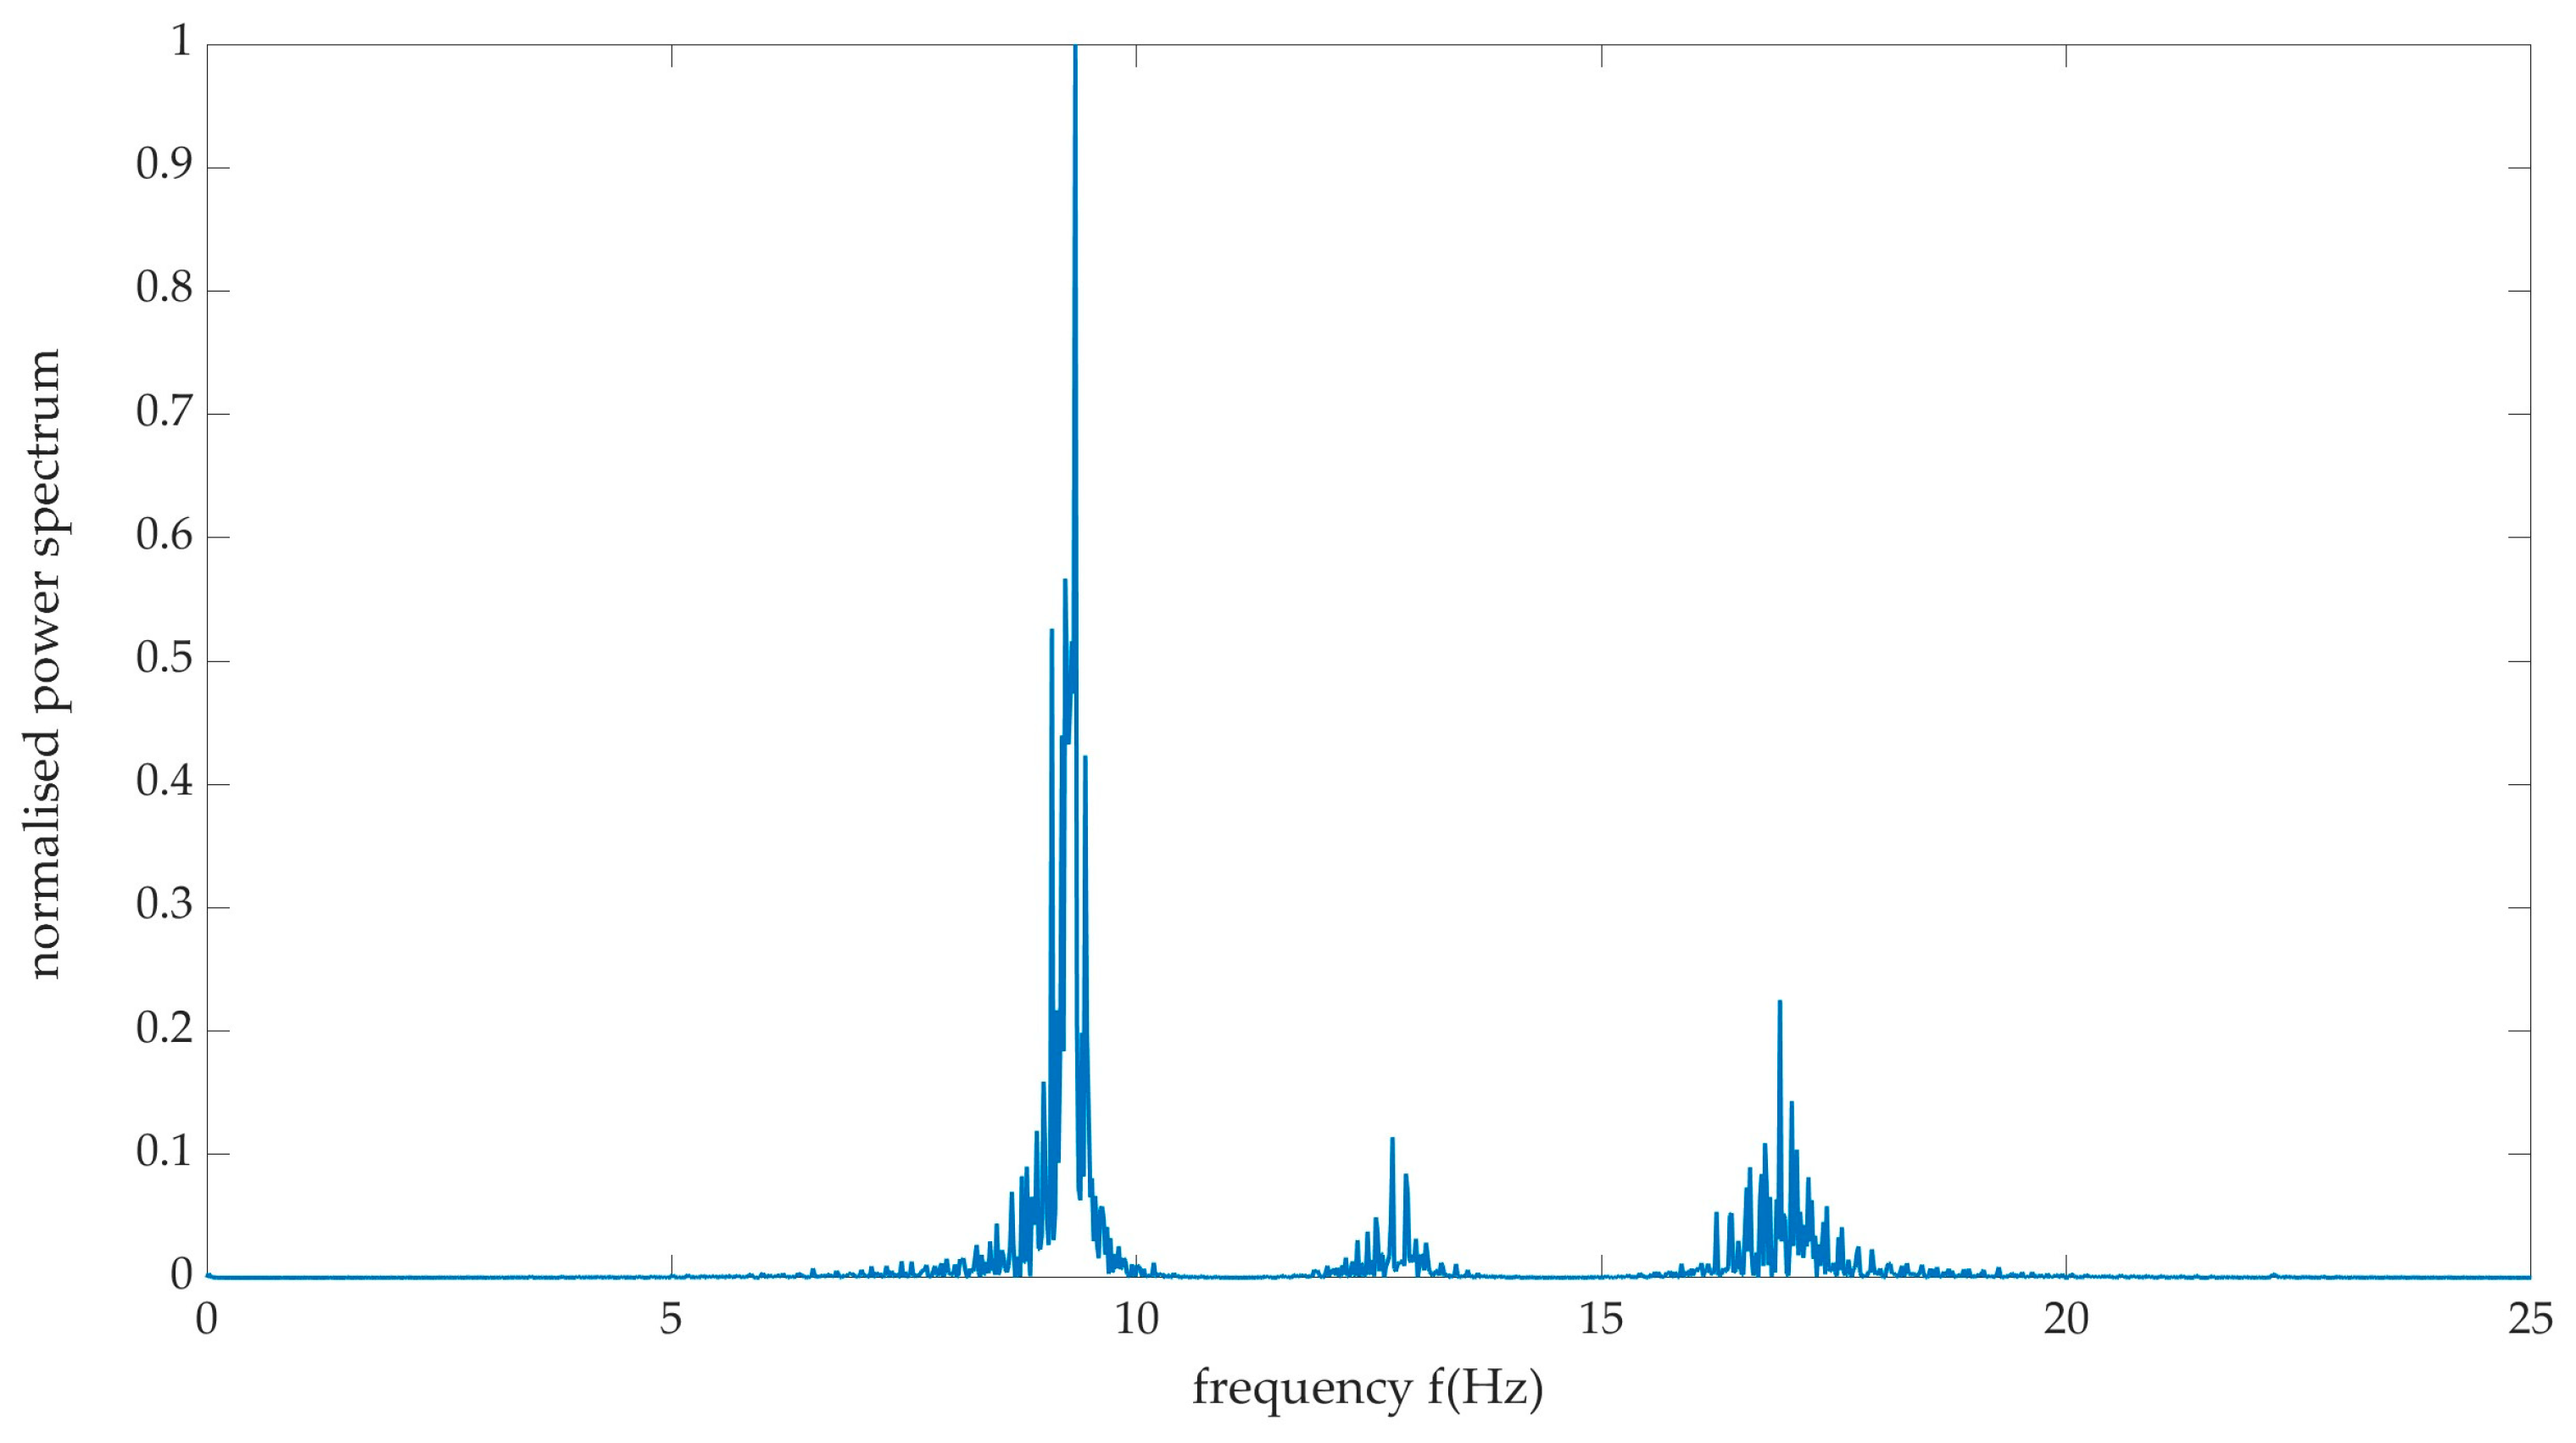
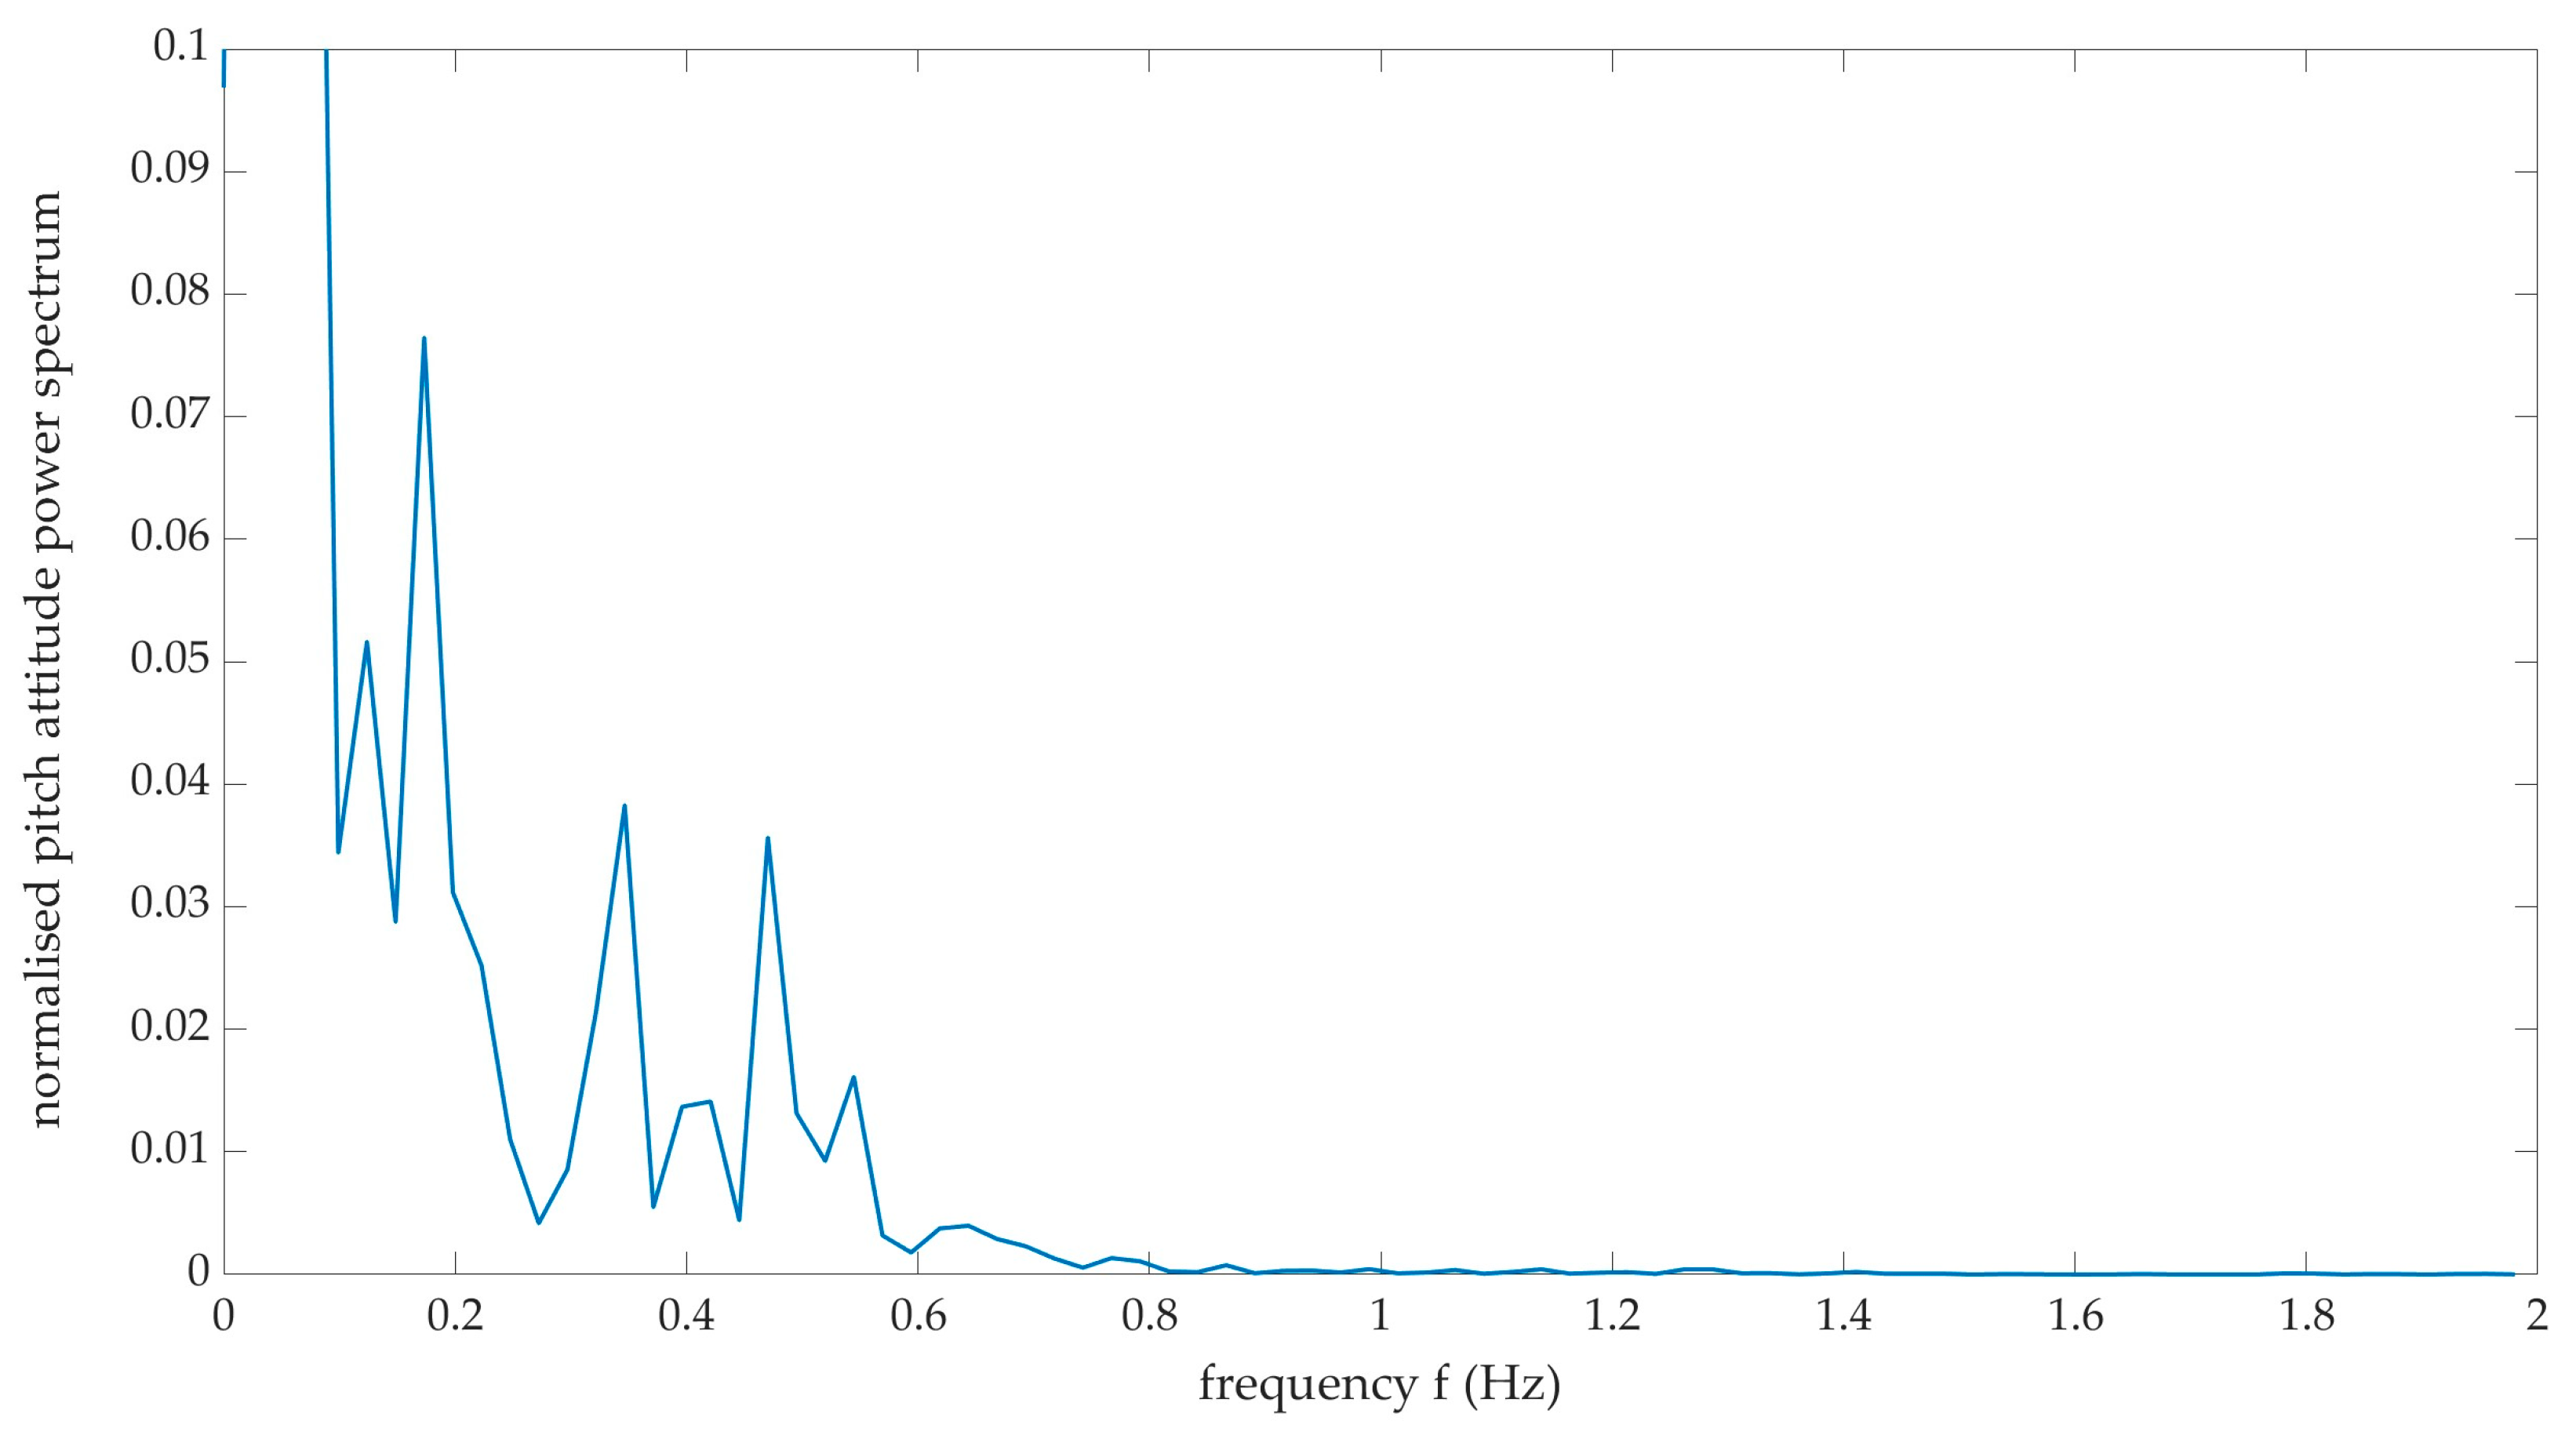
With the elevator fixed in a level position, the impact excited a resonance which was captured by the accelerometer. A typical response from the vertical axis accelerometer data is shown in Figure 1 and the spectra for this response is shown in Figure 2. This excitation was repeated with the elevator at maximum deflection (trailing edge up). However, no significant changes were noted in the spectra. Errors in the spectra frequency, based on the sampling frequency of the Pixhawk and spectra resolution, are estimated to be ±0.01Hz. With reference to Figure 2, the spectra contain characteristic frequencies at 9.34 Hz, 12.75 Hz and 16.92 Hz, with the former frequency the most dominant, based on amplitude. Previous work [7] has shown the dominant shedding frequency during the stall to vary between 9 Hz to 12 Hz, indicating a potential aerodynamic excitation of the resonant frequency of the tailplane structure, during the stall.

2.2. Tailplane Airborne Measurements

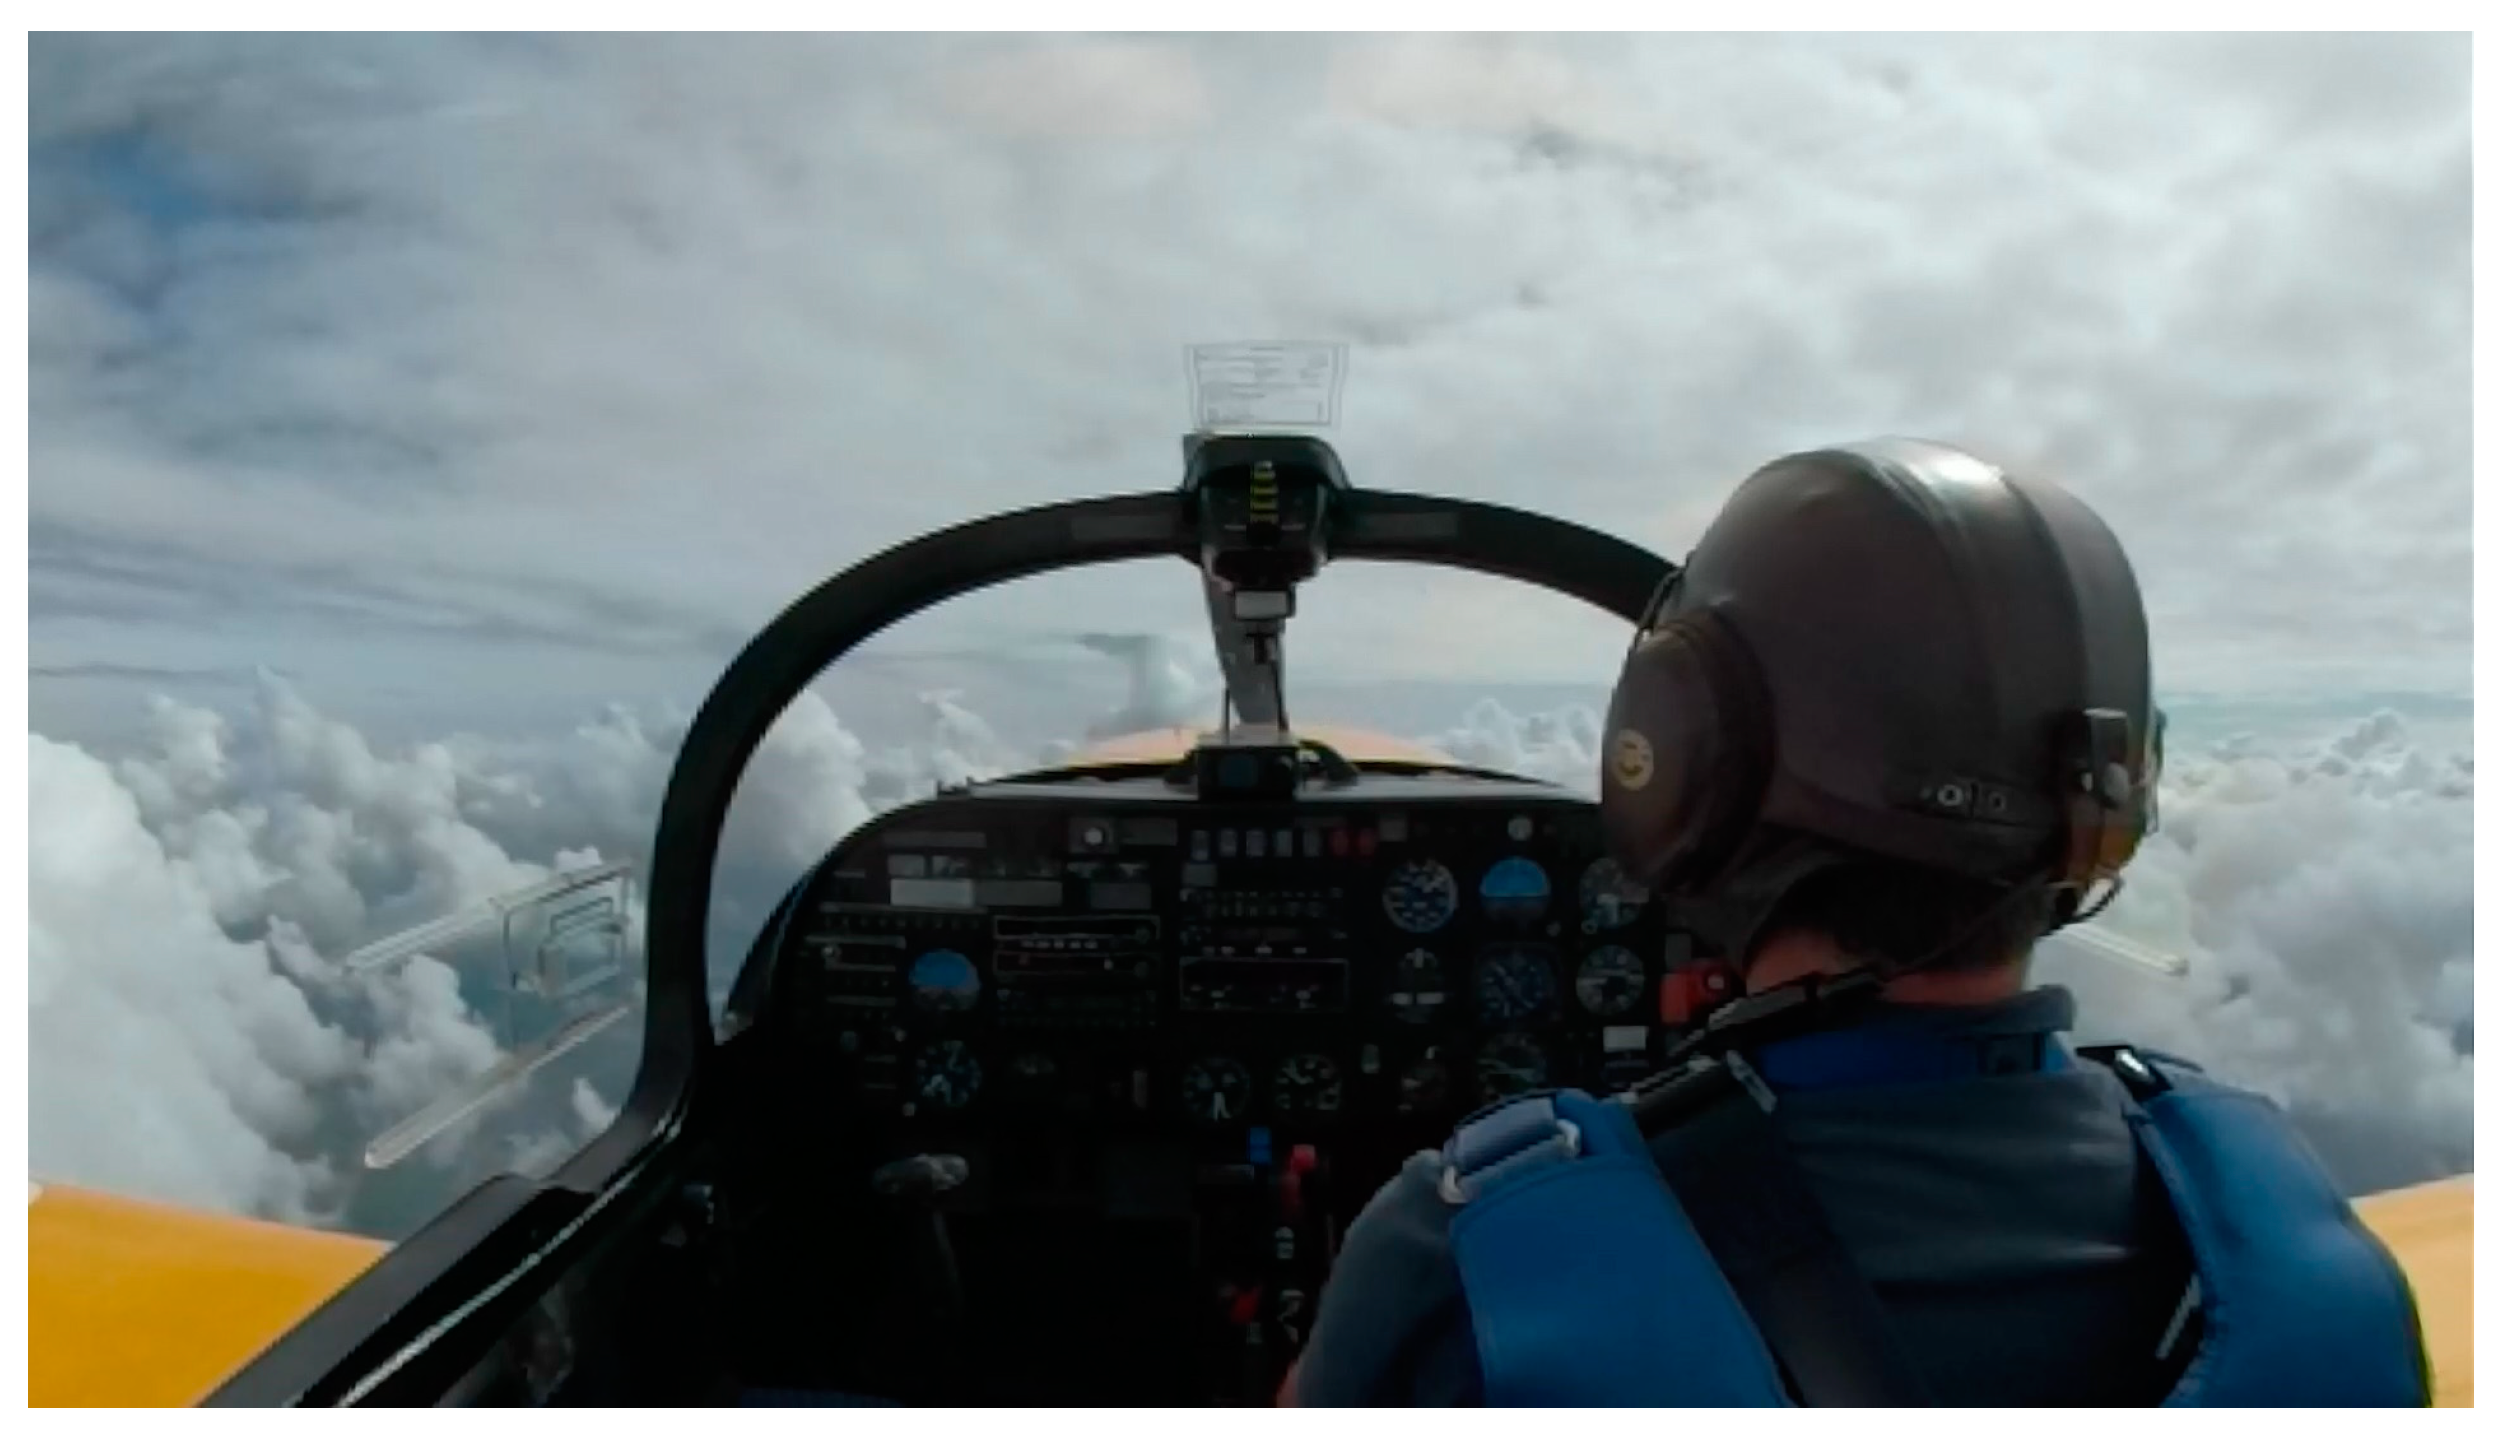
To record the tailplane behavior during the stall, a GoPro Fusion 360 camera with a framerate of 50Hz and resolution of 1920 pixels × 1080 pixels (3k50 mode) was mounted to simultaneously record the front cockpit (see Figure 3) and rear view in-flight (see 
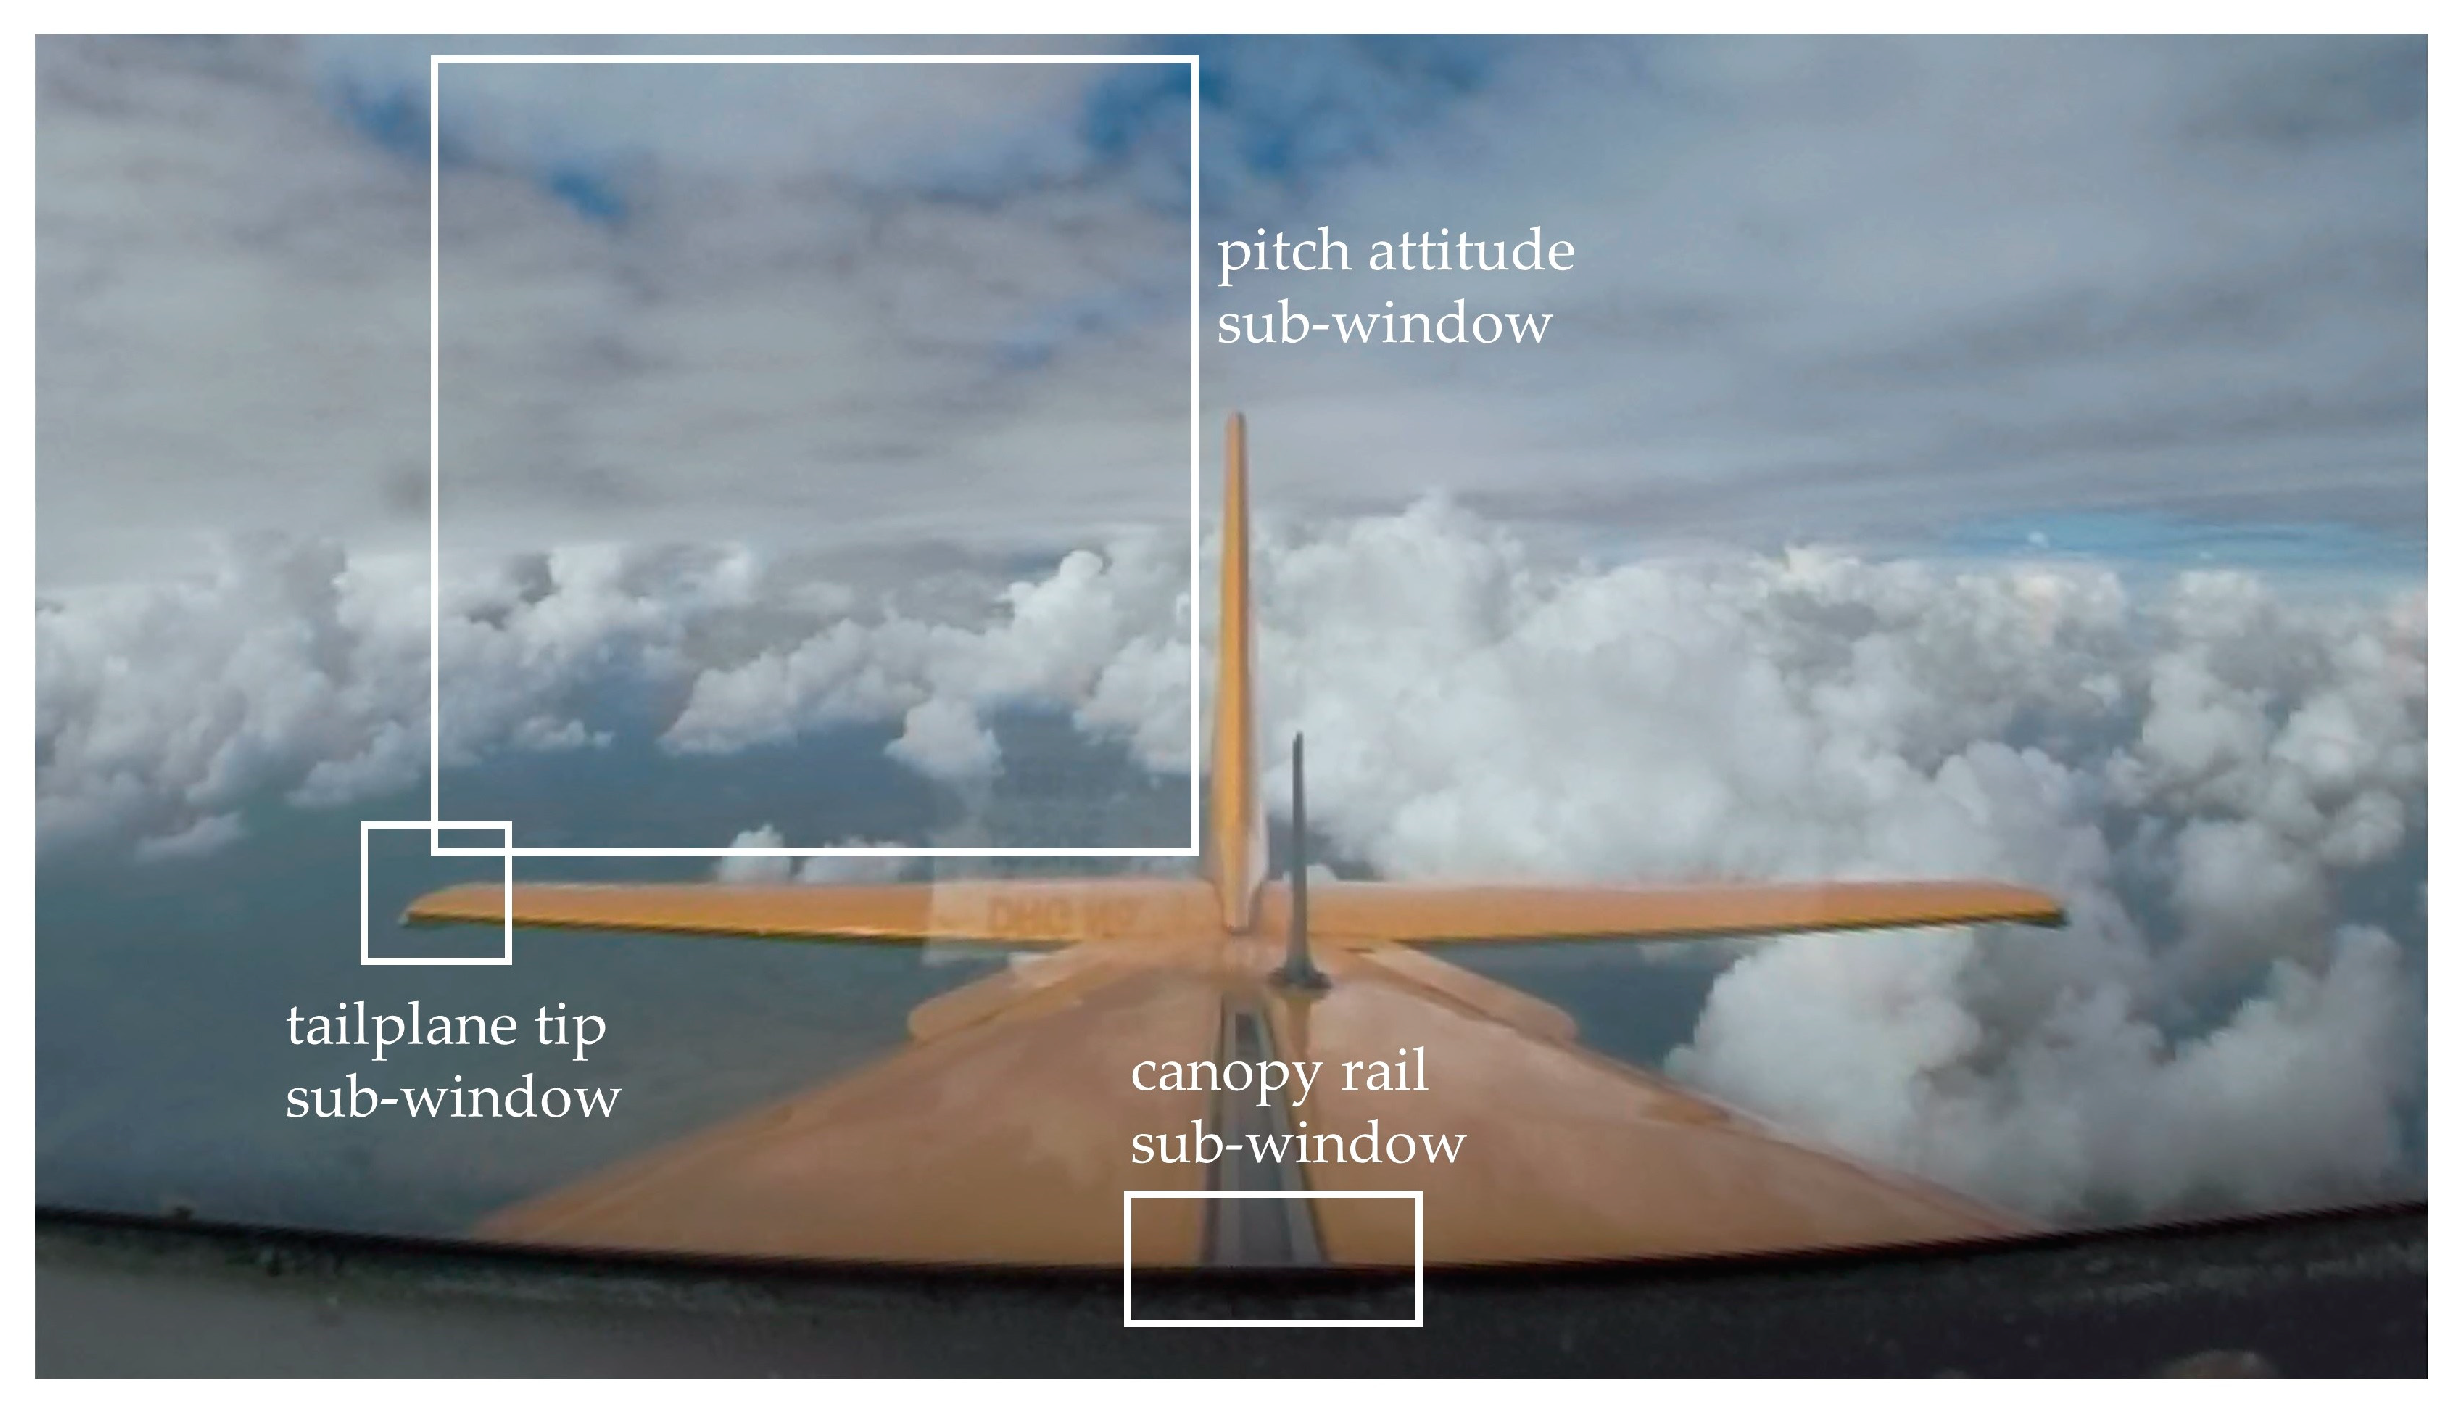
Figure 4). In the rear view, the tailplane, canopy rail and antenna are visible. The flight test conditions are also shown in Table 1. On entering the aerodynamic stall, the pilot progressively moved the stick back to enter heavy buffet, continuing until experiencing significant ‘g-break’ and wing drop, before recovering to level flight again. Further data from similar stall tests are found in [7,8].
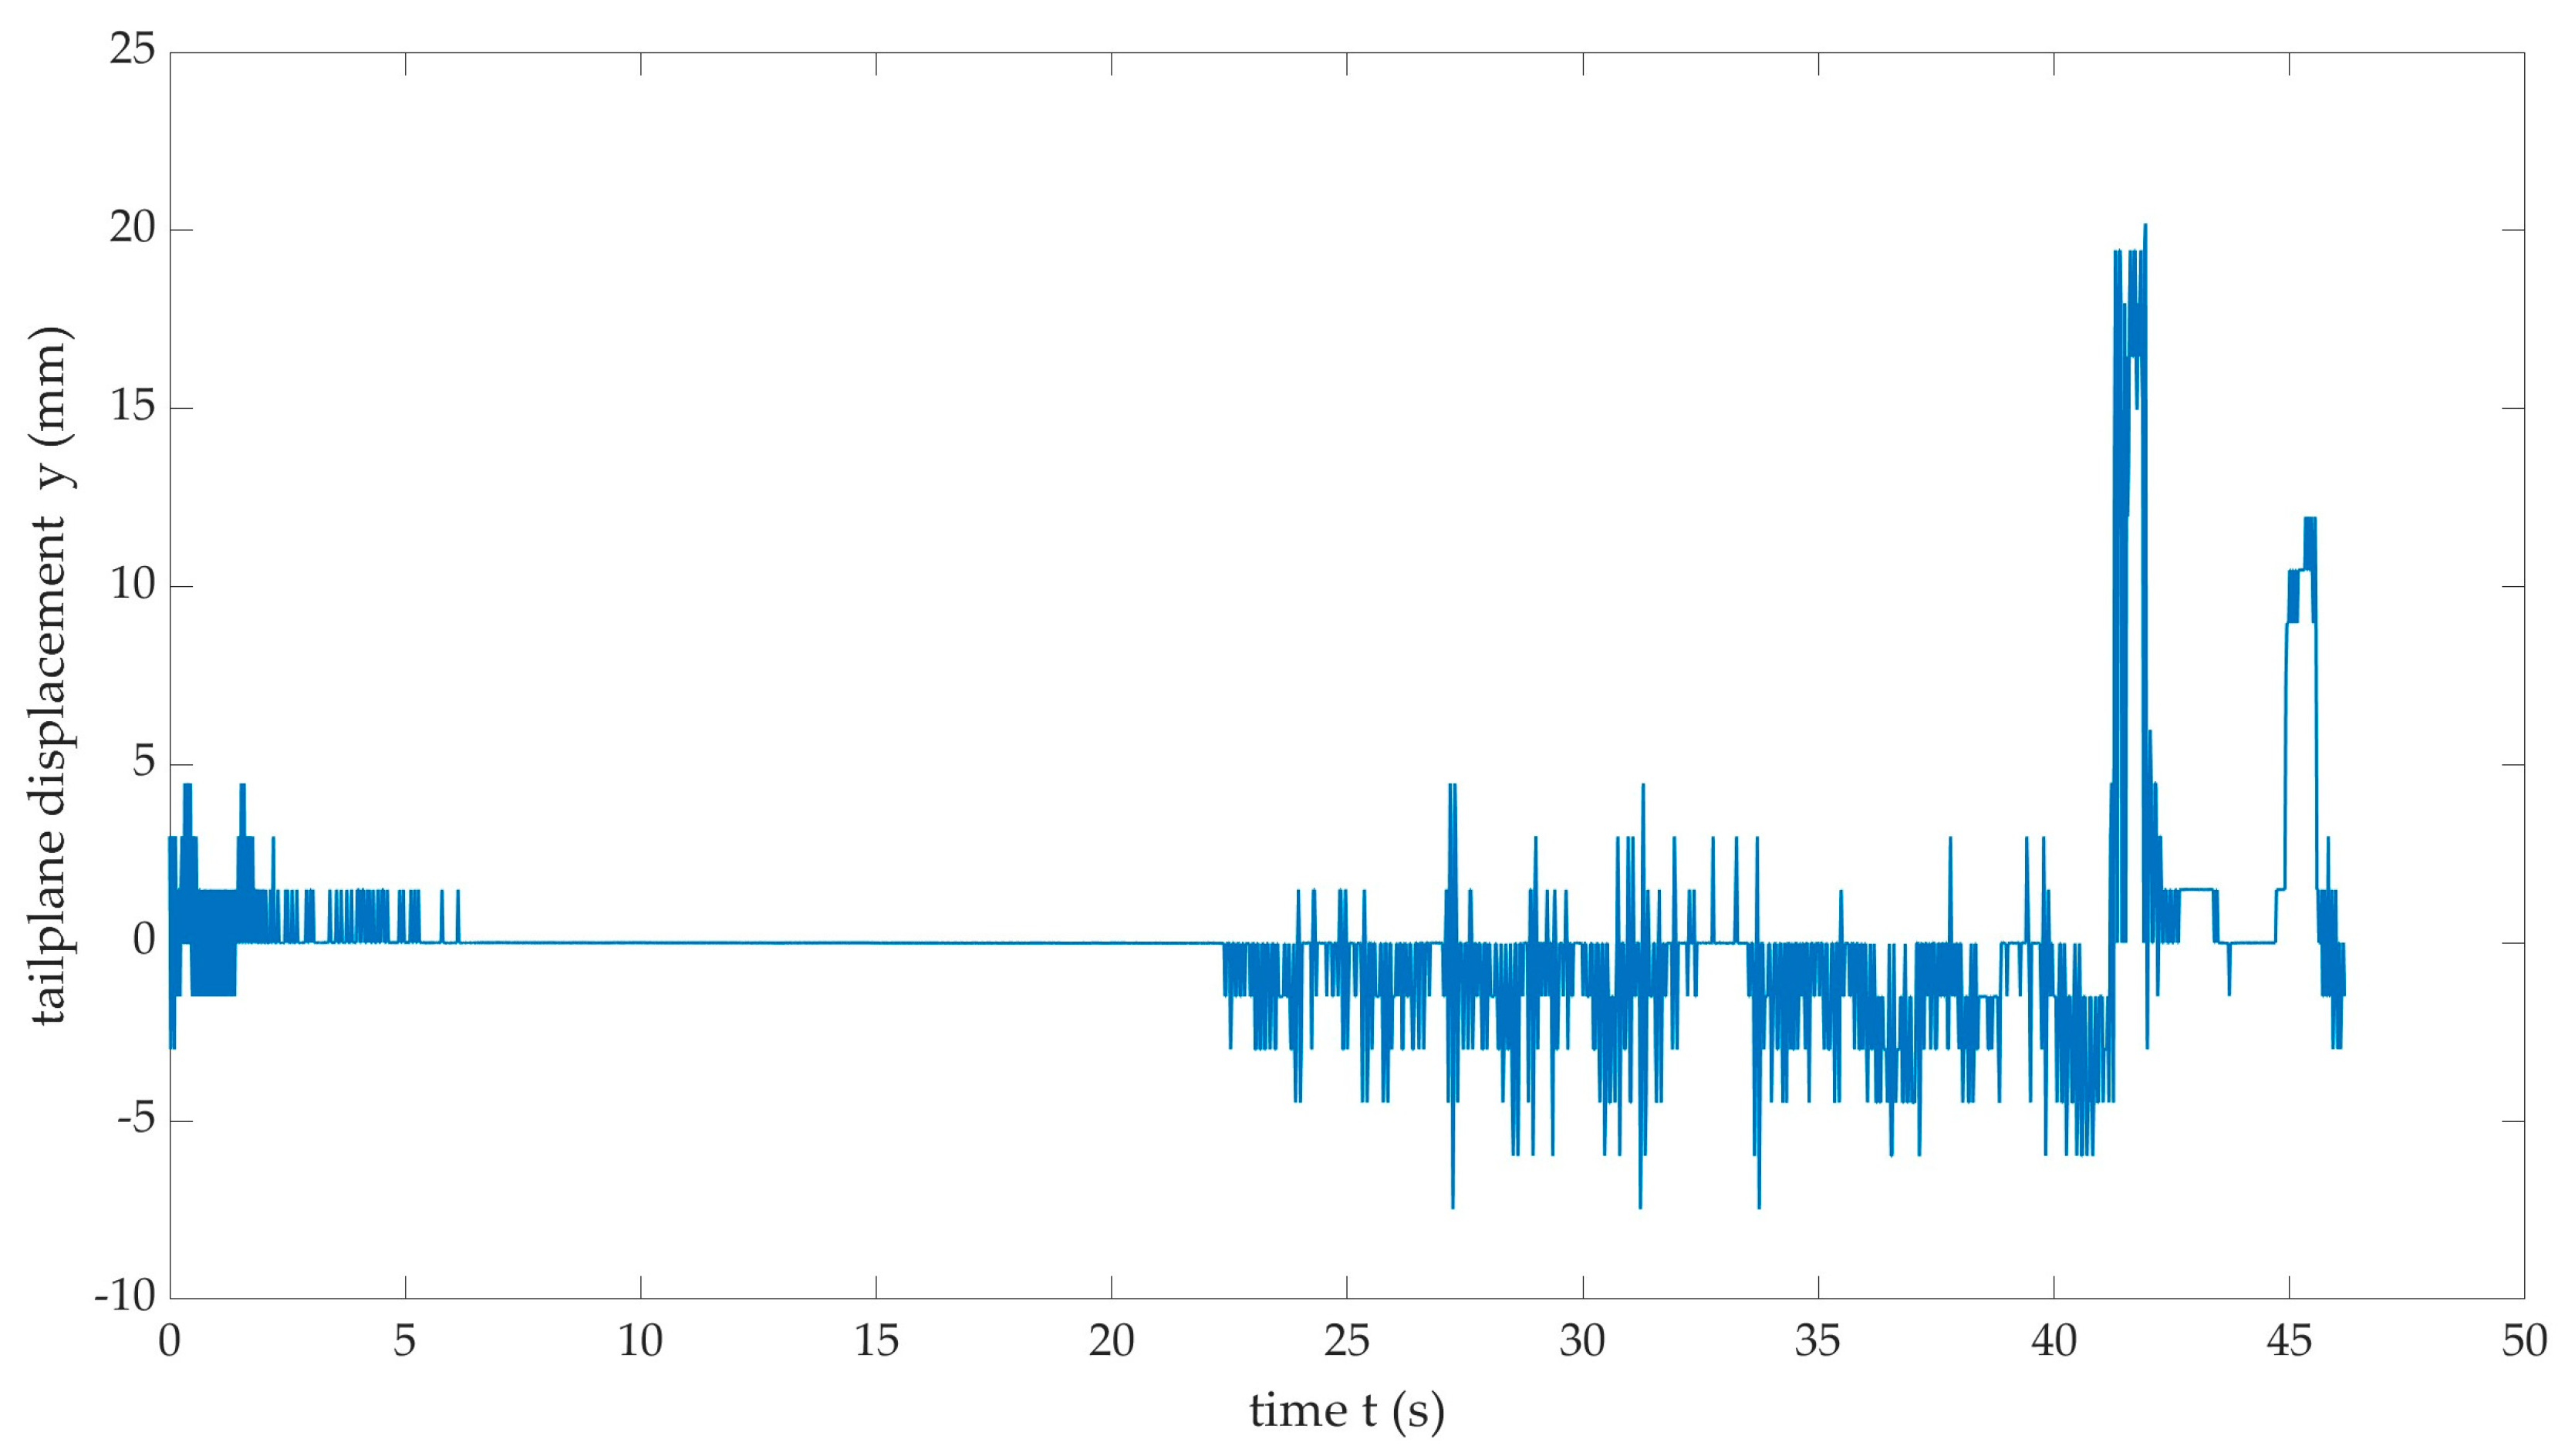
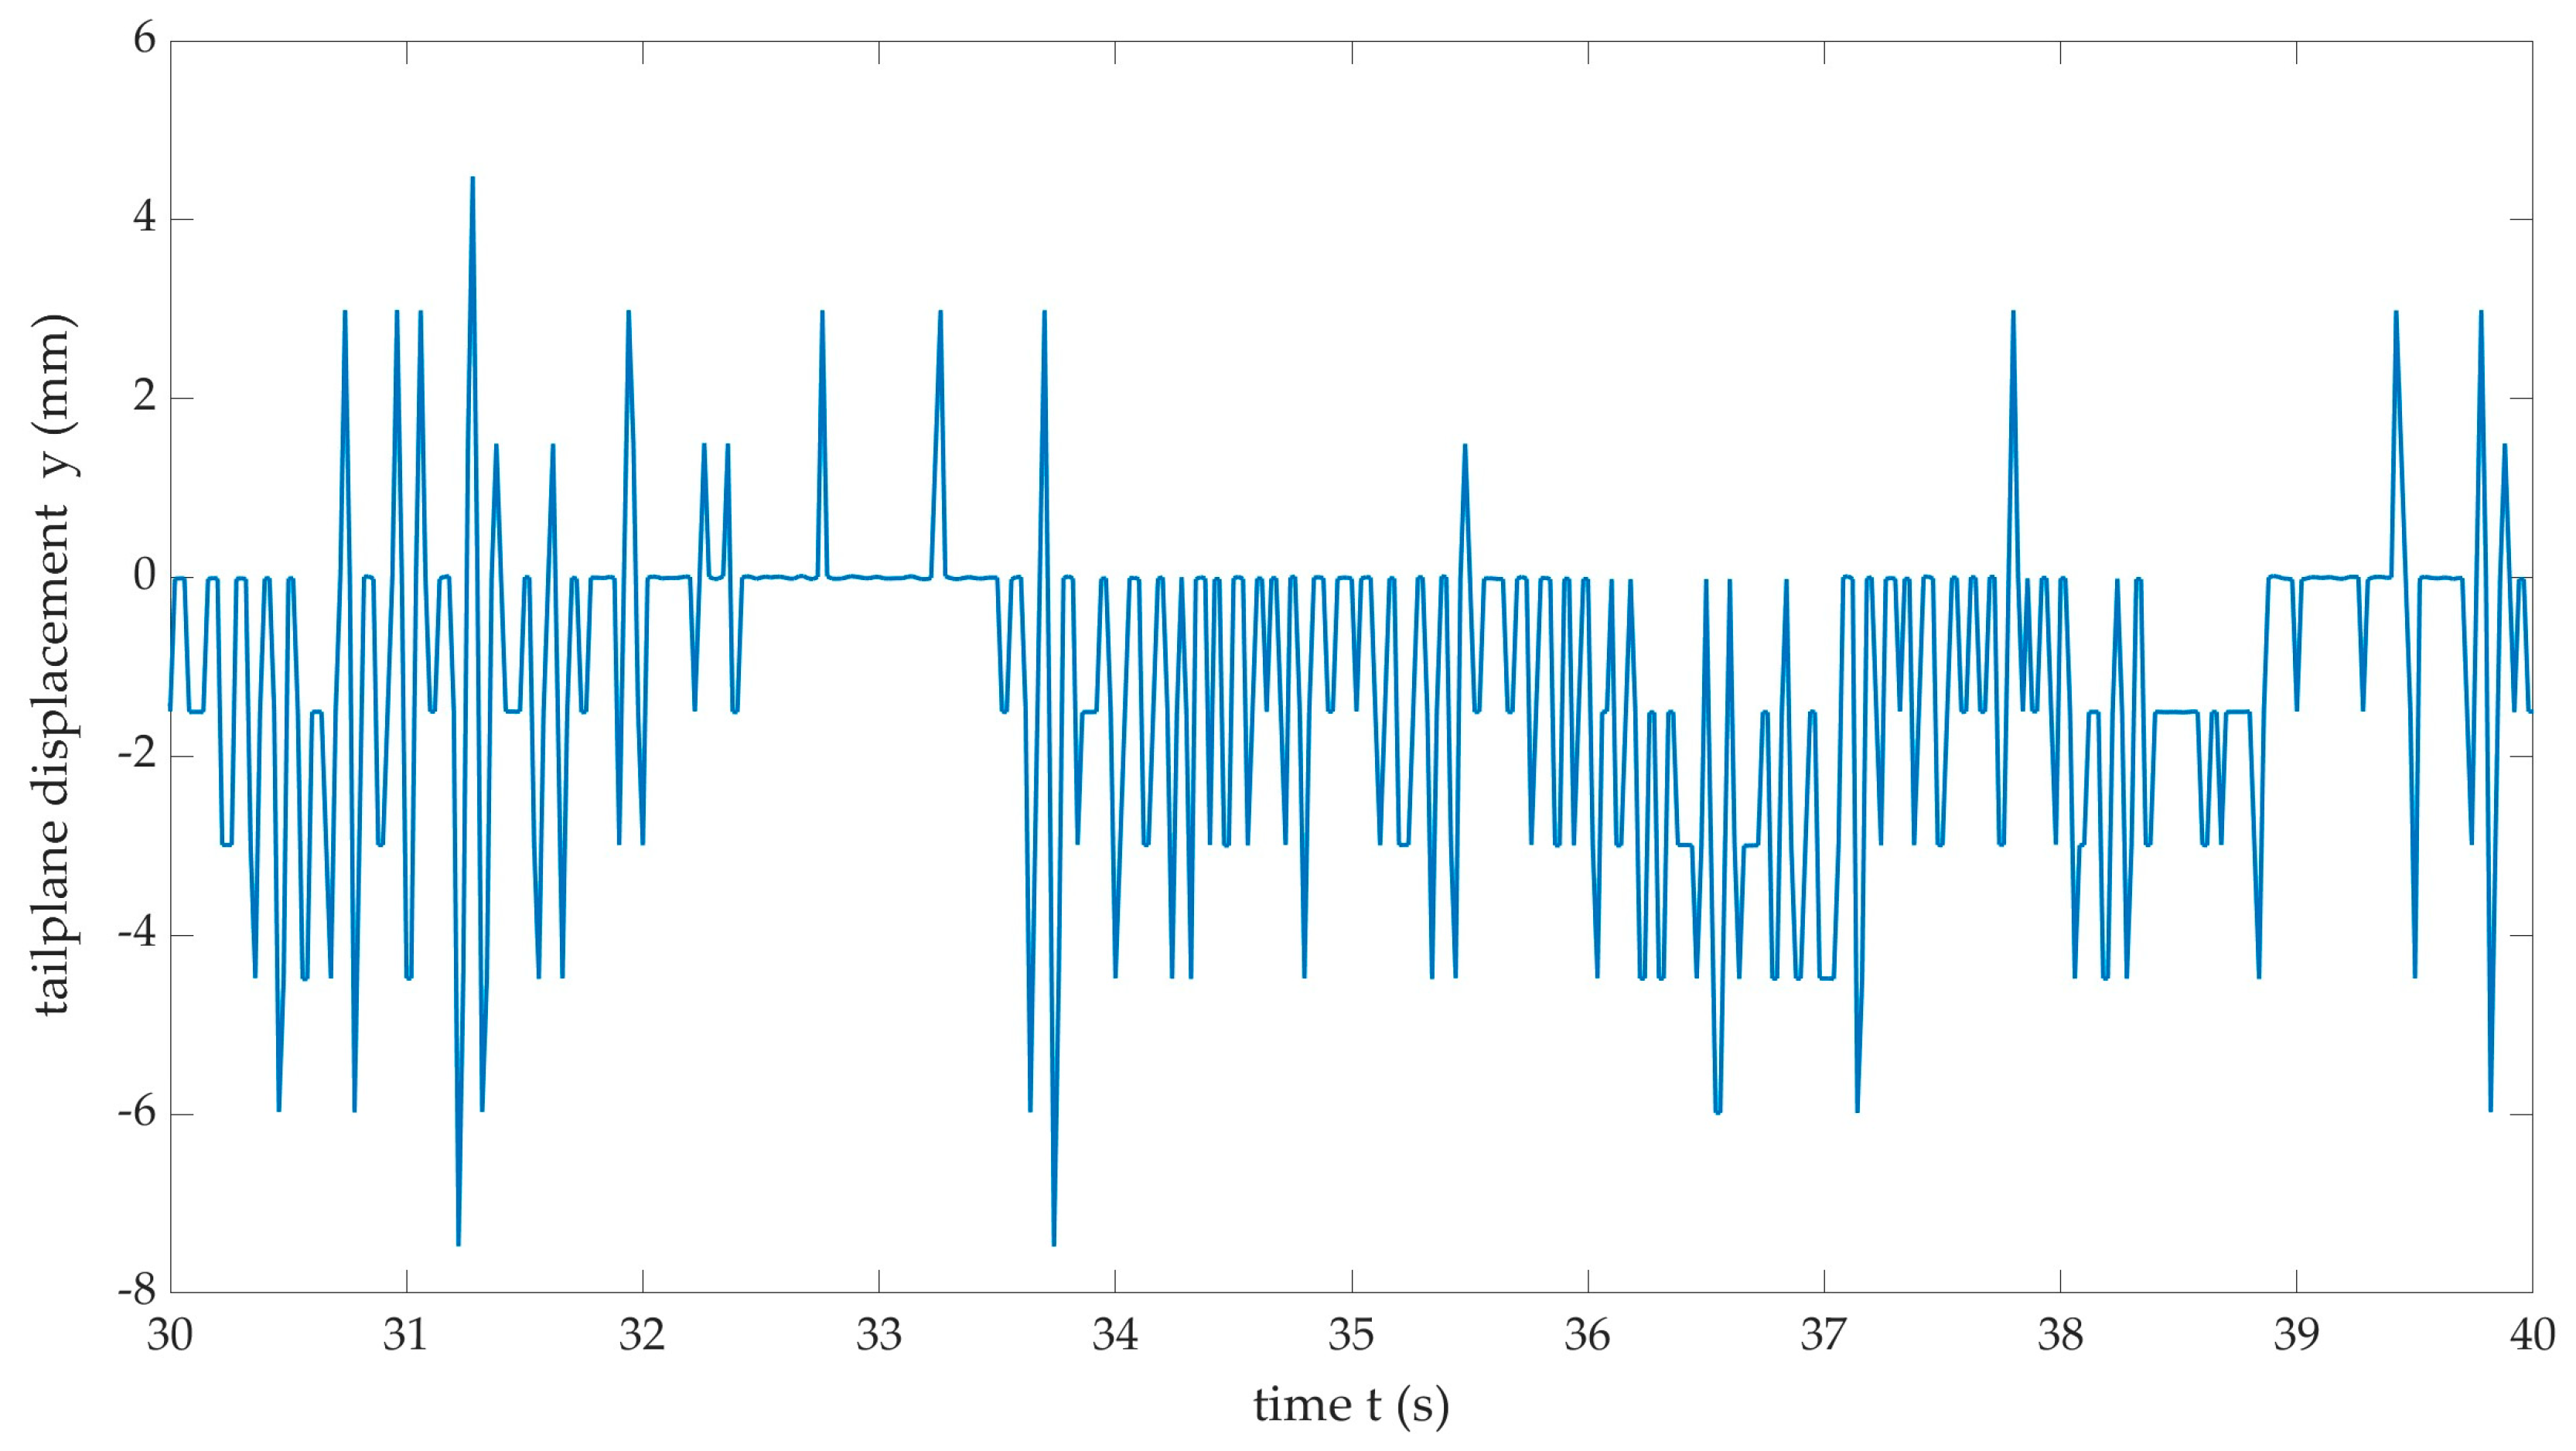
To calculate tailplane tip displacement data from the GoPro video recording, a frame-by-frame analysis process was developed, as shown in the schematic in Figure 5. In the initial stage, the GoPro bitmap sequence of 2660 images in 24-bit format was extracted from the video. The 47s image sequence started from a wings level condition until stall recovery was commenced, and an 8-bit cropped sample of the tailplane tip area, with size 201 pixels × 221 pixels, was taken from the full image as shown in Figure 4. This cropped image sequence was then processed using an in-house spatial cross-correlation code, ‘xpiv’ developed by the first author, written in X-Windows Motif and C-code. The code outputs pixel displacement, based on the spatial correlation of key image-to-image features and an initial image, at a selected number of grid points from a sequence of cropped bitmaps. In this case, each cropped image was sampled with 32 pixel × 32 pixel interrogation windows on a 3 × 3 grid, with centroid peak fit on the correlation peaks. A single grid point from the dataset was subsequently sampled into a time series of displacement data, at the center grid point of the sub-image.
In order to check for camera movement during the image sequence, a second correlation data set was also processed, from a separate canopy rail cropped image or sub-window (see Figure 4) where the movement of the camera relative to the rail feature was monitored, with 5 × 3 grid points and 64 pixel × 64 pixel interrogation region sizes. This camera movement was less than 0.05 pixels for the image sequence, which was several orders of magnitude lower than the peak pixel movements from the tailplane tip.
Further xpiv processing of a third image sub-window, above the tailplane and to the left of the fin (see Figure 4 and Figure 5), was used to estimate the pitch-attitude of the aircraft throughout the stall sequence, up to stall recovery. This approach assumed constant background features throughout the 43s sequence, including the clouds and horizon. In this case, to capture the gross features, a larger 512 × 512 interrogation region was used for the cross correlation with a 3 × 3 grid. Estimates of pitch attitude angle were then derived from previous aerodynamic data of the aircraft [7] and the point at which the stall warner sounded in the cockpit, which is known to be 12° of pitch attitude. This data allowed deviations in oscillations in pitch to be monitored before recovery by the pilot, and the spectra of the oscillation frequency could also be calculated.

2.3. Data Processing Error Analysis

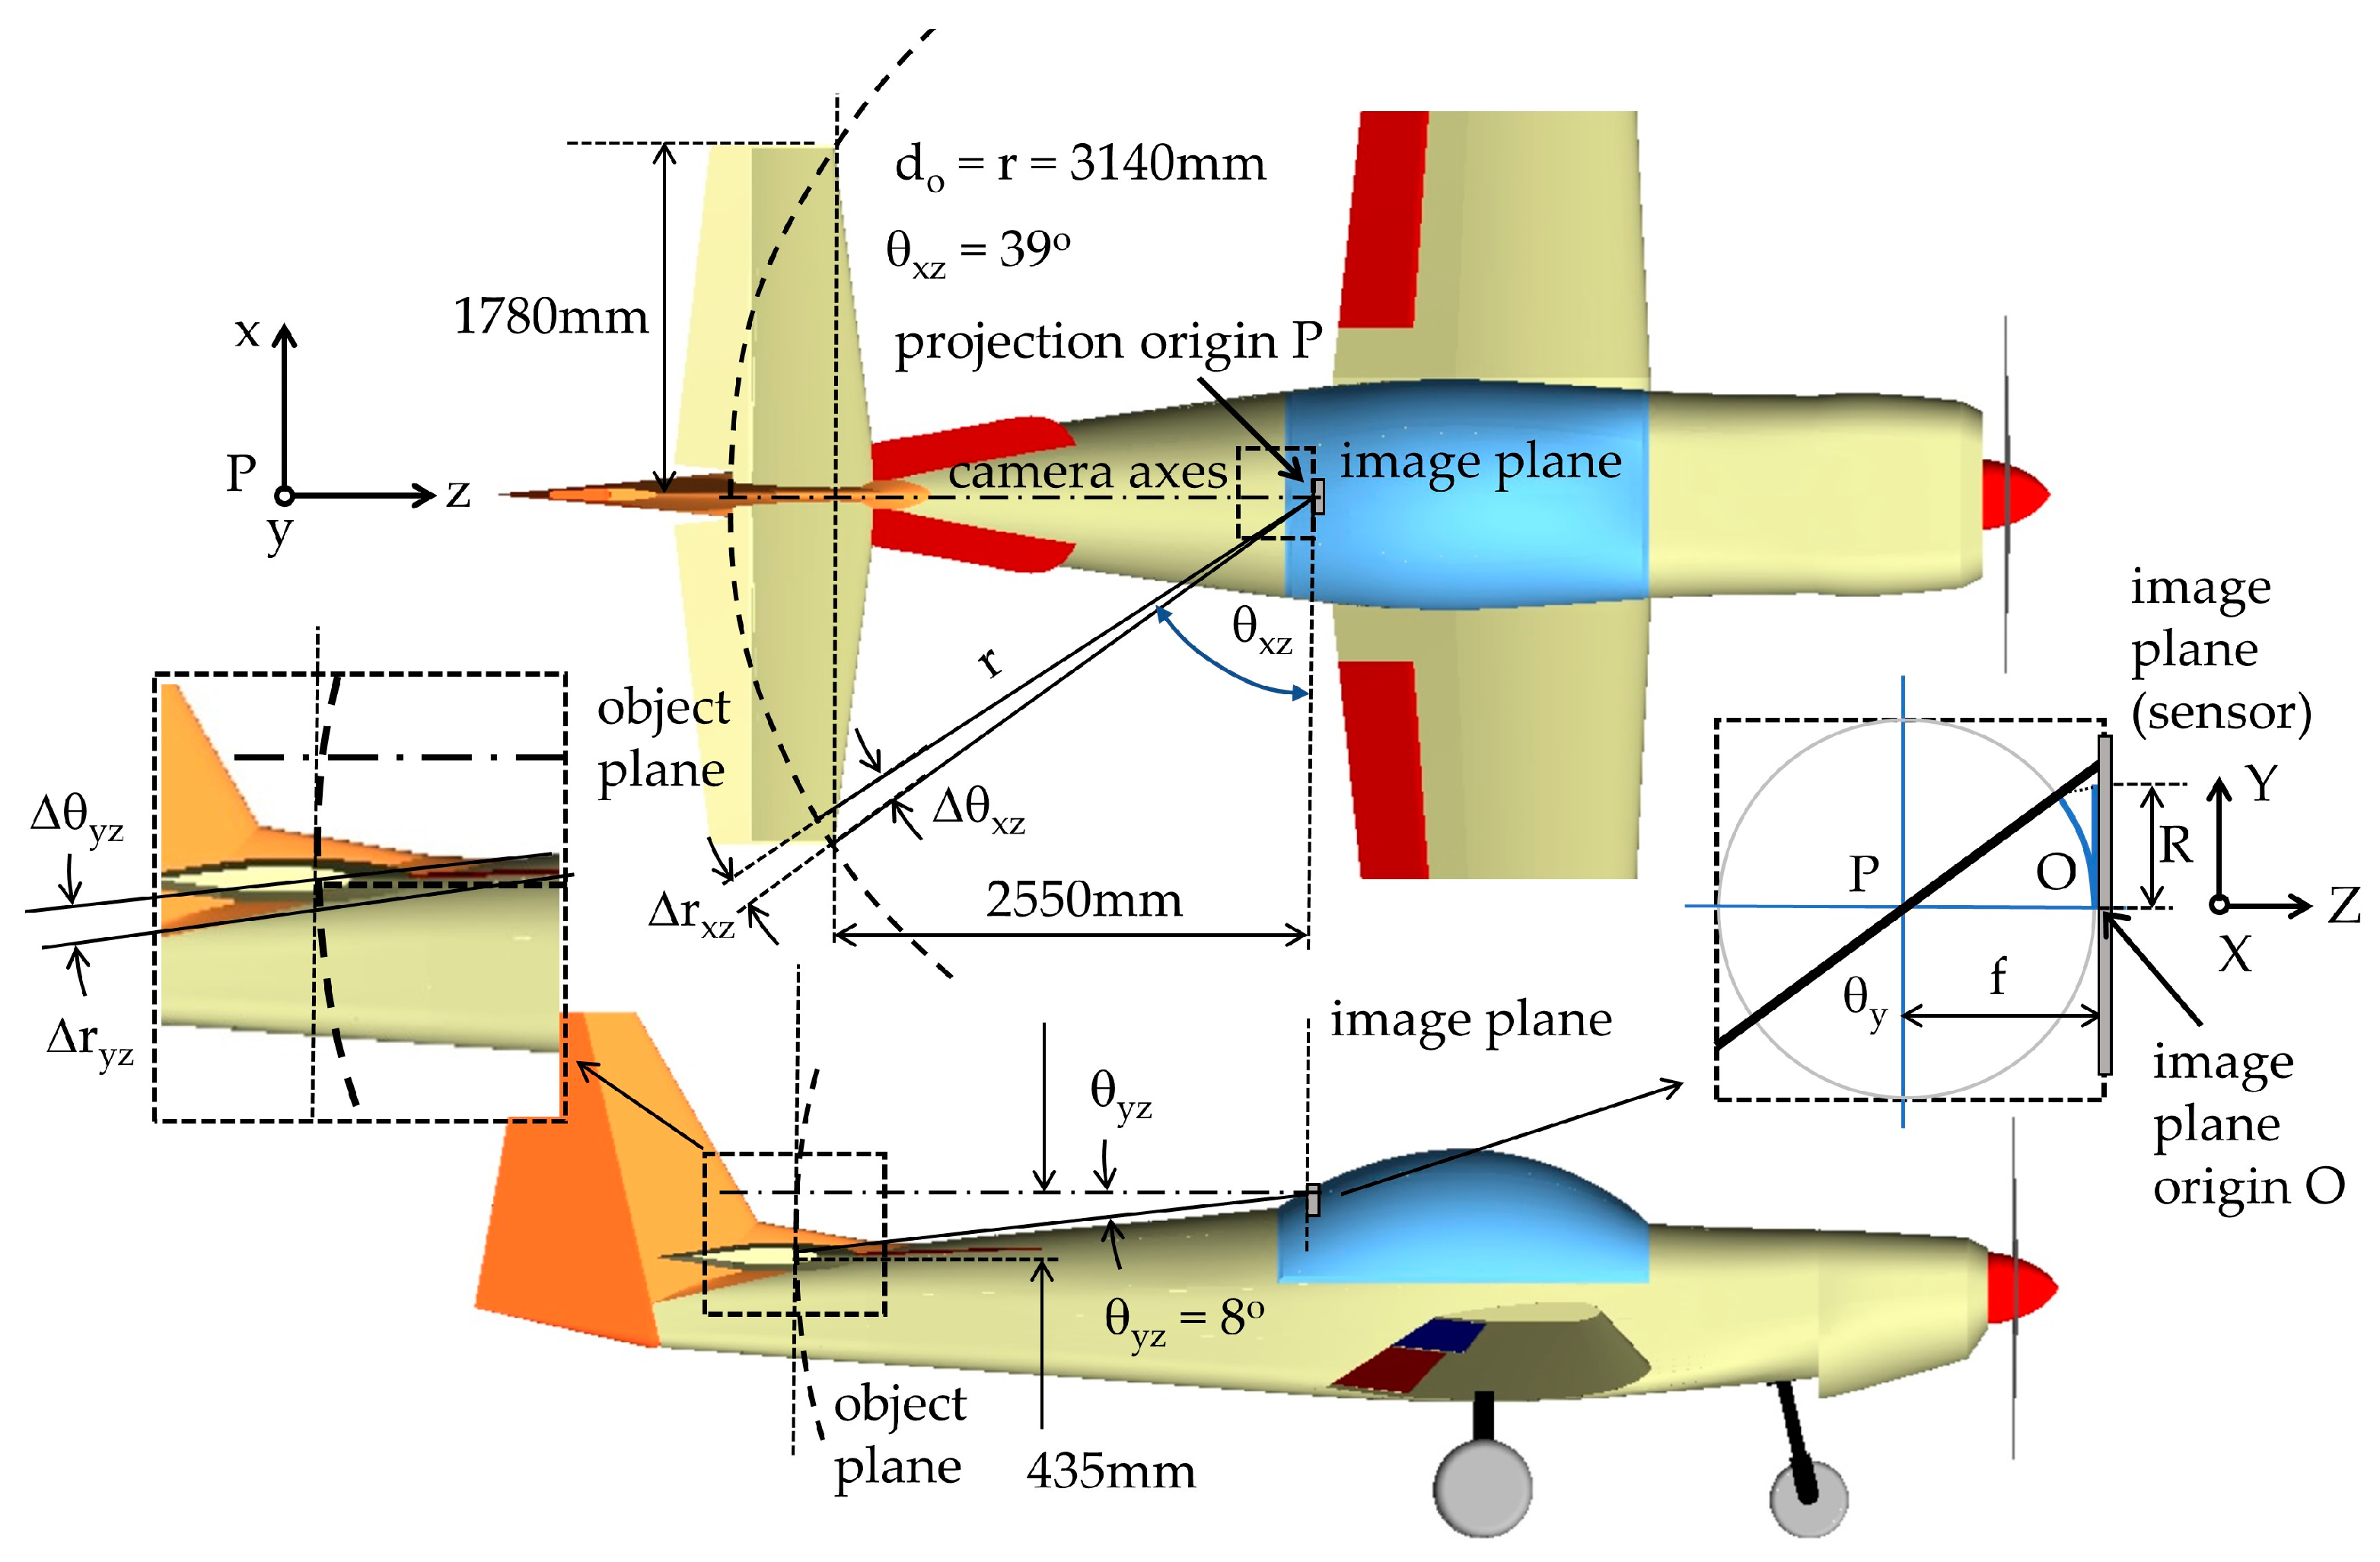
To estimate the error in measurement of the tailplane displacement, we need to consider a simplified model of the imaging system. The camera uses a fisheye lens with a field of view (FOV) of 180°. This prohibits the assumption of rectilinear (pinhole) projection, whereby straight lines from a flat object plane appear as straight lines in the image plane. Therefore, based on work by Hughes et al. [9], who assessed a similar FOV fisheye lens camera, we shall assume an equidistant projection model. In equidistant projection, the radial distance on the image plane is directly proportional to the incidence ray angle. Hence, with reference to Figure 6, with respect to the image plane origin O, the radius of projection R on the image plane is found from:
R = f θ ,
where R = X 2 + Y 2 , X and Y are distances from the sensor origin, f is the focal length of the imaging lens, and the incidence ray has an angle θ to the camera axes. In this case, the object plane is a hemisphere defined by a radius r = x 2 + y 2 + z 2 where x, y, z are distances from the projection origin P of the lens, and the estimated object distance to the tailplane tip do = r = 3140 mm. Further, with respect to the x–z and y–z distance planes, the sub-angles θxz and θyz are defined by θxz = tan−1(x/z) and θyz = tan−1(y/z), given θ = tan 1 y / x 2 + y 2 .
In the object plane, a displacement of the tailplane tip at do, can be estimated from the xz and yz radial components rxz, ryz such that:
Δ r x z = d o Δ θ x z
Δ r y z = d o Δ θ y z
where Δ r x z = Δ x 2 + Δ z 2 and Δ r y z = Δ y 2 + Δ z 2 , and given (1), the corresponding displacement in the imaging plane can be found from:
Δ X = f Δ θ x z
Δ Y = f Δ θ y z
Hence, from the image plane data, if the cross-correlation produces an error in measurement of δX and δY, then at do, the error δr in measurement of the tailplane displacement is simply found from:
δ r = d o f δ X 2 + δ Y 2 ,
Thus, given a typical cross-correlation rms error is 0.05 pixel in X and Y [10], with a pixel size of 1.8 microns, if f = 3 mm and do = 3140 mm, the rms displacement error in tailplane measurement is estimated to be δr = ±0.09 mm, equivalent to 2 mrad. It should be noted that for a fisheye lens, this error may vary across the FOV due to manufacturing limitations, particularly near the edge of the FOV. In this case, as the tailplane tip is away from the edge of the field, this error variation should be minimal.
For the measurement of frequency, given a sample rate of fsample, based on the Nyquist criterion, using a fast Fourier transform (FFT), the resolution in frequency will be 2/fsample, equivalent to 1 pixel in the FFT frequency plane. Hence, with a camera frame rate of 50 Hz, the spectra resolution is estimated to be ±0.04 Hz.

3. Results

The pitch attitude time-series data is shown in Figure 7. The data is taken from the rear-view sub-window from wings level flight to stall recovery at 38 s. Over the total sampling period of 42 s, the peak pitch attitude was found to be 27° just before the ‘g-break’, which occurs with a wing drop, preempting recovery by the pilot, to prevent a spin developing. Before this point, the aircraft is seen to oscillate in pitch significantly, from an initial stall at 22 s, after which heavy buffet developed. Figure 8 also shows the spectra from the pitch attitude sequence, where the post-stall pitch oscillations have frequencies of 0.34–0.47 Hz. A similar post-stall buffet behavior has been reported in previous data [7,8] and the pitch oscillatory behavior is also consistent with post-stall measurements and modeling published by other authors [11,12]. The rear-view data includes the yaw angle estimate, which varies from ±10°, where this characteristic is a result of the interaction of changes in sideslip angle, with the propeller yawing moment, the wing dihedral and the boundary layer separation line on the wing [12,13].
A sample of the time-series y-displacement data, taken from tailplane tip is shown in Figure 9. There are initial tailplane displacements up to a time of 6 s, which are related to the pilot throttling back the engine, before slowing the aircraft down to enter the stall at 22 s. Over the total sampling period of 47 s, peak y-displacements were −7.48 mm to +20.19 mm. The maximum displacement occurred when the pilot unloaded the tailplane to recover from the stall at 41.3 s in the sequence. A shorter sample window from 30 s–40 s is also shown in Figure 10, where peak oscillations during the buffet had y-displacements of −7.48 mm to +4.49 mm, when the aircraft was heavily stalled, with significant buffet. In all cases, the negative tailplane y-displacement originates from the tailplane load, which acts in a negative y-direction, to counter the moment generated between the aerodynamic center and the center of gravity of the aircraft. The oscillatory nature of the buffet on the tailplane can be seen in the characteristic in Figure 10 and a spectra of the sample, in Figure 11.
From this spectra, the lower frequency deflections of less than 1 Hz, evident in the pitch attitude data (Figure 7 and Figure 8), can also be seen in Figure 11. As discussed previously, this pitching behavior matches stability modeling and experiments reported by previous authors [11,12] and which are primarily driven by the unsteadiness in the separation point of the wing, and the change in stability of the aircraft post-stall [12,13]. When under these conditions, the tailplane is not stalled and this was confirmed by a previous numerical model by the authors [7] and therefore the accelerations from these gross pitch oscillations, clearly displace the tailplane. In this tailplane spectra, there was also a second dominant peak of 9.28 Hz (Figure 11), which within experimental error, matches the natural frequency of the tailplane, as shown in Figure 2. Therefore, it is clear the wake shedding frequency from the wing is interacting with the tailplane and within a range of angle of attack is closely matching the tailplane natural frequency. This results in this additional significant excitation of the tailplane structure, and this is structurally undesirable. Further synchronized accelerometer and camera data would be required to investigate any potential phase modulation behavior of the wake with the tailplane, by comparison of the image and accelerometer time series. These measurements are planned in future work.

4. Conclusions

Results from flight tests of a Slingsby Firefly light aircraft during an aerodynamic stall have been presented which have been taken using a GoPro 360 camera. The rear-view of the tailplane has allowed simultaneous analysis of estimates of the tailplane tip displacement, the pitch attitude of the aircraft and the yaw angle of the aircraft. Errors in measurement of the tailplane tip displacement and frequency were estimated to be ±0.09 mm (equivalent to 2 mrad at an object distance of 3140 mm) and ±0.04 Hz, respectively. Due to the fisheye properties of the camera lens, an equidistant projection model was used to estimate this displacement error.
The flight test results focused on the tailplane displacement and spectra and identified a significant tailplane interaction with of the main wing wake, which appears to excite one of the dominant natural frequencies of the tailplane. This excitation is consistent with the wake shedding frequency predicted by the authors using an unsteady CFD model [7,8]. The pitch attitude data also identified lower oscillatory frequencies during heavy buffet which are related to the stability characteristics of the aircraft during the stall and which are similar to phenomena reported in previous wind tunnel measurements and theoretical modelling. Further measurements using additional accelerometers and pressure measurements, with the imaging system, would be required to identify more complex phenomena, such as phase modulation between the aerodynamic shedding and tailplane displacement.

Author Contributions

Conceptualization, N.J.L. and S.G.D.; methodology, N.J.L. and S.G.D.; software, N.J.L.; validation, N.J.L., S.G.D., B.K. and R.I.H.; formal analysis, N.J.L. and B.K.; investigation, N.J.L. and S.G.D.; resources, N.J.L.; data curation, N.J.L. and S.G.D.; writing—original draft preparation, N.J.L.; writing—review and editing, N.J.L., S.G.D., B.K. and R.I.H.; visualization, N.J.L. and S.G.D.; supervision, N.J.L.; project administration, N.J.L.; funding acquisition, N.J.L. All authors have read and agreed to the published version of the manuscript.

Funding

This research received no external funding.

Data Availability Statement

Some or all data, models, or code that support the findings of this study are available from the corresponding author upon reasonable request. These include images and inertial data files.

Acknowledgments

The authors would like to acknowledge the support of the technicians and workshops of the School of Aerospace, Transport and Manufacturing at Cranfield University.

Conflicts of Interest

The authors declare no conflict of interest.

References

  1. Breitsamter, C. Wake vortex characteristics of transport aircraft. Prog. Aerosp. Sci. 2011, 47, 89–134. [Google Scholar] [CrossRef]
  2. Vermeer, J.J.; Sorensen, J.N.; Crespo, A. Wind turbine wake aerodynamics. Prog. Aerosp. Sci. 2003, 39, 467–510. [Google Scholar] [CrossRef]
  3. Zhang, W.; Ning, X.; Li, F. Vibrations of simplified rudder induced by propeller wake. Phys. Fluids 2021, 33, 083618. [Google Scholar] [CrossRef]
  4. Rockwell, D. Vortex-Body interactions. Ann. Rev. Fluid Mech. 1998, 30, 199–229. [Google Scholar] [CrossRef]
  5. Lagopoulos, N.S.; Weymouth, G.D.; Ganapathisubramani, B. Deflected wake interaction of tandem flapping foils. J. Fluid Mech. 2020, 903, A9. [Google Scholar] [CrossRef]
  6. Lee, B.H.K. Vertical tail buffeting of fighter aircraft. Prog. Aerosp. Sci. 2000, 36, 193–279. [Google Scholar] [CrossRef]
  7. Neves, A.F.; Lawson, N.J.; Bennett, C.J.; Khanal, B.; Hoff, R.I. Unsteady Aerodynamics Analysis and Modelling of a Slingsby Firefly Aircraft: Detached-Eddy Simulation Model and Flight Test Validation. Aerosp. Sci. Technol. 2020, 106, 106179. [Google Scholar] [CrossRef]
  8. Corrochano, A.; Neves, A.F.; Khanal, B.; Le Clainche, S.; Lawson, N.J. DES of a Slingsby Firefly Aircraft: Unsteady Flow Feature Extraction Using POD and HODMD. J. Aerosp. Eng. 2022, 35, 04022063. [Google Scholar] [CrossRef]
  9. Hughes, C.; Denny, P.; Jones, E.; Glavin, M. Accuracy of fish-eye lens models. Appl. Opt. 2010, 49, 3338–3347. [Google Scholar] [CrossRef] [PubMed] [Green Version]
  10. Westerweel, J. Fundamentals of digital particle image velocimetry. Meas. Sci. Technol. 1997, 8, 1379–1392. [Google Scholar] [CrossRef]
  11. Schoenstadt, A.L. Nonlinear relay model for post-stall oscillations. J. Aircr. 1974, 12, 572–577. [Google Scholar] [CrossRef]
  12. Pattinson, J.; Lowenberg, M.H.; Goman, M.G. Investigation of Poststall Pitch Oscillations of an Aircraft Wind-Tunnel Model. J. Aircr. 2013, 50, 1843–1855. [Google Scholar] [CrossRef]
  13. Phillips, W.F. Mechanics of Flight, 2nd ed.; John Wiley & Sons: New York, NY, USA, 2010; ISBN 978-0-470-53975-0. [Google Scholar]
Figure 1. Accelerometer y-axis normalized impulse excitation.
Aerospace 09 00787 g001
Figure 2. FFT normalized power spectra from y-axes accelerometer output.
Aerospace 09 00787 g002
Figure 3. Front cockpit view in-flight from GoPro camera system.
Aerospace 09 00787 g003
Figure 4. Tailplane view in-flight from GoPro camera system. Sub-window images indicate tailplane tip sub-window (201 pixels × 221 pixels), reference canopy rail (251 pixels × 101 pixels) and pitch attitude sub-window (910 pixels × 640 pixels).
Aerospace 09 00787 g004
Figure 5. Data processing approach to tailplane, canopy rail reference and pitch attitude estimation.
Aerospace 09 00787 g005
Figure 6. Imaging geometry showing the object and image plane variables.
Aerospace 09 00787 g006
Figure 7. Time series pitch attitude data from GoPro rear view image sequence.
Aerospace 09 00787 g007
Figure 8. Pitch attitude spectra taken from time series pitch attitude data.
Aerospace 09 00787 g008
Figure 9. Time series displacement data from GoPro tailplane image sequence, taken from an initial wings level condition. Stall is estimated to be at 22 s.
Aerospace 09 00787 g009
Figure 10. Sample window of time series displacement data from GoPro tailplane image sequence.
Aerospace 09 00787 g010
Figure 11. Spectra of GoPro tailplane time series data.
Aerospace 09 00787 g011
Table 1. Summary of flight test conditions for the tailplane stall test.
ParameterValueErrorNotes
Pressure altitude (feet)6500±30Standard pressure setting used
Outside air temperature (°C)5±0.5Based on aircraft temperature gauge
Aircraft empty weight (kg)902±20Based on weight schedule
Pilot and fuel weight (kg)138±10Based on fuel gauge error with 80 L of fuel at 0.72 kg/m3 and 80 kg pilot
Aircraft stall speed (knots)58±3Indicated airspeed reduced at 1 knot/s into the stall and buffet until full back stick
Publisher’s Note: MDPI stays neutral with regard to jurisdictional claims in published maps and institutional affiliations.

