
Performance Impact Assessment of Reducing Separation Minima for En-Route Operations
by
 , , , and
Marta Pérez Maroto
1,* ,
,
Javier García-Heras
2,
Luis Pérez Sanz
1,
Lidia Serrano-Mira
1 and
and
Javier Alberto Pérez-Castán
1 1
ETSI Aeronáutica y del Espacio, Universidad Politécnica de Madrid, Plaza del Cardenal Cisneros, 28040 Madrid, Spain
2
ETSI Aeronáutica y del Espacio, Universidad Carlos III de Madrid, 28911 Leganés, Spain
*
Author to whom correspondence should be addressed.
Aerospace 2022, 9(12), 772; https://doi.org/10.3390/aerospace9120772
Submission received: 26 October 2022
/
Revised: 20 November 2022
/
Accepted: 24 November 2022
/
Published: 29 November 2022
(This article belongs to the Special Issue Advances in Air Traffic and Airspace Control and Management)
Abstract
:The required minimum separation distance between aircraft is believed to be one of the limiting factors on airspace capacity. In recent decades, aircraft separation rules have been modified by progressively shortening the required minimum separation distance. Following this trend in the coming years, a further reduction in the minimum separation distance would be expected. Still, a thorough assessment of the impact of this action on air traffic management performance should be carried out before investing in a reduction of separation minima. A Monte Carlo analysis of the en-route Spanish airspace shows that it is worth reducing the en-route minimum separation distance from 5 NM to 3 NM. This paper shows that a separation minima reduction will bring significant fuel savings, flight delay reduction, air traffic controller workload drop, and overall improvement of safety.
1. Introduction
After the economic crisis of a decade ago, since 2014 Europe has seen a steady return to air traffic growth, which is forecasted to continue in the long term. The year 2018 saw an all-time record of 11 million flights in the European airspace, an increase of 4% in 2017, and the most reliable traffic forecast scenarios anticipate over 15 million flights per year by 2035 [1]. Conversely, the average en-route air traffic flow management (ATFM) delay over European airspace was just under 2 min per flight in 2018, while the EU-wide performance target for the year was 0.5 min. The average flight delay in 2018 was twice that of 2017. In 2019, one in ten flights received ATFM delays, adding up to around 4.8 million min of delays in the European Civil Aviation Conference (ECAC) airspaces, with more than 490 million € costs [2]. This number was reduced during 2020 and 2021 mainly because traffic has dropped dramatically since the arrival of the COVID-19 pandemic in 2020, with about a 60% reduction in 2020 and a 49% reduction in 2021, with respect to the values in 2019 [3]. Nevertheless, traffic in the summer of 2022 has reached 86% of the 2019 traffic levels (as of August, already 2.9 million ATFM delays), showing that if the global world maintains the regularity of pre-pandemic times, traffic will tend toward 2019 levels. Therefore, given the expected growth, all signs of flight delays further increase if stringent actions are not taken [1].
In addition, a worldwide concern is the environmental impact of flying. In particular, Europe is prompting the aviation industry to step up its efforts to address the environmental sustainability of air travel to reach the EU’s carbon-neutral goal by 2050 [4]. In support of this goal, the Single European Sky Air traffic management Research (SESAR) has prioritized solutions that will gradually contribute to eliminating environmental inefficiencies due to the underlying aviation infrastructure. According to previous statements, the objectives of interest in the future Air Traffic Management (ATM) are to achieve a system that meets user expectations—improving capacity, maintaining safety, boosting flight efficiency, performing sustainable air operations, and reducing environmental impact.
Although there are currently many research lines to meet the above user expectations, improving Air Traffic Control (ATC) service delivery is a factor with lots of room for improvement. One of the core activities of the ATC service is to prevent collisions between aircraft [5], which is done following a particular set of separation rules. Such rules, together with specific procedures and application conditions associated with minimum separation, are designed by the International Civil Aviation Organization (ICAO) as separation mode [6]. From this definition, minimum separation is, therefore, the minimum displacements between an aircraft and a hazard which maintain the risk of collision at an acceptable level of safety. There are two approaches to defining separation mode. One method concerns a bottom-up approach that would consider the performance of some available technical means to determine the separation mode. Conversely, a top-down approach would define the target separation mode according to ATM necessities and then find the supporting technical means. Since the bottom-up used to be the preferred approach, the evolution of minimum separation distance was determined by the available technology, particularly in terms of surveillance. The minimum separation distance for the continental en-route flight phase has evolved from 15 NM in the 1980s to 10 NM in the 1990s. Then to 8 NM in the mid-2000s and finally to the current 5NM.
In parallel to the process above, massive research was aimed at decision-making supporting Separation Minima (SM) reduction. Theories, mathematical models and algorithms were developed, validated and later implemented to enhance ATC tools, enabling reductions in SM. One of the pioneering works in aircraft collision risk models was developed in 1964 by Reich [7]. Subsequently, numerous research projects on improving the collision risk model were produced, most of them based on probabilistic models [8,9,10,11].
Complementary, wide research was conducted on identifying and contributing factors involved in ATC provision. In so doing, [12,13] discusses the contributing factors involved in mid-air collisions. Simultaneously, mid-air collision fault trees were developed by Eurocontrol. Many theories related to aircraft separation are based on the definition of “SM conflict”. A conflict is said to occur when the minimum separation distance between a pair of aircraft is lost. Thus, determining the probability of conflict triggered has been the subject of much research. Among the most outstanding works are those that choose the conflict probability based on the encounter geometry [14,15,16,17,18], conflict probability in ascending/descending flights [19], conflict probability using surveillance a state vector approach [20], or conflict probability in free flight [21]. Beyond determining the likelihood of conflict, in [22], the criteria for airspace planning is established based on the risk of conflict as the main factor.
Moving towards the Trajectory-Based (TB) separation, the probability of conflict was determined from data of the actual aircraft trajectory [23]. Finally, in the context of an Artificial Intelligence (AI) boom, Machine Learning (ML) algorithms are also being used for conflict detection [24].
Most theories consider that the ATC is responsible for separation provision. However, in the not-too-distant future, the aircraft would take the role of separation provision itself. Thus, conflict detection should also be assessed from an aircraft perspective [25]. Not only is it essential to detect aircraft conflicts, but also to apply the appropriate actions to resolve the situation, which is known as Conflict Resolution (CR). Different resolution alternatives are under consideration, such as modifying the time of arrival at intersection points [26], speed regulation of involved aircraft [27], speed or heading modification under particular criteria [28] or multi-criteria decision-making for conflict resolution [29].
Some other research of particular interest is related to the air ATC’s workload, since they, with the support of specific tools, are in charge of Conflict Detection and Resolution (CD&R) while monitoring the progress of the rest of the traffic [26,30,31]. Significant research related to CD&R from a mathematical or technical point of view is found in the literature, but on many occasions, determining the benefits of reducing the SM has been neglected. Studies have focused on safety, but other areas of interest, such as capacity, flight efficiency, and environment, seem to have been largely ignored. Although these areas are assessed, they offer qualitative findings rather than satisfactory quantitative results [32,33,34,35,36].
In light of all this, this paper aims to quantify the expected benefits of reducing the current SM in the ATM’s key performance areas of capacity, safety, flight delays, ATC workload and environment. Demonstrating benefits would motivate the continuation of the subsequent research on the definition and validation of a new separation mode. Finally, as Brooker said in his research, the future ATM concepts are very different from the present system [35]. Aircraft separation distances below 5 NM would imply changing the paradigm of tactical ATC, including new ATC responsibilities and new concepts in trajectory management (i.e., more centralized systems avoiding dependence on local infrastructure, migration to shared data, etc.). All of this will require significant investments, which are necessary in order to guarantee that a reduction in the SM will meet the expected user needs.
The remainder of this paper is structured as follows: Section 2 provides the SM concept. The Key Performance Indicators (KPIs) and metrics are presented in Section 3. Section 4 provides a detailed description of the methodology. In Section 5 the use case scenario is detailed and the results are provided in Section 6. Finally, Section 7 summarizes the conclusions.
2. Separation Minima Concept
In 1998, the International Civil Aviation Organization (ICAO) defined separation as a generic term used to describe the action on the part of Air Traffic Services (ATS) to keep aircraft operating in the same general area at such distances from each other that the risk of collision is maintained below an acceptable safe level. Such separation can be applied horizontally and vertically. Separation in the horizontal plane can be achieved either longitudinally (by spacing aircraft behind each other at a specified distance, which may be expressed in flying time/distance) or laterally (by spacing aircraft side by side at a specified distance from each other or by specifying the width of the protected airspace on either side of an air route centre line). In en-route airspace, the separation is usually expressed in minimum distances in each dimension, which should not be infringed simultaneously. This information published by ICAO about the current en-route separation minima is mainly based on Doc 4444 ICAO—Air Traffic Management [37]. Additionally, information has also been obtained from the Air Traffic Services Planning Manual (Doc 9426) [38], Manual on Airspace Planning Methodology for the Determination of Separation Minima (Doc 9689) [10] and Performance-based Navigation (PBN) Manual (Doc 9613) [39].
3. Performance Indicators and Metrics
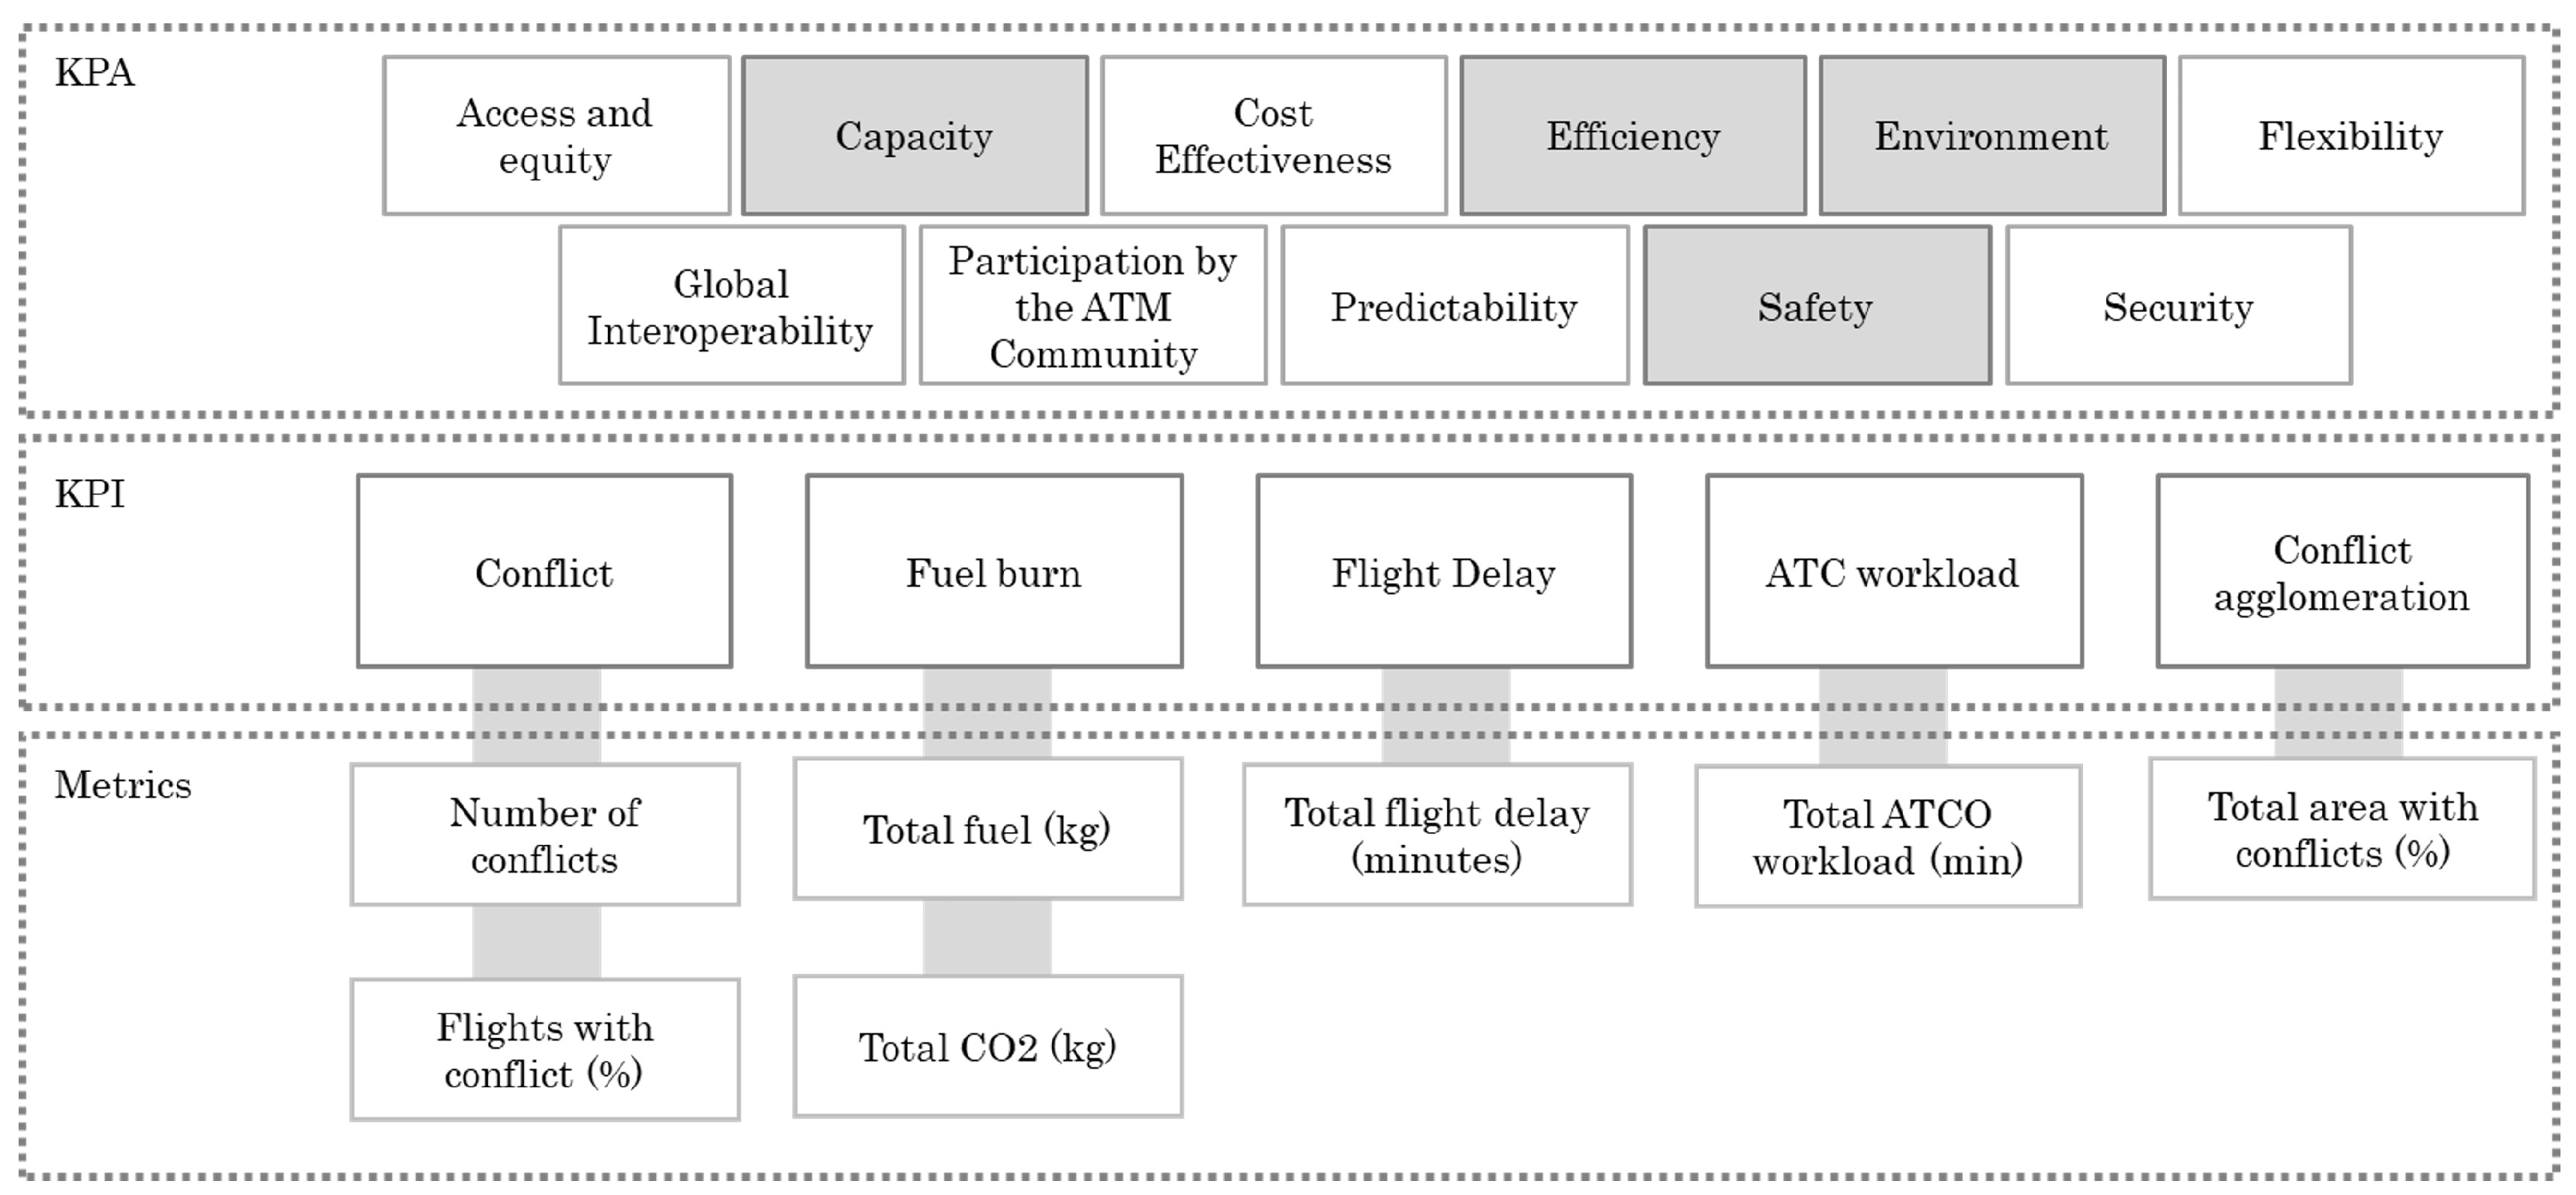
There are several areas for improvement within the ATM that guide the industry’s research and effort. In particular, ICAO defines 11 Key Performance Areas (KPAs) that are interrelated and conform to a holistic perspective of user expectations (access and equity, capacity, cost-effectiveness, efficiency, environment, flexibility, global interoperability, participation by the ATM community, predictability, safety and security). Among them, there are four areas that present a strong relationship with aircraft separation minima reduction; safety, capacity, efficiency and environment. These distinct areas provide a way of categorizing performance subjects related to high-level ambitions and expectations.
ATM performance is quantitatively expressed through indicators (KPIs). Ad-hoc defined indicators are related to detected number of conflicts, fuel burn, flight delay, ATC workload, and conflict agglomeration. Metrics have been defined ad-hoc so that the behaviour of a system is described as accurately as possible through one or several of them. Metrics are, therefore, numerical values that represent a system and compare different scenarios, which can be associated with one or more KPAs. Metrics have been carefully defined according to other studies with similar objectives like in [40]. Figure 1 summarizes the KPAs, KPIs and metrics defined to evaluate the operational impact of reducing separation minima on ATM performance.
3.1. Number of Conflicts
The first metric consists of counting the number of conflicts triggered in a scenario in 1-h (). Scenarios will be defined in Section 5 and are the responsibility of either an airspace sector or FIR/UIR. Next,
where is the conflict triggered between a pair of aircraft in 1 h, is the total number of flights in the sector.
3.2. Flights with Conflict
This metric is intended to link the number of conflicts to the total flights in a particular sector. Then, the number of flights with conflict, since every conflict involves two aircraft (), is computed as follows:
where is the total number of flights in the sector. The metric is therefore given in percentage.
3.3. Total Fuel
The fuel metric is intended to quantify the difference in fuel burn due to conflict resolution manoeuvres. Thus, the metric measures how much fuel is burned in an executed trajectory, (modified by conflict resolution manoeuvres), compared to the planned trajectory. Note that, for every conflict, a resolution manoeuvre can be applied to one or both aircraft involved, (although most common practice is to adjust only one aircraft). The increment of fuel due to conflict manoeuvre resolution of a single aircraft () is measured in kg.
where , are the executed and planned flight fuel, respectively.
Moreover, the total increment of fuel burned was defined by the flights involved in conflicts F as the total fuel burned due to conflict avoidance manoeuvre in a particular sector in 1-h.
3.4. Total CO2
CO metric is an estimation of the CO emissions due to conflict resolution manoeuvres. It can be obtained by multiplying the number of fuel kilograms by 3.15. This estimation comes from the SESAR Environment Assessment Study [41], where a direct link was determined between fuel burn and the amount of produced. The total carbon emissions (E) in a sector in 1-h is measured in kg.
3.5. Total Flight Delay
The metric is conceived to measure the added executed flight time to the planned flight time (flight delay) due to conflict avoidance. The approach of this metric calculation follows the same pattern as the total fuel metric but considering flight times, that is to compare the flight time of the executed trajectory versus the flight time of the planned trajectory. The delay due to conflict manoeuvre resolution of a single aircraft () is measured in minutes.
where , are the executed and planned flight times, respectively.
The total delay of the flights involved in conflicts (D) is computed as follows:
Note that, total time by flight delay is only due to conflict avoidance manoeuvres in a particular sector in 1-h. It should be remarked that, after a conflict resolution manoeuvre, it is considered that the aircraft returns to the planned route; therefore, it will generally imply an increase of flight time. In reality, a conflict resolution manoeuvre could result in either lengthening or shortening the flown distance with respect to the planned one, considering that the aircraft may modify its route downstream permanently.
3.6. ATCO Workload
This metric is designed to quantify the extra Air Traffic Control Officer (ATCO) workload added by the conflict detection and resolution activities. To measure workload, this metric focused on the necessary that an ATCO must spend to fully manage a conflict, from detection to the resumption of navigation [42]. To identify how much time is needed to manage a conflict, an expert judgment was conducted. A total of 6 ATCOs met to agree on the times for each of the conflict management and resolution activities. It was decided in consensus to split the conflict detection and resolution evolution into five sub-tasks (conflict detection, identification of the resolution manoeuvre, communication to pilot, manoeuvre execution and navigation resuming). A specific amount of time was assigned to every sub-task so that the total time for conflict management results from the ordinary sum of the times of each of the five sub-tasks. Table 1 gathers the results from the experts’ consensus.
From Table 1, the maximum time spent in CD&R activities of 210 s (3.5 min) can be deduced, which gives the workload per ATCO (W), measured in minutes in a sector in 1-h.
where is the total number of tactical controllers working on the scenario.
3.7. Total Area with Conflict
The last metric intends to quantify the area proportion where conflicts occur with respect to the total sector area. Due to its route configuration, a particular sector may have some locations where traffic agglomerates. This metric is intended to quantify potential conflict accumulation locations and is to be analysed using heatmaps (measuring hotspots). The ratio of area where any conflict is involved is measured in square kilometers.
where is the total area where conflicts are involved, is the total scenario area.
4. Methodology
The methodology focuses mainly on quantifying how the SM influence the ATM key performance areas (see Section 3). As mentioned in the previous section, the selected performance indicators derived from KPAs for this study are the number of conflicts, flight delay, fuel burn, ATC workload and conflict agglomeration distribution.
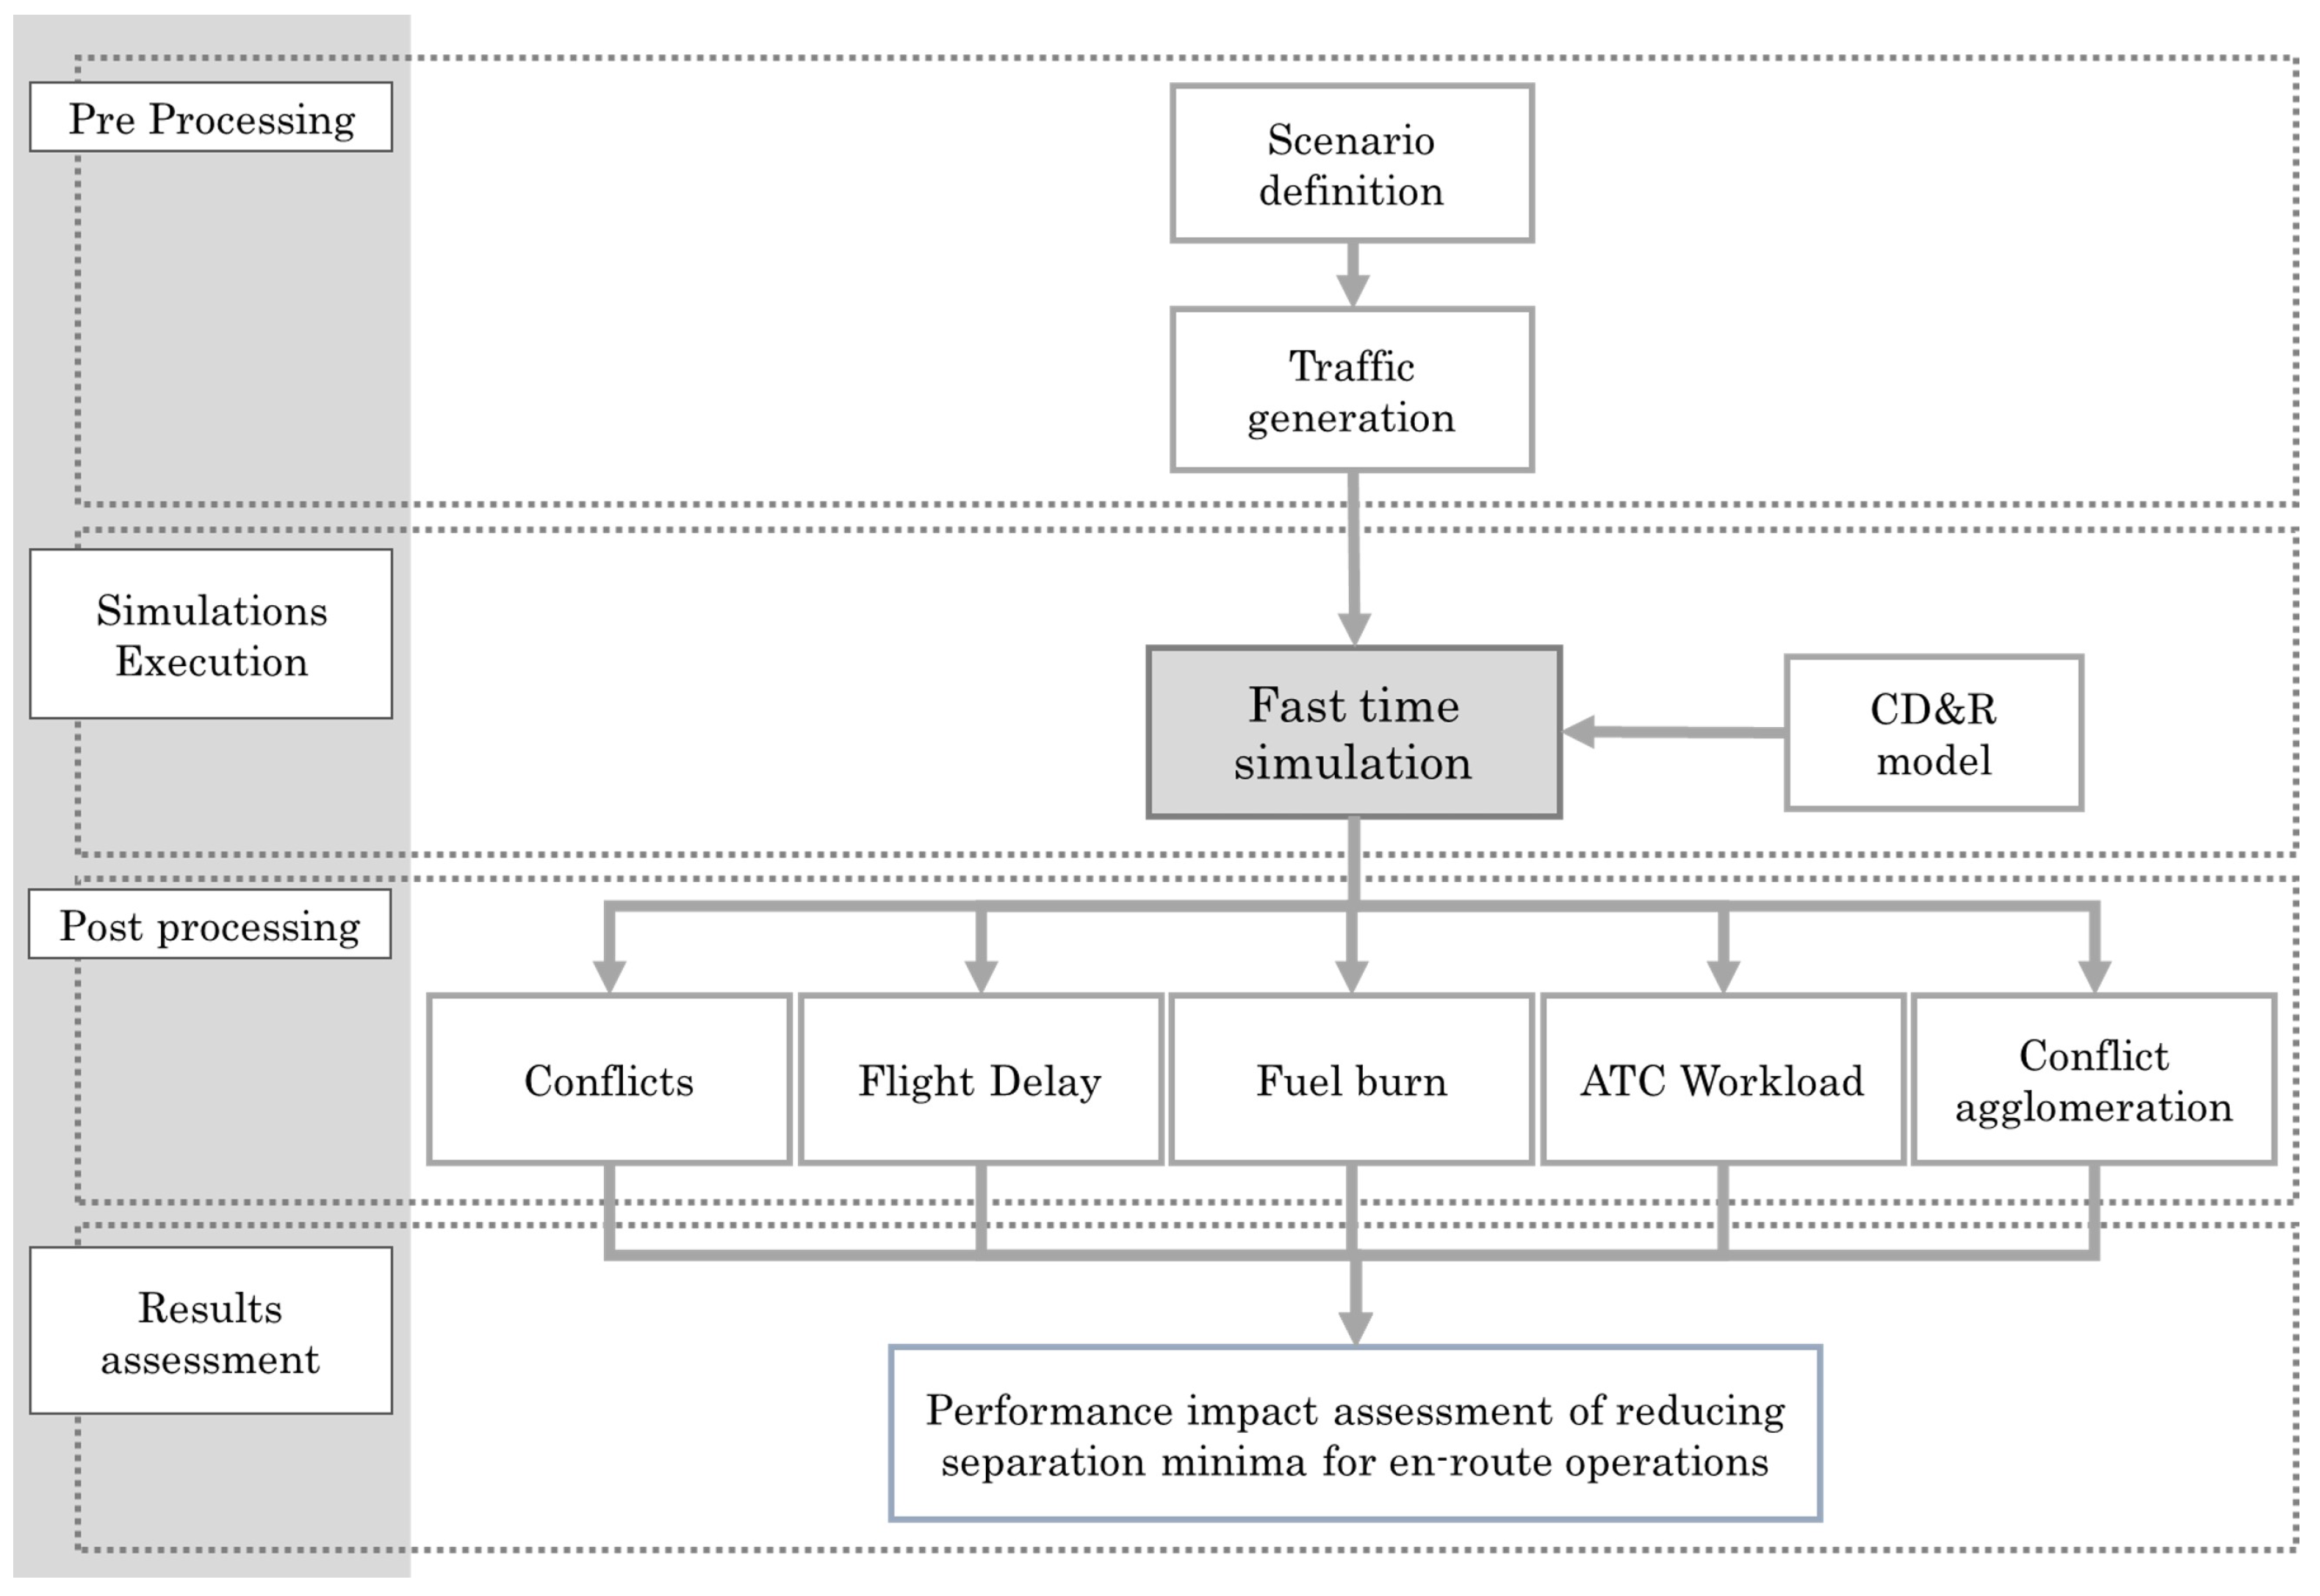
A general overview of all of the data processing is schematized in Figure 2. The process consists of four stages: pre-processing, simulation execution, post-processing and results assessment.
4.1. Pre-Processing Phase
The pre-processing phase comprises data collection and preparation activities. In particular, there are two different parts: scenario definition and traffic generation. The definition of scenarios is based on choosing a portion of the airspace for the analysis of the influence of the SM. Once the scenario definition is completed, traffic needs to be generated. The traffic data comes from the Eurocontrol DDR2 (Demand Data Repository) database. The database is made up of the information from the Network Manager. Real data from 2018 has been chosen, to prevent traffic bias due to the pandemic. The data correspond to the last filed flight plans from the airlines of those crossing the sector of interest in the period of the analysis. The exported database contains information on coordinates of departure and arrival airports, departure time, arrival time and waypoints. Aircraft performance data for every aircraft model come from BADA 3 (Base of aircraft data from Eurocontrol) [43].
From the time slot selected, exported data correspond to traffic a bit below the declared airspace capacity. This traffic will be called original traffic since some other scenarios will be created from these exported from DDR2.
The analysis of the SM reduction needs to bring the studied sector to its traffic saturation. Different scenarios have been generated on this basis, increasing the number of flights by 15%, 25%, 35% and 50% of the actual traffic. The traffic scenarios are developed by randomly duplicating trajectories from the original dataset and varying the entry times between zero, plus or minus ten minutes. Kindly note that the new traffic is created from cloning an original flight that is randomly chosen. Thus, new traffic will follow the exact route from the primitive traffic, but at a different entry time.The new entry time is restricted because no conflicts can be allocated at the entrance to the sector, i.e., the initial conditions no longer imply a conflict.
4.2. Simulation and Execution Phase: Fast-Time Simulation
The analysis of the influence of the SM on ATM performance is performed statistically using Monte Carlo Simulations to find patterns in a non-deterministic way. The total number of simulations is determined to ensure convergence, but might be different depending on the particular features of each use case. Simulations were run multiple times, varying the minimum separation distance that triggers a conflict and the traffic density for each scenario. RAMS Plus software has been used for running the simulations.
The software’s conflict detection and resolution (CD&R) model detects and resolves longitudinal, lateral, and vertical conflicts.
The conflict detection model uses a protected zone around each aircraft that moves over time with the flight. A cylindrical shape defines the protected zone, a 4D collision avoidance volume. The base of the cylinder is a circle with a centre in the aircraft and a radius of the lateral separation. The vertical separation is above and below the aircraft in the vertical direction. A spatial conflict is triggered when an aircraft violates the protected zone of another aircraft.
Trajectories are modified in a 4D manner to ensure a conflict-free environment, i.e., flight level, speed or course changes. If there is no interaction with other aircraft, they will match filed flight plan parameters over WPs (time, altitude, etc.)
4.3. Post-Processing Phase
The raw data generated in the fast-time simulations are analysed in the post-processing phase. Scripts in MATLAB® have been developed to filter and classify data and implement the appropriate formulas to calculate the metrics.
5. Use Case
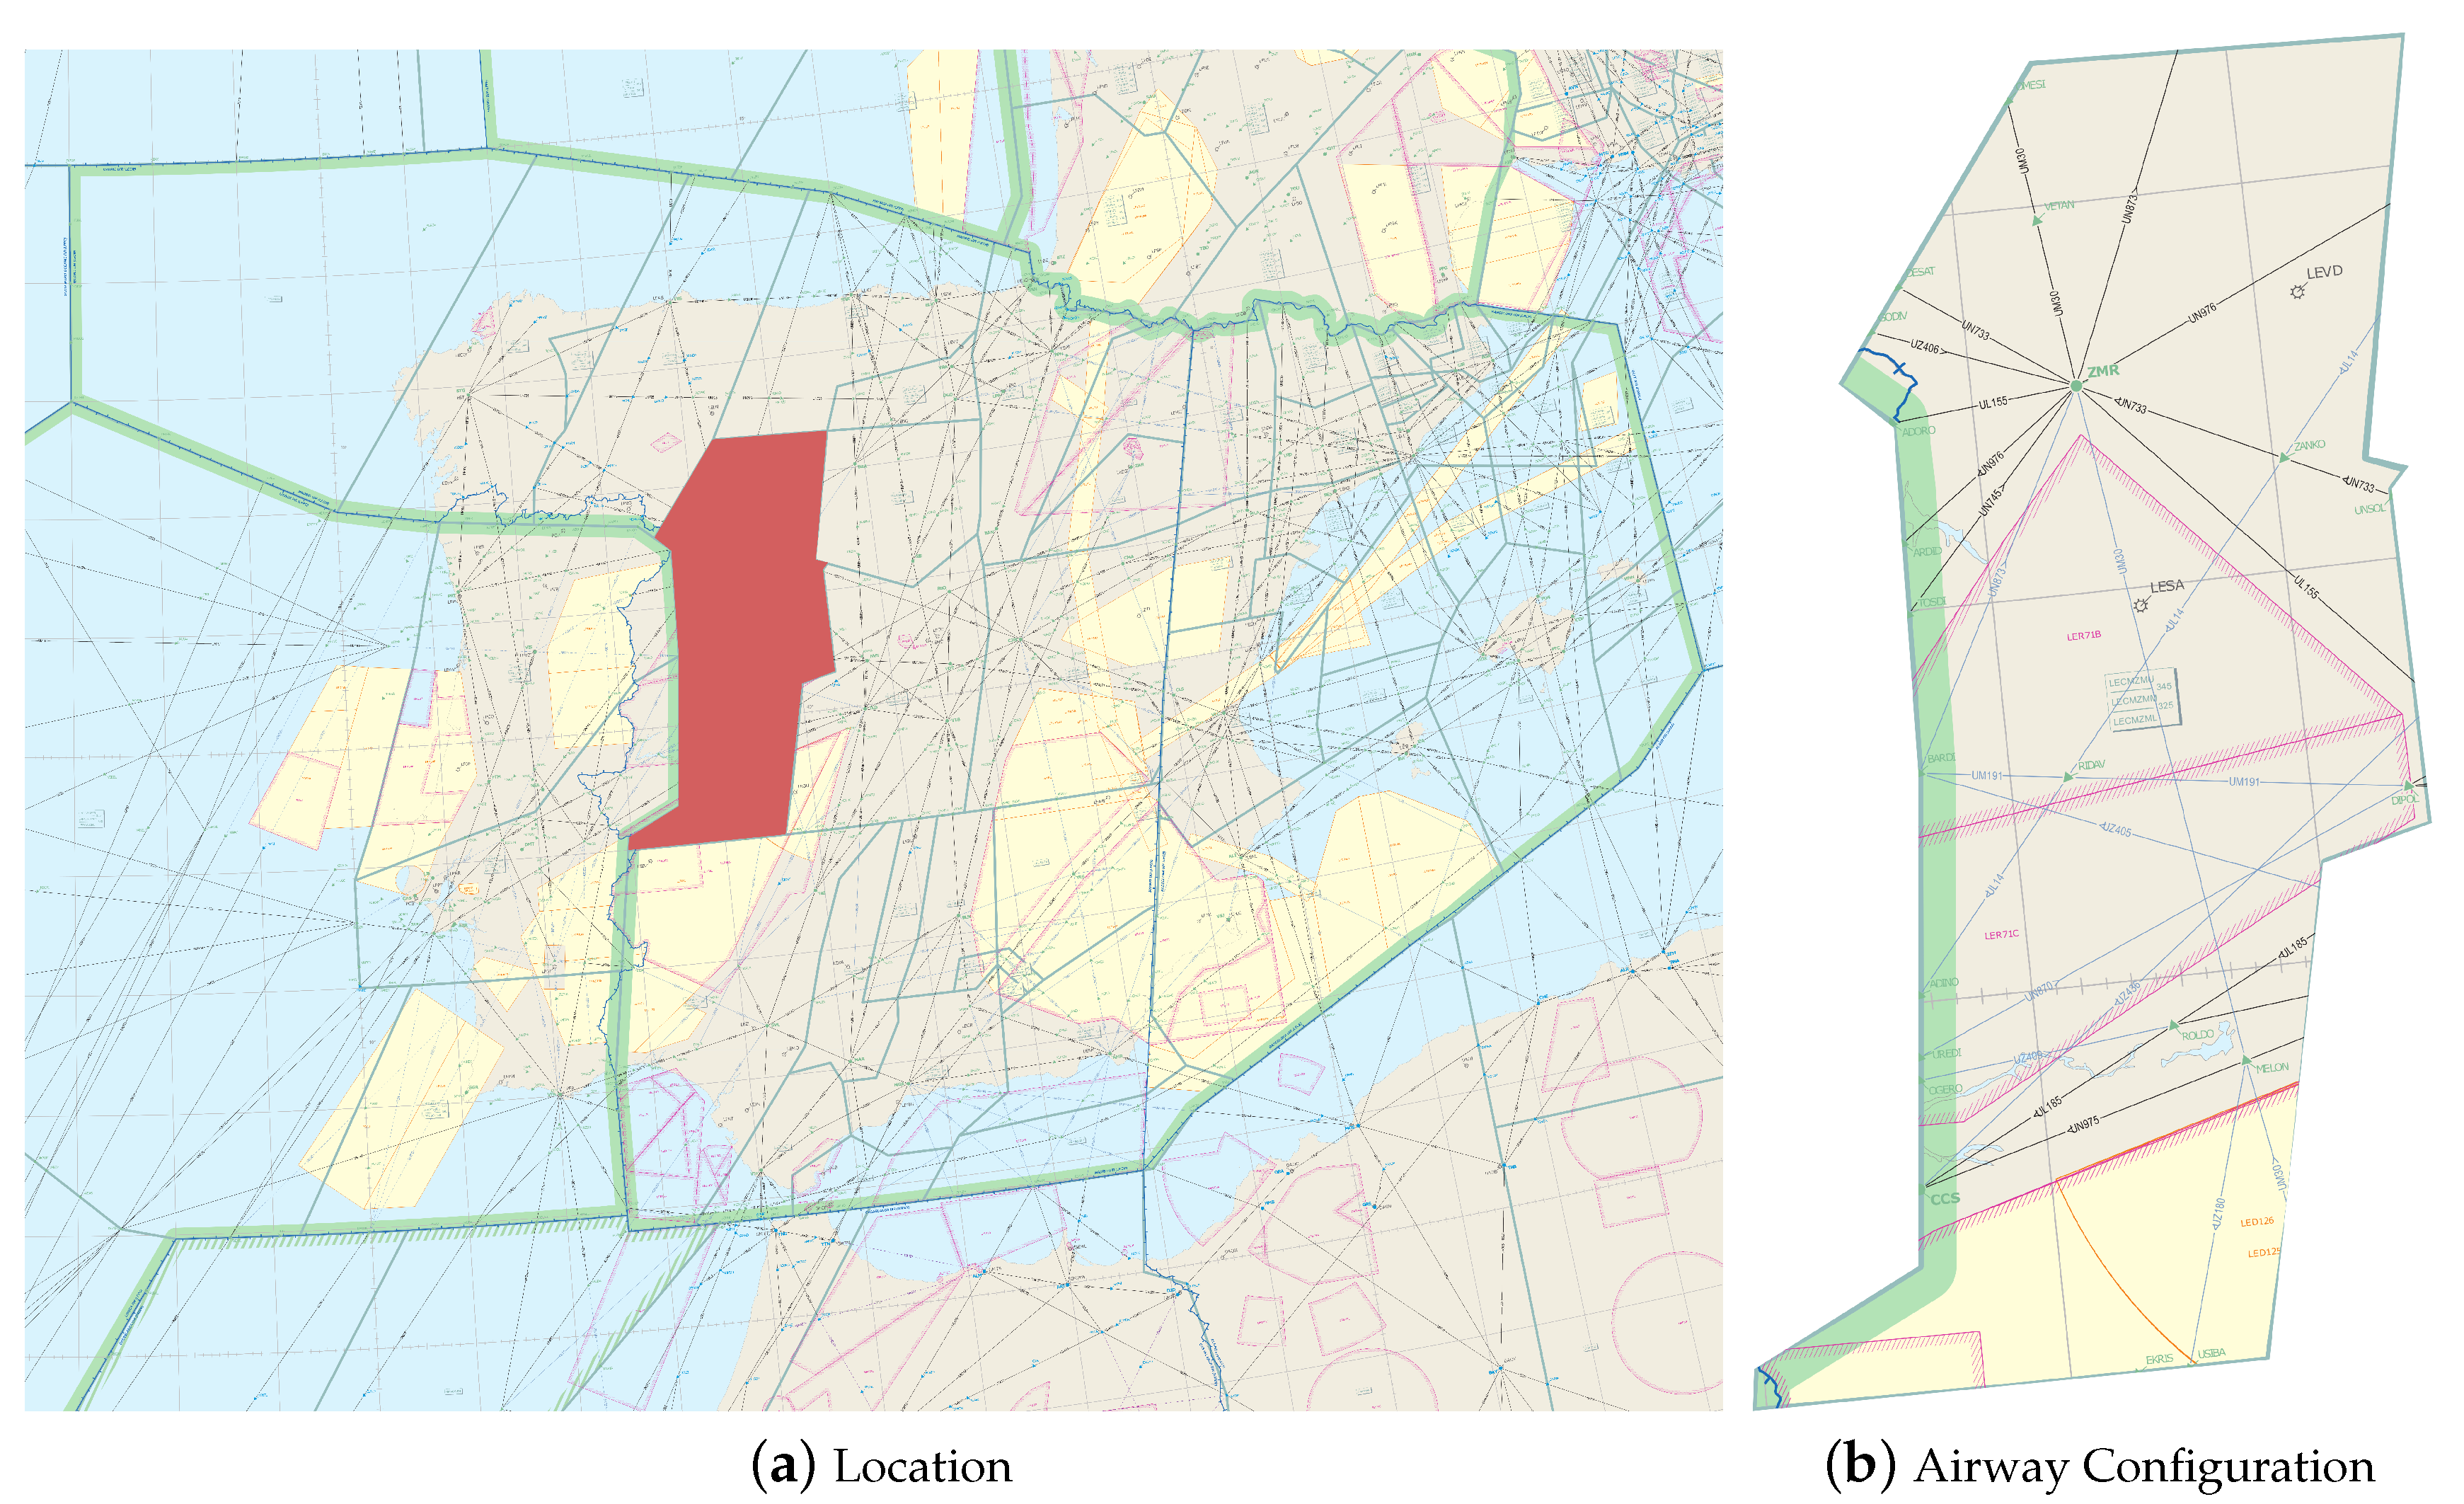
The Spanish airspace is selected to evaluate the effect of reducing the separation minima. Spain has three Flight Information Regions (FIRs): Madrid (LECM), Barcelona (LECB) and the Canary Islands (GCCC). Madrid FIR includes the delegated airspace to Seville (LECS). At the same time, Spanish airspace is composed of 43 en-route sectors (16 in LECM, 13 in LECB, 5 in GCCC and 9 in LECS). From all en-route sectors in the Spanish airspace, Zamora upper (LECMZMU) airspace is chosen to illustrate results further since it could act as representative in terms of traffic density, route structure and communication, navigation and surveillance capabilities. The upper and lower vertical limits for LECMZMU are FL460 and FL245, respectively. LECMZMU is located within the Madrid FIR/UIR, see Figure 3.
The period selected for the analysis follows the IATA airport forecasting program recommendation stated in the ICAO Doc 8891 [44] for determining typical day traffic, which says to choose the time slot of the peak hour of the second busiest day of the average week in the busiest month of the year. The reader must note that collected traffic is filtered by the routes that are crossing the sector of interest in the analysed periods. Therefore, the time slot selected is from 13 h to 14 h on the 7th of July 2018, where 47 flights were executed. Hence, traffic in the original scenario comprises 47 flights, 54 in the +15% scenario, 59 in the +25%, 63 in the +35% and the +50% will have 71 flights.
6. Results
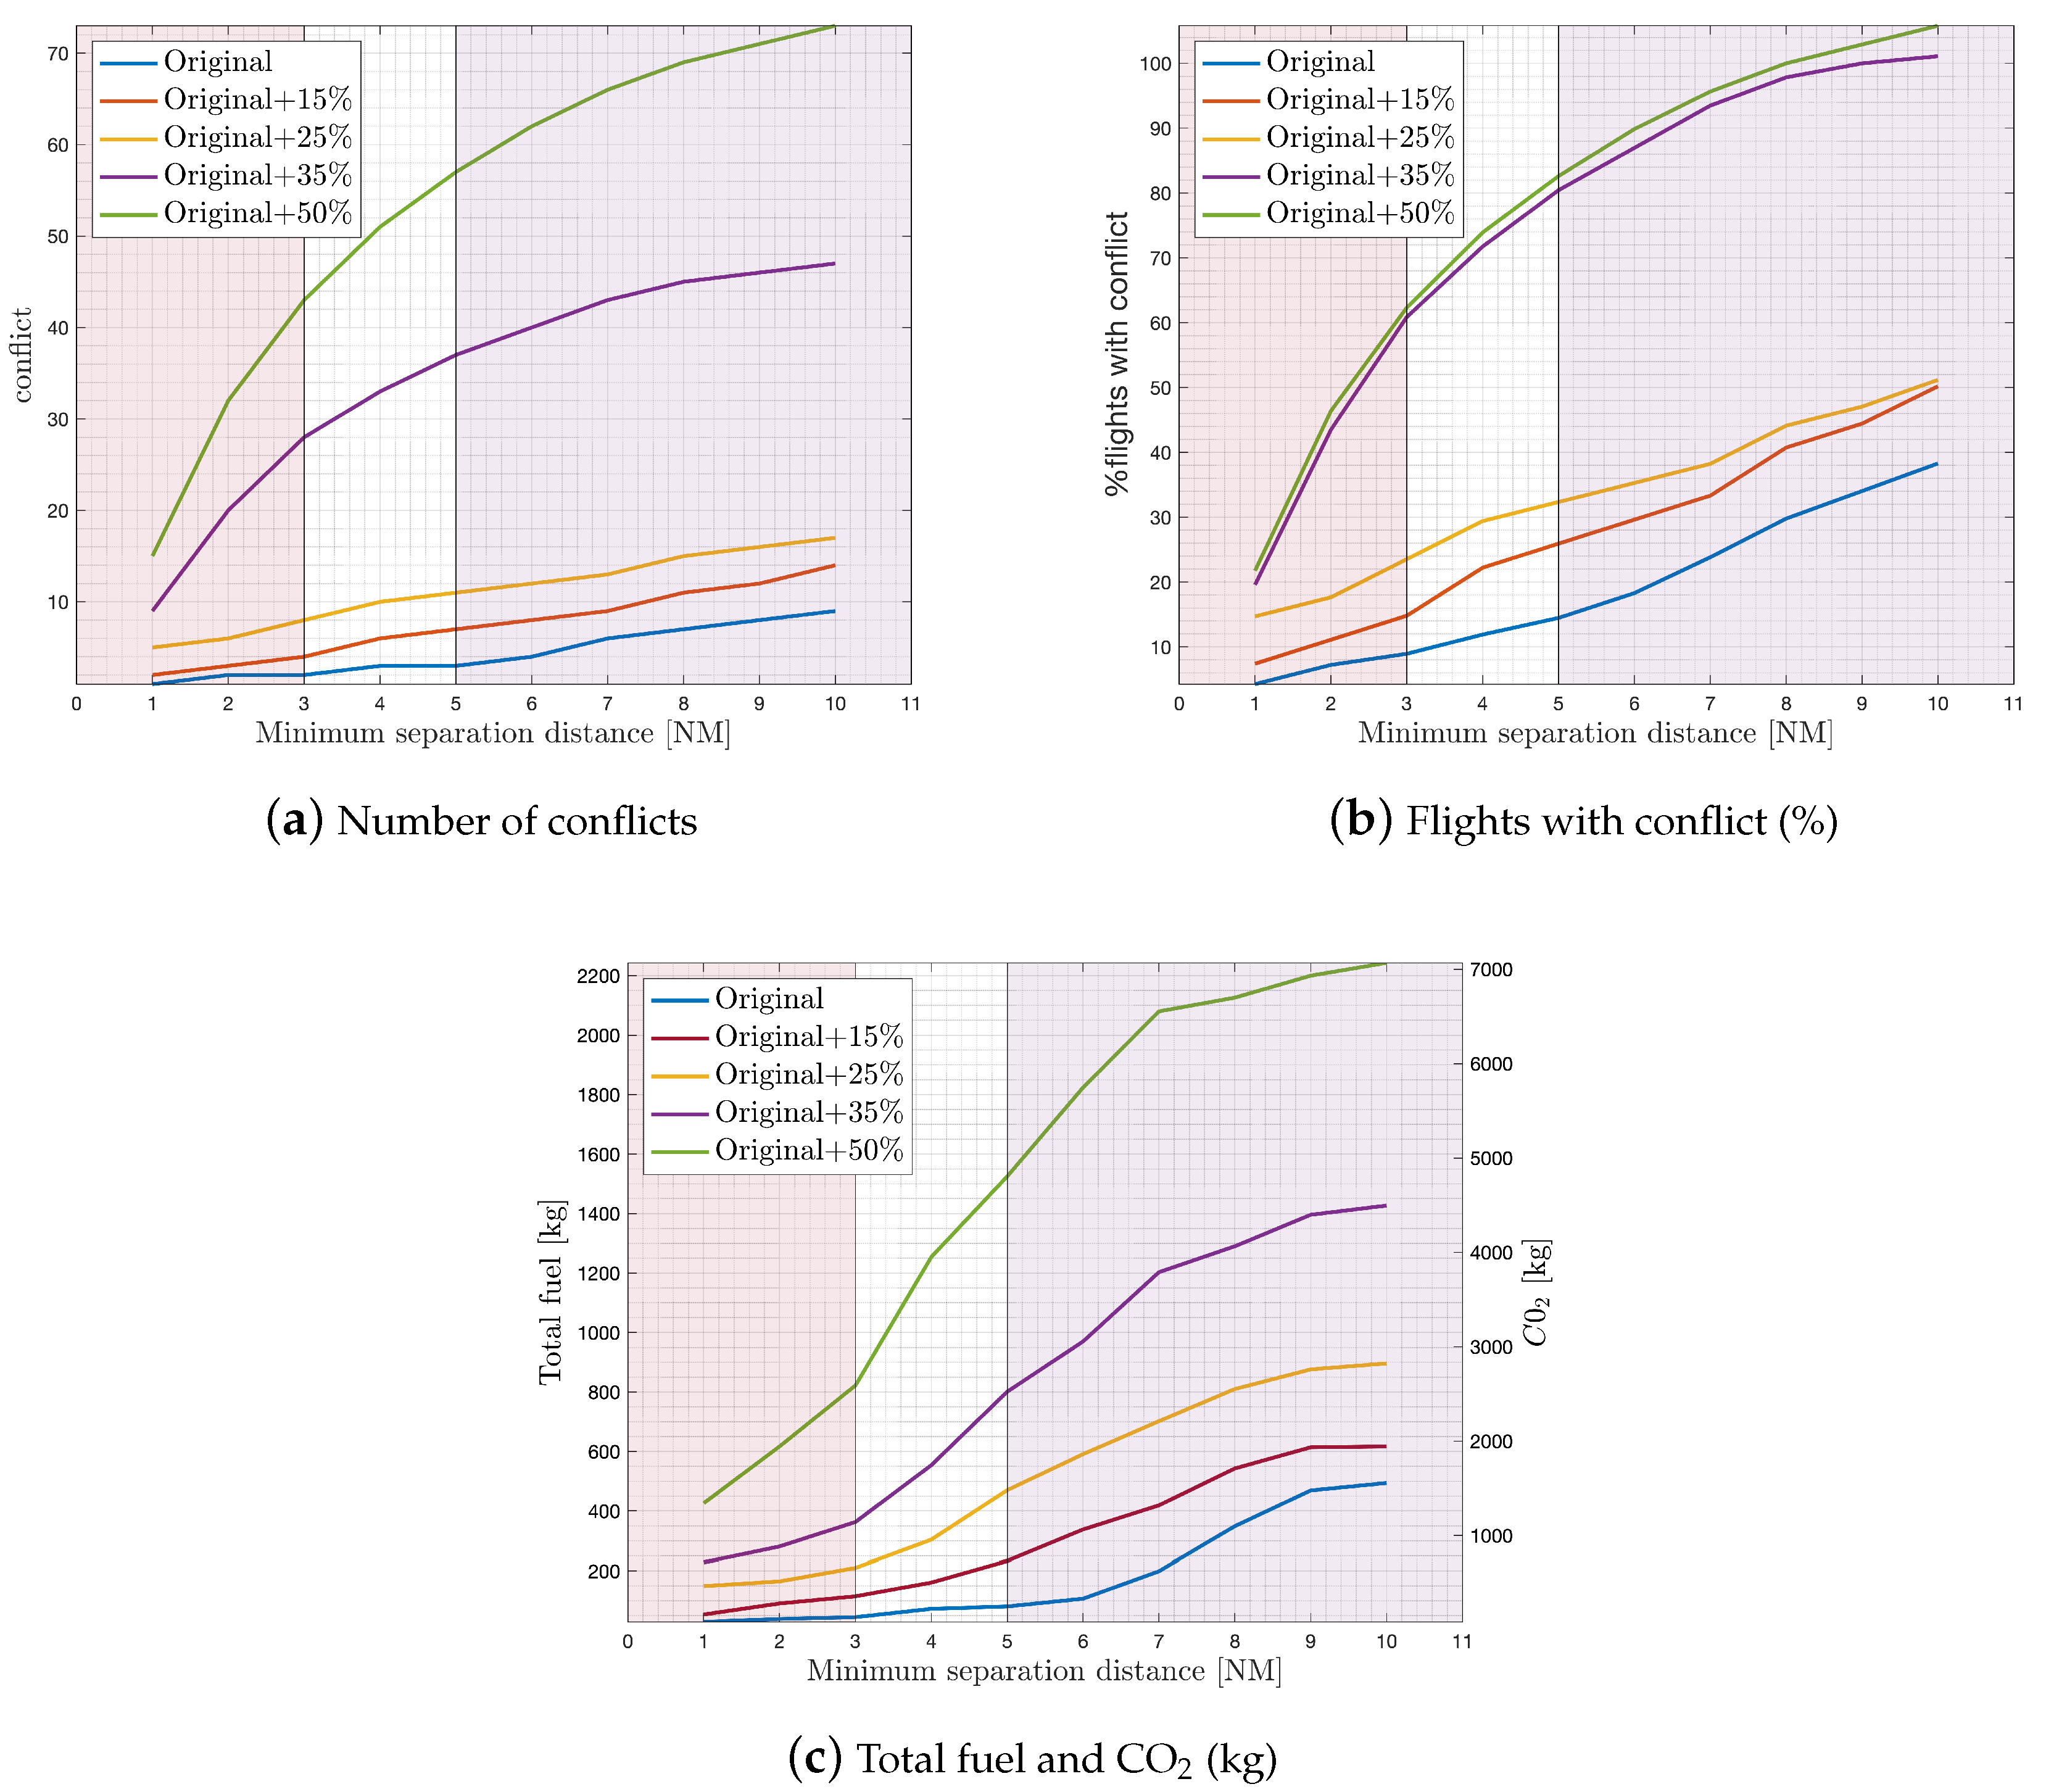
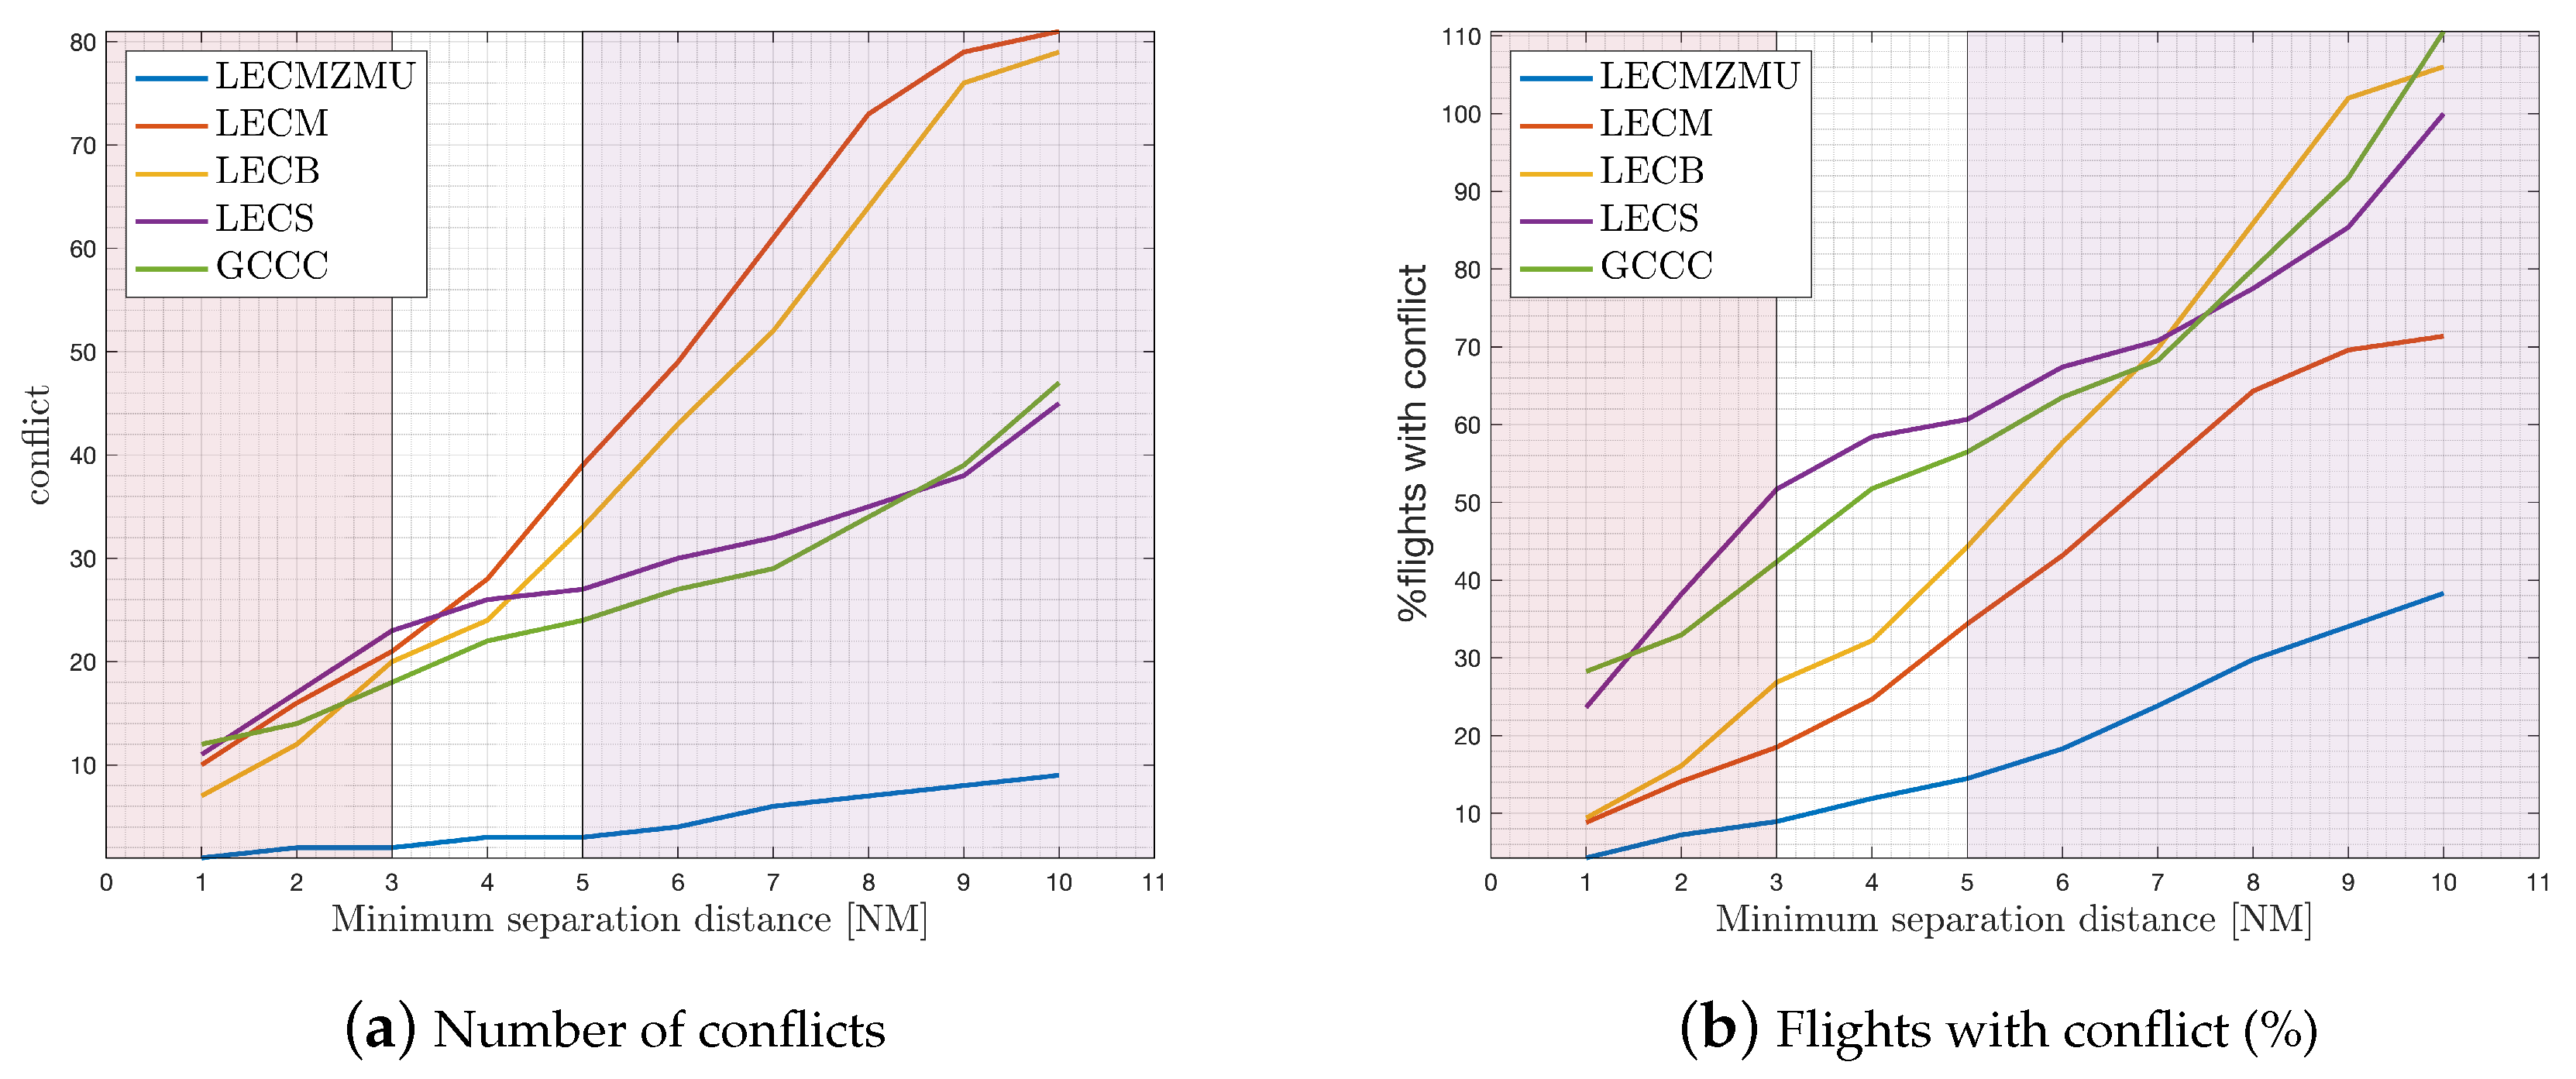
From a total of 1000 simulations over LECMZMU, the results show the values of the metrics that are presented below. It is relevant to highlight that the aircraft mix is 4.5% for heavy (H) aircraft (wake turbulence category) and 95.5% for medium (M) aircraft. Figure 4 shows the results obtained for the LECMZMU use case. Although the separation minima reduction studied is from 5 to 3 NM (no coloured area in the figures), the variation from 10 to 1 NM has been represented to better observe the trends.
Figure 4a,b show the behaviour of conflict in the different traffic scenarios. It can be observed that reducing the minimum separation distance results in a slight decrease in conflicts, which is more significant in high-traffic scenarios. Moreover, traffic greater than +25% presents a saturated sector where the number of conflicts is one order of magnitude higher than in the lower traffic scenarios.
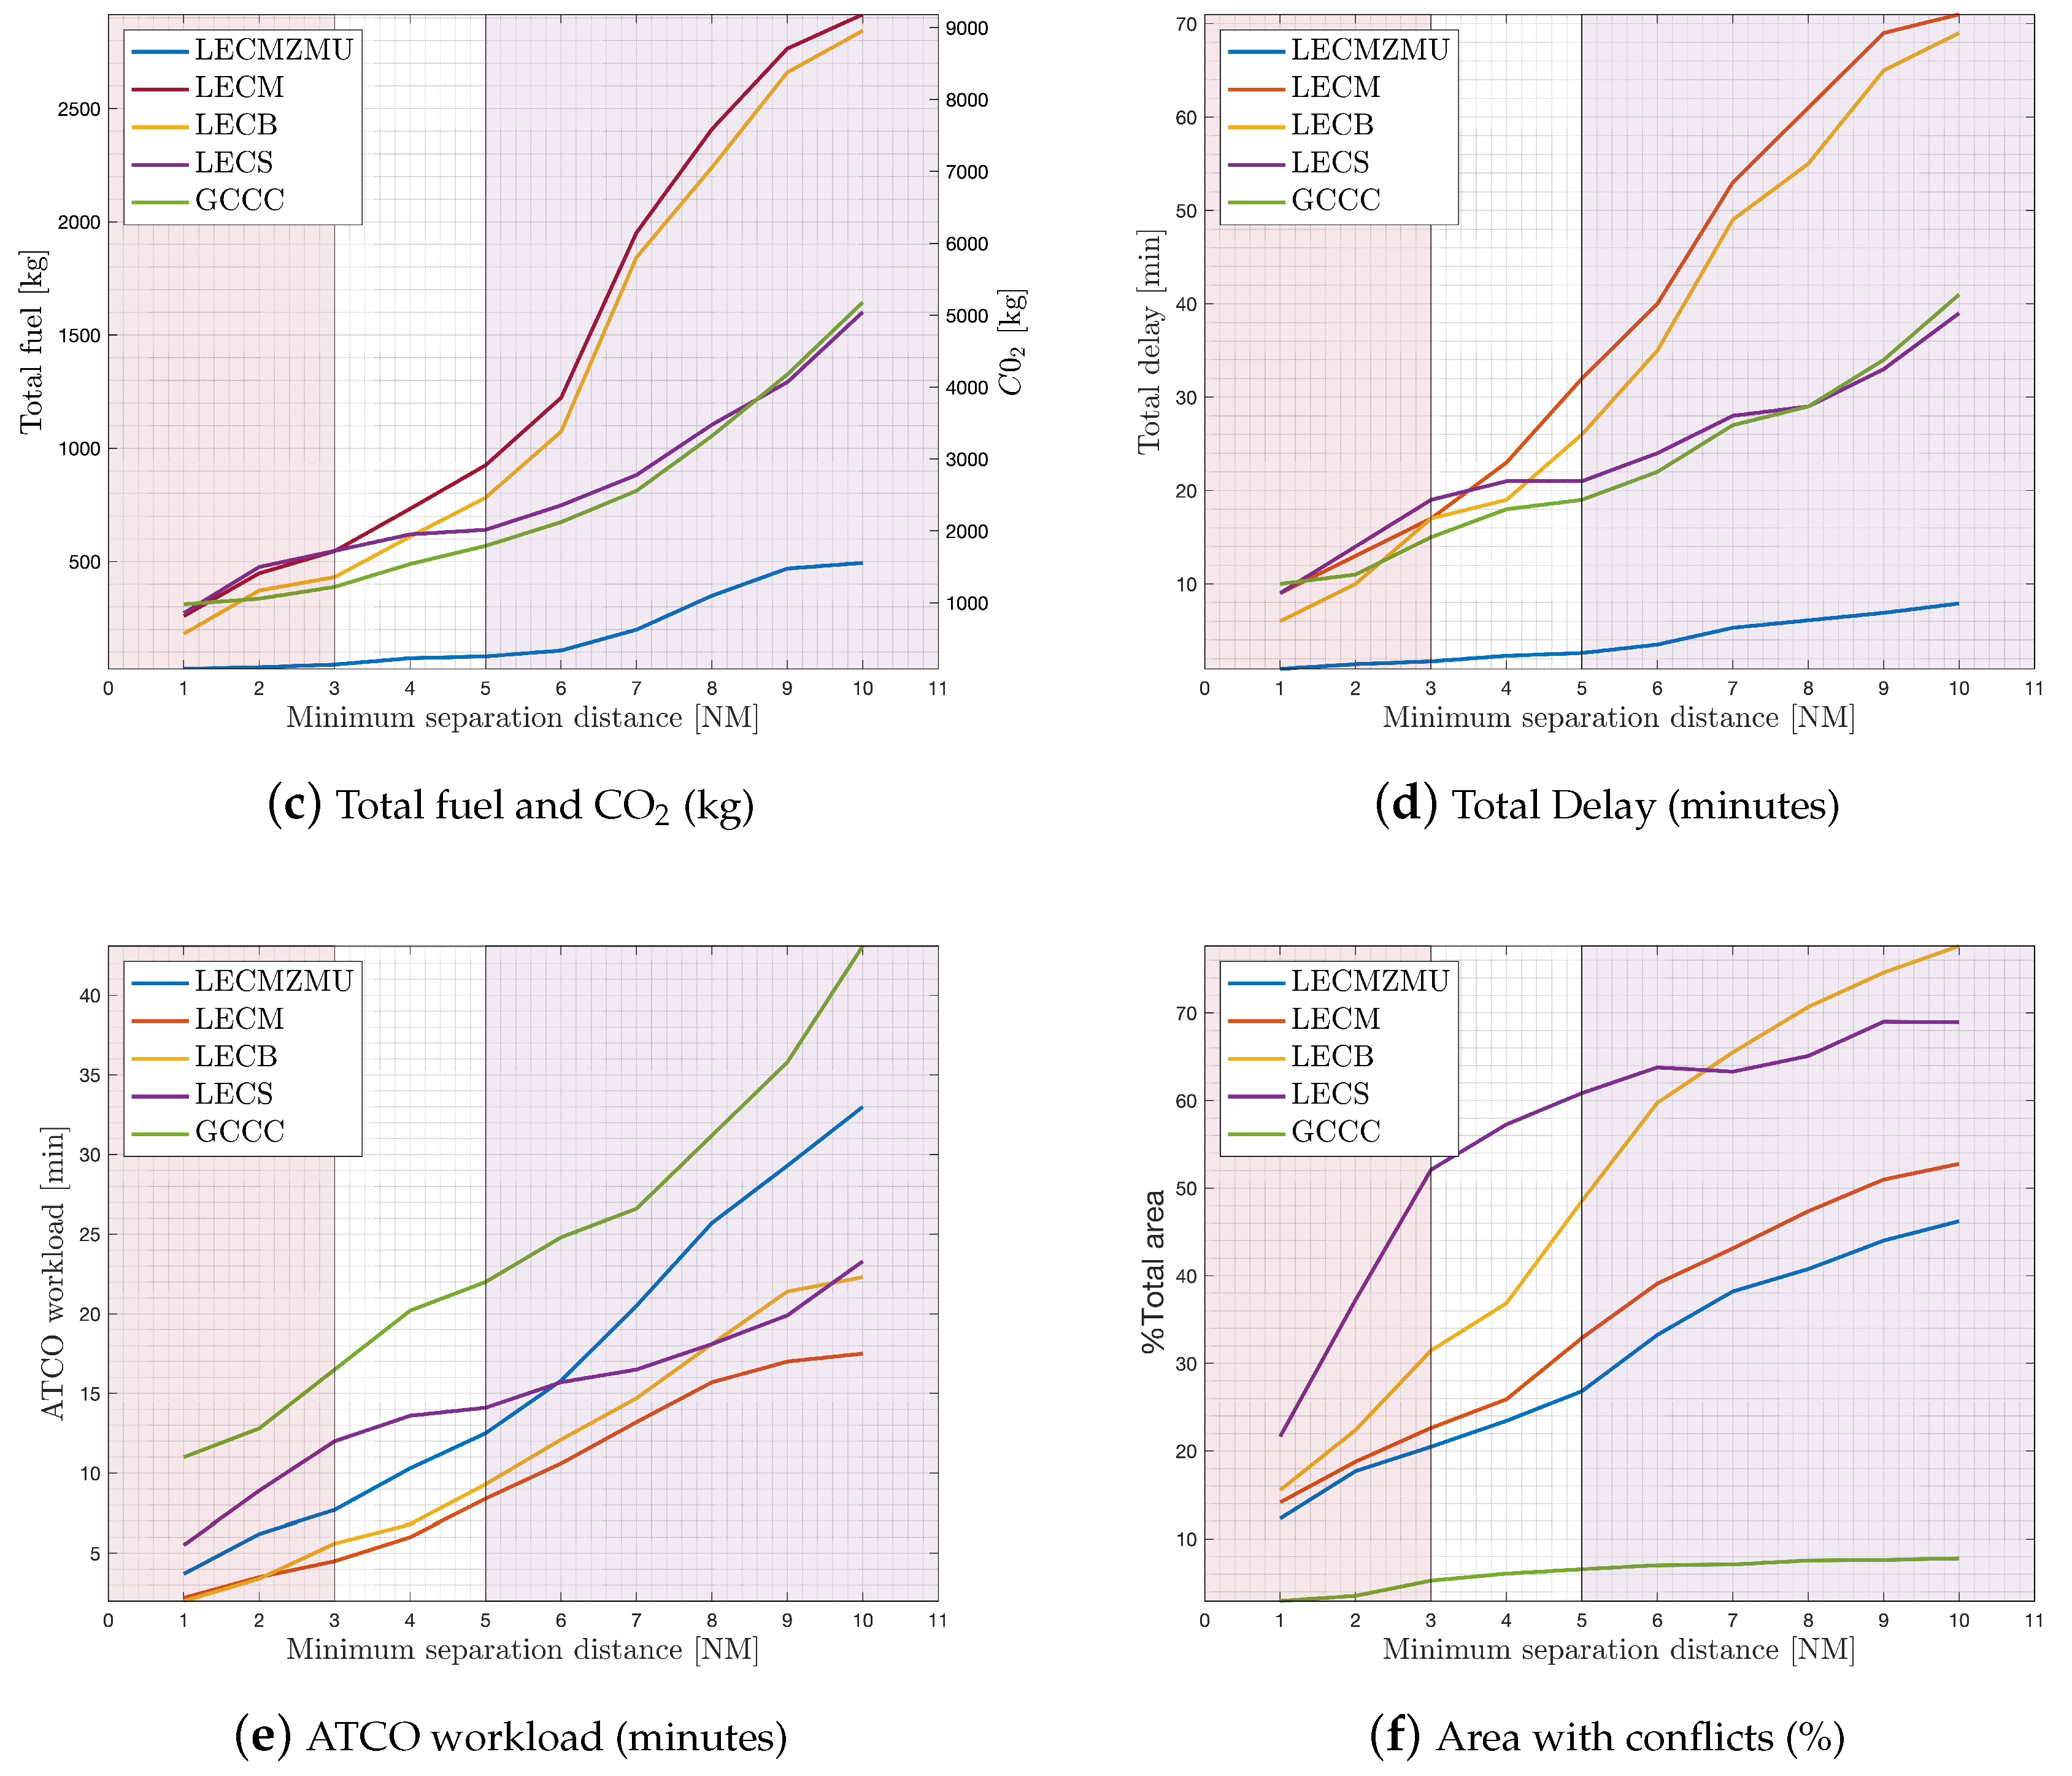
As regards the fuel burn indicators, higher fuel savings and lower CO emissions are presented while separation minima decreases (see Figure 4c). Besides, if traffic density grows, it becomes more relevant to use reduced separation minima.
In terms of total delay and ATCO workload, the results show similar tendencies to those in the conflicts analysis because those metrics are linked with the number of conflicts. Hence, traffic greater than +25% presents higher delays and ATCO workload than lower traffic. Also, a reduction in the separation minima implies positively decreasing the number of delays and ATCO workload (see Figure 4d,e. ATCO will manage fewer conflicts, thus devoting less time to CD&R and using it in other ATC activities, thereby increasing safety).
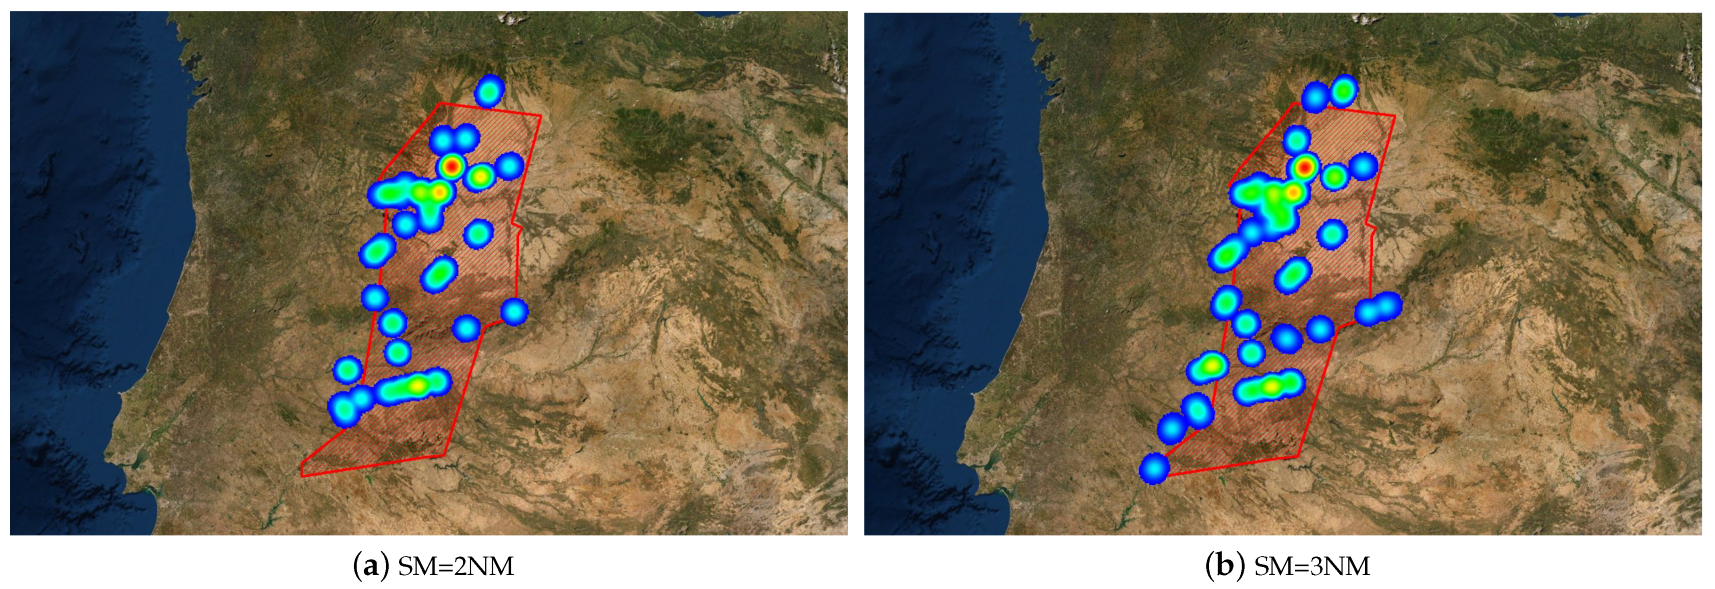
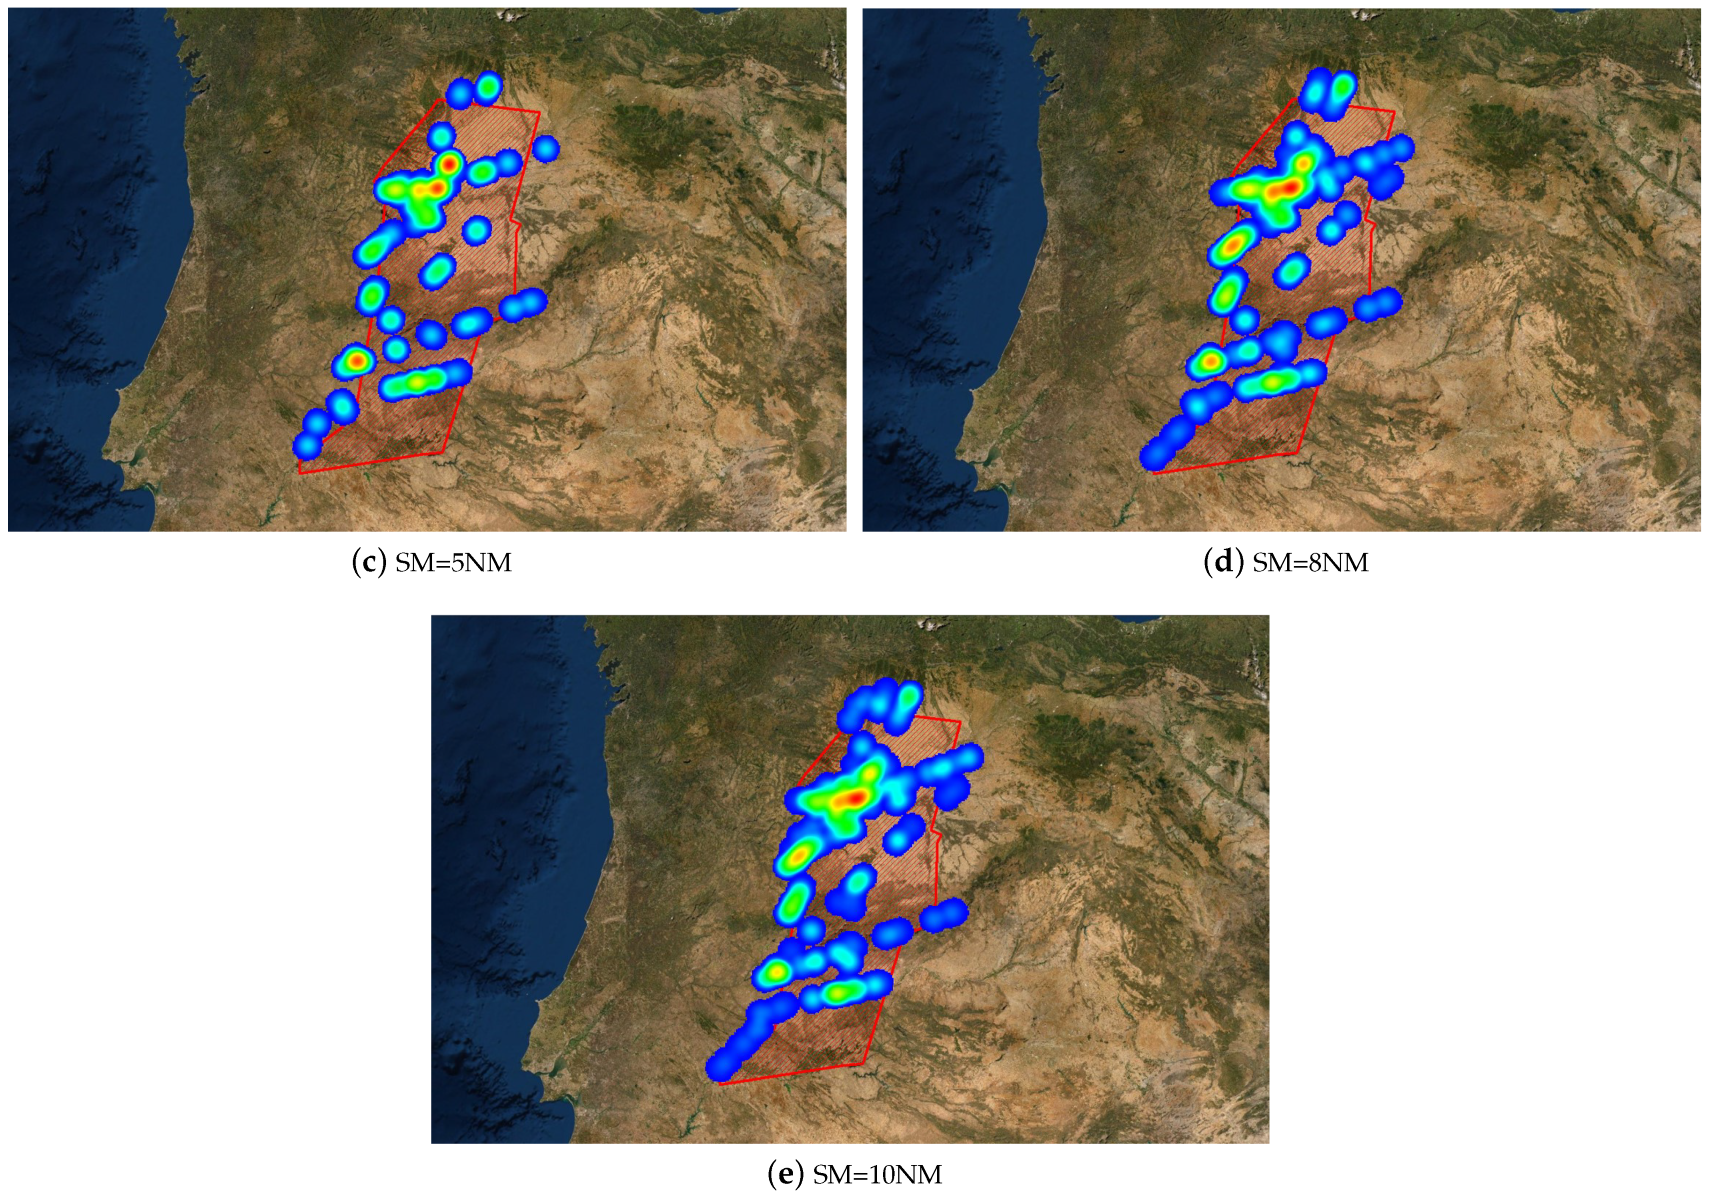
Figure 5 shows the distribution of conflict with separation minima. Route configuration determines conflict density distribution. Results show that the area where conflicts occur is larger with greater separation distances. No significant difference between the 3 and 5 NM maps is presented. The areas where the conflicts occur are very similar, although the accumulation of conflicts (red dots) is greater for 5 NM than when the separation minima are 3 NM.
As highlighted before, results corresponding to traffic higher than +25% of the original traffic seem excessive in the current operation concept. Comparing the other curves (original traffic, +15% and +25%), the results obtained for a separation minima of 5 NM and traffic +15% are equivalent to those of 3 NM with +25% traffic. These benefits would lead us to conclude that it is worth investing in reducing the minimum separation distance since similar metric values would be obtained with higher traffic.
Use case results are summarized in Table 2, which are grouped according to the KPIs defined in Section 3.
In contemplation of illustrating a generalisation of the results, LECMZMU is compared with FIRs in the Spanish airspace. The key figures of each airspace are presented in Table 3. It is essential to observe that the number of flights considered in this global analysis is much higher than the consideration for the LECMZMU use case. Still, it is in accordance with the number of tactical controllers working in each airspace and their total area.
Table 4 shows the values of the metrics for the LECMZMU use case and the Spanish FIRs. The results are computed as the difference between the results obtained for 5 NM minus results for 3 NM. Table 4 is calculated for the original traffic scenario, where the number of flights can be consulted in Table 3. The reader should note that the magnitude of the selected metrics varies significantly concerning the LECMZMU use case. Nevertheless, metrics maintain proportionality relations for the area of the scenario, number of flights or tactical controllers.
Figure 6 shows the results of the analysed metrics in the LECMZMU use case and the Spanish FIRs for different separation minima values. Note that, as before, only the original traffic scenario is presented. The evolution of the metrics on minimum separation distance in all scenarios follows similar trends, although the magnitudes and, therefore, the slopes of the graphs vary significantly among the considered use cases; this is because the differences among scenarios in terms of the number of the flight and its complexity are significant.
7. Conclusions
The ATC separation minima reduction has been a continuous trend since the beginning of air traffic control, which has made it possible to improve ATM performance, that is, to meet user expectations.
However, the reduction trend has not followed the logical process of demonstrating the benefits of a possible reduction and then developing operational procedures supported by technical means. Conversely, the improvement in the performance of the technical means has made it possible to create new operating procedures to reduce the separation minima once the non-degradation of safety has been demonstrated.
Once the minimum separation of 5 NM is reached, the feasibility of continuing to reduce that value is considered. There are again two approaches: improving technical means to define new operational procedures later (Bottom-Up) or determining the concept of operation to define later the technical means that support it (Top-Down). The Top-Down approach seems more convenient to meet user expectations without completely ruling out either of the two. Therefore, it would be necessary to start with the definition of the new concept of operation.
As the current separation minimum may be set almost at its limit, it is necessary to quantify the benefits expected from further reduction first. This paper quantifies the benefits that could be expected from such a reduction without considering the aspects of its feasibility. Benefits have been demonstrated in the performance areas of safety, capacity, efficiency and environment.
Starting from a base scenario considering real traffic in the sectors studied, simulations have been carried out in a fast time with the RAMS tool. Traffic has been theoretically increased by 15%, 25%, 35% and 50% of the original scenario, demonstrating higher benefits as the traffic increases. The simulations have been carried out in different control sectors, obtaining similar results in improvement trends, although not in their absolute values. These minor differences do not change the meaning of the potential benefit statement.
Additionally, this paper demonstrates that although the reduction of the en-route separation minima would offer benefits in those areas of performance, it may require a change in paradigm concerning ATC. Considering that separations of 3 or 4 NM would not always give enough time to avoid a collision once the separation minima have been lost. Hence, it would be necessary to migrate from the current use of a minimum separation distance to a sufficient time in advance concept to assess the needed time for the controller to intervene to prevent the collision.
This paper supports the need for research on the feasibility aspects of reducing the minimum separation, which may differ depending on the characteristics of the encounter, type of aircraft, speeds, encounter angle etc. Nevertheless, in the future of aircraft separation, it may not be necessary to speak of a separation minima as it is currently understood, but of the minimum time required for ATC to be able to act on an aircraft and for it to have time to resolve the collision.
Author Contributions
Conceptualization: M.P.M., J.G.-H. and L.P.S.; Methodology: M.P.M., J.G.-H. and L.P.S.; Software: M.P.M. and J.G.-H.; Validation: L.S.-M., J.A.P.-C. and L.P.S.; Formal analysis: M.P.M. and L.S.-M.; Data curation: M.P.M. and L.S.-M.; Writing—original draft preparation: M.P.M. and J.G.-H.; Writing—review and editing: L.P.S., J.A.P.-C. and L.S.-M.; Supervision: L.P.S. All authors have read and agreed to the published version of the manuscript.
Funding
This research received no external funding.
Data Availability Statement
The data presented in this study are available on request from the corresponding author. The data are not publicly available due to DDR2 files used in the study are not public.
Acknowledgments
This work would not have been possible without the support of ISA Software, which has granted us the license to use RAMS Plus. This tool has undoubtedly been a key element in obtaining reliable results.
Conflicts of Interest
The authors declare no conflict of interest.
References
- SESAR Joint Undertaking. European ATM Master Plan 2020 edition. Available online: https://www.atmmasterplan.eu/ (accessed on 12 September 2022).
- Eurocontrol. Performance Review Report (PRR) 2018. 2019. Available online: https://www.eurocontrol.int/publication/performance-review-report-prr-2018 (accessed on 20 November 2022).
- Eurocontrol. Performance Review Report (PRR) 2021. 2022. Available online: https://www.eurocontrol.int/publication/performance-review-report-prr-2021 (accessed on 20 November 2022).
- EASA; EEA; Eurocontrol. European Aviation Environmental Report 2019. Available online: https://www.easa.europa.eu/eaer/system/files/usr_uploaded/219473_EASA_EAER_2019_WEB_LOW-RES.pdf (accessed on 12 September 2022).
- International Civil Aviation Organization (ICAO). Annex 11: Air Traffic Services; ICAO: Montreal, QC, Canada, 2018. [Google Scholar]
- International Civil Aviation Organization (ICAO). Doc. 9854. Global Air Traffic Management Operational Concept; ICAO: Montreal, QC, Canada, 2005. [Google Scholar]
- Reich, P.G. A Theory of Safe Separation Standards for Air Traffic Control; RAE Technical Report No. 64041; Ministry of Aviation, Royal Aircraft Establishment: Farnborough, UK, 1964. [Google Scholar]
- Schmidt, D.K. On the conflict frequency at air route intersections. Transp. Res. 1977, 11, 351–355. [Google Scholar] [CrossRef]
- Hsu, D.A. The Evaluation of Aircraft Collision Probabilities at Intersecting Air Routes. J. Navig. 1981, 34, 78–102. [Google Scholar] [CrossRef]
- International Civil Aviation Organization (ICAO). Doc 9689. Manual on Airspace Planning Methodology for the Determination of Separation Minima; ICAO: Montreal, QC, Canada, 1998. [Google Scholar]
- International Civil Aviation Organization (ICAO). A Unified Framework for Collision Risk Modelling in Support of the Manual on Airspace Planning Methodology for the Determination of Separation Minima (Doc 9689); ICAO: Montreal, QC, Canada, 2009. [Google Scholar]
- Machol, R.E. Thirty Years of Modeling Midair Collisions. Interfaces 1995, 25, 151–172. [Google Scholar] [CrossRef]
- Serrano-Mira, L.; Pérez Maroto, M.; Ayra, E.S.; Pérez-Castán, J.A.; Liang-Cheng, S.Z.Y.; Gordo Arias, V.; Pérez-Sanz, L. Identification and Quantification of Contributing Factors to the Criticality of Aircraft Loss of Separation. Aerospace 2022, 9, 513. [Google Scholar] [CrossRef]
- Siddiqee, W. A Mathematical Model for Predicting the Number of Potential Conflict Situations at Intersecting Air Routes. Transp. Sci. 1973, 7, 158–167. [Google Scholar] [CrossRef]
- Geisinger, K.E. Airspace Conflict Equations. Transp. Sci. 1985, 19, 139–153. [Google Scholar] [CrossRef]
- Bakker, G.J.; Kremer, H.J.; Blom, H.A.P. Geometric and Probabilistic Approaches towards Conflict Prediction; NLR Technical Publication TP 2001-627; Nationaal Lucht- en Ruimtevaartlaboratorium: Amsterdam, The Netherlands, 2001. [Google Scholar]
- Blom, H.A.P.; Bakker, G.J. Conflict probability and incrossing probability in air traffic management. In Proceedings of the 41st IEEE Conference on Decision and Control, Las Vegas, NV, USA, 10–13 December 2002; Volume 3, pp. 2421–2426. [Google Scholar]
- Irvine, R. A Geometrical Approach to Conflict Probability Estimation. Air Traffic Control. Q. 2002, 10, 85–113. [Google Scholar] [CrossRef]
- Paielli, R.A.; Erzberger, H. Conflict Probability Estimation Generalized to Non-Level Flight. Air Traffic Control. Q. 1999, 7, 195–222. [Google Scholar] [CrossRef]
- Reynolds, T.G.; Hansman, R.J. Analysis of Separation Minima Using A Surveillance State Vector Approach. In Proceedings of the USA/FAA Air Traffic Management R&D Seminar 2000, Napoli, Italy, 13–16 June 2000. [Google Scholar]
- Alam, S.; Shafi, K.; Abbass, H.A.; Barlow, M. An ensemble approach for conflict detection in Free Flight by data mining. Transp. Res. Part C Emerg. Technol. 2009, 17, 298–317. [Google Scholar] [CrossRef]
- Netjasov, F.; Babić, O. Framework for airspace planning and design based on conflict risk assessment: Part 3: Conflict risk assessment model for airspace operational and current day planning. Transp. Res. Part C Emerg. Technol. 2013, 32, 31–47. [Google Scholar] [CrossRef]
- Wang, Z.; Liang, M.; Delahaye, D.; Wu, W. Learning Real Trajectory Data to Enhance Conflict Detection Accuracy in Closest Point of Approach. In Proceedings of the ATM 2019, 13th USA/Europe Air Traffic Management Research and Development Seminar, Vienna, Austria, 17–21 June 2019. [Google Scholar]
- Pérez-Castán, J.A.; Pérez-Sanz, L.; Serrano-Mira, L.; Saéz-Hernando, F.J.; Rodríguez Gauxachs, I.; Gómez-Comendador, V.F. Design of an ATC Tool for Conflict Detection Based on Machine Learning Techniques. Aerospace 2022, 9, 67. [Google Scholar] [CrossRef]
- Xu, X.; Rantanen, E.M. Effects of Air Traffic Geometry on Pilots’ Conflict Detection With Cockpit Display of Traffic Information. Hum. Factors 2007, 49, 358–375. [Google Scholar] [CrossRef] [PubMed]
- Sun, R.; Chen, Y.; Liu, X.; Peng, T.; Liu, L. A Method of Analysis Integrating HCR and ETA Modeling for Determining Risks Associated with Inadequate Flight Separation Events. Purdue e-Pubs 2011, 1, 5. [Google Scholar] [CrossRef]
- Cafieri, S.; Durand, N. Aircraft deconfliction with speed regulation: New models from mixed-integer optimization. J. Glob. Optim. 2014, 58, 613–629. [Google Scholar] [CrossRef] [Green Version]
- Cafieri, S.; Omheni, R. Mixed-integer nonlinear programming for aircraft conflict avoidance by sequentially applying velocity and heading angle changes. Eur. J. Oper. Res. 2017, 260, 283–290. [Google Scholar] [CrossRef] [Green Version]
- Vasyliev, V.; Vasyliev, D. Cooperative Decision Making Under Air Traffic Conflicts Detection and Resolution. In Handbook of Research on Artificial Intelligence Applications in the Aviation and Aerospace Industries; IGI Global: Hershey, PA, USA, 2020; pp. 91–133. [Google Scholar] [CrossRef]
- Dunlay, W.J. Analytical Models of Perceived Air Traffic Control Conflicts. Transp. Sci. 1975, 9, 149–164. [Google Scholar] [CrossRef]
- Zhuoxi, S.; Yangzhou, C.; Zhenlong, L.; Defu, Z.; Hong, B. A review for workload measurement of air traffic controller based on air traffic complexity. In Proceedings of the 2013 25th Chinese Control and Decision Conference (CCDC), Guiyang, China, 25–27 May 2013; pp. 2107–2112. [Google Scholar] [CrossRef]
- Rockman, M.J. A Review of the Current Radar Separation Minima and Some Thoughts on Reducing Them; MITRE Corporation: McLean, VA, USA, 1994; Volume 29. [Google Scholar]
- Porras, J.F.; Parra, M. Atm initiatives on reduced separation minima. In Proceedings of the 2007 IEEE/AIAA 26th Digital Avionics Systems Conference, Dallas, TX, USA, 21–25 October 2007; pp. 3.C.4-1–3.C.4-12. [Google Scholar] [CrossRef]
- Zografos, K.; Tsanos, C. Establishing Criteria and Priorities for Assessing the Impact of Reduced Separation Minima on Air Traffic Management. In Proceedings of the 4th International Congress on Transport Research in Greece, Athens, Greece, 28–30 May 2008. [Google Scholar]
- Brooker, P. Air Traffic Control Separation Minima: Part 1—The Current Stasis. J. Navig. 2011, 64, 449–465. [Google Scholar] [CrossRef]
- Itoh, E.; Mitici, M. Evaluating the impact of new aircraft separation minima on available airspace capacity and arrival time delay. Aeronaut. J. 2020, 124, 447–471. [Google Scholar] [CrossRef] [Green Version]
- International Civil Aviation Organization (ICAO). Doc 4444. Air Traffic Management; ICAO: Montreal, QC, Canada, 2016. [Google Scholar]
- International Civil Aviation Organization (ICAO). Doc 9426. Air Traffic Services Planning Manual; ICAO: Montreal, QC, Canada, 1995. [Google Scholar]
- International Civil Aviation Organization (ICAO). Doc 9613. Performance-Based Navigation (PBN) Manual; ICAO: Montreal, QC, Canada, 2013. [Google Scholar]
- García-Heras, J.; Soler, M.; González-Arribas, D.; Eschbacher, K.; Rokitansky, C.H.; Sacher, D.; Gelhardt, U.; Lang, J.; Hauf, T.; Simarro, J.; et al. Robust flight planning impact assessment considering convective phenomena. Transp. Res. Part C Emerg. Technol. 2021, 123, 102968. [Google Scholar] [CrossRef]
- SESAR. SESAR Environment Assessment Process. PJ16.06.03. 2019. Available online: https://www.sesarju.eu/sites/default/files/documents/transversal/SESAR%202020%20-%20Environment%20Impact%20Assessment%20Guidance.pdf (accessed on 12 September 2022).
- Eurocontrol. Pessimistic Sector Capacity Estimation. 2003. Available online: https://www.eurocontrol.int/node/9925 (accessed on 12 September 2022).
- Nuic, A. User Manual for the Base of Aircraft Data (BADA) rev 3.11. Atmosphere 2010, 2010, 001. [Google Scholar]
- International Civil Aviation Organization (ICAO). Doc. 8991: Manual on Air Traffic Forecasting; ICAO: Montreal, QC, Canada, 2006. [Google Scholar]
Figure 1.
KPAs, KPIs and metrics.

Figure 2.
Methodology workflow.

Figure 3.
LECMZMU sector—Zamora use case.

Figure 4.
Results for LECMZMU sector—Zamora use case.


Figure 5.
Hotspot local scenario analysis: LECMZMU.


Figure 6.
Results for every use case.


Table 1.
ATCO Workload results from the experts’ consensus.
| Task | Time [s] |
|---|---|
| Detection | 30–40 |
| Resolution identification | 45–60 |
| Resolution manoeuvre communication | VNAV↑: 30–40, VNAV↓: 30, LNAV: 30 |
| Resolution implementation | VNAV: 30–40, LNAV: 30 |
| Navigation resuming | 30 |
Table 2.
Results summarised for the reduction of the SM from 5 NM to 3 NM. Conclusions are relative to the metric outcomes; the ⇓ indicates that the metric value decreases.
Table 2.
Results summarised for the reduction of the SM from 5 NM to 3 NM. Conclusions are relative to the metric outcomes; the ⇓ indicates that the metric value decreases.
| KPI | KPA Involved | Metric | Conclusions | Reference |
|---|---|---|---|---|
| Conflicts | Safety | Number of conflicts Flight with conflict (%) | ⇓ | Figure 4a Figure 4b |
| Fuel burn | Efficiency + Environment | Total fuel (kg) Total CO2 (kg) | ⇓ | Figure 4c |
| Flight delay | Efficiency | Total Flight delay (min) | ⇓ | Figure 4d |
| ATCO Workload | Capacity + Efficiency + Safety | ATCO Workload (min) | ⇓ | Figure 4e |
| Conflict agglomeration | Safety | Total Area with conflict (%) | ⇓ | Figure 5 |
Table 3.
Scenario data for 1-h simulation.
| Zamora (LECMZMU) | Madrid (LECM) | Barcelona (LECB) | Sevilla (LECS) | Canarias (GCCC) | |
|---|---|---|---|---|---|
| Number of flights | 47 | 227 | 149 | 89 | 85 |
| Number of ATCO (Tactical) | 1 | 17 | 13 | 7 | 4 |
| Sector Area (square km) | 48,000 | 439,000 | 270,000 | 172,000 | 1,413,000 |
Table 4.
Relative results from a reduction in the separation minima from 5 NM to 3 NM in the original traffic scenario.
Table 4.
Relative results from a reduction in the separation minima from 5 NM to 3 NM in the original traffic scenario.
| Zamora (LECMZMU) | Madrid (LECM) | Barcelona (LECB) | Sevilla (LECS) | Canarias (GCCC) | |
|---|---|---|---|---|---|
| Number of Conflicts | 1 | 18 | 13 | 4 | 6 |
| Flights with conflict (%) | 6 | 16 | 17 | 9 | 14 |
| Total fuel saved (kg) | 35 | 379 | 351 | 93 | 181 |
| Total fuel saved (kg/flight) | 0.75 | 1.67 | 2.36 | 1.04 | 2.12 |
| Total CO2 reduction (kg) | 111 | 1193 | 1107 | 293 | 570 |
| Total CO2 reduction (kg/flight) | 2.34 | 5.26 | 7.42 | 3.29 | 6.71 |
| Total Flight delay (min) | 0.9 | 14.5 | 9.1 | 1.9 | 3.7 |
| ATCO Workload (min) | 5 | 4 | 4 | 2 | 6 |
| Total Area with conflict (%) | 6 | 10 | 17 | 9 | 1 |
Publisher’s Note: MDPI stays neutral with regard to jurisdictional claims in published maps and institutional affiliations. |
© 2022 by the authors. Licensee MDPI, Basel, Switzerland. This article is an open access article distributed under the terms and conditions of the Creative Commons Attribution (CC BY) license (https://creativecommons.org/licenses/by/4.0/).
Share and Cite
MDPI and ACS Style
Pérez Maroto, M.; García-Heras, J.; Pérez Sanz, L.; Serrano-Mira, L.; Pérez-Castán, J.A. Performance Impact Assessment of Reducing Separation Minima for En-Route Operations. Aerospace 2022, 9, 772. https://doi.org/10.3390/aerospace9120772
AMA Style
Pérez Maroto M, García-Heras J, Pérez Sanz L, Serrano-Mira L, Pérez-Castán JA. Performance Impact Assessment of Reducing Separation Minima for En-Route Operations. Aerospace. 2022; 9(12):772. https://doi.org/10.3390/aerospace9120772
Chicago/Turabian StylePérez Maroto, Marta, Javier García-Heras, Luis Pérez Sanz, Lidia Serrano-Mira, and Javier Alberto Pérez-Castán. 2022. "Performance Impact Assessment of Reducing Separation Minima for En-Route Operations" Aerospace 9, no. 12: 772. https://doi.org/10.3390/aerospace9120772
Note that from the first issue of 2016, this journal uses article numbers instead of page numbers. See further details here.